
The Relationship between the Immigrant Rate and Health Status in the General Population in France


Abstract
:1. Introduction
2. Methods
2.1. Data Collection
2.2. Covariates and Outcome Variables
2.3. Statistical Analyses
2.4. Patient and Public Involvement
3. Results
3.1. Description of the Population
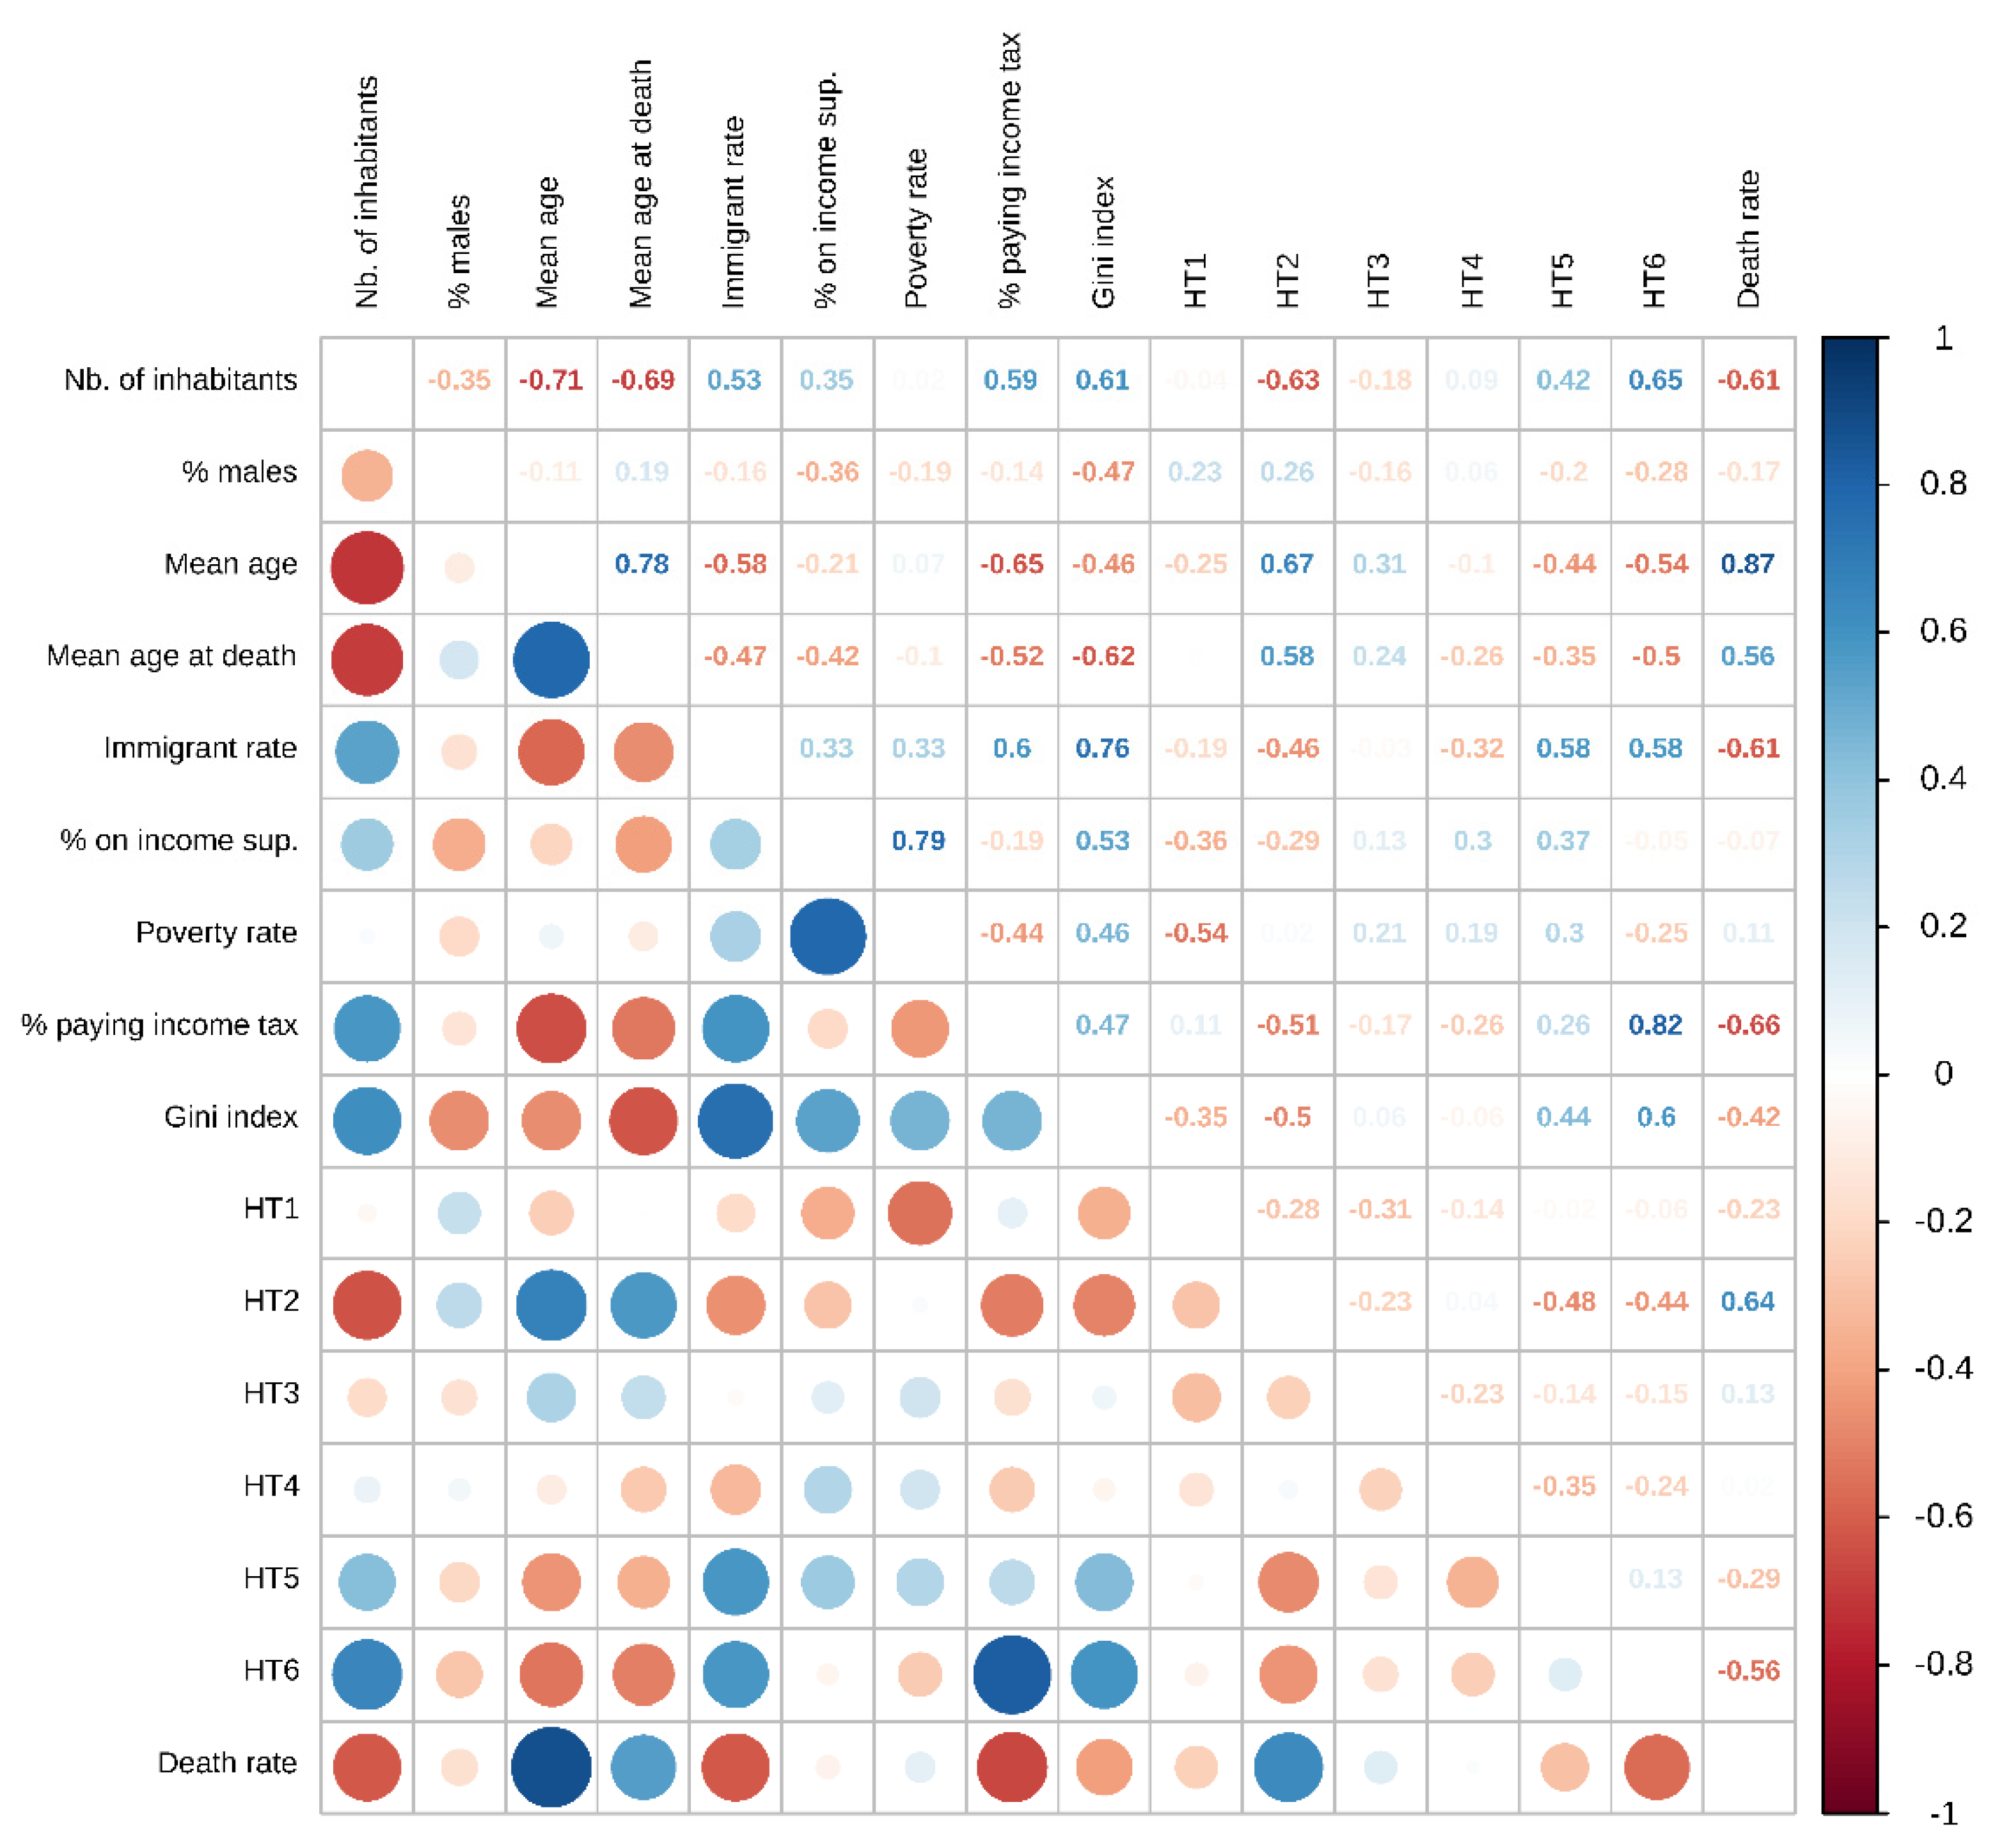
3.2. Univariate Analyses
3.3. Multivariate Analysis
4. Discussion
5. Conclusions
Author Contributions
Funding
Institutional Review Board Statement
Informed Consent Statement
Data Availability Statement
Acknowledgments
Conflicts of Interest
References
- INSEE Immigrés, Étrangers. Available online: https://www.insee.fr/fr/statistiques/3633212 (accessed on 5 November 2020).
- Gouvernement.fr. La France à L’action Face à la Vague Migratoire. Available online: https://www.gouvernement.fr/la-france-a-l-action-face-a-la-crise-migratoire-2817 (accessed on 5 November 2020).
- Berchet, C.; Jusot, F. Immigrants’ Health Status and Use of Healthcare Services: A Review of French Research. Questions d’économie de la Santé (Institute for Research and Information in Health Economics), No 172. 2012. Available online: https://www.irdes.fr/EspaceAnglais/Publications/IrdesPublications/QES172.pdf (accessed on 5 November 2020).
- Jusot, F.; Silva, J.; Dourgnon, P.; Sermet, C. Inégalités de santé liées à l’immigration en France: Effet des conditions de vie ou sélection à la migration? Rev. Économique 2009, 60, 385. [Google Scholar] [CrossRef]
- Solé-Auró, A.; Crimmins, E.M. Health of Immigrants in European Countries. Int. Migr. Rev. 2008, 42, 861–876. [Google Scholar] [CrossRef] [PubMed] [Green Version]
- Berchet, C.; Jusot, F. Inégalités de santé liées à l’immigration et capital social: Une analyse en décomposition. Économie Publique/Public Econ. 2012, 73–100. [Google Scholar] [CrossRef]
- Berchet, C.; Jusot, F. L’état de santé des migrants de première et de seconde génération en France: Une analyse selon le genre et l’origine. Rev. Économique 2010, 61, 1075. [Google Scholar] [CrossRef]
- Marmot, M.G.; Stansfeld, S.; Patel, C.; North, F.; Head, J.; White, I.; Brunner, E.; Feeney, A.; Marmot, M.G.; Smith, G.D. Health inequalities among British civil servants: The Whitehall II study. Lancet 1991, 337, 1387–1393. [Google Scholar] [CrossRef]
- Darmon, N.; Khlat, M. An overview of the health status of migrants in France, in relation to their dietary practices. Public Health Nutr. 2001, 4, 163–172. [Google Scholar] [CrossRef] [PubMed] [Green Version]
- Khlat, M.; Darmon, N. Is there a Mediterranean migrants mortality paradox in Europe? Int. J. Epidemiol. 2003, 32, 1115–1118. [Google Scholar] [CrossRef] [Green Version]
- Attias-Donfut, C.; Tessier, P. Santé et vieillissement des immigrés. Retraite Société 2005, 46, 89–129. [Google Scholar] [CrossRef]
- Attias-Donfut, C.; Wolff, F.-C. Le lieu D’enterrement des Personnes Nees hors de France. Population 2005, 60, 813–836. [Google Scholar] [CrossRef]
- Rubalcava, L.N.; Teruel, G.M.; Thomas, D.; Goldman, N. The Healthy Migrant Effect: New Findings from the Mexican Family Life Survey. Am. J. Public Health 2008, 98, 78–84. [Google Scholar] [CrossRef] [PubMed]
- Kennedy, S.; McDonald, J.T.; Biddle, N. The Healthy Immigrant Effect and Immigrant Selection: Evidence from Four Countries. Soc. Econ. Dimens. Aging Popul. 2006. Available online: http://socserv.mcmaster.ca/sedap/p/sedap164.pdf (accessed on 30 June 2021).
- Razum, O.; Twardella, D. Time travel with Oliver Twist—Towards an explanation for a paradoxically low mortality among recent immigrants. Trop. Med. Int. Health 2002, 7, 4–10. [Google Scholar] [CrossRef] [PubMed]
- Bhopal, R.S.; Rafnsson, S.B.; Agyemang, C.; Fagot-Campagna, A.; Giampaoli, S.; Hammar, N.; Harding, S.; Hedlund, E.; Juel, K.; Mackenbach, J.P.; et al. Mortality from circulatory diseases by specific country of birth across six European countries: Test of concept. Eur. J. Public Health 2012, 22, 353–359. [Google Scholar] [CrossRef] [PubMed] [Green Version]
- Dourgnon, P.; Jusot, F.; Sermet, C.; Silva, J. Le Recours aux Soins de Ville des Immigrés en France. Quest. d’économie de la Santé. 2009. Available online: http://pascal-francis.inist.fr/vibad/index.php?action=getRecordDetail&idt=22148611 (accessed on 30 June 2021).
- Dunn, J.R.; Dyck, I. Social determinants of health in Canada’s immigrant population: Results from the National Population Health Survey. Soc. Sci. Med. 2000, 51, 1573–1593. [Google Scholar] [CrossRef]
- Perronnin, M.; Pierre, A.; Rochereau, T. Complementary Health Insurance in France: Wide-Scale Diffusion but Inequalities of Access Persist. Quest. d’économie de la Santé. 2011. Available online: https://www.irdes.fr/EspaceAnglais/Publications/IrdesPublications/QES161.pdf (accessed on 30 June 2021).
- Moullan, Y.; Jusot, F. Why is the “healthy immigrant effect” different between European countries? Eur. J. Public Health 2014, 24, 80–86. [Google Scholar] [CrossRef]
- Chevillard, G.; Mousquès, J. Accessibilité aux soins et attractivité territoriale: Proposition d’une typologie des territoires de vie français. Cybergeo 2018. [Google Scholar] [CrossRef]
- INSEE Population en 2017. Available online: https://www.insee.fr/fr/statistiques/4515539?sommaire=4516122 (accessed on 15 September 2020).
- INSEE Principaux Indicateurs sur les Revenus et la Pauvreté aux Niveaux National et Local—Principaux Résultats sur les Revenus et la Pauvreté des Ménages en 2017. Available online: https://www.insee.fr/fr/statistiques/4507225?som-maire=4507229#consulter-sommaire (accessed on 5 November 2020).
- Cafdata Foyers Allocataires Percevant le Revenu de Solidarité Active (RSA)—par Commune. Available online: http://data.caf.fr/dataset/foyers-allocataires-percevant-le-revenu-de-solidarite-active-rsa-par-commune (accessed on 5 November 2020).
- INSEE Fichier des Personnes Décédées Depuis 1970. Available online: https://www.insee.fr/fr/information/4190491 (accessed on 5 November 2020).
- Preston, S.H. The changing relation between mortality and level of economic development. Int. J. Epidemiol. 2007, 36, 484–490. [Google Scholar] [CrossRef] [Green Version]
- Wilkinson, R.; Pickett, K. The Spirit Level: Why Equality Is Better for Everyone; Penguin: London, UK, 2010; Available online: https://www.researchgate.net/publication/256463915_R_Wilkinson_and_K_Pickett_2010_The_Spirit_Level_Why_Equality_is_Better_for_Everyone_London_Penguin_999_pp_347_pbk (accessed on 2 October 2020).
- De Maio, F.G. Immigration as pathogenic: A systematic review of the health of immigrants to Canada. Int. J. Equity Health 2010, 9, 27. [Google Scholar] [CrossRef] [PubMed] [Green Version]
- Robinson, W.S. Ecological Correlations and the Behavior of Individuals. Am. Sociol. Rev. 1950, 15, 351. [Google Scholar] [CrossRef]
- Subramanian, S.V.; Jones, K.; Kaddour, A.; Krieger, N. Revisiting Robinson: The perils of individualistic and ecologic fallacy. Int. J. Epidemiol. 2009, 38, 342–360. [Google Scholar] [CrossRef] [PubMed] [Green Version]
- Balsa, A.I.; McGuire, T.G. Prejudice, clinical uncertainty and stereotyping as sources of health disparities. J. Health Econ. 2003, 22, 89–116. [Google Scholar] [CrossRef] [Green Version]
- Carde, E. Les discriminations selon l’origine dans l’accès aux soins. St. Publique 2007, 19, 99–109. [Google Scholar] [CrossRef] [PubMed]
- Pérez, C. Health status and health behaviour among immigrants. Stat. Can. Suppl. Health Rep. 2002, 13, 89–100. [Google Scholar]
- Syse, A.; Dzamarija, M.T.; Kumar, B.N.; Diaz, E. An observational study of immigrant mortality differences in Norway by reason for migration, length of stay and characteristics of sending countries. BMC Public Health 2018, 18, 508. [Google Scholar] [CrossRef]
- Aldridge, R.W.; Nellums, L.B.; Bartlett, S.; Barr, A.L.; Patel, P.; Burns, R.; Hargreaves, S.; Miranda, J.J.; Tollman, S.; Friedland, J.S.; et al. Global patterns of mortality in international migrants: A systematic review and meta-analysis. Lancet 2018, 392, 2553–2566. [Google Scholar] [CrossRef] [Green Version]


| Variables | Death Rate | Mean Age at Death | |||||
|---|---|---|---|---|---|---|---|
| All Departements (96) | Departments with a Death Rate < 1% (44) | Departments with a Death Rate ≥ 1% (52) | p-Value | Departments with Mean Age at Death < 80 yo (45) | Departments with Mean Age at Death ≥ 80 yo (51) | p-Value | |
| Inhabitants | 673,324.30 ± 515,271.96 | 941,296.84 ± 607,946.84 | 446,578.31 ± 261,859.78 | 0 | 970,599.96 ±564,689.75 | 411,022.25 ±272,279.92 | 0 |
| Living men percentage | 48.5 ± 0.49 | 48.6 ± 0.49 | 48.4 ± 0.47 | 0.041 | 48.5 ± 0.51 | 48.5 ± 0.47 | 0.8624 |
| Mean age | 42 ± 2.62 | 41 ± 2.04 | 44 ± 1.89 | 0 | 41 ± 1.85 | 44 ± 1.90 | 0 |
| Proportion of immigrants | 7.80 ± 4.57 | 9.93 ± 5.57 | 6.00 ± 2.37 | 0 | 9.37 ± 5.68 | 6.42 ± 2.68 | 0.0013 |
| Proportion of family allowance beneficiaries (%) | 17.94 ± 1.91 | 18.20 ± 2.25 | 17.72 ± 1.55 | 0.2239 | 18.93 ± 1.93 | 17.06 ± 1.41 | 0 |
| Poverty rate | 14.42 ± 3.03 | 14.23 ± 3.68 | 14.59 ± 2.36 | 0.5654 | 14.47 ± 3.61 | 14.38 ± 2.44 | 0.8869 |
| Median income (k €) | 20.7 ± 2.04 | 21.546 ± 2.627 | 19.985 ± 0.891 | 0.0001 | 21.402 ± 2.431 | 20.0816 ± 1.368 | 0.0013 |
| Gini index | 0.34 ± 0.03 | 0.35 ± 0.04 | 0.33 ± 0.02 | 0.0006 | 0.35 ± 0.04 | 0.33 ± 0.02 | 0.0001 |
| Proportion of farmers | 1.24 ± 0.96 | 0.77 ± 0.65 | 1.64 ± 1.01 | 0 | 0.69 ± 0.49 | 1.74 ± 1.01 | 0 |
| Proportion of craftsmen and company managers | 3.69 ± 0.75 | 3.52 ± 0.76 | 3.83 ± 0.72 | 0.0471 | 3.32 ± 0.64 | 4.01 ± 0.69 | 0 |
| Proportion of executives | 7.32 ± 4.02 | 9.21 ± 5.18 | 5.71 ± 1.34 | 0 | 9.14 ± 4.81 | 5.71 ± 2.19 | 0 |
| Proportion of white-collar workers | 16.07 ± 1.16 | 16.36 ± 1.47 | 15.83 ± 0.73 | 0.0266 | 16.38 ± 1.32 | 15.81 ± 0.92 | 0.0147 |
| Proportion of blue-collar workers | 12.98 ± 2.55 | 12.89 ± 3.13 | 13.06 ± 1.97 | 0.7401 | 12.84 ± 2.85 | 13.11 ± 2.29 | 0.5969 |
| Unemployment rate | 15.40 ± 2.49 | 16.59 ± 2.65 | 14.40 ± 1.83 | 0 | 17.06 ± 2.22 | 13.95 ± 1.66 | 0 |
| Peri-urban areas * (%) | 21.57 ± 16.98 | 24.62 ± 18.68 | 19.00 ± 15.10 | 0.1064 | 23.03 ± 16.50 | 20.29 ± 17.45 | 0.4325 |
| Rural, unattractive areas * (%) | 24.37 ± 25.03 | 13.28 ± 19.05 | 33.76 ± 25.79 | 0 | 11.73 ± 14.25 | 35.53 ± 27.22 | 0 |
| Retirement & tourism areas $ (%) | 10.14 ± 19.88 | 6.49 ± 17.11 | 13.22 ± 21.64 | 0.099 | 5.29 ± 12.49 | 14.41 ± 23.95 | 0.024 |
| Disadvantaged areas with dedicated governmental health programs * (%) | 10.24 ± 16.37 | 10.51 ± 17.88 | 10.01 ± 15.15 | 0.8819 | 13.66 ± 20.25 | 7.22 ± 11.33 | 0.0538 |
| Heterogeneous city centers $ (%) | 24.27 ± 18.55 | 28.46 ± 21.20 | 20.72 ± 15.28 | 0.041 | 30.76 ± 20.31 | 18.54 ± 14.80 | 0.001 |
| Wealthy cities and peri-urban areas (%) | 9.42 ± 16.65 | 16.64 ± 21.90 | 3.30 ± 5.38 | 0.0001 | 15.54 ± 20.12 | 4.02 ± 10.36 | 0.0005 |
| Death rate | 1.01 ± 0.20 | 0.84 ± 0.14 | 1.15 ± 0.12 | 0 | 0.90 ± 0.17 | 1.10 ± 0.17 | 0 |
| Mean age at death | 80.03 ± 1.69 | 79.20 ± 1.60 | 80.73 ± 1.44 | 0 | 78.61 ± 1.22 | 81.28 ± 0.86 | 0 |
| Variables | Univariate Analysis | Multivariate Analysis | ||||||
|---|---|---|---|---|---|---|---|---|
| Coefficient | 95% CI | p-Value | Coefficient | 95% CI | p-Value | |||
| Inhabitants | −2.36 × 10⁻⁷ | −2.97 × 10⁻⁷ | −1.75 × 10⁻⁷ | 0.000 | −4.06 × 10⁻⁸ | -1.01 × 10⁻⁷ | 2.00 × 10⁻⁸ | 0.186 |
| Percentage males | -0.069 | −0.149 | 0.011 | 0.093 | −0.035 | −0.086 | 0.017 | 0.184 |
| Mean age | 0.066 | 0.059 | 0.074 | 0.000 | 0.054 | 0.037 | 0.070 | 0.000 |
| Immigrant rate | −0.027 | −0.034 | −0.020 | 0.000 | −0.013 | −0.022 | −0.003 | 0.009 |
| Proportion of family allowance beneficiaries (%) | −0.017 | −0.066 | 0.033 | 0.509 | 0.048 | 0.006 | 0.089 | 0.025 |
| Poverty rate | 0.007 | −0.006 | 0.020 | 0.271 | −0.012 | −0.032 | 0.008 | 0.232 |
| Percentage of households liable for income tax | −0.021 | −0.026 | −0.016 | 0.000 | −0.002 | −0.011 | 0.007 | 0.639 |
| Gini Index | −2.669 | −3.828 | −1.510 | 0.000 | 0.860 | −0.384 | 2.103 | 0.173 |
| Peri-urban areas * (%) | −0.003 | −0.005 | 0.000 | 0.018 | - | - | - | - |
| Rural, unattractive areas * (%) | 0.005 | 0.004 | 0.006 | 0.000 | 0.002 | 0.000 | 0.003 | 0.032 |
| Retirement and tourism areas $ (%) | 0.001 | −0.001 | 0.003 | 0.193 | 0.000 | −0.002 | 0.001 | 0.758 |
| Disadvantaged areas with dedicated governmental health programs * (%) | 0.000 | −0.002 | 0.003 | 0.860 | 0.001 | −0.001 | 0.003 | 0.370 |
| Heterogeneous city centers $ (%) | −0.003 | −0.005 | −0.001 | 0.003 | 0.003 | 0.001 | 0.005 | 0.003 |
| Wealthy cities and peri-urban areas $ (%) | −0.007 | −0.009 | −0.005 | 0.000 | 0.000 | −0.002 | 0.003 | 0.695 |
| Variable | Univariate Analysis | Multivariate Analysis (adj. R2 = 0.7594) | ||||||
|---|---|---|---|---|---|---|---|---|
| Coefficient | 95% CI | p-Value | Coefficient | 95% CI | p-Value | |||
| Inhabitants | −2.27 × 10⁻⁶ | −2.75 × 10⁻⁶ | −1.79 × 10⁻⁶ | 0.000 | 2.32 × 10⁻⁷ | −4.54 × 10⁻⁷ | 9.18 × 10⁻⁷ | 0.503 |
| Percentage males | 0.656 | −0.032 | 1.343 | 0.062 | 0.235 | −0.349 | 0.818 | 0.426 |
| Mean age | 0.504 | 0.423 | 0.586 | 0.000 | 0.444 | 0.256 | 0.633 | 0.000 |
| Immigrant rate | −0.173 | −0.239 | −0.106 | 0.000 | 0.106 | −0.002 | 0.213 | 0.053 |
| Proportion of family allowance beneficiaries (%) | −0.882 | −1.271 | −0.493 | 0.000 | −0.520 | -0.992 | −0.048 | 0.031 |
| Poverty rate | −0.058 | −0.171 | 0.054 | 0.311 | 0.102 | −0.122 | 0.326 | 0.369 |
| Percentage of households liable for income tax | −0.140 | −0.187 | −0.094 | 0.000 | −0.030 | −0.127 | 0.067 | 0.543 |
| Gini index | −33.765 | −42.391 | −25.138 | 0.000 | −25.437 | −39.519 | −11.354 | 0.001 |
| Peri-urban areas * (%) | 0.000 | −0.020 | 0.020 | 0.978 | - | - | - | - |
| Rural, unattractive areas * (%) | 0.039 | 0.028 | 0.050 | 0.000 | −0.009 | −0.026 | 0.009 | 0.326 |
| Retirement and tourism areas $ (%) | 0.021 | 0.004 | 0.038 | 0.014 | −0.001 | −0.019 | 0.017 | 0.921 |
| Disadvantaged areas with dedicated governmental health programs * (%) | −0.027 | −0.047 | −0.007 | 0.008 | −0.016 | −0.037 | 0.006 | 0.155 |
| Heterogeneous city centers $ (%) | −0.032 | −0.050 | −0.015 | 0.000 | −0.007 | −0.028 | 0.015 | 0.532 |
| Wealthy cities and peri-urban areas $ (%) | −0.051 | −0.069 | −0.033 | 0.000 | −0.001 | −0.028 | 0.027 | 0.955 |
Publisher’s Note: MDPI stays neutral with regard to jurisdictional claims in published maps and institutional affiliations. |
© 2021 by the authors. Licensee MDPI, Basel, Switzerland. This article is an open access article distributed under the terms and conditions of the Creative Commons Attribution (CC BY) license (https://creativecommons.org/licenses/by/4.0/).
Share and Cite
Perrot, J.; Hamel, J.-F.; Lamer, A.; Levaillant, M. The Relationship between the Immigrant Rate and Health Status in the General Population in France. J. Pers. Med. 2021, 11, 627. https://doi.org/10.3390/jpm11070627
Perrot J, Hamel J-F, Lamer A, Levaillant M. The Relationship between the Immigrant Rate and Health Status in the General Population in France. Journal of Personalized Medicine. 2021; 11(7):627. https://doi.org/10.3390/jpm11070627
Chicago/Turabian StylePerrot, Jeanne, Jean-François Hamel, Antoine Lamer, and Mathieu Levaillant. 2021. "The Relationship between the Immigrant Rate and Health Status in the General Population in France" Journal of Personalized Medicine 11, no. 7: 627. https://doi.org/10.3390/jpm11070627
APA StylePerrot, J., Hamel, J.-F., Lamer, A., & Levaillant, M. (2021). The Relationship between the Immigrant Rate and Health Status in the General Population in France. Journal of Personalized Medicine, 11(7), 627. https://doi.org/10.3390/jpm11070627