Abstract
Background: Precision medicine is a promising strategy to identify biomarkers, stratify asthmatic patients according to different endotypes, and match them with the appropriate therapy. This proof-of-concept study aimed to investigate whether gene expression in peripheral blood could provide a valuable noninvasive approach for the molecular phenotyping of asthma. Methods: We performed whole-transcriptome RNA sequencing on peripheral blood of 30 non-atopic non-asthmatic controls and 30 asthmatic patients. A quantitative PCR (qPCR) validation study of PTGDR2 that encodes for CRTH2 receptor, expressed in cells involved in T2 inflammation, was developed in a cohort of 361 independent subjects: 94 non-asthmatic non-atopic controls, 187 asthmatic patients [including 82 with chronic rhinosinusitis with nasal polyposis (CRSwNP) and 24 with aspirin-exacerbated respiratory disease (AERD)], 52 with allergic rhinitis, and 28 with CRSwNP without asthma. Results: PTGDR2 was one of the most differentially overexpressed genes in asthmatic patients’ peripheral blood (p-value 2.64 × 10⁶). These results were confirmed by qPCR in the validation study, where PTGDR2 transcripts were significantly upregulated in asthmatic patients (p < 0.001). This upregulation was mainly detected in some subgroups such as allergic asthma, asthma with CRSwNP, AERD, eosinophilic asthma, and severe persistent asthma. PTGDR2 expression was detected in different blood cell types, and its correlation with eosinophil counts showed differences in some groups of asthmatic patients. Conclusions: We found that PTGDR2 expression levels could identify asthma patients, introduce a minimally invasive biomarker for adult asthma molecular phenotyping, and add additional information to blood eosinophils. Although further studies are required, analyzing PTGDR2 expression levels in peripheral blood of asthmatics might assist in selecting patients for treatment with specific antagonists.
1. Introduction
Asthma is a heterogeneous disease, characterized by chronic airway inflammation with variable respiratory symptoms, affecting around 358 million people worldwide [1,2]. Type 2-driven asthma is a subtype of asthma in which there is a notable release of interleukin-4 (IL4), IL5, and IL13 from cells of both innate and adaptive immune systems [3,4]. These cytokines or their receptors are targets of biological treatments of asthma type 2 [5].
In the precision medicine era, it is necessary to identify inter-individual differences in response to drugs to better stratifying patients finding the most effective treatments for each patient [6]. In this regard, it would be desirable to have specific biomarkers easily measurable in biological fluids (such as blood), minimally invasive, and reproducible. The development of biomarkers that enable clinicians to distinguish phenotypes, identify treatment responders and non-responders, and predict future clinical or adverse outcomes is an unmet need in asthma [7]. Non-coding variants associated with gene expression regulation or epigenetic markers regulating gene expression will yield essential insights into the genetic architecture of asthma [8]. Changes in gene expression constitute the central link between genetic variants, epigenetics, and disease. In this sense, genome-wide assessment of gene expression (transcriptomics) might help identify disease-associated genes and novel disease pathways. Recently, a review of transcriptomic studies in asthma was performed to summarize recent transcriptome studies focusing on asthma pathogenesis and asthma drug responses [9]. As described, blood cells express approximately 80% of the genes encoded by the human genome, and blood contains many of the cells involved in immune responses. In addition, blood is an easily accessible tissue. For these reasons, blood cells have been widely used for asthma transcriptome studies [9]. Some genomic control signatures were described in a transcriptomic study performed in 1170 adult asthmatics with varying degrees of asthma control status [10]. Yeh et al. performed a cluster analysis of gene expression in PBMCs from 133 childhood asthmatics and identified three molecular clusters with distinct inflammatory profiles. Among them, cluster 3 was characterized by changes in glucocorticoid signaling and activation of the Th1/Th17 immune pathways and was related to poor treatment control [11]. Some whole-genome expression studies in blood cells have analyzed the effect of asthma severity [12,13]. In another transcriptomic study, the samples of PBMCs from 118 adult asthmatics were analyzed between the stable and exacerbation states, showing a distinct exacerbation-associated gene expression signature [14]. Finally, the effect of the biological treatment benralizumab on the whole blood transcriptomic signature of severe asthmatic patients was analyzed, showing significant reductions in the expression of genes associated with eosinophilic inflammatory responses [15].
In summary, different transcriptomic studies in asthma are adding information on novel genes and related pathways involved in the numerous pathophysiological mechanisms of this heterogeneous disease. In this work, we performed a transcriptomic analysis in whole blood samples of patients with allergic asthma and non-allergic non-asthmatic controls. The study aimed to find differentially expressed genes and analyze whether the determination of any of these gene expression levels could be employed as a biomarker to provide additional information for the phenotypic characterization of patients with asthma.
2. Materials and Methods
2.1. Study Population
A total of 421 subjects participated in the study, including 60 subjects who participated in the transcriptomic analysis, and 94 controls and 267 patients involved in the validation study. In the transcriptomic analysis, 30 patients with allergic asthma diagnosed by an allergist, and 30 non-asthmatic non-atopic controls were included. For the validation analysis, 361 Caucasian individuals were recruited from the Allergy Department of the Salamanca University Hospital. The Clinical Research Ethics Committee of the Institute for Biomedical Research of Salamanca (IBSAL) approved the study (PI 2020-02-433) and informed written consent from study subjects was obtained. Ninety-five individuals were enrolled as controls. Controls fulfilled the following criteria: (i) no symptoms or history of fulfilled the following criteria: (i) no symptoms or history of asthma or other pulmonary diseases, (ii) no symptoms or history of rhinitis, (iii) no symptoms or history of allergic diseases, (iv) negative skin prick tests to a battery of common aeroallergens; (v) absence of a family history of asthma, rhinitis, or atopy, and (vi) age > 16 years old. Age was significantly higher in controls than in patients in order to permit a more extended period for asthma to have appeared. In addition, the patients were recruited meeting the following criteria: (i) physician-diagnosis of respiratory allergy (asthma, rhinitis, nasal polyposis or aspirin-exacerbated respiratory disease (AERD), (ii) age > 16 years. Skin prick tests were performed from a battery of common aeroallergens previously described [16]. Skin tests were considered positive if there were at least one wheal reaction of >3 mm of diameter bigger than the negative control. The severity of asthma was evaluated according to the Spanish Guide for the Management of Asthma (GEMA 4.4) [17], allergic rhinitis was classified following ARIA guidelines modified by Valero et al. [18]. None was receiving oral corticosteroids; however, asthmatic patients received inhaled corticosteroids therapy.
2.2. Transcriptomic RNA Sequencing (RNAseq) and Data Analysis
Total RNA was isolated from peripheral blood samples stored in RNA later at −20 °C using the Ambion RiboPureTM Blood kit (Thermo Fisher Scientific, Waltham, MA, USA). Peripheral blood was selected due to its accessibility. RNA was treated with Ambion DNAse I and concentrated with the RNeasy MinElute Cleanup Kit (Qiagen, Hilden, Germany). All purification protocols were carried out following the manufacturer’s instructions. RNA was quantified with a Nanodrop 1000 instrument, and the RNA quality was assessed by measuring the RIN (RNA Integrity Number) in a Bioanalyzer Agilent 2100 expert equipment using the Eukaryote Total RNA Nano kit (Agilent Technologies, Santa Clara, CA, USA). 1 µg of RNA samples with an RIN higher than 8.0 was used for RNAseq. Globin transcripts and ribosomal RNA were removed, and RNA was cleaved to prepare RNA strand-specific libraries, generate clusters from each library, and perform a high-throughput sequencing using the Illumina HiSeq 2500 ultra-sequencing platform (Illumina, San Diego, CA, USA).
2.3. Sequences Selection and Characterization
In the bioinformatic analysis of the transcriptomic obtained data, we include quality control of the raw data using the FastQC tool (http://www.bioinformatics.babraham.ac.uk/projects/fastqc (accessed on December 2019)). The reads were then mapped against the human genome version hg39 using the tophat2 algorithm [19]. The low-quality reads were removed using Picard Tools software (https://broadinstitute.github.io/picard/ (accessed on December 2019)). The unmapped and non-properly paired reads were re-mapped using the bwa mem algorithm [20]. Aligning sequence reads, clone sequences, and assembly contigs were carried out with Burrows–Wheeler Aligner (BWA-MEM). The genes and isoforms predictions were estimated using the Cufflinks method [21] and expression levels were calculated using the HT Seq software version 0.6.0 (http://www-huber.embl.de/users/anders/HTSeq/ (accessed on December 2019)). The differential gene expression between different conditions was identified using the DESeq2 method [22]. We consider as true differently expressed genes those with a fold-change value equal or below −1.5 or equal or higher than 1.5 and with a p-value (Padj) corrected by FDR (false discovery rate) <0.05 [23]. Given the heterogeneity of asthma, the role of different clinical and biological markers was included in the bioinformatics study with the purpose of detecting their potential influence in the study. Quantitative PCR (qPCR) was performed on selected genes to validate the sequencing data.
2.4. Quantitative PCR Expression Analysis
Total RNA was isolated from peripheral blood samples stored with RNA later at −20 °C, using the RiboPure-Blood kit (Ambion, Thermo Fisher Scientific, Waltham, MA, USA) according to the manufacturer’s instructions. DNAse treatment was performed using Turbo DNAse (Ambion, Thermo Fisher Scientific, Waltham, MA, USA). Concentrations and RNA quality ratios were measured using a NanoDrop 1000 (Thermo Fisher Scientific, Waltham, MA, USA). Reverse transcription (RT) was performed on 500 ng of total RNA with Superscript III First-Strand Synthesis System for RT-PCR (Invitrogen, Thermo Fisher Scientific, Waltham, MA, USA) using a thermal cycler (MultiGene Opti-Max, Labnet International Inc., Edison, NJ, USA) in a total volume of 20 μL, with a single cycle and incubation periods of 65 °C for 5 min, 25 °C for 10 min, 50 °C for 50 min, 85 °C for 5 min, and 37 °C for 20 min. All the analyzed samples were transcribed with the same reverse transcription reaction conditions. Relative qPCR was performed using the LightCycler480® Instrument and SYBR Green I Master (Roche, Basel, Switzerland). Fold induction was calculated using the formula 2-(ΔΔCt) by the comparative Ct method [24].
In a pilot study, we performed the qPCR analysis with both GAPDH and TBP as reference genes, showing similar PTGDR1 relative expressions and a high correlation among them (Spearman ρ, 0.783; p < 0.001) [16]. Based on this study, we decided to complete the validation study in the broad population with GAPDH due to its wide use in the literature. Oligonucleotides targeting PTGDR2 were designed using the primer analysis software Primer 3.0 [25] and assisted using Beacon Designer Software [26]. GAPDH reference gene primers were chosen from the panel Real-Time ready Human Reference Gene (Roche Applied Science, Indianapolis, IN, USA). Primers were used at 400 nM each and cDNA at 20 ng in 15 µL reactions. Conditions for PCR included 10 min at 95 °C followed by 45 cycles of real-time PCR with 3 segments amplification, including 10 s at 95 °C for denaturation, 10 s at 60 °C for annealing, and 10 s at 72 °C for polymerization. The dissociation protocol to determine the melting curve from 60 °C to 95 °C for each PCR product was added after thermocycling to verify that each primer pair produced only a single product. All samples showed only one melting peak, indicating that PCR generated only one amplicon and no primer/dimer formation. The qPCR efficiencies were performed by amplifying a standardized dilution series of the template cDNA and were determined for each gene based on the standard curve slope. The qPCR efficiencies were calculated with the equation: E = (10−1/slope−1) × 100, obtaining efficiencies values between 90% and 102%. Each sample was performed in triplicate, with non-template controls and calibrators included in each experiment. PTGDR2 was measured twice over time in several subjects to rule out the intra-patient variability (data not shown). All procedures were performed following MIQE guidelines [27].
2.5. Clinical Measurements
Cell peripheral blood was counted automatically using a counter (Beckman Coulter, Brea, CA, USA) and the MAXM A/L system (Beckman Coulter, Brea, CA, USA). Blood cell counts of the transcriptomic study participants are summarized in supplementary data (Table S1). Total IgE serum levels were measured by a fluoroenzyme immunoassay (ImmunoCap System, ThemoFisher Scientific, Waltham, MA, USA). FeNO was determined using NIOX VERO (Circassia, Uppsala, Sweden).
2.6. Flow Cytometry
Fresh blood samples from 12 patients were processed and analyzed on the same day. Red blood cells were lysed using lysis buffer (150 mM NH4Cl, 12 mM NaHCO3, 0.1 mM EDTA). PBMCs were washed twice with PBS previously to incubation with antibodies. Labeling was performed using the following antibodies: CD3-PE, CD123-APC, and CD294-FITC were purchased from BD Biosciences (Franklin Lakes, NJ, USA); CD45-PerCP-Cy5.5 and HLA-DR PB were from Biolegend (San Diego, CA, USA). A FACSAria instrument (BD Biosciences) was used. Samples were analyzed using the Flowing Software from Turku Biosciences (Turku, Finland).
2.7. Statistical Analysis
Data analysis was performed using pairwise comparison by analysis of variance (ANOVA), unpaired one-sample t-test, Kruskal–Wallis, Pearson’s correlation coefficient, χ2 Test of independence, Logistic Regression, and The Receiver Operating Characteristic (ROC) analysis using the SPSS Software, version 26 (IBM, Armonk, NY, USA). Comparisons between ROC curves were performed using MedCal version 19 (MedCalc Software Ltd., Ostend, Belgium). Graphs were plotted using GraphPad Prism version 6 (San Diego, CA, USA). Data were representative of at least three independent experiments. A p < 0.05 was considered significant. Statistical controls were applied for statistically significant associations: the analysis of multivariate logistic regression adjusted for potential confounding variables such as age, sex, IgE, and white blood cells counts, using the WALD test; the statistical power (SP) to evaluate the sample size and the false positive report probability (FPRP) using the method to identify the potential type I error [28]. Bonferroni corrections were applied when multiple comparisons are performed considering the original p-value as p < 0.05 to calculate the new p-values.
3. Results
3.1. Characteristics of the Population of the Transcriptomic Assay
The phenotypic characteristics of the study population are shown in Table 1, clinical information of asthmatics, such as medications, atopic status, smoking status, and co-morbid diseases are described in supplementary data (Table S2). Total IgE levels were significantly lower in controls (p < 0.001). All patients had allergic asthma and were sensitized to pollen. Moderate persistent asthma was predominant (46.4%), followed by intermittent asthma (35.7%). Persistent moderate rhinitis (82.8%) and mild intermittent rhinitis (10.3%) were the most frequent types.

Table 1.
Phenotypic characteristics of the population of the transcriptomic assay.
3.2. Transcriptomic Study
We observed transcriptional differences between asthmatic patients and controls. A search for the most differentially expressed genes was performed, and the top 20 genes with a fold-change value equal to or below −1.5 or equal to or higher than 1.5 and a p-value corrected by FDR (Padj) <0.05 were selected. Ten of these genes were upregulated and ten downregulated in patients (Table 2). The Gene Ontology (GO) term analyses for biological processes of the most differentially expressed genes are listed in Table 3. We performed a multivariate logistic regression analysis to adjust the differential expressed genes to the white blood cell counts as covariates. It is described in supplementary data (Table S3).
Table 2.
Protein-coding transcripts most differentially expressed between patients with allergic asthma and controls. PTGDR2 gene is highlighted in bold.
Table 3.
Gene ontology biological process enrichment analysis for most differentially expressed genes. PTGDR2 gene is highlighted in bold.
We selected PTGDR2 for several reasons: it was one of the five most differentially overexpressed coding transcripts in asthmatic patients (fold change 1.989; p-value 2.64 × 10⁶) (Table 2) the role of PGD2 and their receptors, PTGDR1 and PTGDR2, in asthma and allergy [16,29,30,31], and mainly because there are several drugs directed against the receptor in development [32]. Moreover, PTGDR2 remains differentially expressed after adjusting expression levels through logistic regression with blood cell counts. (Table S3).
A protein-protein interaction network analysis was performed on the selected genes using the K-means [33] clustering method with STRING (Search Tool for the Retrieval of Interacting Genes/Protein) [34] to identify clusters within them. The approach yields three clusters: A, B, and C (Figure 1). PTGDR2 was found in cluster A, enriched in proteins involved in immunological processes such as HRH4, ALOX15, CYSLTR2, GPR34, IL5Rα, and FCRL5 (Figure 1) (Table 3).
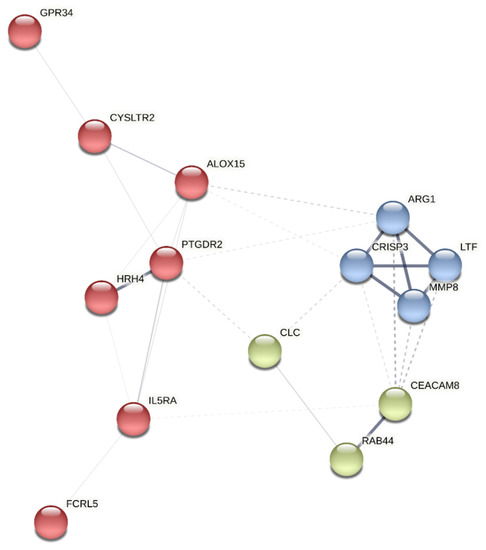
Figure 1.
Cluster analysis of the most differentially expressed genes using the STRING platform. The identified clusters are colored in red (A), blue (B), and green (C). The solid and the dotted lines indicate connections within the same and different clusters, respectively.
3.3. Characteristics of the Population in the Validation Study
Next, we verified the differential expression of PTGDR2 observed in the RNAseq assay with a qPCR analysis in a large cohort study. The characteristics of the population of the validation study are shown in Table 4 and Table 5. Patients were diagnosed with atopic or non-atopic asthma, associated or not with CRSwNP. We also included a group of patients who suffered from CRSwNP but that did not have asthma. Only in this group was there a male predominance, although with no significant differences. We also included a group of 52 patients with allergic rhinitis without asthma. Total IgE levels were significantly lower in controls than all subgroups of patients (p < 0.001 to p < 0.05), except for the group of patients with CRSwNP without atopy. The mean values of blood eosinophilia differed significantly between patients and controls (p < 0.001 to p < 0.01) except for the group of non-atopic asthma without CRSwNP (Table 5). Concerning asthma severity, moderate persistent asthma was the most common (42.3%), followed by intermittent asthma (25.8%) and mild persistent and severe persistent asthma (15.9% each one). One hundred and twenty-four patients were diagnosed with allergic asthma and allergic rhinitis.
Table 4.
Phenotypic characteristics of the population in the validation study.
Table 5.
Clinical characteristics of the population in the validation study.
3.4. qPCR Expression Analysis
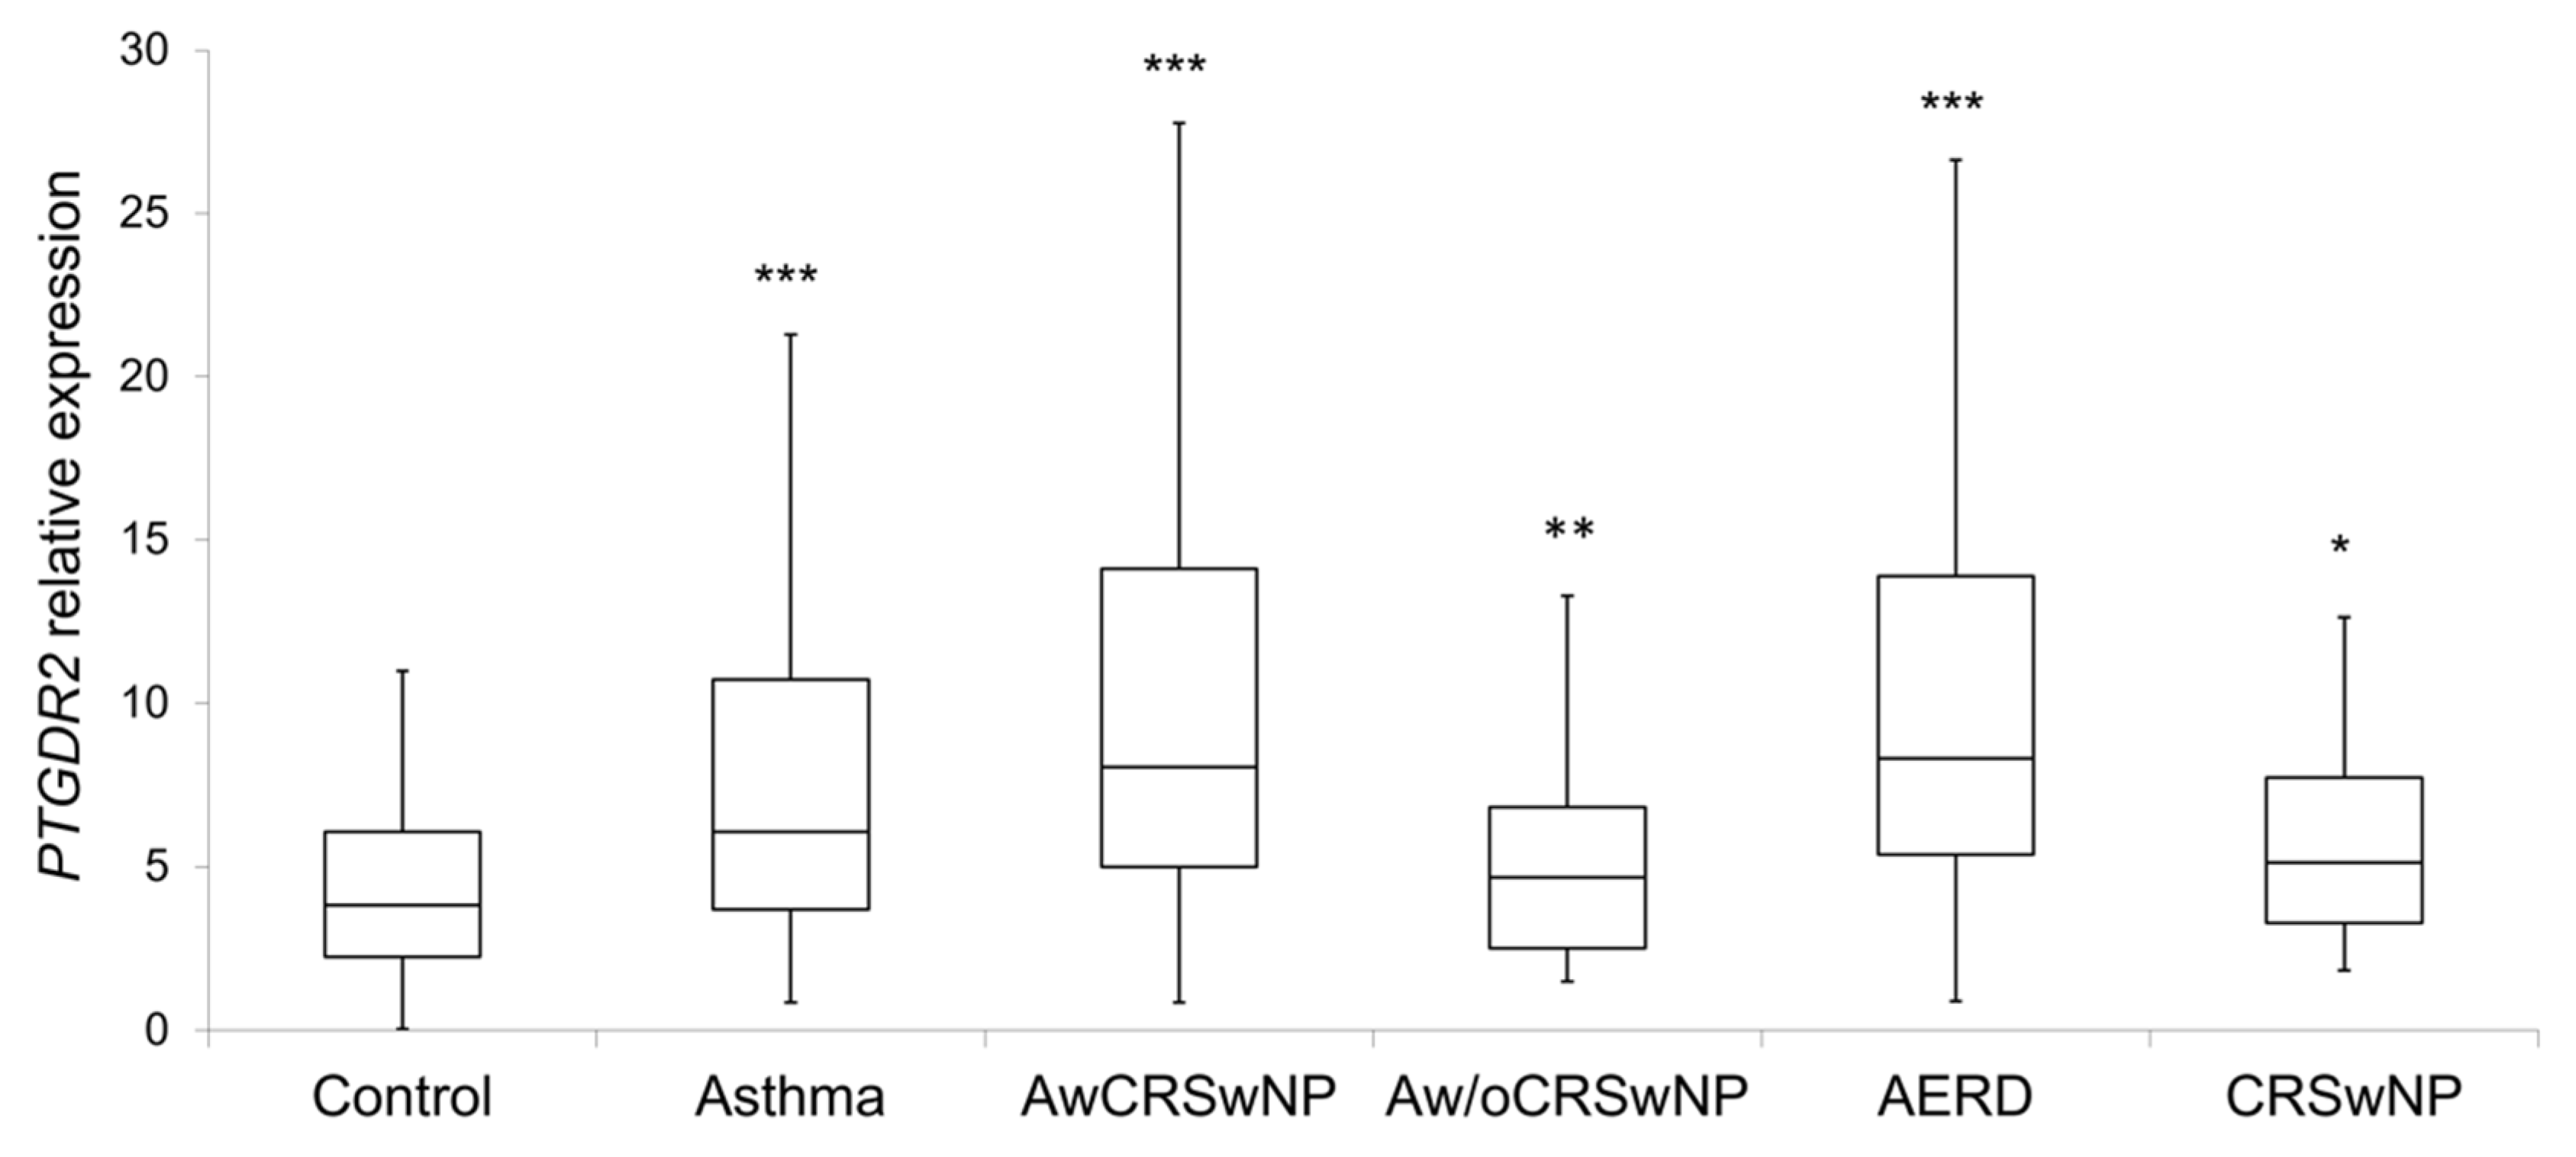
PTGDR2 expression levels were significantly higher in patients (8.2 ± 8.3; p < 0.001) than in controls (4.4 ± 2.7) (Table 5 and Figure 2). Within the different subgroups, the higher expression was observed in atopic and non-atopic asthmatics with CRSwNP (11.1 ± 10.8, p < 0.001; and 10.6 ± 7.8, p < 0.001, respectively), AERD (11.7 ± 11.9; p < 0.001) (Table 5 and Figure 2), eosinophilic asthma (9.5 ± 7.2; p < 0.001), and severe persistent asthma (12.1 ± 11.2; p < 0.001) (Table 6). Importantly, all comparisons were confirmed by logistic regression adjusted by age and sex, IgE and eosinophils, except for non-atopic asthma without CRSwNP, CRSwNP without asthma and AERD.
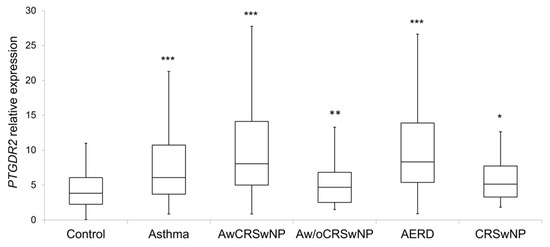
Figure 2.
Boxplot of the PTGDR2 expression levels in controls and patients; CRSwNP: Chronic Rhinosinusitis with Nasal Polyposis; AwCRSwNP: Asthma with CRSwNP; Aw/oCRSwNP; Asthma without CRSwNP; AERD: Aspirin-exacerbated respiratory disease; *** p < 0.001; ** p < 0.01; * p < 0.05; p-value of the Kruskal–Wallis test for each group of patient vs. controls after age and sex adjustment.
Table 6.
Peripheral blood eosinophil, FeNO, and PTGDR2 expression levels according to asthma severity.
Besides, no significant differences with the control group were observed in non-atopic asthma without CRSwNP (5.8 ± 5.9) or in atopic CRSwNP without asthma (4.8 ± 2.7) (Table 5).
A group of 52 patients who only had allergic rhinitis (AR) was included to analyze the relationship of atopy with the expression of PTGDR2. There were no significant differences in PTGDR2 expression levels between these 52 AR patients (7.7 ± 11.3) and the control group (4.4 ± 2.7) (Table 5).
Interestingly, increasing expression levels of PTGDR2 were observed as comorbidities of the patients heightened. Thus, patients with asthma and CRSwNP presented high values of PTGDR2, which were further increased in patients who also presented intolerance to NSAIDs (AERD) (Table 5). In addition, higher PTGDR2 expression levels were observed as the severity of asthma increased. Thus, statistically significant differences were found between controls and patients with moderate persistent asthma and severe asthma (Table 6). Furthermore, patients with mild persistent asthma had the lowest expression levels of PTGDR2 (7.3 ± 5.0), while patients with severe asthma showed the highest levels (12.1 ± 11.2). In addition, there were statistically significant differences when comparing severe asthma with the rest of asthma severity types (12.1 ± 11.2 vs. 8.0 ± 5.3; p = 0.05). We only have the asthma severity classification of 179 patients.
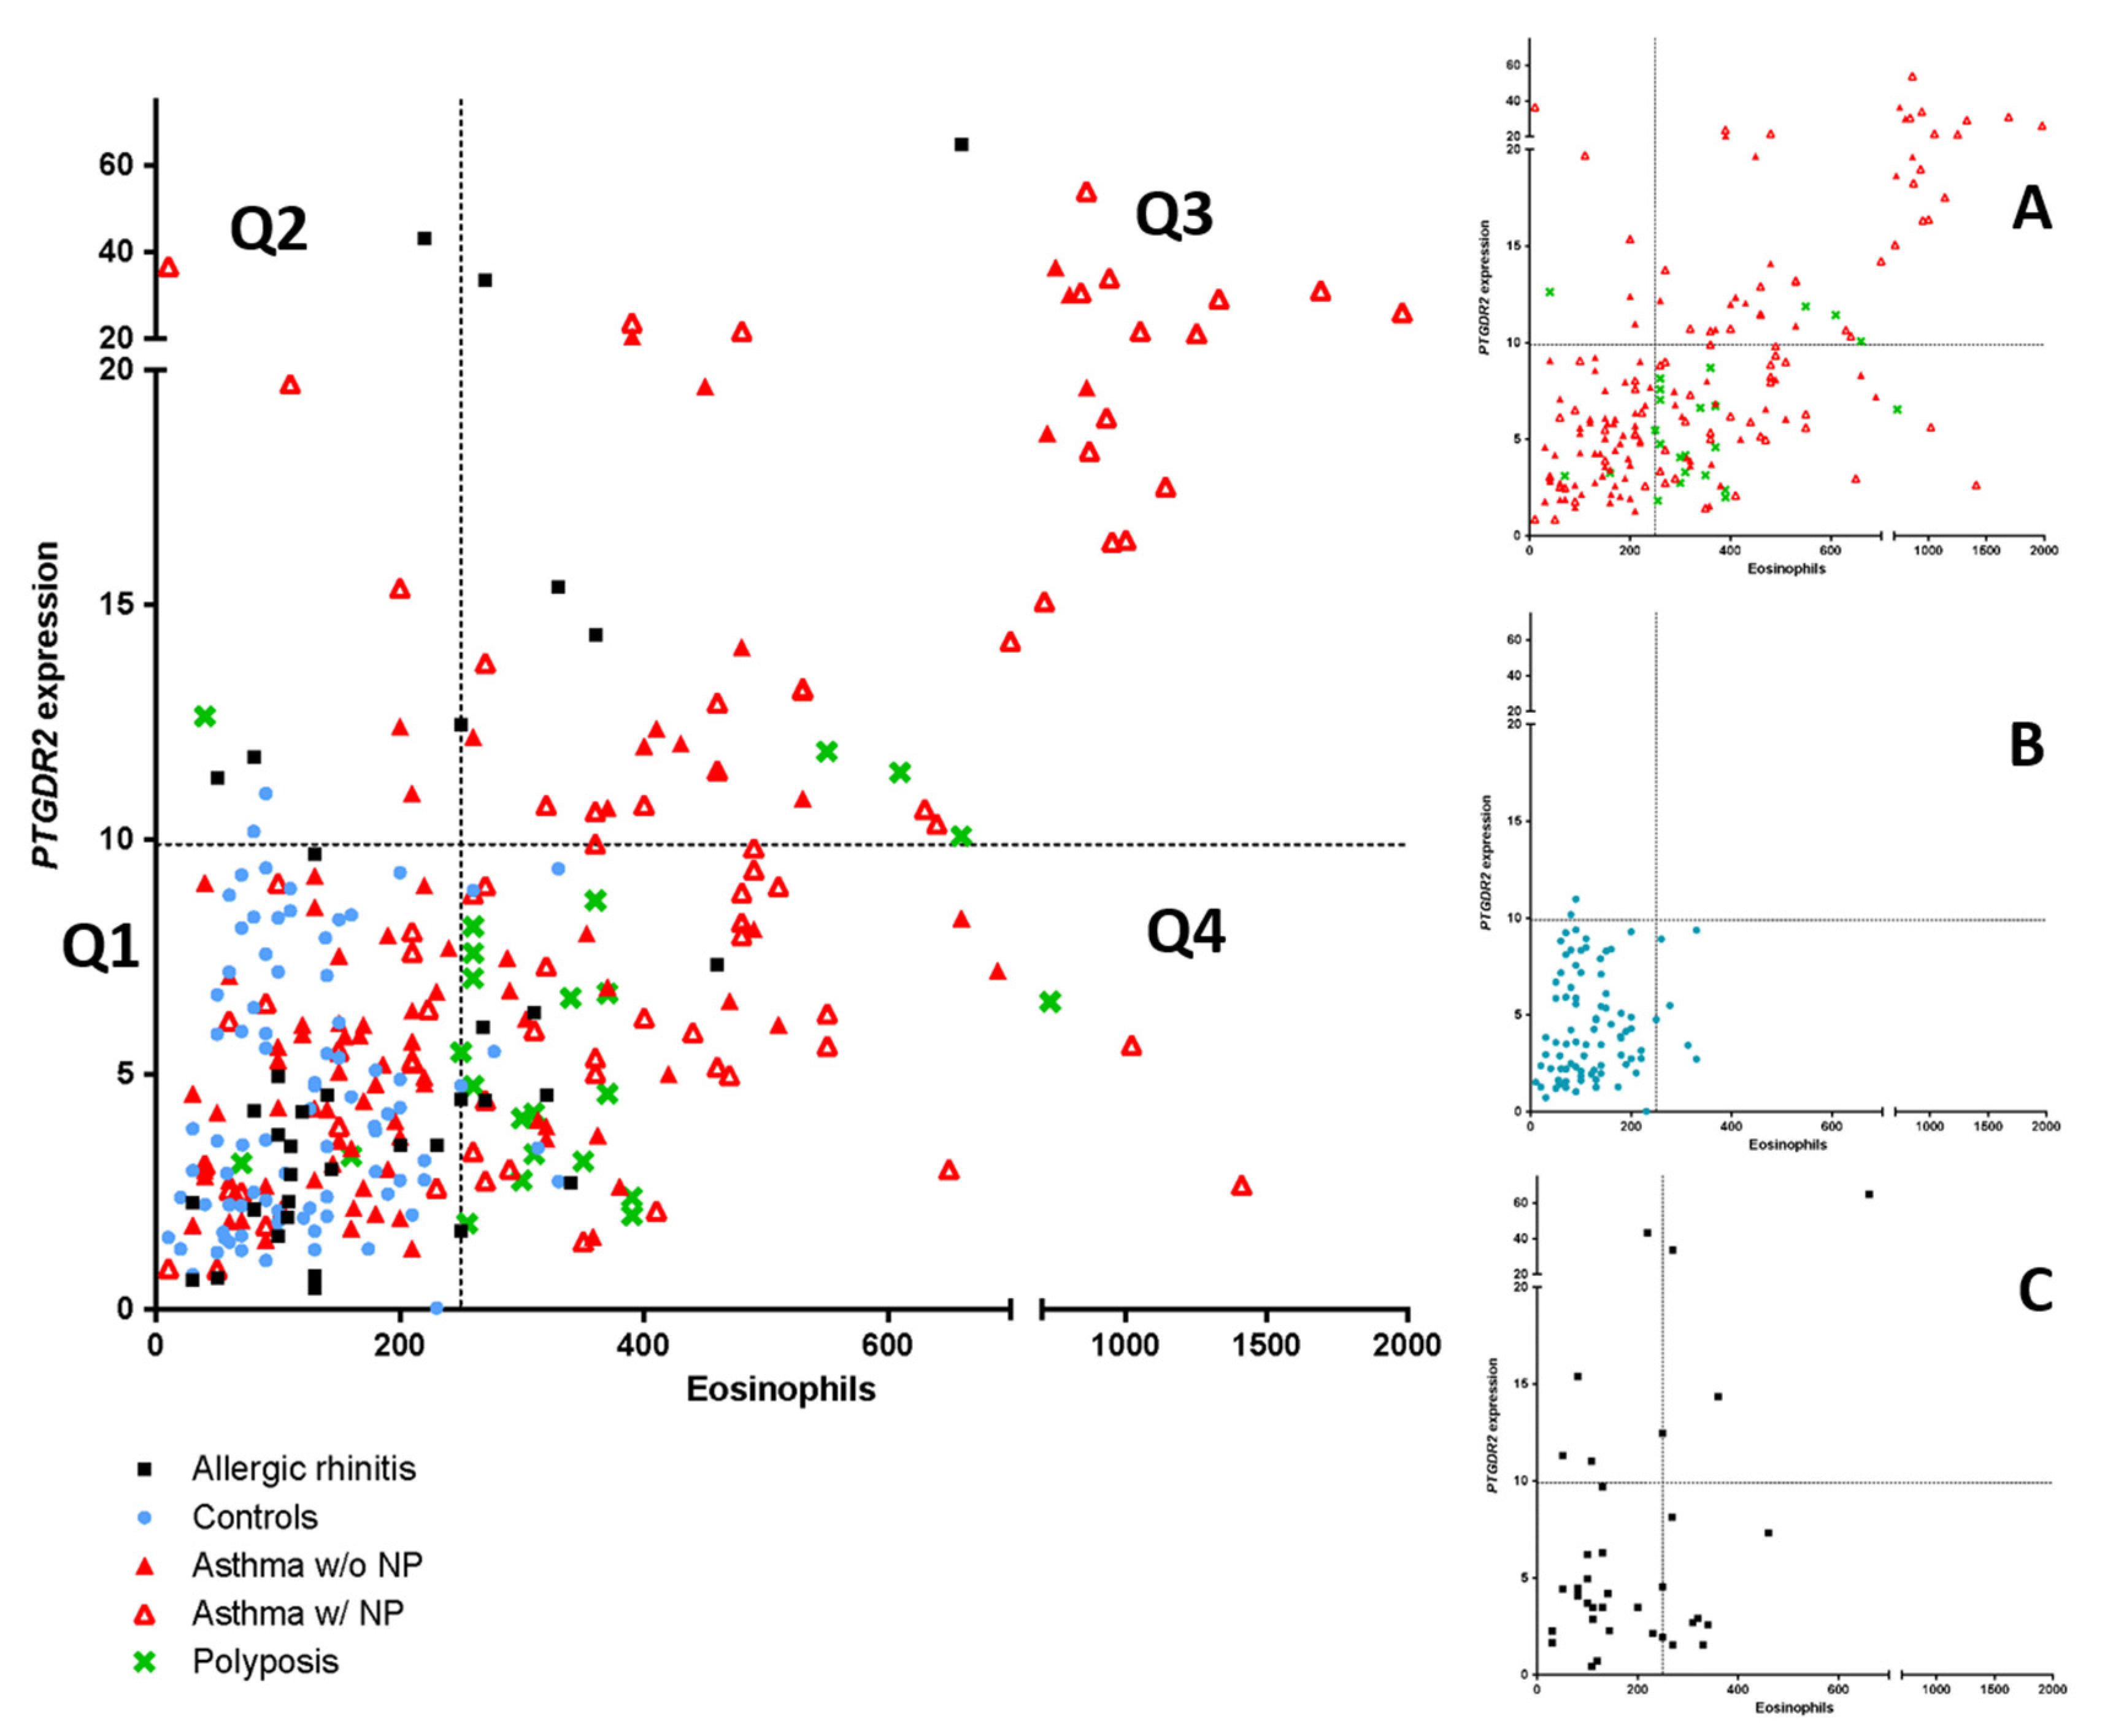
As PTGDR2 mRNA expression could be a possible biomarker for asthma, a comparison with peripheral blood eosinophil count using an ROC curve analysis was performed. The ROC curve analysis identified blood eosinophil counts as the best global predictor of patients [0.790 (0.741–0.838)] (p < 0.05). However, when establishing a positivity cutoff of ≥250 eosinophils peripheral blood eosinophil (specificity ≥ 95%), 46.5% (n = 114) of patients of the global sample were erroneously classified as false negatives. In this case, using the PTGDR2 expression test with a cutoff of 9.3, which also has a specificity of ≥95%, we were able to identify 11 patients (10%) from the total of false negatives. In Figure 3, the mentioned above cutoffs (≥250 eosinophils and ≥9.3 PTGDR2 expression) determine four quadrants (Q1, Q2, Q3, Q4); these patients were located in the Q2 quadrant and were distributed into the following groups: Rhinitis (4 patients), asthma with polyposis (3 patients, including one with AERD), asthma without polyposis (3 patients) and polyposis without asthma (one patient). This result suggests that the PTGDR2 expression test is a more specific biomarker in patients with low eosinophil values (<250 eosinophils), giving additional information to eosinophil levels.

Figure 3.
Scatter plot of the linear relationship of PTGDR2 expression and peripheral eosinophil counts (left panel). Comparison among asthma patients with and without polyposis, simple polyposis, allergic rhinitis, and controls are shown. (Panels A–C) show the main groups independently. Four quadrants were obtained by dividing according to a positivity cutoff of 250 eosinophils cells/µL (Specificity > 95%) and a cutoff of 9.3-fold difference for PTGDR2 expression (Specificity >95%): Q1 (EO < 250 cells/µL; PTGDR2 < 9.4-fold); Q2 (EO < 250 cells/µL; PTGDR2 > 9.3-fold); Q3 (EO > 250 cells/µL; PTGDR2 > 94-fold); Q4 (EO > 250 cells/µL; PTGDR2 < 9.3-fold).
In addition, when we performed the ROC curve analysis in the group of asthmatic patients vs non-asthmatic, the area under the curve (AUC) for PTGDR2 [0.612 (0.533–0.691)] is higher (not significant p > 0.05) than for eosinophils [0.587 (0.511–0.663)]. Exploring the CRSwNP patients with or without asthma, we also found a higher (not significant p > 0.05) AUG for PTGDR2 [0.672 (0.566–0.778)] than for eosinophils [0.597 (0.486–0.707)]. Finally, in the case of asthma with CRSwNP, with or without NSAID intolerance respiratory, a higher (not significant p > 0.05) AUC was also found for PTGDR2 than for eosinophils (Table 7).
Table 7.
ROC curve analysis in patients.
A moderate correlation (r = 0.587, p < 0.01) between PTGDR2 expression and eosinophil counts was found in the group of asthmatics. However, streaking differences in PTGDR2 expression were detected in asthmatic patients with similar baseline blood eosinophil levels (Figure 3). Notably, two groups focused our attention, i.e., those with low eosinophil levels and high PTGDR2 expression (quadrant 2) and those with high eosinophil counts and low PTGDR2 expression (quadrant 4) (Figure 3, Table 8 and Table 9). This fact was mainly observed in asthmatic patients with CRSwNP and patients with allergic rhinitis (Figure 3). The phenotypic and clinical characteristics of different quadrants are shown in Table 8. Notably, we found significant differences in PTGDR2 expression among different quadrants using post hoc tests (p < 0.001). The distribution among the four quadrants is shown in Table 9. All observed frequencies (control and patient groups) were associated with the corresponding quadrant (p < 0.05; using χ2 test). It suggests that the combination of the selected cutoffs could efficiently discriminate the patient groups studied.
Table 8.
Phenotypic and clinic characteristics of the four quadrants obtained by dividing according to values for eosinophils count (250 cells/µL) and PTGDR2 expression in controls (9.3-fold difference) both with a specificity ≥ 95%).
Table 9.
Distribution of controls and patients among the four quadrants obtained by dividing according to values for eosinophil counts (≥250 cells/µL) and PTGDR2 expression in controls (≥9.3-fold difference), both with a specificity ≥ 95%.
3.5. Flow Cytometry
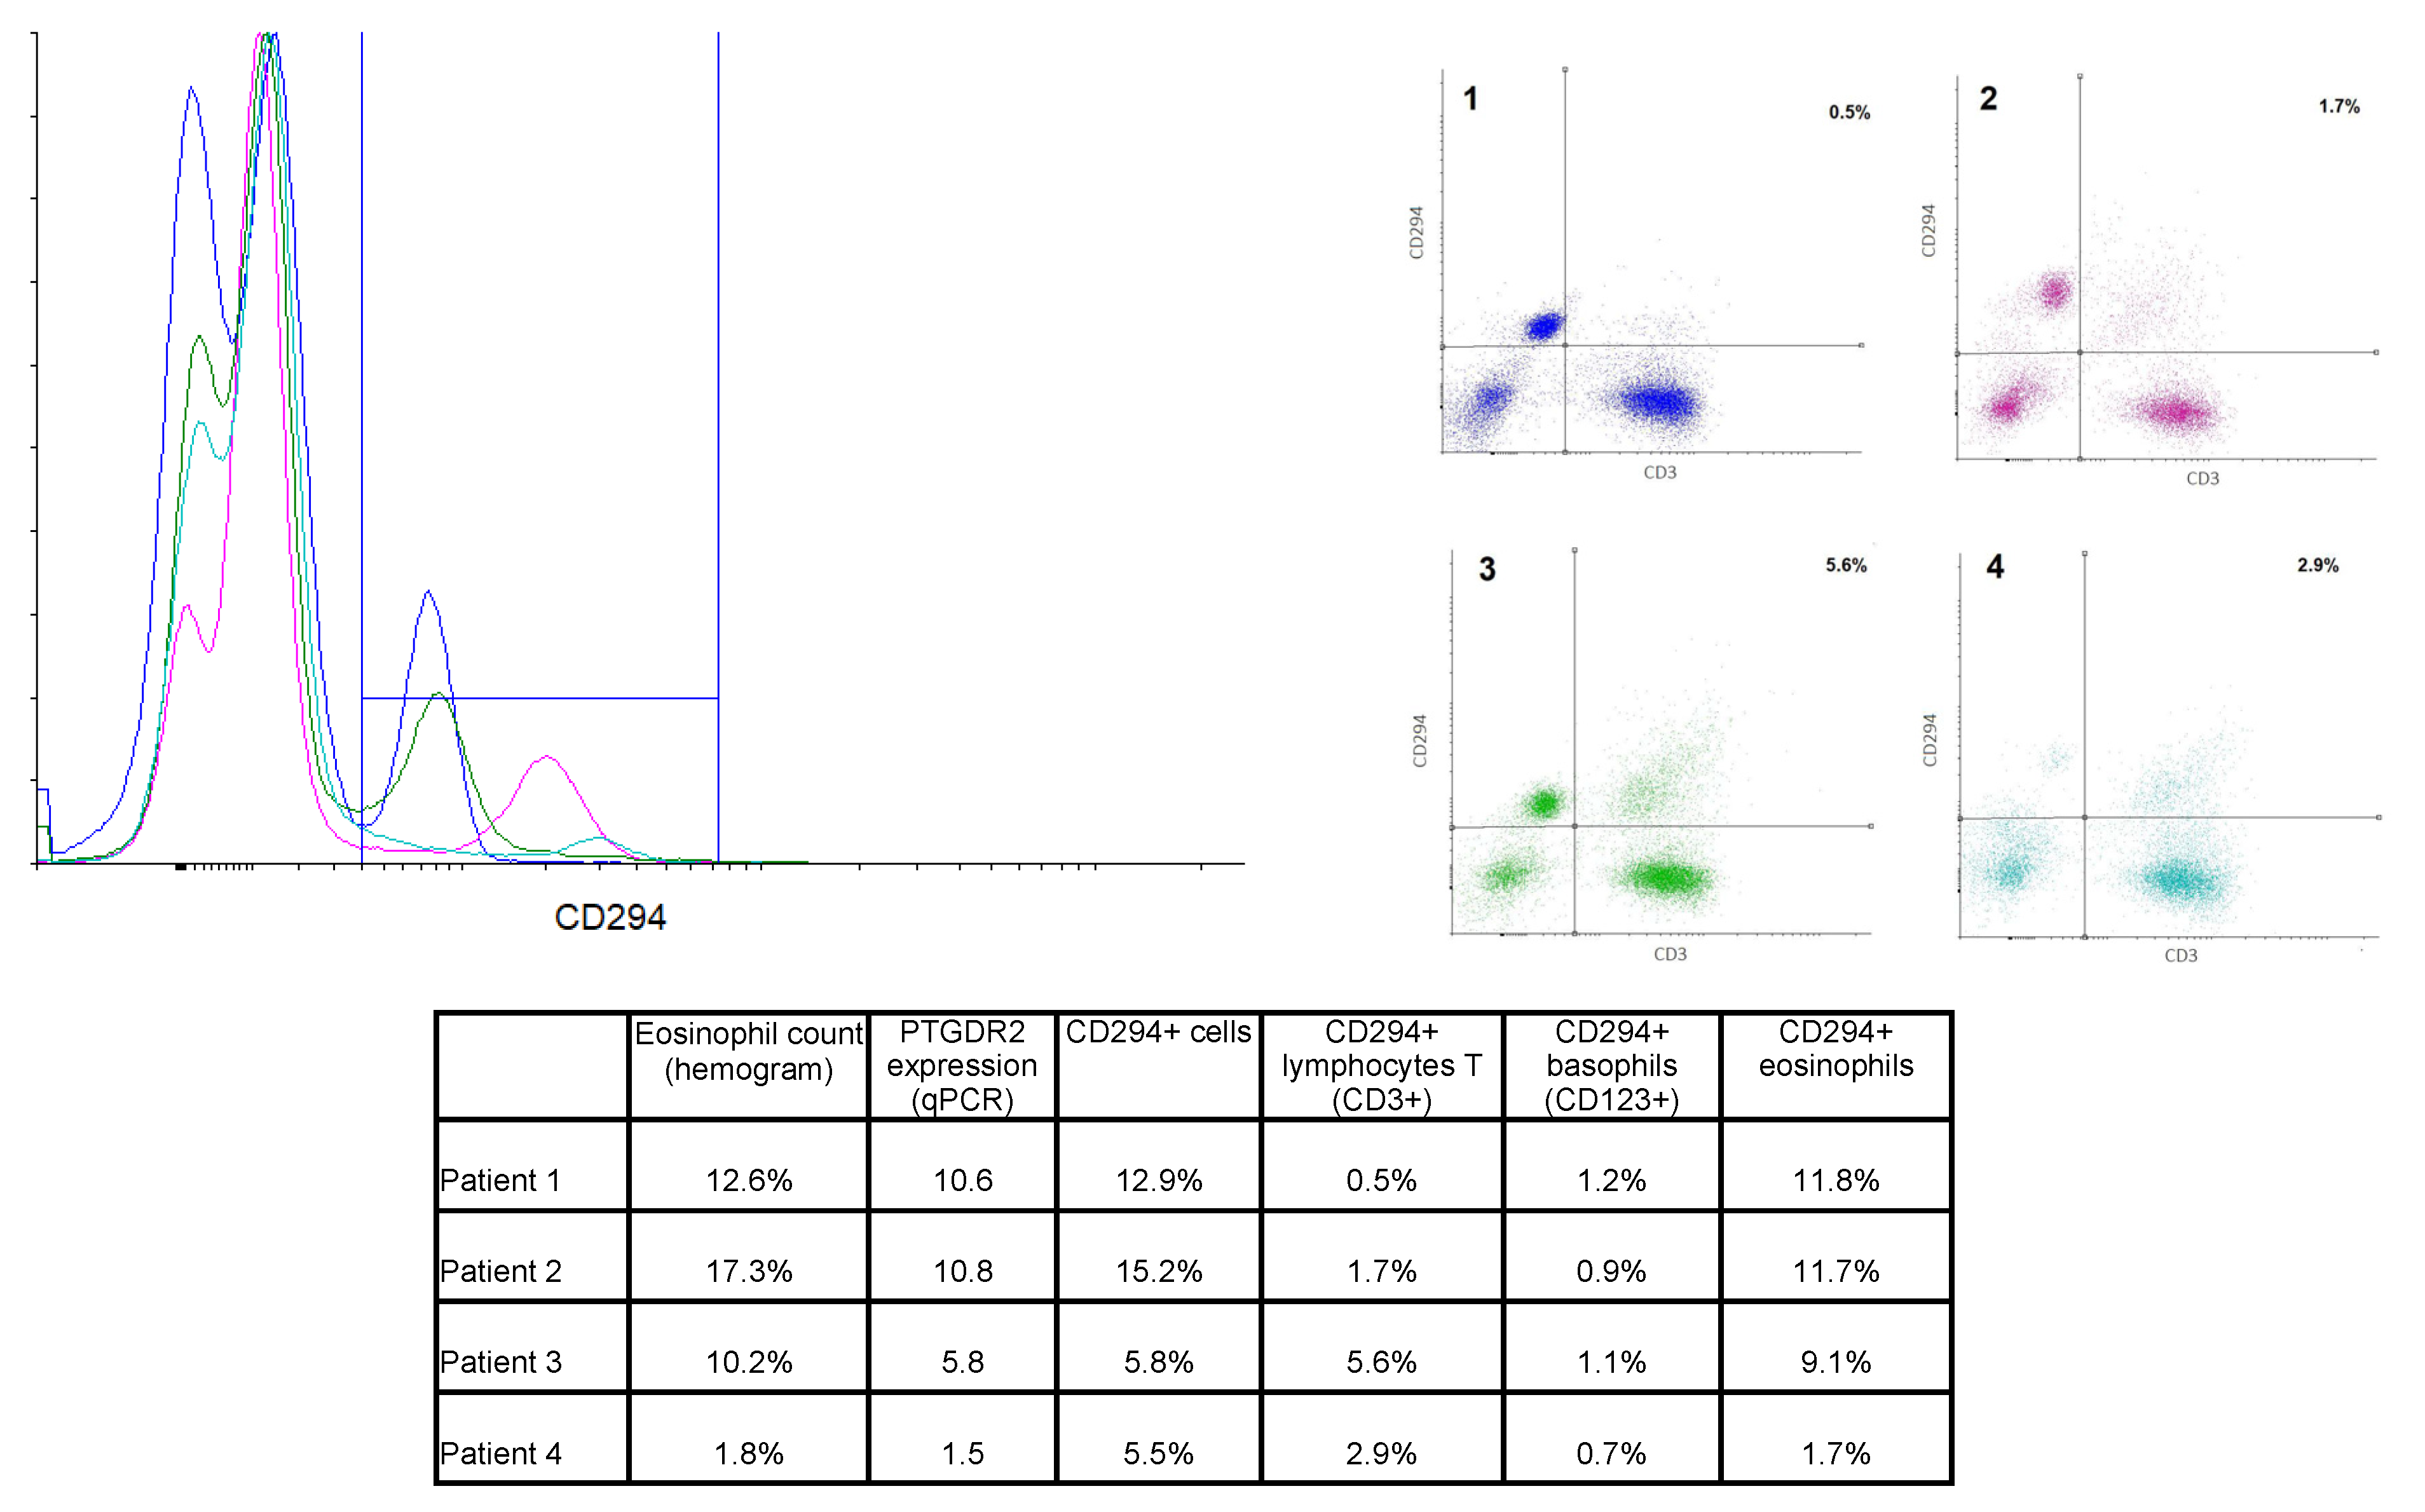
PTGDR2 PBMCs were labeled using specific antibodies for lymphocytes T (CD45+CD3+) and basophils (CD123+). Eosinophils were identified by their autofluorescence. Cells were also labeled with anti-PTGDR2 (CD294) to determine the protein expression on the cell surface. Results from four representative patients are shown in Figure 4. Patients 2 and 3 were diagnosed with AERD, patient 1 had asthma and bronchospasm with NSAID but not nasal polyposis, and patient 4 had atopic asthma.
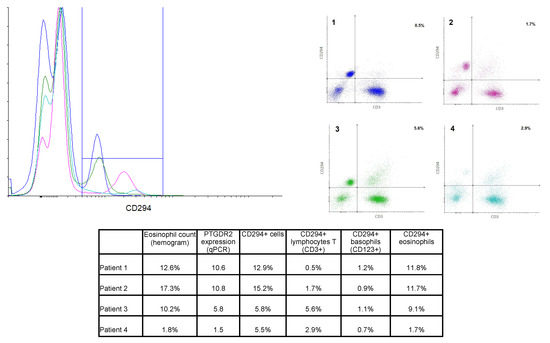
Figure 4.
Overlay histogram and dot plots from 4 selected patients. Left panel: Overlay histogram showing CD294+ cells in all 4 patients. Right panel: Dot plot of CD3-CD294 labeling, percentages of the right upper quadrant (CD3+CD294+ cells) are shown. Color code was kept in both graphs. Lower table: Percentage of the different CD294+ cell population in comparison to eosinophil counts and PTGDR2 expression for the selected four patients.
Total CD294+ cells ranged from 0.7% to 16% of total cells, and a moderate correlation with PTGDR2 gene expression was found (R2 = 0.6077). Eosinophils were, as expected, the most abundant CD294+ population. Eosinophil count (as per hemogram) was found to correlate with the percentage of CD294+ eosinophil (r2 = 0.925, n = 12). Thus, patients with the highest eosinophil counts in peripheral blood showed the highest CD294+ labeling on eosinophils (e.g., patients 1 and 2). However, some differences could be appreciated between these two patients. While the eosinophil CD294+ labeling was quite similar (11.8% and 11.7%), total CD294+ labeling differed due to differences in CD3+CD294+ cell percentage, as the level in patient 2 was three-fold that of patient 1 (see table in Figure 4).
Moreover, patients 3 and 4 showed similar levels of CD294+ labeling despite having strikingly different eosinophil counts, most likely due to a greater percentage of CD3+CD294+ cells, i.e., CD294+ T cells.
According to these results, eosinophil counts and other biomarkers, such as PTGDR2 expression, might provide a more comprehensive view of the role of several cell populations, thus contributing to classifying patients in a more effective, personalized way.
4. Discussion
Using whole-transcriptome RNAseq, we explored differentially expressed genes in peripheral blood of asthmatics and healthy individuals. A total of ten significantly upregulated and ten downregulated genes were identified as the topmost differentially expressed. The protein-protein interaction network revealed a cluster of upregulated genes associated with T2 asthma that could further consider acting as asthma biomarkers. PTGDR2, one of the most differentially expressed genes, was chosen as a candidate because different antagonists against PTGDR2 were being developed as a therapy for T2 asthma [35,36,37]. Furthermore, PTGDR2 expression was a significant predictor variable (p < 0.05) when adjusted for white blood cell subtypes (Table S3), which should be taken into account when interpreting heterogeneous samples as blood samples [38]. Then, we underwent the validation study in peripheral blood in a different and broader population of patients. We found statistically significant higher expression levels in patients with asthma, particularly in patients with allergic asthma and AERD as comorbidities.
Access to high-throughput technologies has made transcriptomic approaches being increasingly applied in the field of allergic diseases. RNAseq technology can thus find transcripts that might become future biomarkers [39]. In the present study, amongst the top 20 transcripts differentially expressed, PTGDR2 was one of the most differentially overexpressed (Table 2). Interestingly, using the protein-protein interaction network software STRING, PTGDR2 was involved in a network cluster with HRH4, ALOX15, CYSLTR2, GPR34, IL5Rα, and FCRL5 (Figure 1). The genes coding for these proteins were significantly upregulated in our transcriptomic analysis and related to the T2 asthma signature [37,40,41,42,43,44,45,46,47]. In a recent whole blood transcriptomic study of 41 severe asthma patients, in which gene expression levels in peripheral blood were compared at baseline and after four months of treatment with benralizumab [15], significant reductions in the expression of genes associated with eosinophilic inflammatory responses, such as PTGDR2, ALOX15, IL5RA, SMPD3, CLC, HRH4, CYSLTR2, and RAB44, were observed. That is in agreement with our transcriptional study since these genes were also at the top of our list of genes differentially expressed in asthma. We have recently observed different expression levels of the IL5RA gene in asthmatic patients with a possible role in response to benralizumab treatment [48]. PTGDR2 was also found differentially expressed in a sputum cell transcriptomic expression study of 84 subjects with asthma compared to 27 healthy controls [49]. PTGDR2 has been related to inflammatory cell activation and recruitment in vitro and in vivo [50,51,52]. Furthermore, PTGDR2+ T cells have been found elevated in nasal mucosa and skin during allergic inflammation in humans [53,54], suggesting a possible utility as a biomarker. In this study, we validated the expression of PTGDR2 in a larger cohort of asthmatic patients using qPCR (Table 5), showing significantly higher expression levels of PTGDR2 in patients than in controls, suggesting that PTGDR2 levels could differentiate asthmatics patients from controls. Besides, we observed significantly higher levels in certain types of asthma, such as atopic and non-atopic asthma. Notably, the highest expression levels were related to more severe and complex asthma (Table 6). These data are in line with Palikhe et al. [55], who found higher levels of PTGDR2 mRNA in peripheral blood of severe than mild/moderate asthmatics. Increased PTGDR2 mRNA levels have also been described in the bronchoalveolar lavage of severe asthma patients [56]. We also found that PTGDR2 was not differently expressed in patients with allergic rhinitis without concomitant asthma, indicating that the levels of PTGDR2 in peripheral blood might help differentiate allergic patients with and without asthma. A similar result was observed in patients with CRSwNP, in which PTGDR2 expression levels were only increased in patients with concomitant asthma, suggesting that they could also help differentiate CRSwNP patients with and without asthma. Whether these findings could be helpful in clinical practice or even have a prognostic value (i.e., in the evolution towards asthma) remains unknown. Interestingly, the highest PTGDR2 levels (54.1-fold change) corresponded to a young male patient with intermittent asthma and CRSwNP who had asthma exacerbations only when aspirin was taken, without symptoms or needed medication out of these episodes. Although it is highly speculative, maybe the high levels of PTGDR2 expression could suggest a predisposition for evolution to more severe forms of asthma. In any case, these patients should be monitored to evaluate whether the severity of asthma will increase in the future. If this were to occur, the use of PTGDR2 as a biomarker of asthma severity could identify patients long before they have severe asthma episodes.
There was a moderate positive correlation between PTGDR2 expression and peripheral blood eosinophils count in most asthma groups (Table 5). Interestingly, there were patients in which results were divergent, suggesting that the expression levels of PTGDR2 could add relevant information to eosinophil levels. Indeed, as shown in Figure 3, for a similar level of eosinophils, different levels of PTGDR2 were found, showing significant inter-individual variability. This fact was mainly observed in asthmatic patients with CRSwNP and patients with allergic rhinitis (Figure 3). The highest PTGDR2 expression in Q2 corresponded with a polysensitized allergic rhinitis patient (43.2-fold), and two asthmatic patients with CRSwNP and sensitivity to NSAIDs (AERD) (36.7- and 19.7-fold, respectively) (Figure 3). On the contrary, the highest eosinophil counts in Q4 corresponded to two asthmatic patients with CRSwNP (140 and 650 cells/µL, respectively). Interestingly, the number of the CRSwNP patients without asthma was higher in Q4 than in other quadrants (73.1%) (Table 9). Whether this fact could add relevant prognostic information remains to be elucidated.
We found that PTGDR2 (CD294) positive lymphocytes should also be considered when studying PTGDR2 expressing cell populations. Although eosinophils were the most abundant CD294+ cells, some patients exhibited higher levels of CD3+CD294+ than others with similar CD294+ eosinophil levels, showing that T cells could also be relevant. Accordingly, Palihke et al. reported that PTGDR2 expression levels correlated with PTGDR2 mean fluorescent intensity on CD4+CRTH2+ T cells but not with CRTH2+ eosinophils assessed by flow cytometry [55]. The authors also found that severe asthmatics with a high level of PTGDR2 mRNA had significantly more surface PTGDR2 in CD4+ T cells compared with those with low levels of PTGDR2 mRNA, suggesting that the high level of PTGDR2 mRNA in severe asthmatics could be driven by the CD4+ T cell population [55]. In this sense, we found no significant correlation with eosinophil counts in patients with AERD, who had the highest levels of PTGDR2 expression. Moreover, CD3+CD294+ cell percentages in some AERD patients (e.g., patient 3) were higher than in others (e.g., patient 2), showing that this cell population could be relevant at least in a group of AERD patients. Also in these patients, levels of PGD2 are high, both basally and during acute reactions to NSAID [57]. PGD2 overproduction occurs secondary to mast cell and eosinophil activation through thromboxane receptors, PTGDR2 and PTGDR, thus stimulating Th2 cells [57]. Therefore, PTGDR2 mRNA expression levels could be particularly helpful in AERD patients.
In recent years there has been a significant research effort in the field of PTGDR2 antagonists [3,5,40,58]. Although some phase II studies showed promising asthma results [59,60,61], LUSTER-1 and LUSTER-2 phase III trials were discouraging [62], resulting in no further development of fevipiprant for asthma [63]. Two-thirds of the LUSTER trial patients should have blood eosinophil counts of 250 cells/µL or higher at inclusion. Maybe the determination of PTGDR2 levels could have provided better patient selection and given better results. A clear example is what happened with mepolizumab, which failed in the initial studies due to an inappropriate patient selection [64]. Kerstjens and Gosens [65], commenting about LUSTER results, considered that, despite these negative results, this was not the end of a chapter but the beginning of a new one. A combination of PTGDR2 mRNA and blood eosinophils count could provide an optimal predictive value for asthma, CRSwNP, and AERD. That might be particularly relevant in those patients with low eosinophils and high PTGDR2 expression levels.
One of the limitations of the study is that it is a unicentric study. Nevertheless, this fact gives uniformity to the study. Additionally, we have mainly focused on PTGDR2, and other genes may also be relevant in response to treatments. Nevertheless, we selected PTGDR2 by its crucial implication in the immunology of type 2-asthma and because different antagonists are directed against this molecule.
5. Conclusions
In the present work, we explored PTGDR2 levels in peripheral blood as a possible biomarker demonstrating differential expression levels between asthmatic and controls and progressively increasing PTGDR2 levels as the severity of asthma raised. Finally, we found patients with low eosinophil counts and high PTGDR2 levels and vice versa, thus providing additional information to peripheral eosinophil counts. Concerning these findings, we propose that peripheral blood mRNA levels of different genes (such PTGDR2) should be explored as new minimally invasive biomarkers that might assist in the molecular phenotyping of asthma and selecting patients for treatment with specific antagonists.
Supplementary Materials
The following are available online at https://www.mdpi.com/article/10.3390/jpm11090827/s1, Table S1: White blood cell counts in the population of the transcriptomic analysis, Table S2: Clinical information of the population in the transcriptomic analysis, Table S3: Multivariate logistic regression of the most differentially expressed genes in the transcriptomic analysis after adjustment with white blood cell counts.
Author Contributions
Conceptualization, I.D., M.I.-G., A.G.-S. and C.S.; methodology, A.G.-S., M.E., M.J.M., J.P.-P., C.M.-G., M.G.-M., I.E.-G., J.R.-G. and J.C.T.; software, A.G.-S., M.E., M.J.M., J.C.T. and C.S.; validation, A.G.-S., M.E., M.J.M., C.M.-G. and C.S.; resources, C.M.-G., M.G.-M., J.R.-G., I.E.-G. and J.C.T.; data curation, A.G.-S., M.E., M.J.M., J.P.-P., C.M.-G., M.G.-M., I.E.-G., J.R.-G., J.C.T., M.I.-G. and C.S.; writing—original draft preparation, A.G.-S., I.D., M.I.-G. and C.S.; writing—review and editing, A.G.-S., M.E., M.J.M., J.P.-P., I.D., C.S., M.I.-G., M.G.-M., J.R.-G., I.E.-G., C.M.-G. and J.C.T.; supervision, I.D., M.I.-G. and C.S.; funding acquisition, I.D., M.I.-G. and C.S. All authors have read and agreed to the published version of the manuscript.
Funding
This research was funded by the Instituto de Salud Carlos III and the European Regional Development Fund, grants numbers PI17/00818 and PI20/00268 and a Juan Rodes contract for IEG (JR19/00029), a grant from Junta de Castilla y León co-financed by the European Regional Development Fund (IES161P20) and a grant from the Gerencia Regional de Salud de la Junta de Castilla y León (GRS2156/A/20), a 2019 grant of the Sociedad Española de Alergia e Inmunología Clínica (SEAIC), the Consejería de Educación-Plan operativo de Empleo Juvenil de Castilla y León and the European Social Fund and Youth Employment Initiative and the Instituto de Salud Carlos III’s Thematic Network of Cooperative Research in Health—RETICS (Red temática de investigación en salud Asma, Reacciones Adversas y Alérgicas, ARADYAL), grant number RD16/0006/0019 and RD16/0006/0001.
Institutional Review Board Statement
The study was conducted according to the guidelines of the Declaration of Helsinki, and approved by the Ethics Committee of the Institute for Biomedical Research of Salamanca (PI 2020-02-433).
Informed Consent Statement
Informed consent was obtained from all subjects involved in the study.
Data Availability Statement
The required data is now publicly accessible in the NCBI repository with the code PRJNA686899.
Acknowledgments
We thank Alicia Landeira-Viñuela and Clara Sanabria-Luis for their contribution as technicians in this work. The authors also thank the Cell Sorting Service (NUCLEUS, University of Salamanca) for technical assistance.
Conflicts of Interest
I.D. reports personal fees from Novartis, Sanofi, GSK, ASTRA-ZENECA, LETI, grants, and personal fees from THERMOFISHER outside the submitted work. J.R.-G. reports personal fees from Novartis, Sanofi, AstraZeneca, GSK, TEVA outside the submitted work. The rest of authors declare no conflict of interest. The funders had no role in the design of the study; in the collection, analyses, or interpretation of data; in the writing of the manuscript, or in the decision to publish the results.
References
- Global Initiative for Ashtma. Global Strategy for Asthma Management and Prevention, 2020. 2020. Available online: https://ginasthma.org/ (accessed on 20 March 2021).
- Soriano, J.B.; Abajobir, A.A.; Abate, K.H.; Abera, S.F.; Agrawal, A.; Ahmed, M.B.; Aichour, A.N.; Aichour, I.; Aichour, M.T.E.; Alam, K.; et al. Global, regional, and national deaths, prevalence, disability-adjusted life years, and years lived with disability for chronic obstructive pulmonary disease and asthma, 1990–2015: A systematic analysis for the Global Burden of Disease Study 2015. Lancet Respir. Med. 2017, 5, 691–706. [Google Scholar] [CrossRef] [Green Version]
- Peters, M.C.; Wenzel, S.E. Intersection of biology and therapeutics: Type 2 targeted therapeutics for adult asthma. Lancet 2020, 395, 371–383. [Google Scholar] [CrossRef]
- Robinson, D.; Humbert, M.; Buhl, R.; Cruz, A.A.; Inoue, H.; Korom, S.; Hanania, N.A.; Nair, P. Revisiting Type 2-high and Type 2-low airway inflammation in asthma: Current knowledge and therapeutic implications. Clin. Exp. Allergy 2017, 47, 161–175. [Google Scholar] [CrossRef]
- Papi, A.; Brightling, C.; Pedersen, S.E.; Reddel, H.K. Asthma. Lancet 2018, 391, 783–800. [Google Scholar] [CrossRef]
- Isidoro-García, M.; Sánchez-Martín, A.; García-Sánchez, A.; Sanz, C.; García-Berrocal, B.; Dávila, I. Pharmacogenetics and the treatment of asthma. Pharmacogenomics 2017, 18, 1271–1280. [Google Scholar] [CrossRef]
- Taylor, D.R. Using biomarkers in the assessment of airways disease. J. Allergy Clin. Immunol. 2011, 128, 927–934. [Google Scholar] [CrossRef]
- Ober, C. Asthma Genetics in the Post-GWAS Era. Ann. Am. Thorac. Soc. 2016, 13 (Suppl. 1), S85–S90. [Google Scholar]
- Park, H.W.; Weiss, S.T. Understanding the Molecular Mechanisms of Asthma through Transcriptomics. Allergy Asthma Immunol. Res. 2020, 12, 399–411. [Google Scholar] [CrossRef]
- Croteau-Chonka, D.C.; Qiu, W.; Martinez, F.D.; Strunk, R.C.; Lemanske, R.F.; Liu, A.H.; Gilliland, F.D.; Millstein, J.; Gauderman, W.J.; Ober, C.; et al. Gene Expression Profiling in Blood Provides Reproducible Molecular Insights into Asthma Control. Am. J. Respir. Crit. Care Med. 2017, 195, 179–188. [Google Scholar] [CrossRef]
- Yeh, Y.-L.; Su, M.-W.; Chiang, B.-L.; Yang, Y.-H.; Tsai, C.-H.; Lee, Y.L. Genetic profiles of transcriptomic clusters of childhood asthma determine specific severe subtype. Clin. Exp. Allergy 2018, 48, 1164–1172. [Google Scholar] [CrossRef]
- Bigler, J.; Boedigheimer, M.; Schofield, J.P.R.; Skipp, P.J.; Corfield, J.; Rowe, A.; Sousa, A.R.; Timour, M.; Twehues, L.; Hu, X.; et al. A Severe Asthma Disease Signature from Gene Expression Profiling of Peripheral Blood from U-BIOPRED Cohorts. Am. J. Respir. Crit. Care Med. 2017, 195, 1311–1320. [Google Scholar] [CrossRef]
- Persson, H.; Kwon, A.T.; Ramilowski, J.A.; Silberberg, G.; Söderhäll, C.; Orsmark-Pietras, C.; Nordlund, B.; Konradsen, J.R.; de Hoon, M.J.L.; Melén, E.; et al. Transcriptome analysis of controlled and therapy-resistant childhood asthma reveals distinct gene expression profiles. J. Allergy Clin. Immunol. 2015, 136, 638–648. [Google Scholar] [CrossRef] [Green Version]
- Bjornsdottir, U.S.; Holgate, S.T.; Reddy, P.S.; Hill, A.A.; McKee, C.M.; Csimma, C.I.; Weaver, A.A.; Legault, H.M.; Small, C.G.; Ramsey, R.C.; et al. Pathways activated during human asthma exacerbation as revealed by gene expression patterns in blood. PLoS ONE 2011, 6, e21902. [Google Scholar] [CrossRef] [PubMed] [Green Version]
- Nakajima, M.; Matsuyama, M.; Arai, N.; Yamada, H.; Hyodo, K.; Nonaka, M.; Kitazawa, H.; Yoshida, K.; Shigemasa, R.; Morishima, Y.; et al. Identification of whole blood gene expressions correlated with responsiveness to benralizumab. J. Allergy Clin. Immunol. 2020. [Google Scholar] [CrossRef]
- San Segundo-Val, I.; García-Sánchez, A.; Sanz, C.; Cornejo-García, J.A.; Isidoro-García, M.; Dávila, I. Promoter genotyping and mRNA expression– based analysis of the PTGDR gene in allergy. J. Investig. Allergol. Clin. Immunol. 2020, 30, 117–126. [Google Scholar] [CrossRef] [Green Version]
- GEMA 4.4. Guia Española Para el Manejo del Asma. Available online: https://www.gemasma.com/ (accessed on 20 December 2019).
- Valero, A.; Muñoz, R. Comments on the classification of allergic rhinitis according to the ARIA guidelines 2008. J. Investig. Allergol. Clin. Immunol. 2008, 18, 324–326. [Google Scholar]
- Kim, D.; Pertea, G.; Trapnell, C.; Pimentel, H.; Kelley, R.; Salzberg, S.L. TopHat2: Accurate alignment of transcriptomes in the presence of insertions, deletions and gene fusions. Genome Biol. 2013, 14, R36. [Google Scholar] [CrossRef] [Green Version]
- Li, H. Aligning sequence reads, clone sequences and assembly contigs with BWA-MEM. arXiv 2013, arXiv:1303.3997. [Google Scholar]
- Trapnell, C.; Williams, B.A.; Pertea, G.; Mortazavi, A.; Kwan, G.; van Baren, M.J.; Salzberg, S.L.; Wold, B.J.; Pachter, L. Transcript assembly and quantification by RNA-Seq reveals unannotated transcripts and isoform switching during cell differentiation. Nat. Biotechnol. 2010, 28, 511–515. [Google Scholar] [CrossRef] [Green Version]
- Love, M.I.; Huber, W.; Anders, S. Moderated estimation of fold change and dispersion for RNA-seq data with DESeq2. Genome Biol. 2014, 15, 550. [Google Scholar] [CrossRef] [PubMed] [Green Version]
- Hochberg, Y.B.; Benjamini, Y. Controlling the False Discovery Rate: A Practical and Powerful Approach to Multiple Testing. J. R. Stat. Soc. 1995, 57, 289–300. [Google Scholar]
- Livak, K.J.; Schmittgen, T.D. Analysis of Relative Gene Expression Data Using Real-Time Quantitative PCR and the 2−ΔΔCT Method. Methods 2001, 25, 402–408. [Google Scholar] [CrossRef] [PubMed]
- Primer 3.0. Available online: http://bioinfo.ut.ee/primer3-0.4.0/ (accessed on 20 January 2020).
- Beacon Desingner. Available online: www.premierbiosoft.com (accessed on 20 January 2020).
- Bustin, S.A.; Benes, V.; Garson, J.A.; Hellemans, J.; Huggett, J.; Kubista, M.; Mueller, R.; Nolan, T.; Pfaffl, M.W.; Shipley, G.L.; et al. The MIQE Guidelines: Minimum Information for Publication of Quantitative Real-Time PCR Experiments. Clin. Chem. 2009, 55, 611–622. [Google Scholar] [CrossRef] [Green Version]
- Wacholder, S. Population Stratification in Epidemiologic Studies of Common Genetic Variants and Cancer: Quantification of Bias. J. Natl. Cancer Inst. 2000, 92, 1151–1158. [Google Scholar] [CrossRef]
- Dávila, I.; García-Sánchez, A.; Estravís, M.; Landeira-Viñuela, A.; Iribarren-López, A.; Moreno-Jiménez, E.; Martín-García, C.; Moreno, E.; Sanz, C.; Isidoro-García, M. Relationship between CRTH2 mRNA expression in peripheral blood and IgE and eosinophil levels in adult patients with asthma. In Proceedings of the Allergy and Immunology; European Respiratory Society: Lausanne, Switzerland, 2019; p. PA535. [Google Scholar]
- García-Sánchez, A.; Marcos-Vadillo, E.; Sanz, C.; Estravís, M.; Isidoro-García, M.; Dávila, I. PTGDR expression is upregulated through retinoic acid receptors (RAR) mechanism in allergy. PLoS ONE 2019, 14, e0215086. [Google Scholar] [CrossRef] [Green Version]
- Domingo, C.; Palomares, O.; Sandham, D.A.; Erpenbeck, V.J.; Altman, P. The prostaglandin D2 receptor 2 pathway in asthma: A key player in airway inflammation. Respir. Res. 2018, 19, 189. [Google Scholar] [CrossRef]
- Kupczyk, M.; Kuna, P. Targeting the PGD2/CRTH2/DP1 Signaling Pathway in Asthma and Allergic Disease: Current Status and Future Perspectives. Drugs 2017, 77, 1281–1294. [Google Scholar] [CrossRef] [Green Version]
- Poswar, F.d.O.; Farias, L.C.; Fraga, C.A.d.C.; Bambirra, W.; Brito-Júnior, M.; Sousa-Neto, M.D.; Santos, S.H.S.; de Paula, A.M.B.; D’Angelo, M.F.S.V.; Guimarães, A.L.S. Bioinformatics, Interaction Network Analysis, and Neural Networks to Characterize Gene Expression of Radicular Cyst and Periapical Granuloma. J. Endod. 2015, 41, 877–883. [Google Scholar] [CrossRef]
- STRING. Available online: https://string-db.org/ (accessed on 20 January 2020).
- Liu, W.; Min, J.; Jiang, H.; Mao, B. Chemoattractant receptor-homologous molecule expressed on Th2 cells (CRTH2) antagonists in asthma: A systematic review and meta-analysis protocol. BMJ Open 2018, 8, e020882. [Google Scholar] [CrossRef] [Green Version]
- Marone, G.; Galdiero, M.R.; Pecoraro, A.; Pucino, V.; Criscuolo, G.; Triassi, M.; Varricchi, G. Prostaglandin D 2 receptor antagonists in allergic disorders: Safety, efficacy, and future perspectives. Expert Opin. Investig. Drugs 2019, 28, 73–84. [Google Scholar] [CrossRef] [PubMed]
- Wendell, S.G.; Fan, H.; Zhang, C. G Protein–Coupled Receptors in Asthma Therapy: Pharmacology and Drug Action. Pharmacol. Rev. 2020, 72, 1–49. [Google Scholar] [CrossRef] [Green Version]
- Kong, Y.; Rastogi, D.; Seoighe, C.; Greally, J.M.; Suzuki, M. Insights from deconvolution of cell subtype proportions enhance the interpretation of functional genomic data. PLoS ONE 2019, 14, e0215987. [Google Scholar] [CrossRef] [PubMed] [Green Version]
- Ivanova, O.; Richards, L.B.; Vijverberg, S.J.; Neerincx, A.H.; Sinha, A.; Sterk, P.J.; Maitland-van der Zee, A.H. What did we learn from multiple omics studies in asthma? Allergy 2019, 74, 2129–2145. [Google Scholar] [CrossRef] [Green Version]
- Corren, J. New Targeted Therapies for Uncontrolled Asthma. J. Allergy Clin. Immunol. Pract. 2019, 7, 1394–1403. [Google Scholar] [CrossRef]
- Thompson, M.D.; Takasaki, J.; Capra, V.; Rovati, G.E.; Siminovitch, K.A.; Burnham, W.M.; Hudson, T.J.; Bossé, Y.; Cole, D.E.C. G-Protein-Coupled Receptors and Asthma Endophenotypes. Mol. Diagn. Ther. 2006, 10, 353–366. [Google Scholar] [CrossRef] [PubMed]
- Stevens, W.W.; Staudacher, A.G.; Hulse, K.E.; Carter, R.G.; Winter, D.R.; Kato, A.; Suh, L.; Norton, J.E.; Huang, J.H.; Peters, A.T.; et al. Activation of the 15-lipoxygenase pathway in aspirin-exacerbated respiratory disease. J. Allergy Clin. Immunol. 2020. [Google Scholar] [CrossRef]
- Liu, T.; Barrett, N.A.; Kanaoka, Y.; Yoshimoto, E.; Garofalo, D.; Cirka, H.; Feng, C.; Boyce, J.A. Type 2 Cysteinyl Leukotriene Receptors Drive IL-33–Dependent Type 2 Immunopathology and Aspirin Sensitivity. J. Immunol. 2018, 200, 915–927. [Google Scholar] [CrossRef]
- Liang, Z.; Yan, B.; Liu, C.; Tan, R.; Wang, C.; Zhang, L. Predictive significance of arachidonate 15-lipoxygenase for eosinophilic chronic rhinosinusitis with nasal polyps. Allergy, Asthma Clin. Immunol. 2020, 16, 82. [Google Scholar] [CrossRef] [PubMed]
- Gu, Z.; Shen, Y.; Tang, X.-Y.; Ke, X.; Yao, H.-B.; Hong, S.-L.; Kang, H.-Y. Genetic risk of FCRL3 and FCRL5 polymorphisms in children with asthma and allergic rhinitis in a Chinese Han population. Int. J. Pediatr. Otorhinolaryngol. 2019, 120, 58–63. [Google Scholar] [CrossRef]
- Bel, E.H.; Wenzel, S.E.; Thompson, P.J.; Prazma, C.M.; Keene, O.N.; Yancey, S.W.; Ortega, H.G.; Pavord, I.D. Oral Glucocorticoid-Sparing Effect of Mepolizumab in Eosinophilic Asthma. N. Engl. J. Med. 2014, 371, 1189–1197. [Google Scholar] [CrossRef]
- Sridhar, S.; Liu, H.; Pham, T.H.; Damera, G.; Newbold, P. Modulation of blood inflammatory markers by benralizumab in patients with eosinophilic airway diseases. Respir. Res. 2019, 20, 1–12. [Google Scholar] [CrossRef] [PubMed]
- Elena-Pérez, S.; Heredero-Jung, D.H.; García-Sánchez, A.; Estravís, M.; Martin, M.J.; Ramos-González, J.; Triviño, J.C.; Isidoro-García, M.; Sanz, C.; Dávila, I. Molecular Analysis of IL-5 Receptor Subunit Alpha as a Possible Pharmacogenetic Biomarker in Asthma. Front. Med. 2021, 7. [Google Scholar] [CrossRef] [PubMed]
- Peters, M.C.; Ringel, L.; Dyjack, N.; Herrin, R.; Woodruff, P.G.; Rios, C.; O’Connor, B.; Fahy, J.V.; Seibold, M.A. A Transcriptomic Method to Determine Airway Immune Dysfunction in T2-High and T2-Low Asthma. Am. J. Respir. Crit. Care Med. 2019, 199, 465–477. [Google Scholar] [CrossRef] [PubMed]
- Böhm, E.; Sturm, G.J.; Weiglhofer, I.; Sandig, H.; Shichijo, M.; McNamee, A.; Pease, J.E.; Kollroser, M.; Peskar, B.A.; Heinemann, A. 11-Dehydro-thromboxane B 2, a Stable Thromboxane Metabolite, Is a Full Agonist of Chemoattractant Receptor-homologous Molecule Expressed on TH2 Cells (CRTH2) in Human Eosinophils and Basophils. J. Biol. Chem. 2004, 279, 7663–7670. [Google Scholar] [CrossRef] [PubMed] [Green Version]
- Gervais, F.G.; Cruz, R.P.G.; Chateauneuf, A.; Gale, S.; Sawyer, N.; Nantel, F.; Metters, K.M.; O’Neill, G.P. Selective modulation of chemokinesis, degranulation, and apoptosis in eosinophils through the PGD2 receptors CRTH2 and DP. J. Allergy Clin. Immunol. 2001, 108, 982–988. [Google Scholar] [CrossRef] [PubMed]
- Sandig, H.; Andrew, D.; Barnes, A.A.; Sabroe, I.; Pease, J. 9α,11β-PGF 2 and its stereoisomer PGF 2α are novel agonists of the chemoattractant receptor, CRTH2. FEBS Lett. 2006, 580, 373–379. [Google Scholar] [CrossRef] [PubMed]
- Nantel, F.; Fong, C.; Lamontagne, S.; Wright, D.H.; Giaid, A.; Desrosiers, M.; Metters, K.M.; O’Neill, G.P.; Gervais, F.G. Expression of prostaglandin D synthase and the prostaglandin D2 receptors DP and CRTH2 in human nasal mucosa. Prostaglandins Other Lipid Mediat. 2004, 73, 87–101. [Google Scholar] [CrossRef]
- Iwasaki, M.; Nagata, K.; Takano, S.; Takahashi, K.; Ishii, N.; Ikezawa, Z. Association of a New-Type Prostaglandin D2 Receptor CRTH2 with Circulating T Helper 2 Cells in Patients with Atopic Dermatitis. J. Investig. Dermatol. 2002, 119, 609–616. [Google Scholar] [CrossRef] [PubMed] [Green Version]
- Palikhe, N.S.; Laratta, C.; Nahirney, D.; Vethanayagam, D.; Bhutani, M.; Vliagoftis, H.; Cameron, L. Elevated levels of circulating CD4+CRTh2+ T cells characterize severe asthma. Clin. Exp. Allergy 2016, 46, 825–836. [Google Scholar] [CrossRef]
- Fajt, M.L.; Gelhaus, S.L.; Freeman, B.; Uvalle, C.E.; Trudeau, J.B.; Holguin, F.; Wenzel, S.E. Prostaglandin D2 pathway upregulation: Relation to asthma severity, control, and TH2 inflammation. J. Allergy Clin. Immunol. 2013, 131, 1504–1512.e12. [Google Scholar] [CrossRef] [Green Version]
- White, A.A.; Stevenson, D.D. Aspirin-exacerbated respiratory disease. N. Engl. J. Med. 2018, 379, 1060–1070. [Google Scholar] [CrossRef]
- Lee, K.; Lee, S.H.; Kim, T.H. The Biology of Prostaglandins and Their Role as a Target for Allergic Airway Disease Therapy. Int. J. Mol. Sci. 2020, 21, 1851. [Google Scholar] [CrossRef] [Green Version]
- Bateman, E.D.; Guerreros, A.G.; Brockhaus, F.; Holzhauer, B.; Pethe, A.; Kay, R.A.; Townley, R.G. Fevipiprant, an oral prostaglandin DP 2 receptor (CRTh2) antagonist, in allergic asthma uncontrolled on low-dose inhaled corticosteroids. Eur. Respir. J. 2017, 50, 1700670. [Google Scholar] [CrossRef] [Green Version]
- Gonem, S.; Berair, R.; Singapuri, A.; Hartley, R.; Laurencin, M.F.M.; Bacher, G.; Holzhauer, B.; Bourne, M.; Mistry, V.; Pavord, I.D.; et al. Fevipiprant, a prostaglandin D 2 receptor 2 antagonist, in patients with persistent eosinophilic asthma: A single-centre, randomised, double-blind, parallel-group, placebo-controlled trial. Lancet Respir. Med. 2016, 4, 699–707. [Google Scholar] [CrossRef] [Green Version]
- Erpenbeck, V.J.; Popov, T.A.; Miller, D.; Weinstein, S.F.; Spector, S.; Magnusson, B.; Osuntokun, W.; Goldsmith, P.; Weiss, M.; Beier, J. The oral CRTh2 antagonist QAW039 (fevipiprant): A phase II study in uncontrolled allergic asthma. Pulm. Pharmacol. Ther. 2016, 39, 54–63. [Google Scholar] [CrossRef]
- Brightling, C.E.; Gaga, M.; Inoue, H.; Li, J.; Maspero, J.; Wenzel, S.; Maitra, S.; Lawrence, D.; Brockhaus, F.; Lehmann, T.; et al. Effectiveness of fevipiprant in reducing exacerbations in patients with severe asthma (LUSTER-1 and LUSTER-2): Two phase 3 randomised controlled trials. Lancet Respir. Med. 2020. [Google Scholar] [CrossRef]
- Novartis. Novartis Provides Update on LUSTER Phase III Studies in Patients with Uncontrolled GINA 4/5 Asthma. Available online: https://www.novartis.com/news/media-releases/novartis-provides-update-luster-phase-iii-studies-patients-uncontrolled-gina-45-asthma (accessed on 20 December 2020).
- Flood-Page, P.; Swenson, C.; Faiferman, I.; Matthews, J.; Williams, M.; Brannick, L.; Robinson, D.; Wenzel, S.; Busse, W.; Hansel, T.T.; et al. A Study to Evaluate Safety and Efficacy of Mepolizumab in Patients with Moderate Persistent Asthma. Am. J. Respir. Crit. Care Med. 2007, 176, 1062–1071. [Google Scholar] [CrossRef]
- Kerstjens, H.A.M.; Gosens, R. Prostaglandin D2: The end of a story or just the beginning? Lancet Respir. Med. 2021, 9, 2–3. [Google Scholar] [CrossRef]

Publisher’s Note: MDPI stays neutral with regard to jurisdictional claims in published maps and institutional affiliations. |
© 2021 by the authors. Licensee MDPI, Basel, Switzerland. This article is an open access article distributed under the terms and conditions of the Creative Commons Attribution (CC BY) license (https://creativecommons.org/licenses/by/4.0/).