
Investigating the Reliability of Novel Nasal Anthropometry Using Advanced Three-Dimensional Digital Stereophotogrammetry


Abstract
:1. Introduction
2. Materials and Methods
2.1. Volunteers and Recruitment
2.2. 3D Surface Imaging Device (3DSI)
2.3. Image Acquisition
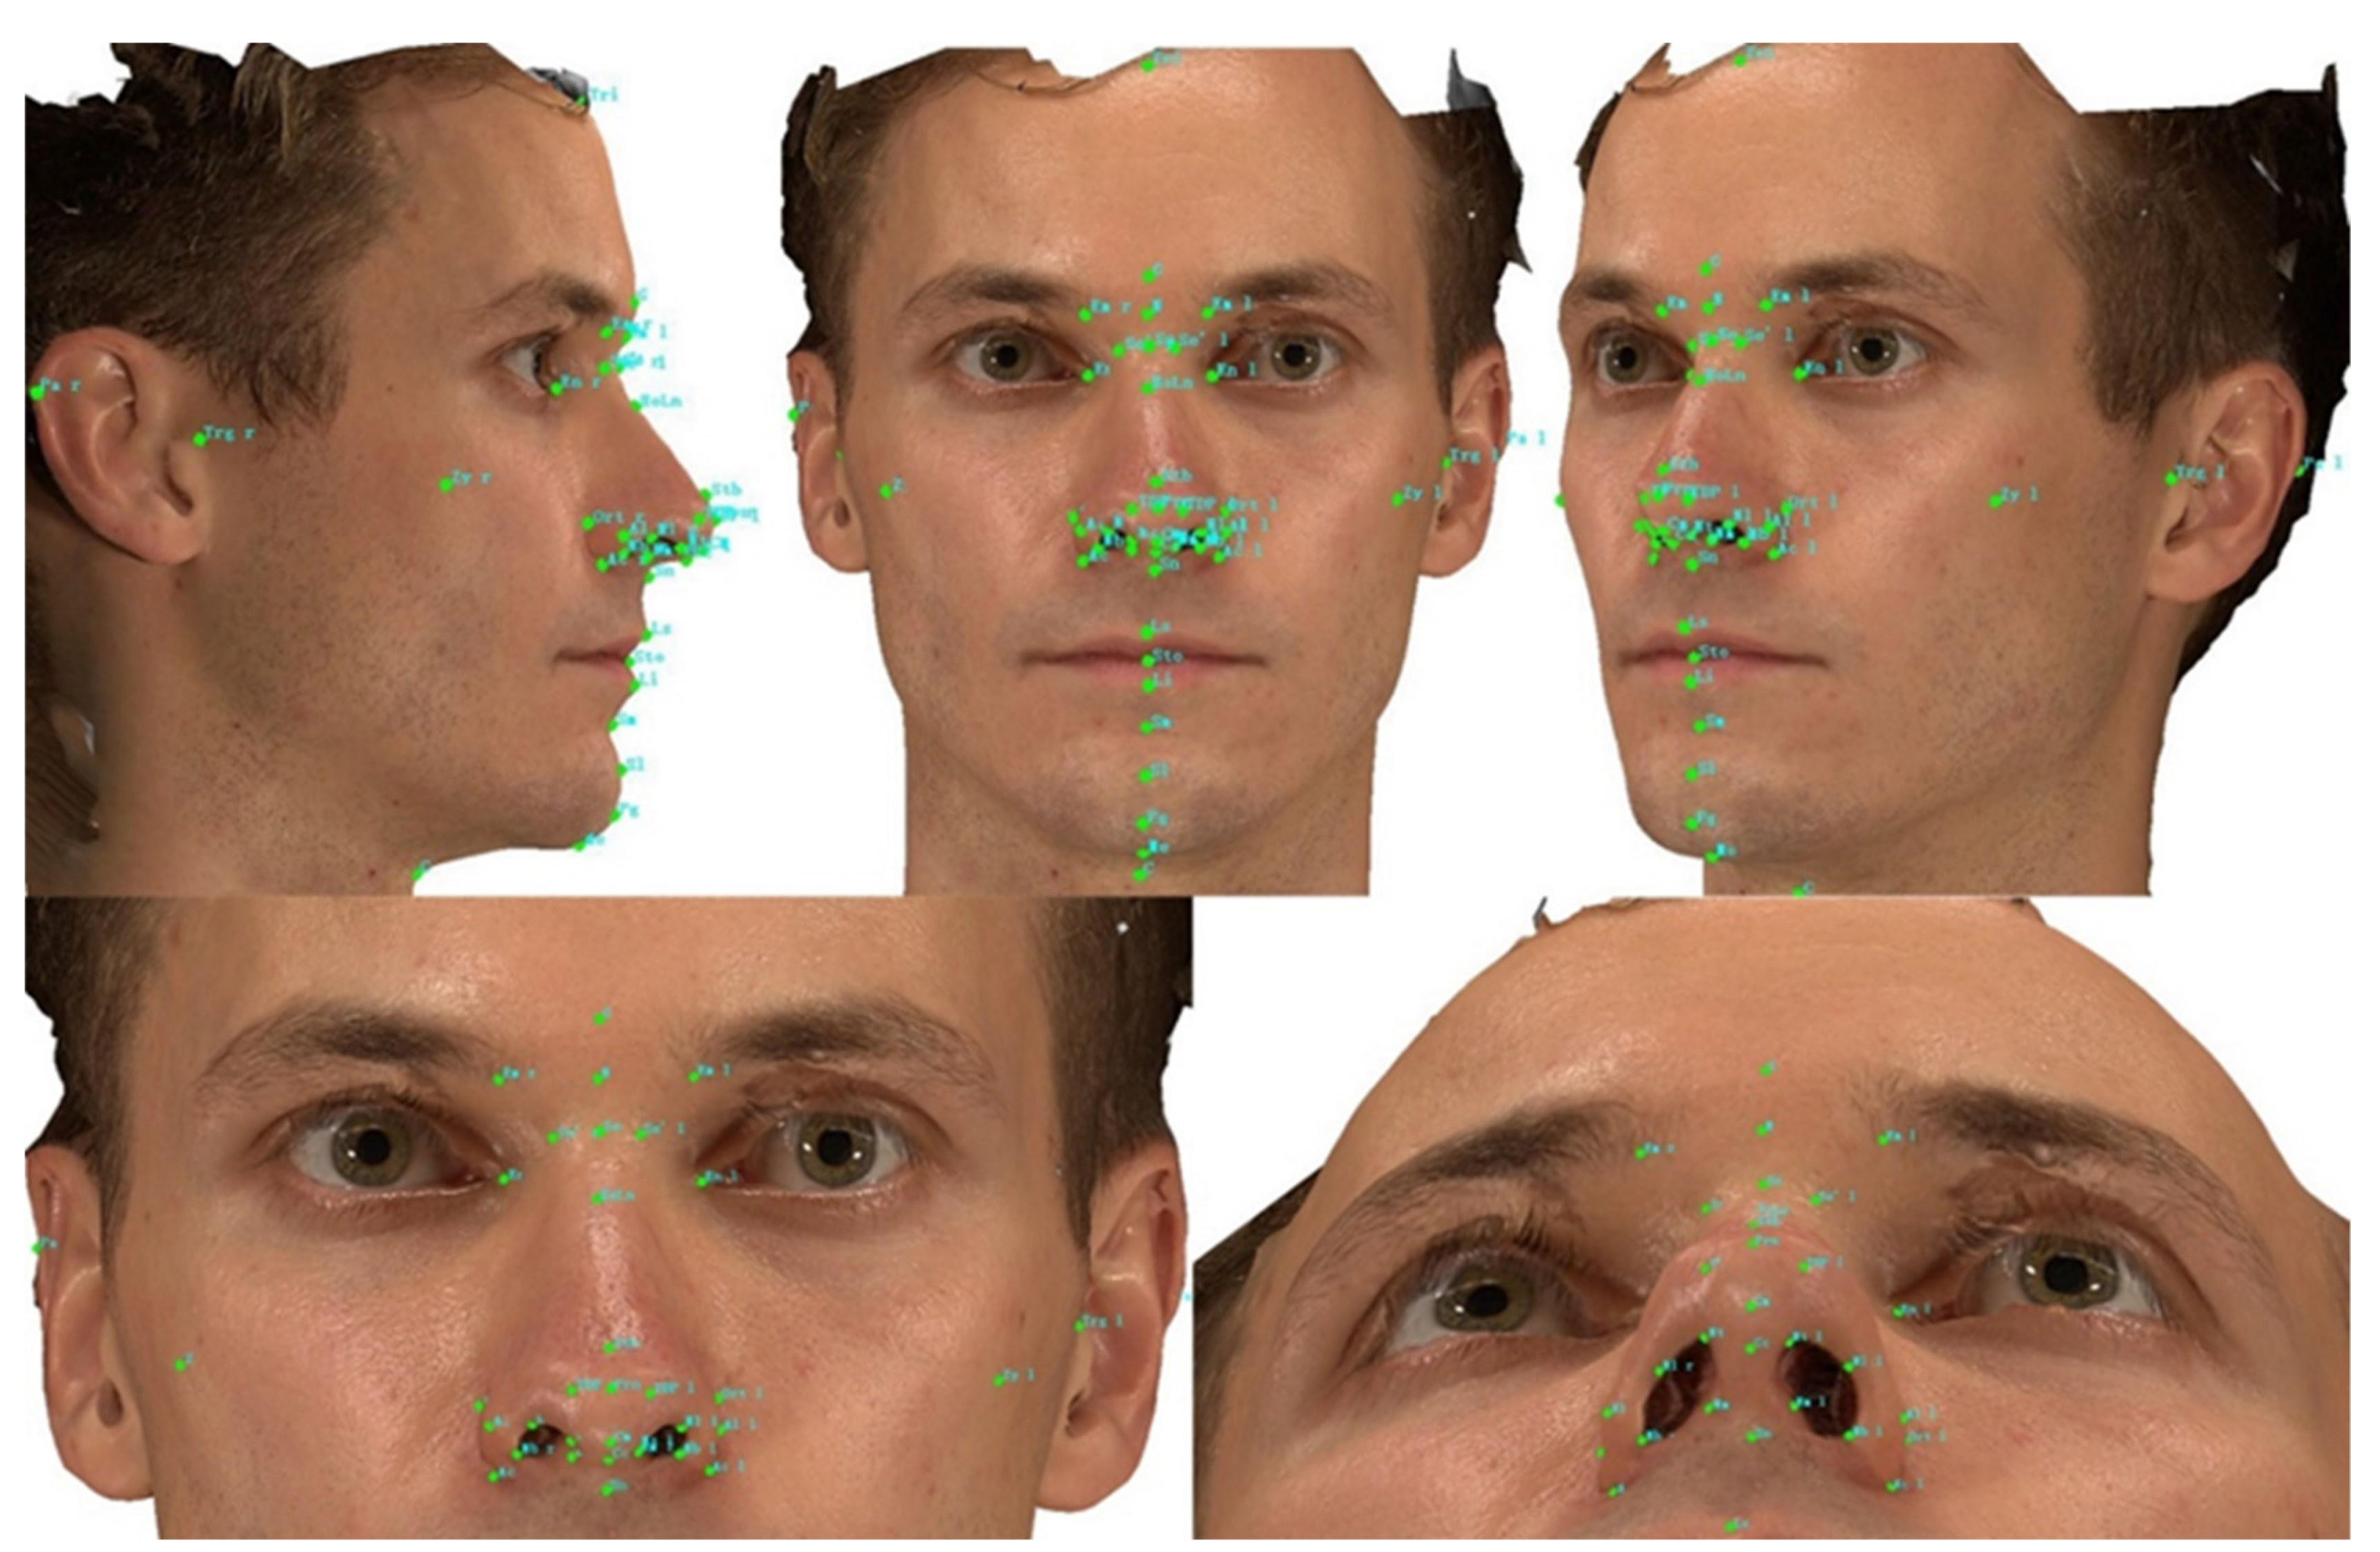
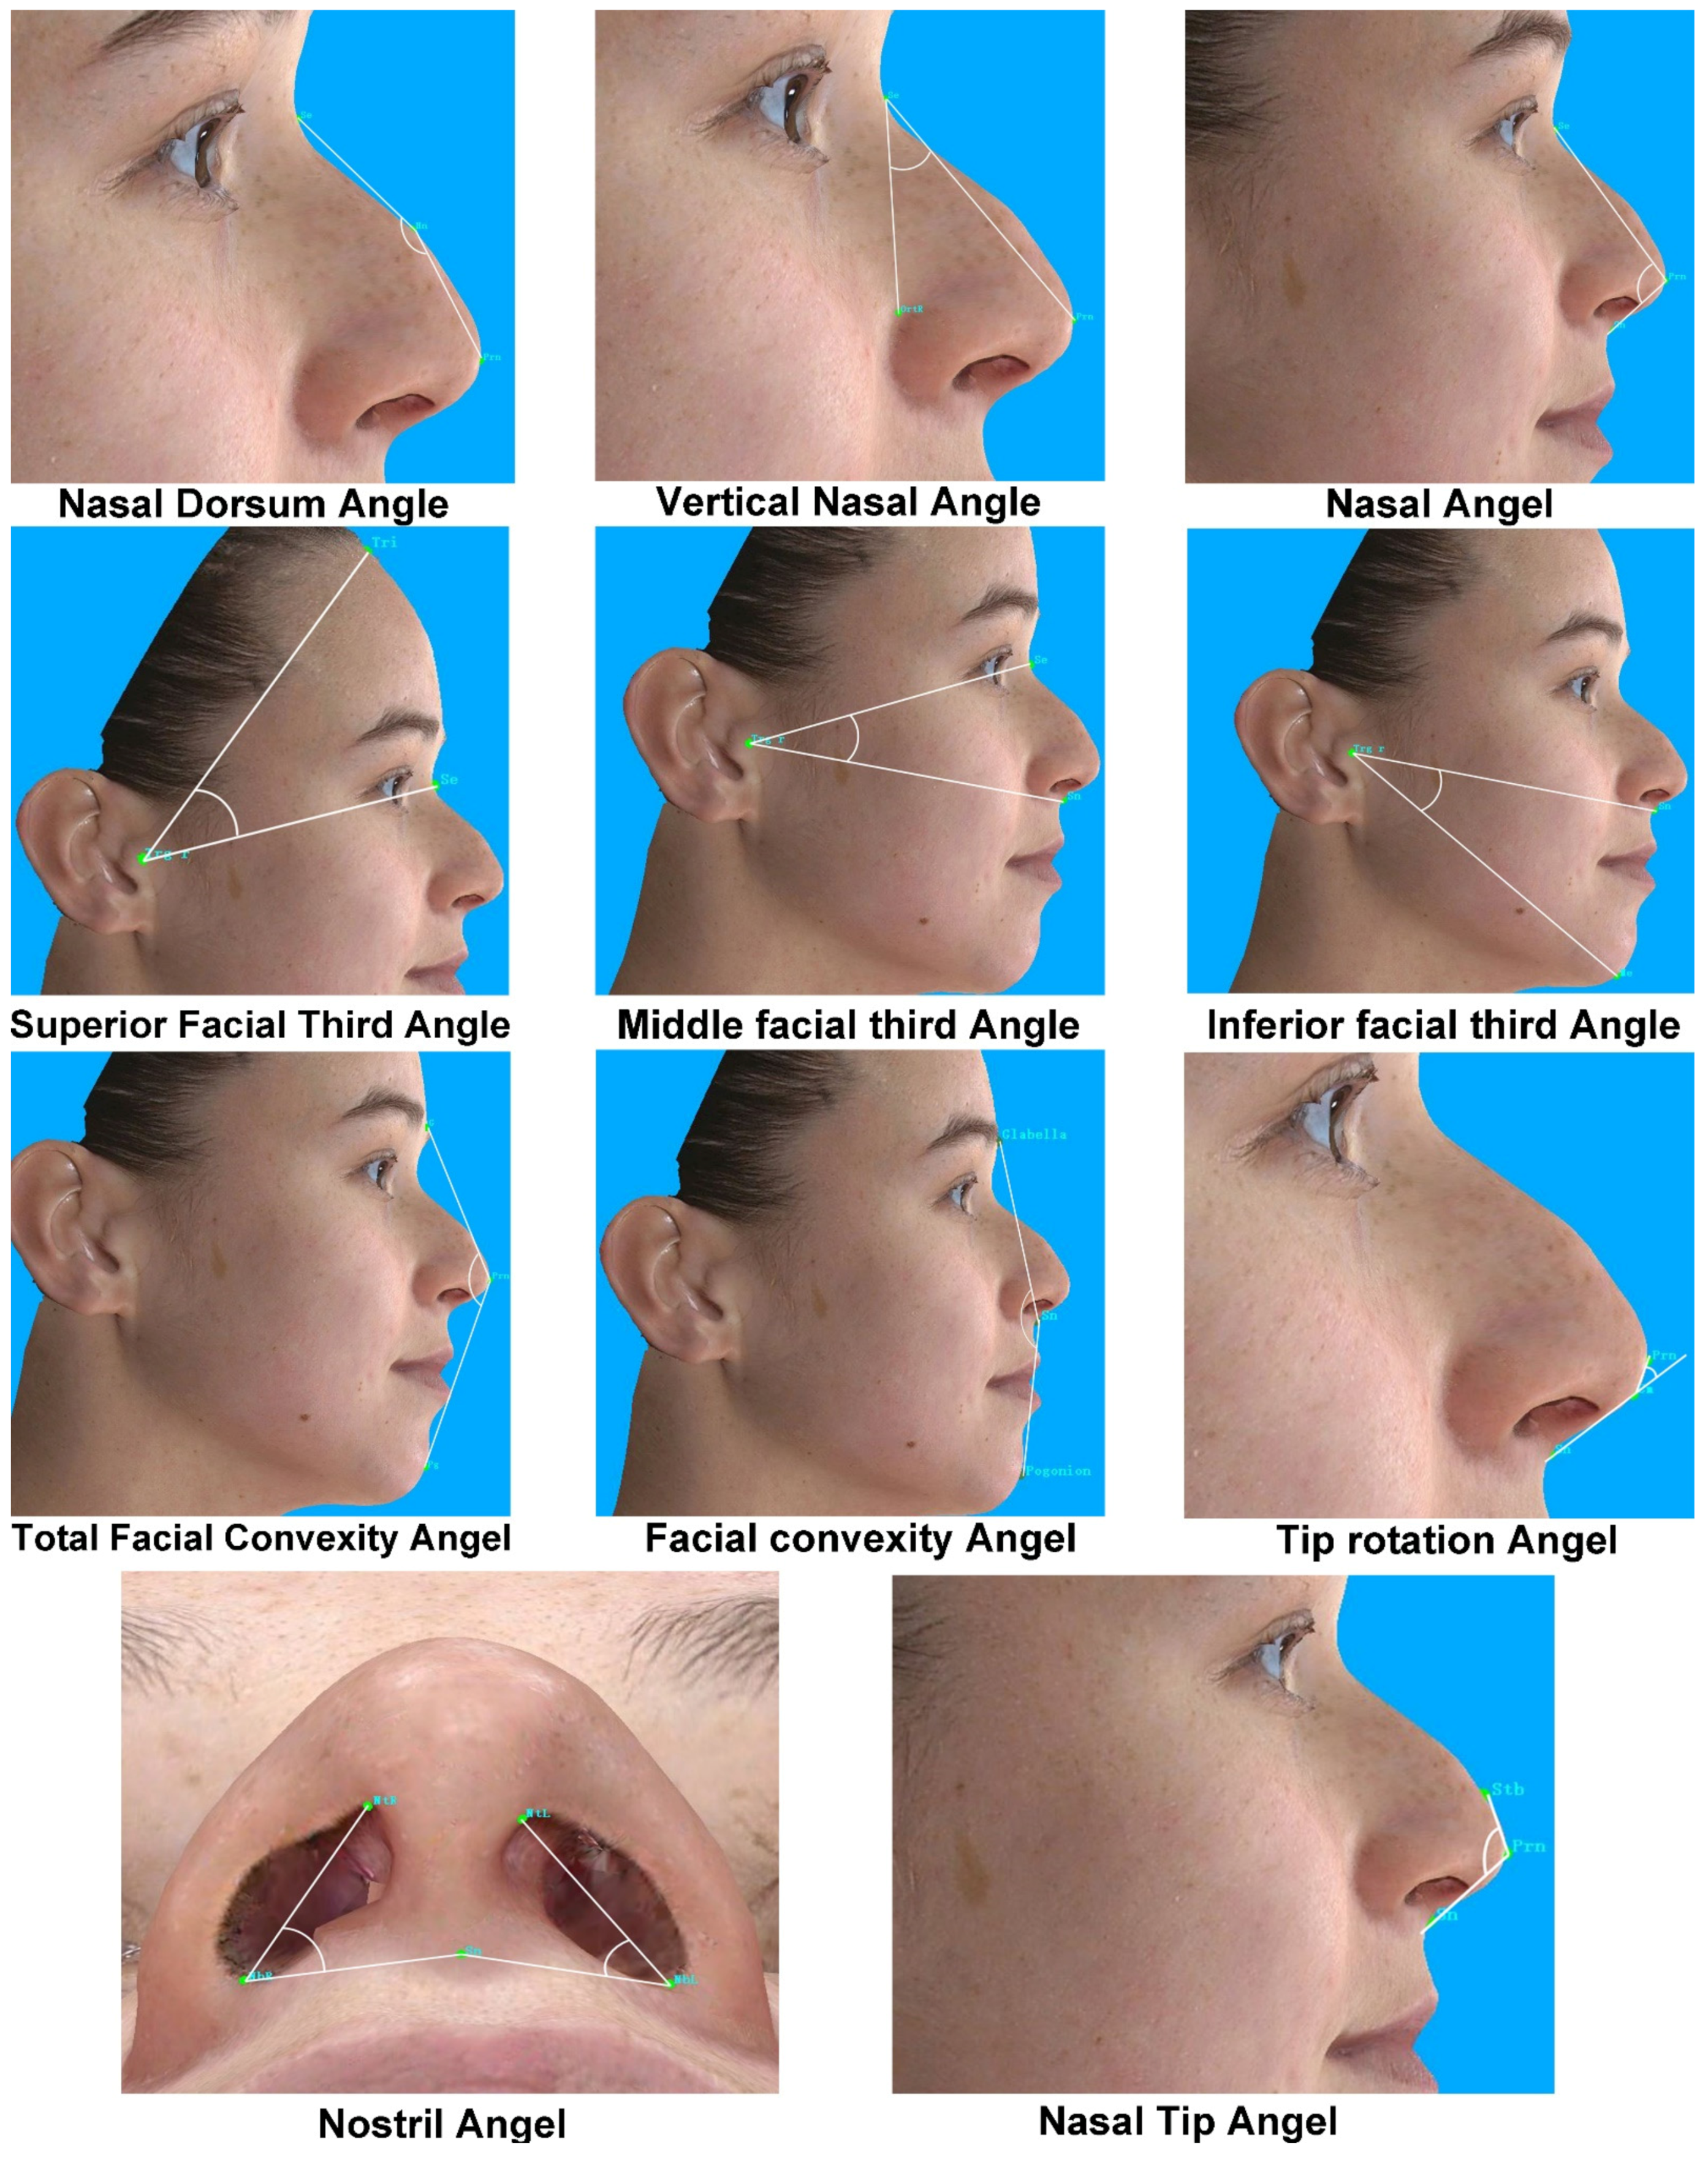
2.4. Data Evaluation
2.5. Statistical Analysis
2.6. Ethical Approval
3. Results
3.1. Overall
3.2. Intra-Assessor Reliability with 3D Images
3.3. Inter-Assessor Reliability with 3D Images
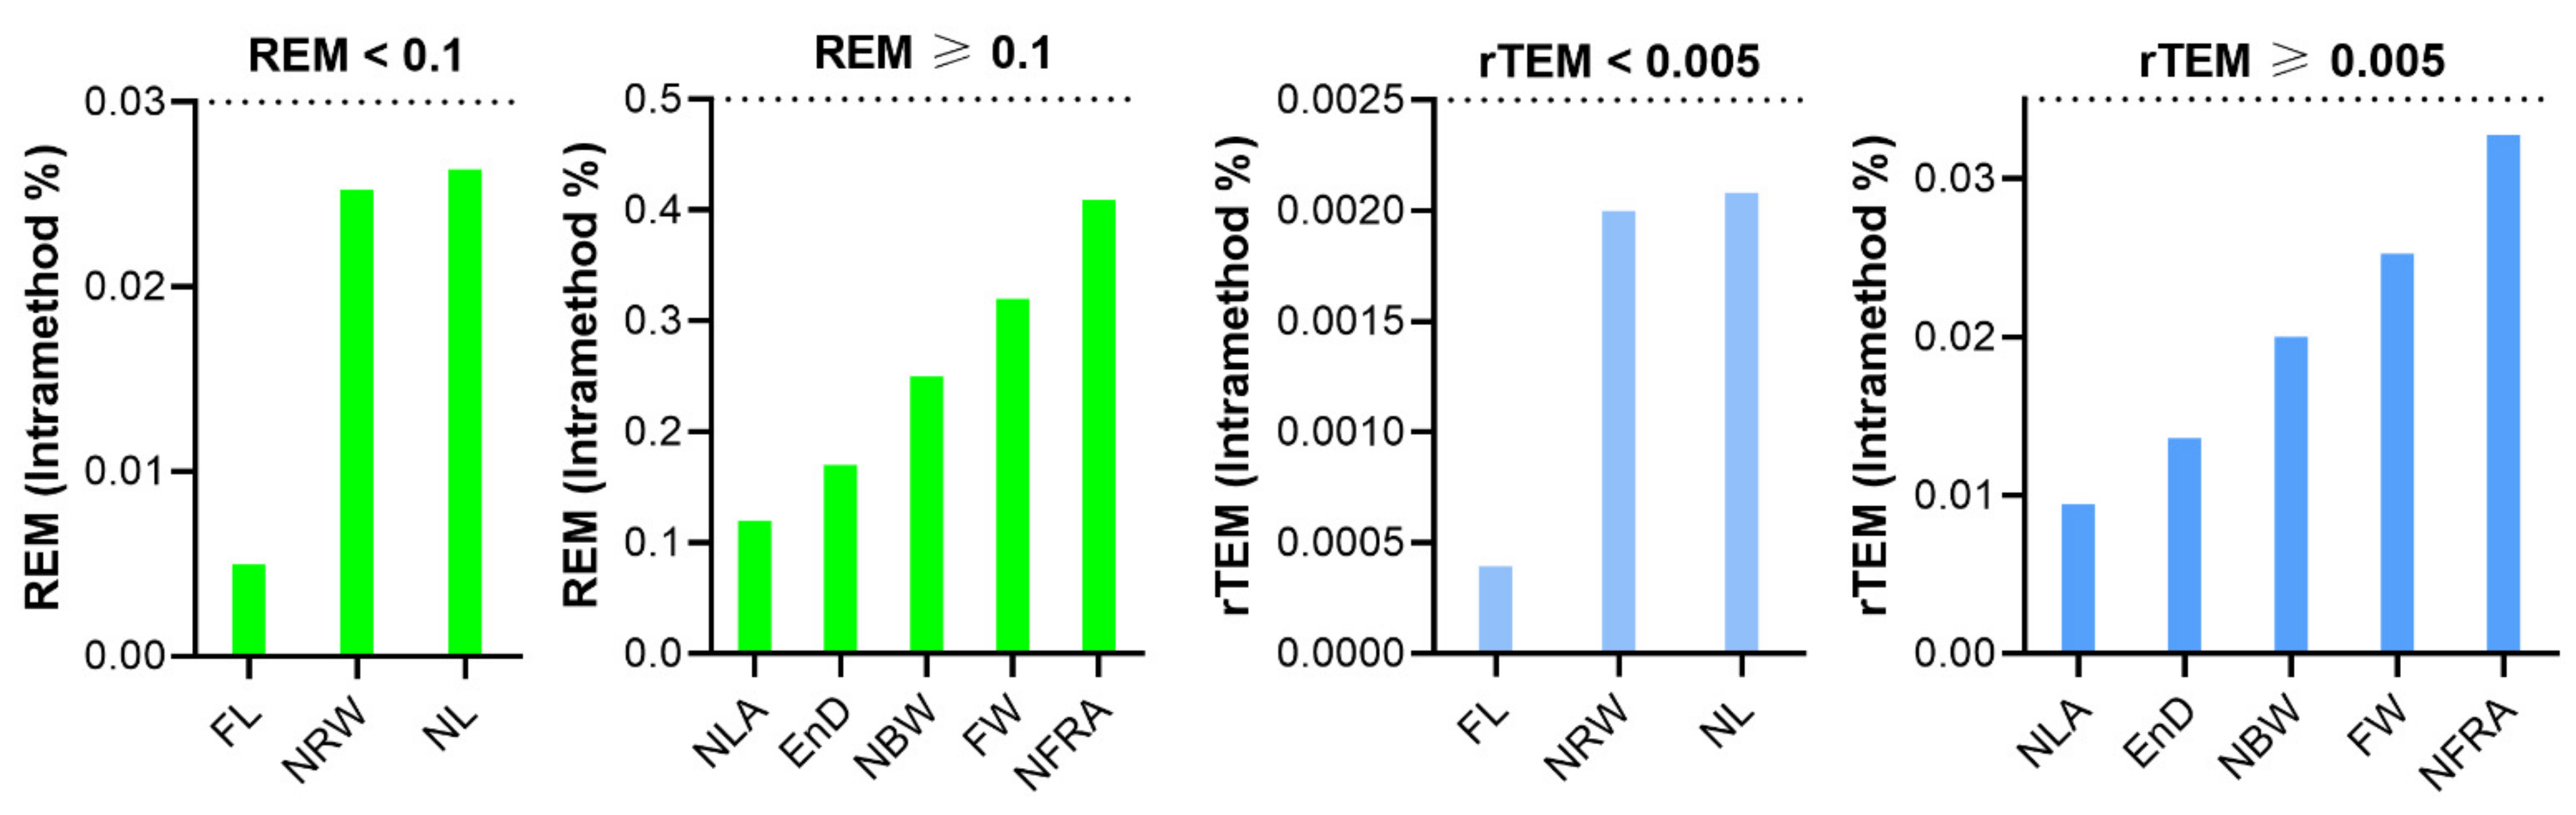
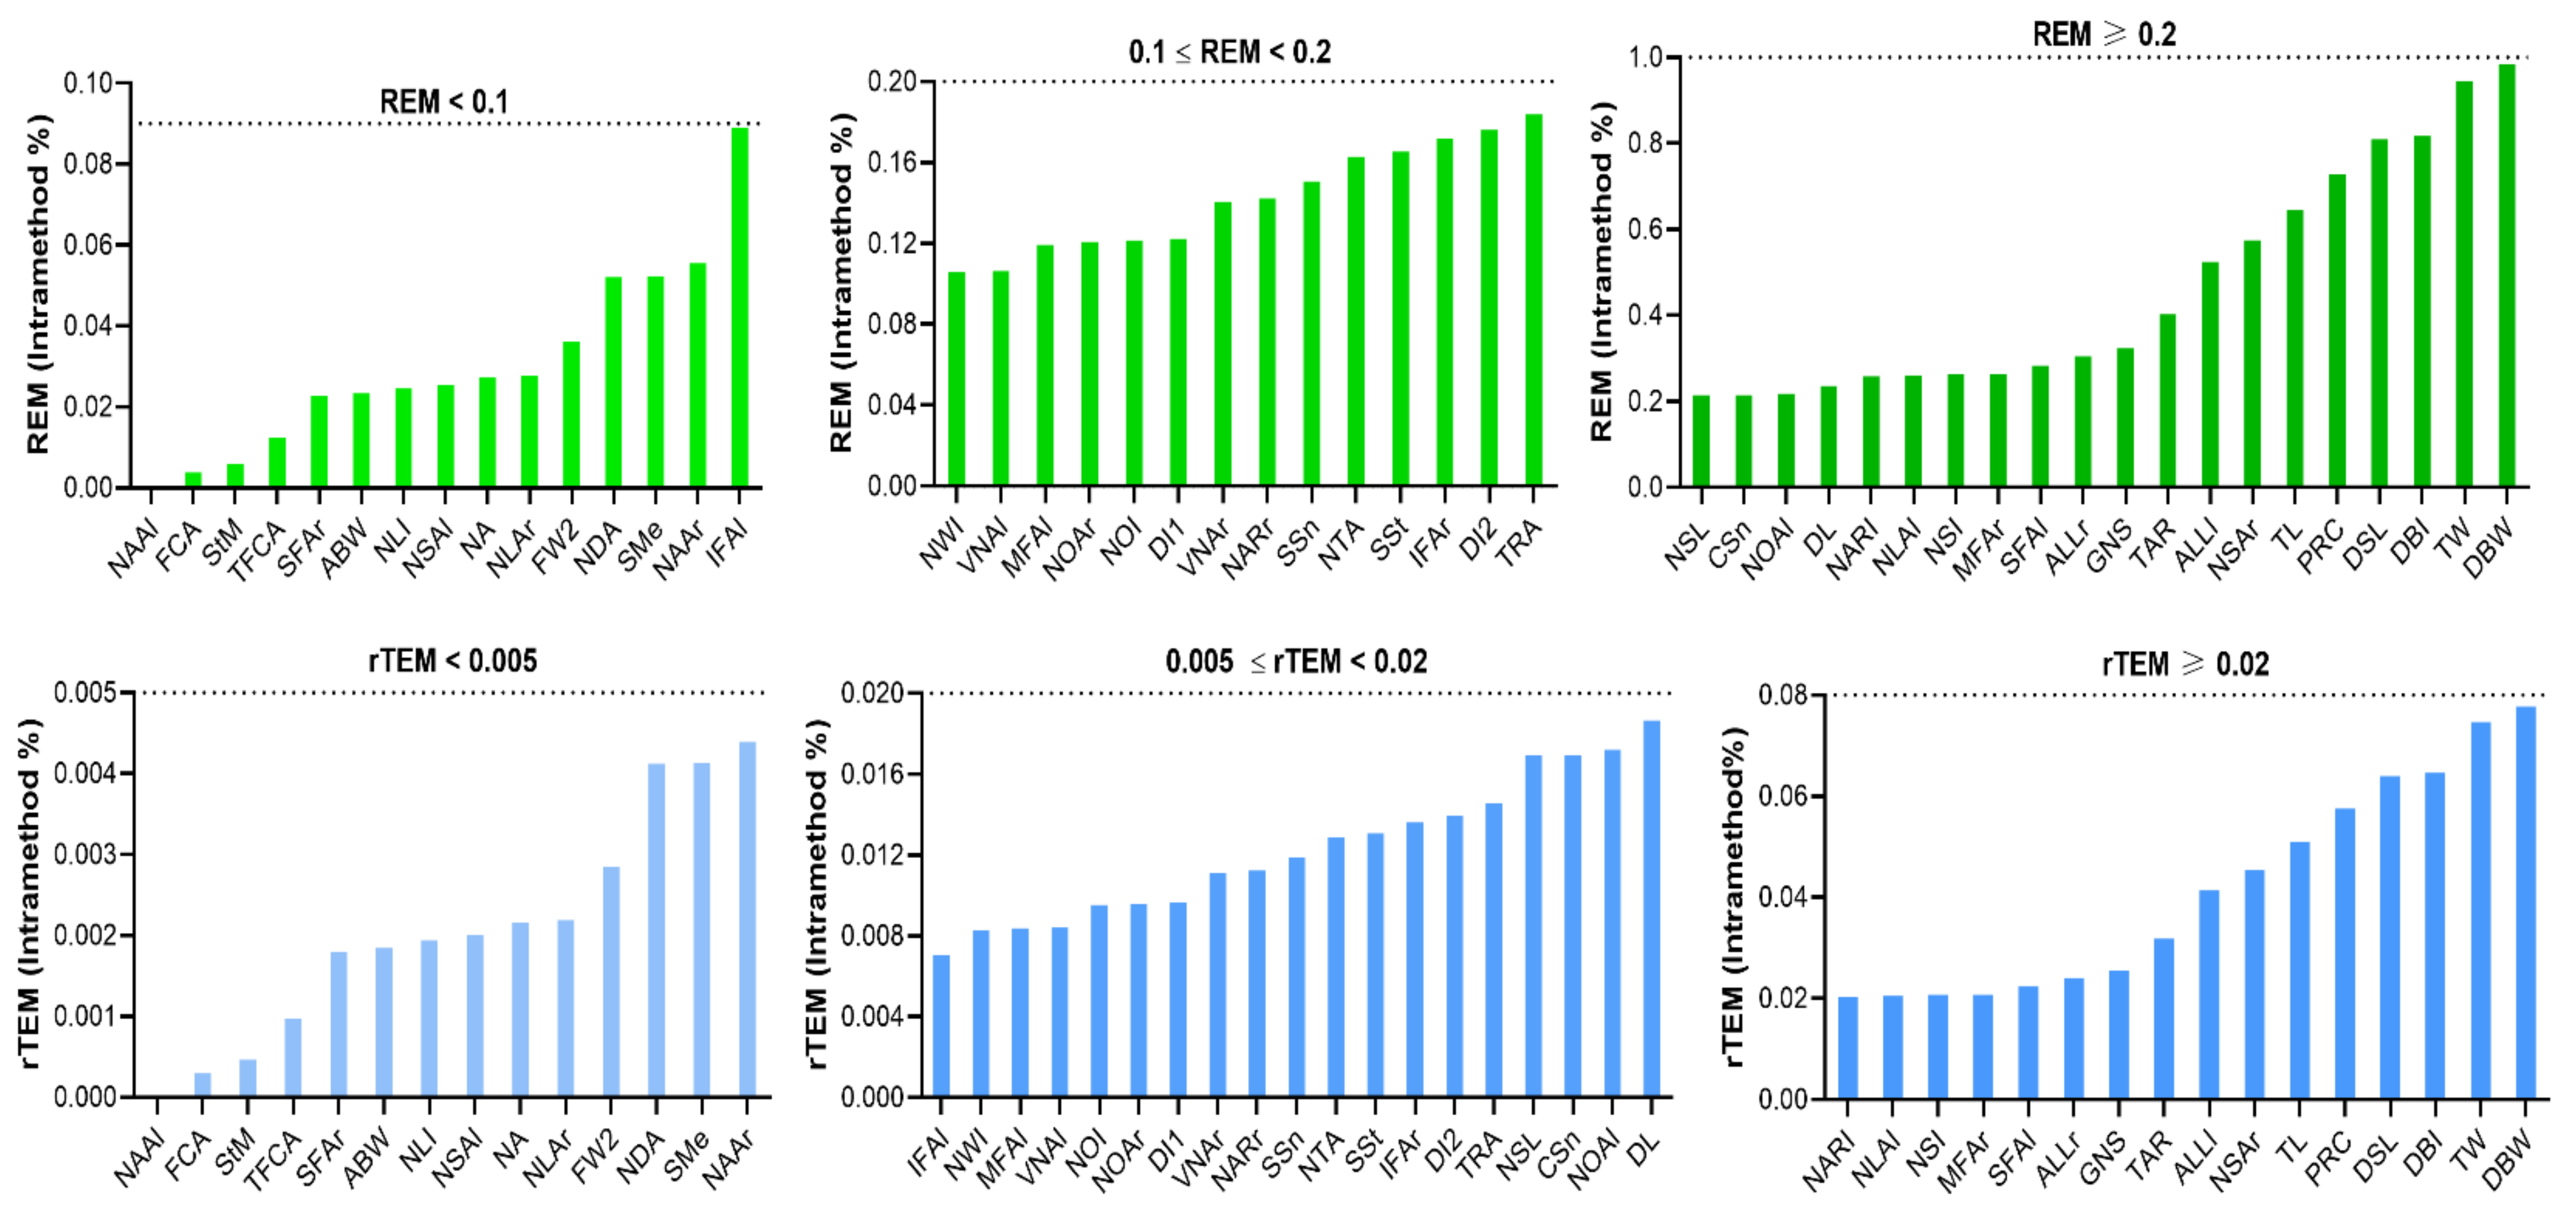
3.4. Intra-Method Reliability with VECTRA XT 3D Imaging System
4. Discussion
5. Limitations and Perspectives
6. Conclusions
Supplementary Materials
Author Contributions
Funding
Institutional Review Board Statement
Informed Consent Statement
Data Availability Statement
Acknowledgments
Conflicts of Interest
References
- Lekakis, G.; Claes, P.; Hamilton, G.S.; Hellings, P.W. Evolution of Preoperative Rhinoplasty Consult by Computer Imaging. Facial Plast. Surg. 2016, 32, 80–87. [Google Scholar] [CrossRef]
- Villanueva, N.L.; Afrooz, P.N.; Carboy, J.A.; Rohrich, R.J. Nasal Analysis: Considerations for Ethnic Variation. Plast. Reconstr. Surg. 2019, 143, 1179e–1188e. [Google Scholar] [CrossRef] [PubMed]
- Ghoddousi, H.; Edler, R.; Haers, P.; Wertheim, D.; Greenhill, D. Comparison of three methods of facial measurement. Int. J. Oral Maxillofac. Surg. 2007, 36, 250–258. [Google Scholar] [CrossRef] [PubMed]
- Guo, Y.; Hou, X.; Rokohl, A.C.; Jia, R.; Heindl, L.M. Reliability of Periocular Anthropometry: A Comparison of Direct, 2-Dimensional, and 3-Dimensional Techniques. Dermatol. Surg. 2020, 46, e23–e31. [Google Scholar] [CrossRef]
- Aung, S.C.; Ngim, R.C.; Lee, S.T. Evaluation of the laser scanner as a surface measuring tool and its accuracy compared with direct facial anthropometric measurements. Br. J. Plast. Surg. 1995, 48, 551–558. [Google Scholar] [CrossRef]
- Koban, K.C.; Cotofana, S.; Frank, K.; Green, J.B.; Etzel, L.; Li, Z.; Giunta, R.E.; Schenck, T.L. Precision in 3-Dimensional Surface Imaging of the Face: A Handheld Scanner Comparison Performed in a Cadaveric Model. Aesthetic Surg. J. 2019, 39, NP36–NP44. [Google Scholar] [CrossRef] [PubMed]
- Koban, K.C.; Perko, P.; Etzel, L.; Li, Z.; Schenck, T.L.; Giunta, R.E. Validation of two handheld devices against a non-portable three-dimensional surface scanner and assessment of potential use for intraoperative facial imaging. J. Plast. Reconstr. Aesthet. Surg. 2020, 73, 141–148. [Google Scholar] [CrossRef] [PubMed] [Green Version]
- Weinberg, S.M.; Scott, N.M.; Neiswanger, K.; Brandon, C.A.; Marazita, M.L. Digital three-dimensional photogrammetry: Evaluation of anthropometric precision and accuracy using a Genex 3D camera system. Cleft Palate-Craniofacial J. 2004, 41, 507–518. [Google Scholar] [CrossRef]
- Jayaratne, Y.S.N.; Deutsch, C.K.; Zwahlen, R.A. Nasal Morphology of the Chinese: Three-Dimensional Reference Values for Rhinoplasty. Otolaryngol. Head Neck Surg. 2014, 150, 956–961. [Google Scholar] [CrossRef] [PubMed] [Green Version]
- Dong, Y.; Zhao, Y.; Bai, S.; Wu, G.; Wang, B. Three-dimensional anthropometric analysis of the Chinese nose. J. Plast. Reconstr. Aesthet. Surg. 2010, 63, 1832–1839. [Google Scholar] [CrossRef] [PubMed]
- Guo, Y.; Rokohl, A.C.; Schaub, F.; Hou, X.; Liu, J.; Ruan, Y.; Jia, R.; Koch, K.R.; Heindl, L.M. Reliability of periocular anthropometry using three-dimensional digital stereophotogrammetry. Graefe’s Arch. Clin. Exp. Ophthalmol. 2019, 257, 2517–2531. [Google Scholar] [CrossRef] [PubMed]
- Verhulst, A.; Hol, M.; Vreeken, R.; Becking, A.; Ulrich, D.; Maal, T. Three-Dimensional Imaging of the Face: A Comparison Between Three Different Imaging Modalities. Aesthetic Surg. J. 2018, 38, 579–585. [Google Scholar] [CrossRef] [PubMed] [Green Version]
- Farkas, L.G. Examination. In Anthropometry of the Head and Face; Raven Press: New York, NY, USA, 1994; pp. 3–56. [Google Scholar]
- Hausamen, G.R.J.S.S.-E. Three-Dimensional Cephalometry A Color Atlas and Manual; Springer Press: Berlin/Heidelberg, Germany, 2006. [Google Scholar]
- Jamilian, A.; Darnahal, A.; Hamedi, R.; Kamali, Z.; Toopchi, S. Photogrammetric analysis of facial profile in Persian adults. Gen. Dent. 2016, 64, 52–55. [Google Scholar] [PubMed]
- Woelfel, J.B.; Igarashi, T.; Dong, J.-K. Faculty-supervised measurements of the face and of mandibular movements on young adults. J. Adv. Prosthodont. 2014, 6, 483–490. [Google Scholar] [CrossRef] [PubMed] [Green Version]
- Weiss, N.S.; Koepsell, T.D. Epidemiologic Methods: Studying the Occurrence of Illness, 2nd ed.; Oxford University Press: Oxford, England, 2006; ISBN 9780195314465. [Google Scholar]
- Ulijaszek, T.J.; Lourie, J.A. Intra- and inter-observer error in anthropometric measurement. In Anthropometry: The Individual and the Population; Cambridge University Press: Cambridge, UK, 1994; pp. 30–55. ISBN 9780521417983. [Google Scholar]
- Andrade, L.M.; Rodrigues Da Silva, A.M.B.; Magri, L.V.; Rodrigues Da Silva, M.A.M. Repeatability Study of Angular and Linear Measurements on Facial Morphology Analysis by Means of Stereophotogrammetry. J. Craniofac. Surg. 2017, 28, 1107–1111. [Google Scholar] [CrossRef] [PubMed]
- Camison, L.; Bykowski, M.; Lee, W.W.; Carlson, J.C.; Roosenboom, J.; Goldstein, J.A.; Losee, J.E.; Weinberg, S.M. Validation of the Vectra H1 portable three-dimensional photogrammetry system for facial imaging. Int. J. Oral Maxillofac. Surg. 2018, 47, 403–410. [Google Scholar] [CrossRef] [PubMed]
- Perini, T.A.; de Oliveira, G.L.; de Ornellas, J.D.S.; de Oliveira, F.P.D. Technical error of measurement in anthropometry. Rev. Bras. Med. do Esporte 2005, 11, 86–90. [Google Scholar]
- Lin, H.; Zhu, P.; Lin, Y.; Zheng, Y.; Xu, Y. Reliability and reproducibility of landmarks on three-dimensional soft-tissue cephalometrics using different placement methods. Plast. Reconstr. Surg. 2014, 134, 102e–110e. [Google Scholar] [CrossRef]
- Trochim, W.M.; Donnelly, J.P. The Research Methods Knowledge Base, 2nd ed.; Atomic Dog Pub.: Cincinnati, OH, USA, 2007. [Google Scholar]
- Heike, C.L.; Cunningham, M.L.; Hing, A.V.; Stuhaug, E.; Starr, J.R. Picture perfect? Reliability of craniofacial anthropometry using three-dimensional digital stereophotogrammetry. Plast. Reconstr. Surg. 2009, 124, 1261–1272. [Google Scholar] [CrossRef]
- Weinberg, S.M.; Naidoo, S.; Govier, D.P.; Martin, R.A.; Kane, A.A.; Marazita, M.L. Anthropometric precision and accuracy of digital three-dimensional photogrammetry: Comparing the genex and 3dMD imaging systems with one another and with direct anthropometry. J. Craniofac. Surg. 2006, 17, 477–483. [Google Scholar] [CrossRef]
- Milutinovic, J.; Zelic, K.; Nedeljkovic, N. Evaluation of facial beauty using anthropometric proportions. Sci. World J. 2014, 2014, 428250. [Google Scholar] [CrossRef] [Green Version]
- Goetz, L.H.; Schork, N.J. Personalized medicine: Motivation, challenges, and progress. Fertil. Steril. 2018, 109, 952–963. [Google Scholar] [CrossRef] [PubMed]
- Henriquez, P.; Matuszewski, B.J.; Andreu, Y.; Bastiani, L.; Colantonio, S.; Coppini, G.; D’Acunto, M.; Favilla, R.; Germanese, D.; Giorgi, D.; et al. Mirror Mirror on the Wall… An Unobtrusive Intelligent Multisensory Mirror for Well-Being Status Self-Assessment and Visualization. IEEE Trans. Multimed. 2017, 19, 1467–1481. [Google Scholar] [CrossRef]
- Kim, I.-S. Augmentation Rhinoplasty Using Silicone Implants. Facial Plast. Surg. Clin. N. Am. 2018, 26, 285–293. [Google Scholar] [CrossRef] [PubMed]
- Ho, O.Y.M.; Ku, P.K.M.; Tong, M.C.F. Rhinoplasty outcomes and trends. Curr. Opin. Otolaryngol. Head Neck Surg. 2019, 27, 280–286. [Google Scholar] [CrossRef] [PubMed]


| Age | Males (n = 55) | Females (n = 55) |
|---|---|---|
| Mean ± SD | 42.23 ± 8.31 | 40.53 ± 7.99 |
| Range | 18–62 yrs | 18–65 yrs |
| 18–25 | 9 | 11 |
| 26–35 | 13 | 13 |
| 36–45 | 14 | 12 |
| 46–55 | 12 | 10 |
| ≥55 | 7 | 9 |
| Classification | Landmarks | Definition |
|---|---|---|
| Novel | Nostril base point left (Nb l) | the lowest point of each nostril or the inferior terminal point of left nostril axis. |
| Nostril base point right (Nb r) | the lowest point of each nostril or the inferior terminal point of right nostril axis. | |
| Nostril lateral point left (Nl l) | the junction point of nostril short axis and the lateral margin of left nostril | |
| Nostril lateral point right (Nl r) | the junction point of nostril short axis and the lateral margin of right nostril | |
| Nostril medial point right (Nm l) | the junction point of nostril short axis and the medial margin of left nostril | |
| Nostril medial point right (Nm r) | the junction point of nostril short axis and the medial margin of right nostril | |
| Nostril top points left (Nt l) | the highest point of each nostril or the superior terminal point of left nostril axis. | |
| Nostril top points right (Nt r) | the highest point of each nostril or the superior terminal point of right nostril axis. | |
| Sellion’ left (Se’ l) | the left intersections of TH[Se] and Dorsal aesthetic lines | |
| Sellion’ right (Se’ r) | the right intersections of TH[Se] and Dorsal aesthetic lines | |
| Highnasal (Hn) or Lownasal(Ln) | the most anterior or posterior point on dorsum of nose between its root and tip | |
| Sublabiale(Sl) | the most posterior midpoint on the labiomental soft tissue contour that defines the border between the lower lip and the chin. | |
| Supramental (Sm) | Deepest point in inferior sublabial concavity | |
| Columella constructed point (Cc) | the midpoint of the columella crest at the level of the nostril top points | |
| Ort left | the left Junction of true vertical (TV) and true horizontal (TH) on the alare | |
| Ort right | the right Junction of true vertical (TV) and true horizontal (TH) on the alare | |
| Supratip break (Stb) | the joint point of the dorsum and nasal tip | |
| Postaurale left (Pa l) | Most posterior point on the free margin of the left ear | |
| Postaurale right (Pa r) | Most posterior point on the free margin of the right ear | |
| Classic | Em left | Lower margin of the left medial eyebrow end |
| Em right | Lower margin of the right medial eyebrow end | |
| Endocanthion left (En l) | the left inner commissure of the palpebral fissure, the rightmidpoint of the frontonasal suture | |
| Endocanthion right (En r) | the right inner commissure of the palpebral fissure, the rightmidpoint of the frontonasal suture | |
| Alar curvature/Alar crest left (Ac l) | Alar curvature point (ac) is the point located at the facial insertion of left alar base. | |
| Alar curvature/Alar crest right (Ac r) | Alar curvature point (ac) is the point located at the facial insertion of right alar base. | |
| Alare left (Al l) | the most lateral point on left alar contour | |
| Alare right (Al r) | the most lateral point on right alar contour | |
| Columella (Cm) | Most anterior and inferior point on apex of nose | |
| Glabella (G) | Most anterior point on midline of forehead | |
| Nasion (N) | Deepest point in middle of frontonasal curve | |
| Pronasale (Prn) | Most prominent point on apex of nose | |
| Sellion (Se) | the most posterior point of the sagittal plane Sin the midline of the nasal root. | |
| Subnasale (Sn) | Deepest point in nasolabial curvature | |
| Tip defining point left(TDP l) | the left most anterior projection of the tip cartilage | |
| Tip defining point right (TDP r) | the right most anterior projection of the tip cartilages | |
| Cervical (C) | Deepest point at angel of chin and neck | |
| Labrale inferius (Li) | Lower lip vermilion border | |
| Labrale superius (Ls) | Upper lip vermilion border | |
| Menton (Me) | Most inferior point on inferior edge of chin | |
| Stomion(Sto) | the midpoint of the horizontal labial fissure | |
| Pogonion (Pg) | Most anterior midpoint of chin | |
| Tragus left (Trg l) | Most posterior point of auricular tragus left | |
| Tragus right (Trg r) | Most posterior point of auricular tragus right | |
| Trichion (Tri) | Intersection of hairline and midline of forehead | |
| Zygion left (Zy l) | the most lateral point on the outline of left zygomatic arch | |
| Zygion right (Zy r) | the most lateral point on the outline of right zygomatic arch |
| Classification | Measurements | Abbreviation | Landmarks or Definitions |
|---|---|---|---|
| Classic | Projective linear (Straight line) distance | ||
| Face width | FW | Zy(l)-Zy(r) | |
| Face length | FL | Tri-Me | |
| Nasal root width | NRW | Em(l)-Em(r) | |
| Inner intercanthal length | EnD | En (l)-En (r) | |
| Nasal length | NL | G-Sn | |
| Nasal base width | NBW | Ac(l)-Ac(r) | |
| Angles | |||
| Nasalfrontal Angel | NFRA | G-Se-Prn | |
| Nasolabial Angle | NLA | Cm-Sn-Ls | |
| Novel | Surface linear distance | ||
| Glabella-Nasion-Sellion | GNS | G-N-Se | |
| Dorsum surface length | DSL | Se-stp-prn | |
| Projective linear dimensions (Straight line distance) | |||
| Face width2 | FW2 | Postaurale(l)- Postaurale(r) | |
| Sellion-Subnasal | SSn | Se-Sn | |
| Dorsal bridge width(narrowest) | DBW | Se’(l)-Se’(r) | |
| Nasion-Alare * | NAL | N-Al | |
| Dorsum length | DL | Se-Prn | |
| Alar base width | ABW | Al(l)-Al(r) | |
| Alare length | ALL | Prn-Ac | |
| Tip width | TW | TDP(l)-TDP(r) | |
| Tip length | TL | Stb-Cm | |
| Nasal Septum length | NSL | Cm-Sn | |
| Pronasale-Columella | PRC | Prn-Cm | |
| Nostril lang Axis length * | NLA | Nt-Nb | |
| Nostril short Axis length * | NSA | shortest distance perpendicular to NLA | |
| Subnasal-Stomion | SSt | Sn-Sto | |
| Subnasal-Menton | SMe | Sn-Me | |
| Stomion-Menton | StM | St-Me | |
| Columella-Subnasal | CSn | Cm-Sn | |
| Angles | |||
| Nasal Dorsum Angle | NDA | Se-Hn-Prn/Se-Ln-Prn | |
| Vertical nasal angle | VNA | Prn-Se-Ort | |
| Nasal Angel | NA | Sn-Prn-Se | |
| Superior facial third Angle | SFA | Tri-Trg-Se | |
| Middle facial third Angle | MFA | Se-Trg-Sn | |
| Inferior facial third Angle | IFA | Sn-Trg-Me | |
| Total facial convexity Angel | TFCA | G-Prn-Pg | |
| Facial convexity Angel | FCA | G-Sn-Pg | |
| Tip rotation Angel | TRA | 180-(Prn-Cm-Sn) | |
| Nostril Angel * | NOA | NtR-NbR-Sn | |
| Nasal Tip Angel | NTA | Stb-Prn-Sn | |
| Ratio | |||
| Nasal width Index | NWI | NBW/FW2 | |
| Nasal length Index | NLI | NL/FL | |
| Dorsum Index-1 | DI-1 | SSn/NL | |
| Dorsum Index-2 | DI-2 | SSn/Stm | |
| Nasolabial Index | NOI | SSt/SMe | |
| Dorsal bridge Index | DBI | DBW/EnD | |
| Tip Aspect ratio | TAR | TW/TL | |
| Nostril Aspect ratio * | NAR | NLA/NSA | |
| Nasal Septum Index * | NSI | NSL/NSL+PRC | |
| Statistics | Equation |
|---|---|
| Intraclass correlation coefficient (ICC) | B/(B + W) |
| Mean absolute difference (MAD) | |X1 − X2| |
| Relative error measurement (REM) | (MAD/X3) × 100 |
| Technical error of measurement (TEM) | |
| Relative TEM (rTEM) | (TEM/X3) × 100 |
| Intra-Assessor | Inter-Rater | ||||||||||
|---|---|---|---|---|---|---|---|---|---|---|---|
| Classification | Variable | MAD | REM (%) | TEM | rTEM(%) | ICC | MAD | REM (%) | TEM | rTEM (%) | ICC |
| Linear Distance | FW | 0.758 | 0.641 | 0.06 | 0.051 | 0.96 | 1.791 | 1.502 | 0.142 | 0.119 | 0.90 |
| FL | 0.019 | 0.01 | 0.001 | 0.001 | 0.99 | 0.364 | 0.195 | 0.029 | 0.015 | 0.98 | |
| NRW | 0.013 | 0.051 | 0.001 | 0.004 | 0.97 | 0.694 | 2.69 | 0.055 | 0.213 | 0.94 | |
| EnD | 0.101 | 0.344 | 0.008 | 0.027 | 0.92 | 0.003 | 0.01 | 0 | 0.001 | 0.81 | |
| NL | 0.035 | 0.053 | 0.003 | 0.004 | 0.96 | 2.013 | 2.975 | 0.159 | 0.235 | 0.81 | |
| NBW | 0.155 | 0.506 | 0.012 | 0.04 | 0.96 | 0.15 | 0.49 | 0.012 | 0.039 | 0.85 | |
| Angles | NFRA | 0.044 | 0.03 | 0.003 | 0.002 | 0.99 | 0.397 | 0.275 | 0.031 | 0.022 | 0.97 |
| NLA | 0.29 | 0.239 | 0.023 | 0.019 | 0.98 | 0.993 | 0.82 | 0.065 | 0.054 | 0.95 | |
| Intra-Assessor | Inter-Rater | ||||||||||
|---|---|---|---|---|---|---|---|---|---|---|---|
| Classification | Variable | MAD | REM (%) | TEM | rTEM (%) | ICC | MAD | REM (%) | TEM | rTEM (%) | ICC |
| Surface distance | GNS | 0.1 | 0.647 | 0.008 | 0.051 | 0.86 | 0.808 | 5.155 | 0.064 | 0.408 | 0.88 |
| DSL | 0.216 | 0.473 | 0.017 | 0.037 | 0.98 | 0.513 | 1.115 | 0.041 | 0.088 | 0.89 | |
| Linear distance | FW2 | 0.124 | 0.072 | 0.01 | 0.006 | 0.99 | 0.087 | 0.051 | 0.007 | 0.004 | 0.83 |
| SSn | 0.156 | 0.301 | 0.012 | 0.024 | 0.96 | 1.158 | 2.213 | 0.092 | 0.175 | 0.88 | |
| DBW | 0.286 | 1.958 | 0.023 | 0.155 | 0.91 | 0.906 | 6.395 | 0.072 | 0.506 | 0.89 | |
| NAAr | 0.058 | 0.111 | 0.005 | 0.009 | 0.97 | 0.878 | 1.661 | 0.069 | 0.131 | 0.88 | |
| NAAl | 0.173 | 0.33 | 0.014 | 0.026 | 0.96 | 0.885 | 1.677 | 0.07 | 0.133 | 0.86 | |
| DL | 0.228 | 0.452 | 0.016 | 0.036 | 0.98 | 1.063 | 2.296 | 0.084 | 0.182 | 0.88 | |
| ABW | 0.014 | 0.047 | 0.001 | 0.004 | 0.97 | 0.61 | 1.986 | 0.048 | 0.157 | 0.97 | |
| ALLr | 0.193 | 0.609 | 0.015 | 0.048 | 0.94 | 0.071 | 0.224 | 0.006 | 0.018 | 0.92 | |
| ALLl | 0.335 | 1.045 | 0.026 | 0.083 | 0.93 | 0.147 | 0.461 | 0.012 | 0.036 | 0.91 | |
| TW | 0.188 | 1.881 | 0.015 | 0.149 | 0.87 | 0.274 | 2.702 | 0.022 | 0.214 | 0.76 | |
| TL | 0.139 | 1.286 | 0.011 | 0.102 | 0.9 | 0.139 | 2.041 | 0.161 | 1.481 | 0.73 | |
| NSL | 0.065 | 0.429 | 0.005 | 0.034 | 0.88 | 0.662 | 4.292 | 0.052 | 0.339 | 0.92 | |
| PRC | 0.091 | 1.452 | 0.007 | 0.115 | 0.82 | 0.067 | 1.069 | 0.005 | 0.085 | 0.86 | |
| NLAr | 0.008 | 0.055 | 0.001 | 0.004 | 0.97 | 0.319 | 2.135 | 0.025 | 0.169 | 0.79 | |
| NLAl | 0.078 | 0.52 | 0.006 | 0.041 | 0.96 | 0.205 | 1.358 | 0.016 | 0.107 | 0.97 | |
| NSAr | 0.077 | 1.152 | 0.006 | 0.091 | 0.98 | 0.52 | 7.522 | 0.041 | 0.595 | 0.94 | |
| NSAl | 0.003 | 0.051 | 0 | 0.004 | 0.96 | 0.317 | 4.933 | 0.025 | 0.39 | 0.86 | |
| SSt | 0.072 | 0.331 | 0.006 | 0.026 | 0.89 | 0.979 | 4.62 | 0.077 | 0.365 | 0.81 | |
| SMe | 0.072 | 0.105 | 0.006 | 0.008 | 0.96 | 1.373 | 2.004 | 0.109 | 0.158 | 0.85 | |
| StM | 0.006 | 0.012 | 0 | 0.001 | 0.95 | 0.395 | 0.831 | 0.031 | 0.066 | 0.86 | |
| CSn | 0.065 | 0.429 | 0.005 | 0.034 | 0.88 | 0.849 | 5.474 | 0.067 | 0.433 | 0.79 | |
| Angles | NDA | 0.182 | 0.104 | 0.014 | 0.008 | 0.86 | 0.669 | 0.384 | 0.053 | 0.03 | 0.77 |
| VNAr | 0.124 | 0.281 | 0.01 | 0.022 | 0.94 | 1.009 | 2.316 | 0.08 | 0.183 | 0.81 | |
| VNAl | 0.092 | 0.213 | 0.007 | 0.017 | 0.91 | 1.4 | 3.293 | 0.111 | 0.26 | 0.83 | |
| NA | 0.053 | 0.055 | 0.004 | 0.004 | 0.96 | 0.828 | 0.846 | 0.065 | 0.067 | 0.95 | |
| SFAr | 0.014 | 0.045 | 0.001 | 0.004 | 0.98 | 0.362 | 1.224 | 0.029 | 0.097 | 0.93 | |
| SFAl | 0.169 | 0.565 | 0.013 | 0.045 | 0.98 | 0.234 | 0.785 | 0.019 | 0.062 | 0.92 | |
| MFAr | 0.125 | 0.527 | 0.01 | 0.042 | 0.86 | 0.366 | 1.524 | 0.029 | 0.12 | 0.90 | |
| MFAl | 0.051 | 0.212 | 0.004 | 0.017 | 0.93 | 0.534 | 2.186 | 0.042 | 0.173 | 0.86 | |
| IFAr | 0.1 | 0.345 | 0.008 | 0.027 | 0.92 | 0.346 | 1.206 | 0.027 | 0.095 | 0.80 | |
| IFAl | 0.052 | 0.178 | 0.004 | 0.014 | 0.94 | 0.359 | 1.24 | 0.028 | 0.098 | 0.76 | |
| TFCA | 0.034 | 0.025 | 0.003 | 0.002 | 1 | 0.789 | 0.574 | 0.062 | 0.045 | 0.99 | |
| FCA | 0.012 | 0.008 | 0.001 | 0.001 | 0.98 | 1.471 | 0.895 | 0.116 | 0.071 | 0.96 | |
| TRA | 0.136 | 0.368 | 0.011 | 0.029 | 0.87 | 0.479 | 1.308 | 0.038 | 0.103 | 0.84 | |
| NOAr | 0.121 | 0.243 | 0.01 | 0.019 | 0.81 | 0.595 | 1.187 | 0.047 | 0.094 | 0.91 | |
| NOAl | 0.206 | 0.435 | 0.016 | 0.034 | 0.77 | 0.546 | 1.148 | 0.043 | 0.091 | 0.94 | |
| NTA | 0.258 | 0.325 | 0.02 | 0.026 | 0.93 | 0.216 | 0.272 | 0.017 | 0.021 | 0.93 | |
| Ratio | NWI | 0.001 | 0.556 | 0 | 0.111 | 0.96 | 0.002 | 1.197 | 0 | 0.095 | 0.86 |
| NLI | 0 | 0.047 | 0 | 0.004 | 0.95 | 0.009 | 2.464 | 0.001 | 0.195 | 0.81 | |
| DI1 | 0.002 | 0.243 | 0 | 0.019 | 0.86 | 0.004 | 0.516 | 0 | 0.058 | 0.86 | |
| DI2 | 0.004 | 0.352 | 0 | 0.028 | 0.95 | 0.018 | 1.596 | 0.001 | 0.126 | 0.94 | |
| NOI | 0.001 | 0.242 | 0 | 0.019 | 0.87 | 0.003 | 0.962 | 0.001 | 0.194 | 0.84 | |
| DBI | 0.008 | 1.627 | 0.001 | 0.129 | 0.85 | 0.007 | 1.391 | 0.001 | 0.11 | 0.91 | |
| TAR | 0.008 | 0.803 | 0.001 | 0.064 | 0.81 | 0.008 | 0.87 | 0.001 | 0.069 | 0.97 | |
| NARr | 0.006 | 0.284 | 0.001 | 0.022 | 0.98 | 0.065 | 2.939 | 0.005 | 0.232 | 0.92 | |
| NARI | 0.013 | 0.516 | 0.001 | 0.04 | 0.98 | 0.053 | 2.187 | 0.004 | 0.173 | 0.98 | |
| NSI | 0.004 | 0.526 | 0 | 0.04 | 0.83 | 0.014 | 1.966 | 0.001 | 0.155 | 0.82 | |
| Classification | Variable | Capture 1 | Capture 2 | MAD | REM | TEM | rTEM(%) | ICC |
|---|---|---|---|---|---|---|---|---|
| Linear Distance | FW | 118.33 | 118.71 | 0.379 | 0.32 | 0.03 | 0.025 | 0.99 |
| FL | 186.33 | 186.34 | 0.009 | 0.01 | 0.001 | 0 | 1 | |
| NRW | 26.15 | 26.15 | 0.007 | 0.03 | 0.001 | 0.002 | 0.99 | |
| EnD | 29.29 | 29.24 | 0.05 | 0.17 | 0.004 | 0.014 | 0.98 | |
| NL | 66.67 | 66.69 | 0.018 | 0.03 | 0.001 | 0.002 | 0.99 | |
| NBW | 30.59 | 30.51 | 0.077 | 0.25 | 0.006 | 0.02 | 1 | |
| Angles | NFRA | 144.08 | 144.67 | 0.598 | 0.41 | 0.047 | 0.033 | 1 |
| NLA | 121.58 | 121.73 | 0.145 | 0.12 | 0.011 | 0.009 | 1 |
| Classification | Variable | Capture 1 | Capture 2 | MAD | REM | TEM | rTEM(%) | ICC |
|---|---|---|---|---|---|---|---|---|
| Surface distance | GNS | 15.46 | 15.41 | 0.05 | 0.32 | 0.004 | 0.026 | 0.97 |
| DSL | 46.58 | 46.96 | 0.379 | 0.81 | 0.03 | 0.064 | 0.99 | |
| Linear Distance | FW2 | 171.43 | 171.36 | 0.062 | 0.04 | 0.005 | 0.003 | 1 |
| SSn | 51.75 | 51.83 | 0.078 | 0.15 | 0.006 | 0.012 | 0.99 | |
| DBW | 14.62 | 14.48 | 0.143 | 0.98 | 0.011 | 0.078 | 0.98 | |
| NAAr | 52.41 | 52.44 | 0.029 | 0.06 | 0.002 | 0.004 | 0.99 | |
| NAAl | 52.33 | 52.33 | 0 | 0 | 0 | 0 | 0.99 | |
| DL | 45.77 | 45.88 | 0.108 | 0.24 | 0.009 | 0.019 | 0.99 | |
| ABW | 30.43 | 30.42 | 0.007 | 0.02 | 0.001 | 0.002 | 0.99 | |
| ALLr | 31.72 | 31.62 | 0.097 | 0.31 | 0.008 | 0.024 | 0.99 | |
| ALLl | 32.04 | 31.88 | 0.167 | 0.52 | 0.013 | 0.041 | 0.98 | |
| TW | 10.01 | 9.92 | 0.094 | 0.95 | 0.007 | 0.075 | 0.97 | |
| TL | 10.82 | 10.76 | 0.07 | 0.65 | 0.006 | 0.051 | 0.98 | |
| NSL | 15.09 | 15.13 | 0.032 | 0.21 | 0.003 | 0.017 | 0.97 | |
| PRC | 6.26 | 6.22 | 0.045 | 0.73 | 0.004 | 0.058 | 0.95 | |
| NLAr | 14.8 | 14.8 | 0.004 | 0.03 | 0 | 0.002 | 0.99 | |
| NLAl | 15 | 15.04 | 0.039 | 0.26 | 0.003 | 0.021 | 0.99 | |
| NSAr | 6.66 | 6.69 | 0.038 | 0.58 | 0.003 | 0.045 | 0.99 | |
| NSAl | 6.28 | 6.28 | 0.002 | 0.03 | 0 | 0.002 | 0.99 | |
| SSt | 21.68 | 21.71 | 0.036 | 0.17 | 0.003 | 0.013 | 0.97 | |
| SMe | 69.2 | 69.24 | 0.036 | 0.05 | 0.003 | 0.004 | 0.99 | |
| StM | 47.77 | 47.76 | 0.003 | 0.01 | 0 | 0 | 0.99 | |
| CSn | 15.09 | 15.13 | 0.032 | 0.21 | 0.003 | 0.017 | 0.97 | |
| Angles | NDA | 174.78 | 174.87 | 0.091 | 0.05 | 0.007 | 0.004 | 0.97 |
| VNAr | 44.08 | 44.02 | 0.062 | 0.14 | 0.005 | 0.011 | 0.98 | |
| VNAl | 43.2 | 43.15 | 0.046 | 0.11 | 0.004 | 0.008 | 0.98 | |
| NA | 97.4 | 97.37 | 0.027 | 0.03 | 0.002 | 0.002 | 0.99 | |
| SFAr | 29.78 | 29.78 | 0.007 | 0.02 | 0.001 | 0.002 | 1 | |
| SFAl | 29.96 | 29.88 | 0.085 | 0.28 | 0.007 | 0.022 | 1 | |
| MFAr | 23.82 | 23.89 | 0.063 | 0.26 | 0.005 | 0.021 | 0.97 | |
| MFAl | 24.14 | 24.16 | 0.026 | 0.11 | 0.002 | 0.008 | 0.98 | |
| IFAr | 28.91 | 28.96 | 0.05 | 0.17 | 0.004 | 0.014 | 0.98 | |
| IFAl | 29.11 | 29.14 | 0.026 | 0.09 | 0.002 | 0.007 | 0.99 | |
| TFCA | 136.92 | 136.9 | 0.017 | 0.01 | 0.001 | 0.001 | 1 | |
| FCA | 163.64 | 163.65 | 0.006 | 0 | 0 | 0 | 1 | |
| TRA | 36.85 | 36.78 | 0.068 | 0.18 | 0.005 | 0.015 | 0.97 | |
| NOAr | 49.8 | 49.74 | 0.06 | 0.12 | 0.005 | 0.01 | 0.95 | |
| NOAl | 47.34 | 47.24 | 0.103 | 0.22 | 0.008 | 0.017 | 0.95 | |
| NTA | 79.45 | 79.32 | 0.129 | 0.16 | 0.01 | 0.013 | 0.98 | |
| Ratio | NWI | 0.18 | 0.18 | 0 | 0.11 | 0 | 0.008 | 0.98 |
| NLI | 0.36 | 0.36 | 0 | 0.03 | 0 | 0.002 | 0.98 | |
| DI1 | 0.78 | 0.78 | 0.001 | 0.12 | 0 | 0.01 | 0.96 | |
| DI2 | 1.09 | 1.09 | 0.002 | 0.18 | 0 | 0.014 | 0.99 | |
| NOI | 0.31 | 0.31 | 0 | 0.12 | 0 | 0.01 | 0.96 | |
| DBI | 0.5 | 0.5 | 0.004 | 0.82 | 0 | 0.065 | 0.97 | |
| TAR | 0.94 | 0.93 | 0.004 | 0.4 | 0 | 0.032 | 0.95 | |
| NARr | 2.26 | 2.26 | 0.003 | 0.14 | 0 | 0.011 | 0.99 | |
| NARI | 2.43 | 2.44 | 0.006 | 0.26 | 0 | 0.02 | 0.99 | |
| NSI | 0.71 | 0.71 | 0.002 | 0.26 | 0 | 0.021 | 0.96 |
Publisher’s Note: MDPI stays neutral with regard to jurisdictional claims in published maps and institutional affiliations. |
© 2022 by the authors. Licensee MDPI, Basel, Switzerland. This article is an open access article distributed under the terms and conditions of the Creative Commons Attribution (CC BY) license (https://creativecommons.org/licenses/by/4.0/).
Share and Cite
Li, Z.; Liang, Y.; Schenck, T.L.; Frank, K.; Giunta, R.E.; Koban, K.C. Investigating the Reliability of Novel Nasal Anthropometry Using Advanced Three-Dimensional Digital Stereophotogrammetry. J. Pers. Med. 2022, 12, 60. https://doi.org/10.3390/jpm12010060
Li Z, Liang Y, Schenck TL, Frank K, Giunta RE, Koban KC. Investigating the Reliability of Novel Nasal Anthropometry Using Advanced Three-Dimensional Digital Stereophotogrammetry. Journal of Personalized Medicine. 2022; 12(1):60. https://doi.org/10.3390/jpm12010060
Chicago/Turabian StyleLi, Zhouxiao, Yimin Liang, Thilo Ludwig Schenck, Konstantin Frank, Riccardo Enzo Giunta, and Konstantin Christoph Koban. 2022. "Investigating the Reliability of Novel Nasal Anthropometry Using Advanced Three-Dimensional Digital Stereophotogrammetry" Journal of Personalized Medicine 12, no. 1: 60. https://doi.org/10.3390/jpm12010060