
Quantifying Intracellular Viral Pathogen: Specimen Preparation, Visualization and Quantification of Multiple Immunofluorescent Signals in Fixed Human Airway Epithelium Cultured at Air-Liquid Interface
 , ,
, ,
Abstract
:1. Introduction
2. Materials and Methods
- (1)
- Human nasal epithelial (HNE) cells were collected into DMEM-based collection media with antibiotics following the brushing of the nasal inferior turbinate. Human bronchial epithelial (HBE) cells were collected from bronchoalveolar lavage fluid (BALF) obtained from participants during the bronchoscopy.
- (2)
- BALF or collection media containing nasal cells were spun at 300 g for 5 min at 4 °C.
- (3)
- Supernatant was removed, and the cell pellet was resuspended with 1 mL of conditional reprogramming (CR) media. Cell count was performed.
- (4)
- The airway epithelial cells were seeded into a Collagen-coated culture flask with 3T3-J2 irradiated feeder cells (seeding density of 8000 cells/cm2).
- (5)
- CR media was changed every second day until 90% confluency.
- (6)
- When cells reached 90% confluency, a differential trypsin method was used to dissociate the cells, and a cell count was performed.
- (7)
- Cells were cryopreserved for future use or were resuspended in PneumaCult Ex Plus Medium (antibiotic-free) for seeding directly onto membranes for differentiation.
- (8)
- Dissociated or thawed airway epithelial cells were plated onto the Collagen-coated apical compartment of permeable support insert(s) at a seeding density of 200,000–250,000 cells/insert in 150 μL Ex Plus Medium. Then, 750 μL Ex Plus Medium was added to the basal compartment below the inserts.
- (9)
- The changing of Ex Plus Medium was performed every second day until a confluent cell monolayer was formed (usually by day 4 post seeding).
- (10)
- Once confluent, cells were fed with PneumaCult ALI Medium (antibiotic-free) via both apical and basal compartments.
- (11)
- After 2 days of culture in submerged ALI Medium, the air-liquid interface was created by removing the apical media and exposing the cells to air. ALI Medium was added to the basal compartment only.
- (12)
- The basal media was changed every second day until full differentiation (day 21–25 post ALI establishment).
- (13)
- Once per week, mucus that accumulated on the apical surface of the epithelium was removed by incubating 200 μL of warmed PBS in the apical compartment for 10 min at 37 °C and was subsequently removed by aspiration.
- (A)
- Apply fixative, permeabilization and wash buffers to both apical and basal compartments to ensure that the buffers penetrate to all cells.
- (B)
- The volume of buffers, antibodies and mounting media in this protocol is optimized for 6.5 mm membranes (24 well plate, 0.33 cm2). A proportionally larger volume is needed for membranes with a larger surface area.
- (1)
- Remove basal culture media using a vacuum aspirator.
- (2)
- To remove cell debris, wash cells with room temperature (RT) PBS (200 µL apical, 1 mL basal) for 5 min at RT.
- (3)
- Remove PBS using vacuum aspirator.
- (4)
- Repeat PBS wash four times, for a total of five washes.
- (A)
- 4% PFA (all markers except ZO-1):
- (1)
- Fix cells in RT 4% PFA (200 µL apical, 750 µL basal) for 30 min at RT.
- (2)
- Remove PFA using a vacuum aspirator.
- (3)
- Neutralize excess PFA with RT 100 mM glycine in PBS (200 µL apical, 750 µL basal) for 30 min at RT.
- (4)
- Remove neutralization buffer using a vacuum aspirator.
- (B)
- Methanol:Acetone (ZO-1):
- (1)
- Fix and permeabilize cells in ice-cold methanol:acetone (200 µL apical, 750 µL basal) for 30 min at −20 °C.
- (2)
- Remove methanol:acetone using a vacuum aspirator.
- (1)
- Permeabilize cells with RT 0.5% Triton-X in PBS (200 µL apical, 750 µL basal) for 30 min on ice.
- (2)
- Remove permeabilization solution using a vacuum aspirator.
- (1)
- Wash cells with RT PBS (200 µL apical, 1 mL basal) to remove the residual fixative and permeabilization buffer.
- (2)
- Remove PBS using a vacuum aspirator.
- (3)
- Repeat PBS wash two times, for a total of three PBS washes.
- (4)
- Block cells with 10% normal goat serum in IF buffer (100 µL apical) for 90 min at RT. The basolateral compartment is kept empty.
- (1)
- Remove block buffer using a vacuum aspirator.
- (2)
- Incubate cells in the appropriate primary antibody(ies) (Table 1) diluted in block buffer (50 µL apical) for 48 h at 4 °C.
- (3)
- Seal the edges of the plate with sealing film (Parafilm) to prevent evaporation.
- (4)
- Store IF buffer in the fridge until secondary staining.
- (1)
- Remove primary antibody(ies) using a vacuum aspirator.
- (2)
- Wash cells with RT IF buffer (200 µL apical) for 5 min at RT.
- (3)
- Remove IF buffer using a vacuum aspirator.
- (4)
- Repeat wash with IF buffer four times, for a total of five IF buffer washes.
- (5)
- Incubate cells in the appropriate secondary antibody(ies) (Table 1) diluted in block buffer (50 µL apical) for 3 h at RT. Add phalloidin and DAPI to the secondary antibody(ies) cocktail if staining for actin and nuclei, respectively.
- (6)
- Protect cells from light using aluminum foil.
- (7)
- After 3 h incubation, check fluorescent signal under a fluorescence microscope (such as EVOS fluorescence microscope with blue, green and red channels) to ensure cells have been appropriately stained.
- (8)
- Remove secondary antibody(ies) cocktail using a vacuum aspirator.
- (9)
- Wash cells with RT IF buffer (200 µL apical) for 5 min at RT.
- (10)
- Remove IF buffer using a vacuum aspirator.
- (11)
- Repeat wash with IF buffer four times, for a total of five IF buffer washes.
- (1)
- Place the permeable support insert upright on a petri dish so that the membrane is touching the petri dish.
- (2)
- Use a fine scalpel (size 11) and cut around the membrane using the wall of insert as a guide (Figure S1).
- (3)
- Once the membrane is completely separated from the insert, lift the insert (without membrane) carefully and discard.
- (4)
- Rinse membrane with IF buffer (200 µL) to remove any debris from the excision.
- (5)
- Wipe the IF buffer and any debris off the petri dish with low lint disposable wipes (Kimwipes). Repeat wash if needed.
- (6)
- Slide the scalpel (ensure no debris on scalpel) underneath the membrane and transfer the membrane, apical side upward-facing, to a microscope slide.
- (A)
- Ensure the membrane is free of debris before mounting on the microscope slide so there is no artefact and the membrane is flat for imaging.
- (B)
- The membrane can be cut into two or three equal sections to allow the staining of more protein markers. Cut the membrane after blocking and perform primary/secondary staining on a microscope slide with the cell side facing up.
- (C)
- If the membrane accidentally flips upside-down, the apical side can be identified by its matte appearance, while the basal side of the membrane is glossy.
- (D)
- If excising more than one membrane, do not let the membranes become dry. Residual buffer from a wet membrane helps the membrane to “cling” to the slide. A dry membrane has the tendency to curl up at the sides, increasing the chance of flipping upside-down.
- (E)
- Up to two membranes can be mounted on a microscope slide.
- (1)
- Pipette 40 µL Vectashield Plus Antifade Mounting Medium onto the membrane without touching it.
- (2)
- Place a coverslip #1 thickness (0.13–0.16 mm) over the membrane at a 45° angle (one end resting against the slide and the other end supported with the scalpel) and lower the coverslip slowly to prevent air bubble formation.
- (3)
- Press the coverslip gently to remove excess mounting media and wipe clean with a low lint disposable wipe (Kimwipe).
- (4)
- Seal the edges of the coverslip with a coverslip sealant such as nail polish and let it dry.
- (5)
- Label the slide.
- (6)
- To ensure that the membrane is pressed flat optimal for imaging, sandwich the mounted membrane by first placing a disposable wipe (Kimwipe) and then a second slide (without sample) on top of the membrane slide. Align the slides so that when pressed, the weight is evenly distributed.
- (7)
- Cover the slides with aluminum foil to protect from light.
- (8)
- Press the slides with a weighted object, e.g., a full microscope slide box, and leave overnight at RT.
- (9)
- Store slides at 4 °C (protected from light) until imaging. Slides can be imaged immediately after being pressed or can be stored for at least one month at 4 °C.
- (1)
- Set up the microscope: objective: 63×/1.4; bit depth: 12-bit.
- (2)
- Set up the excitation laser and detector to optimize the collection of the fluorophores in the sample.
- (3)
- Adjust the format and/or zoom factor to fulfill the Nyquist sampling requirement [23]. If imaging a Z-stack, adjust the Z step size to fulfill the Nyquist sampling requirement.
- (1)
- Position the center of the membrane in the center of the field of view.
- (2)
- Set up the microscope: objective: 20×/0.5; format: 512 × 512 pixels; bit depth: 16-bit.
- (3)
- Set up the 25 × 25 tile scan function (6.4 mm × 6.4 mm) to image the whole membrane.
- (4)
- To ensure the whole membrane aligns and fits within the 25 × 25 tile scan, acquire a preview image of the center five columns (5 × 25 tile scan setting) and rows (25 × 5 tile scan setting). Adjust the position of the membrane as needed.
- (5)
- Use the plane of focus at the center of the membrane as the plane of focus for the whole membrane.
- (6)
- Adjust the exposure time and detector gain of each channel based on the brightest sample, ensuring that saturation does not occur in any pixel throughout the sample.
- (7)
- Acquire one 25 × 25 tile scan image per channel.
- (1)
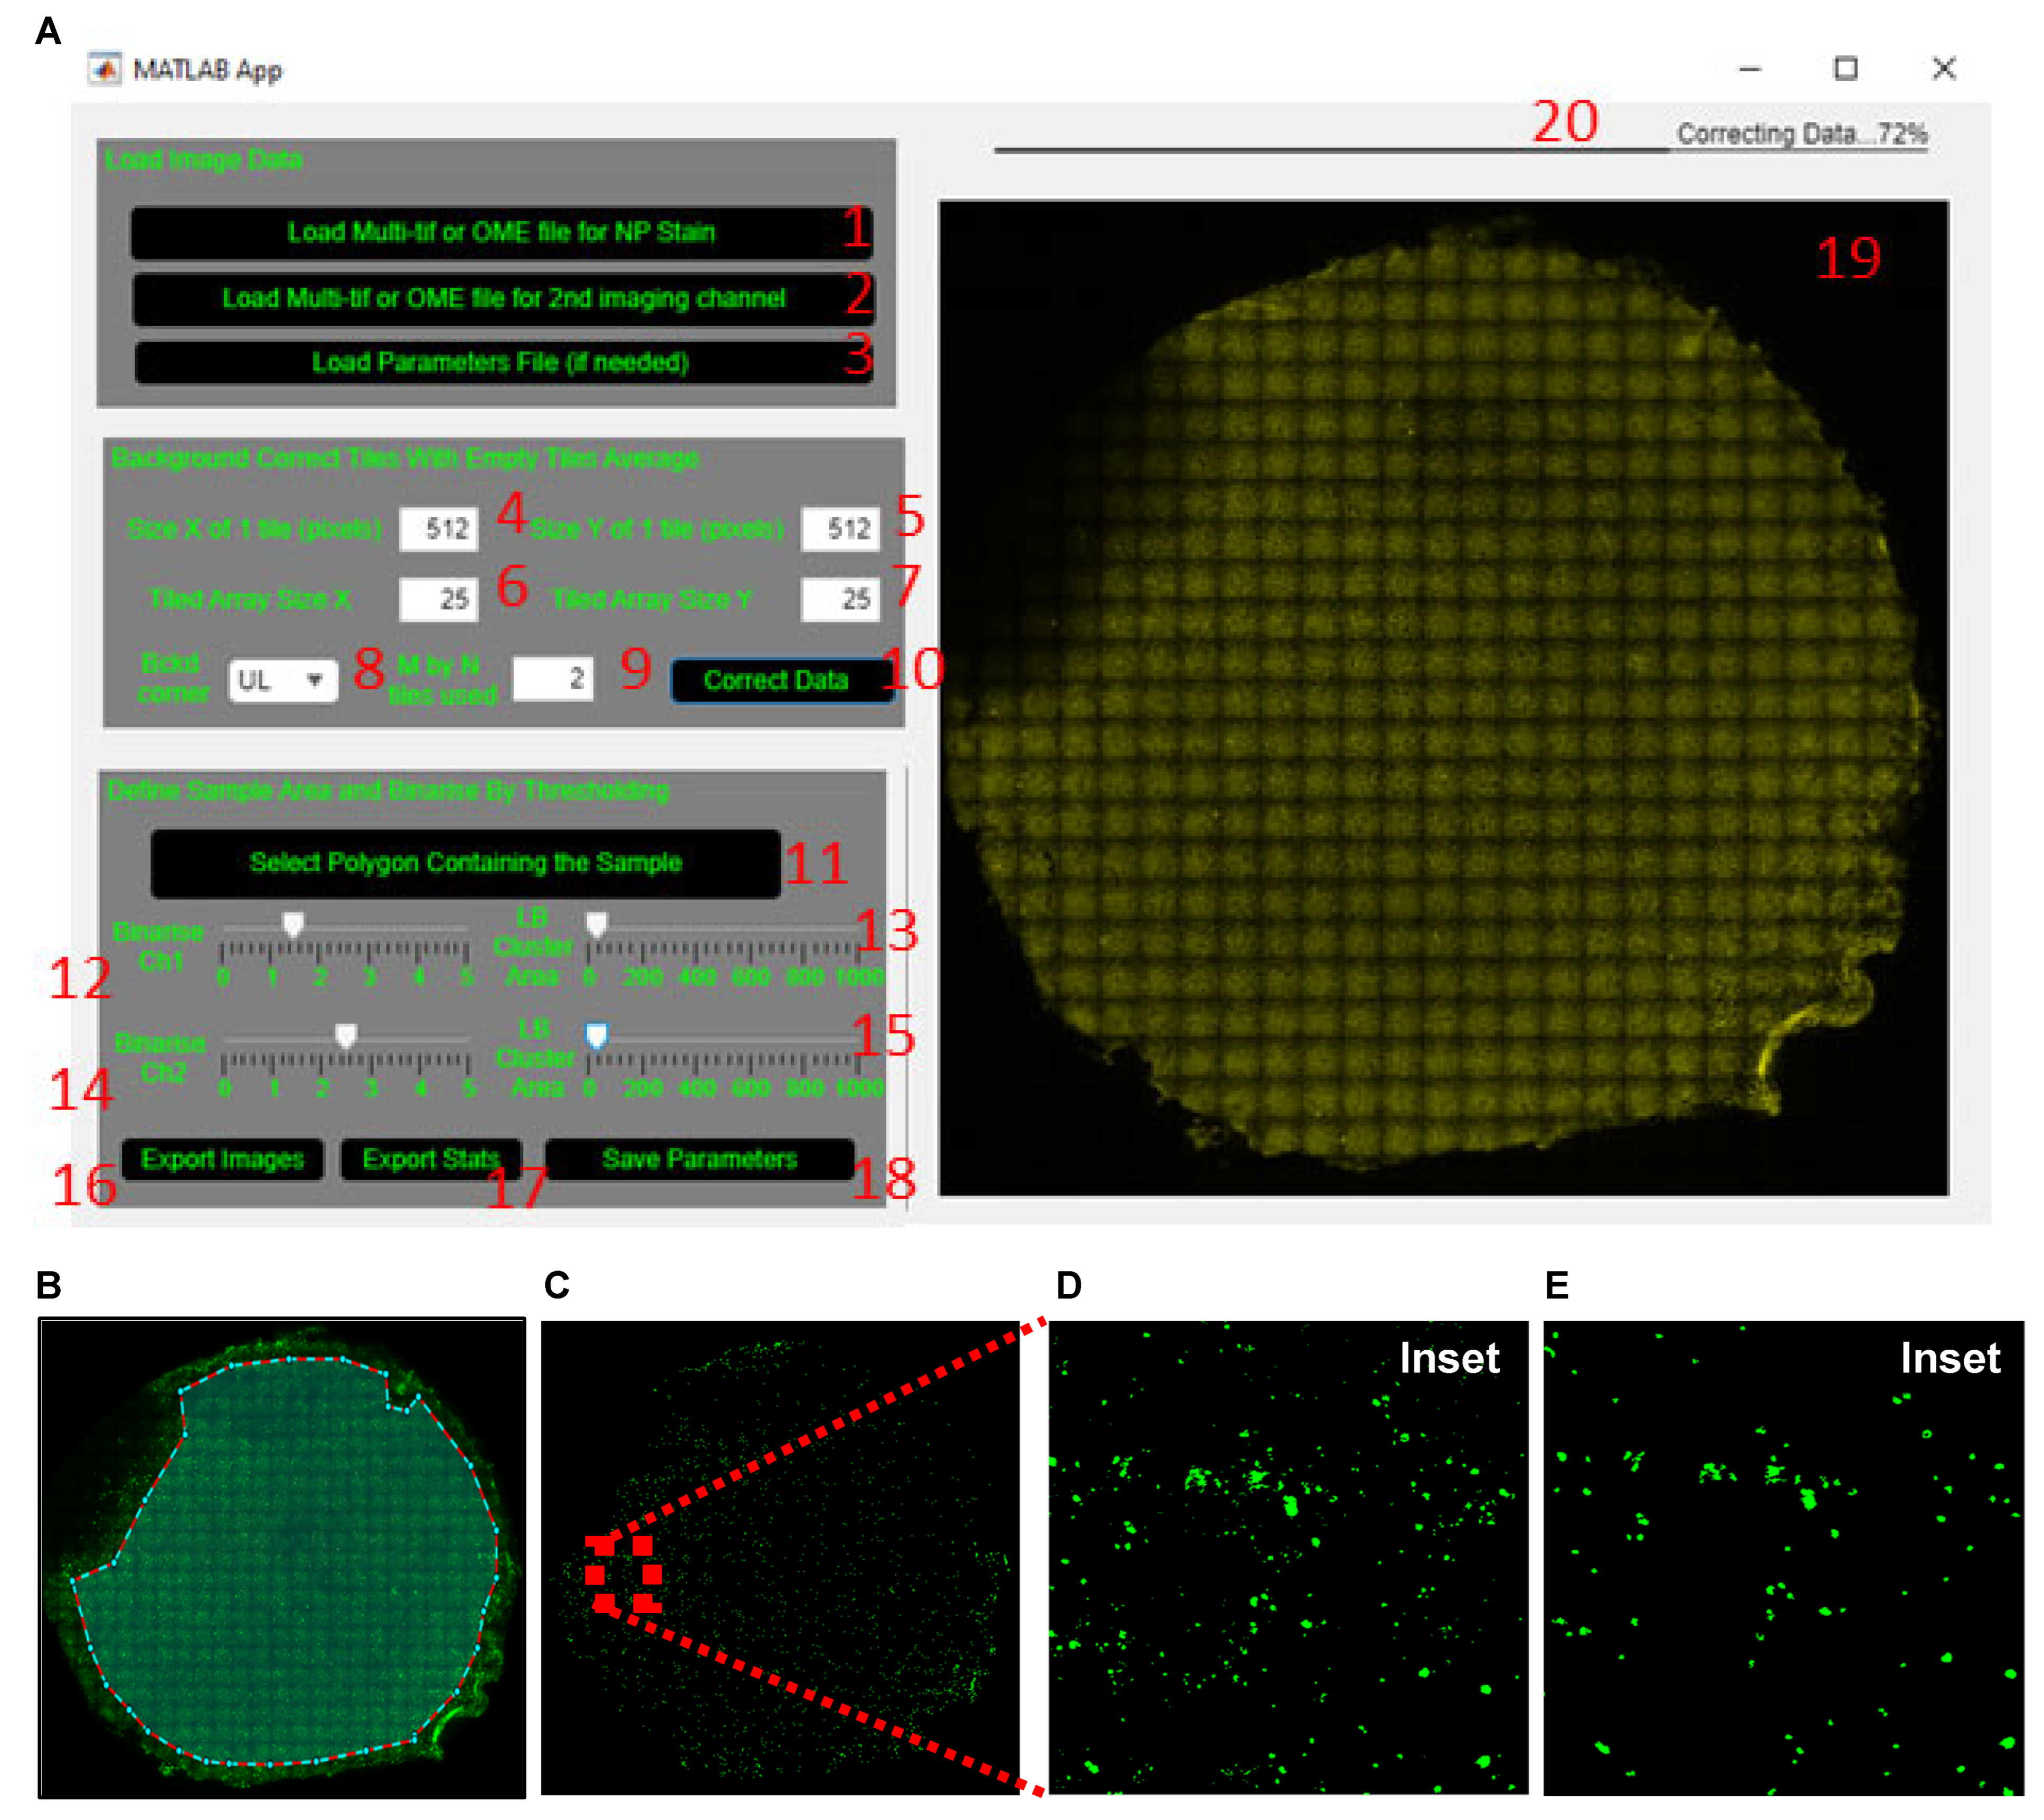
- Load the tiled image for dsRNA or a pathogen-specific protein (SARS-CoV-2 nucleoprotein (NP) in example datafile) by clicking the ‘Load Multi-tif or OME file for NP stain’ button (labelled 1, Figure 4A), respectively.
- (2)
- Load the tiled image of a cell marker such as the acetylated tubulin or MUC5AC (or other imaged markers) by clicking the ‘Load Multi-tif or OME file for 2nd imaging channel’ button (labelled 2, Figure 4A). If no co-stain is added, skip this step.
- (1)
- (2)
- Define which corner of the tiled image (upper left is default) and how many tiles within the chosen corner (2 by 2 is default) are used to obtain the average background tile profile (labelled 8 and 9, Figure 4A).
- (3)
- Apply the average background correction to every tile by clicking the ‘Correct Data’ button (labelled 10, Figure 4A).
- (1)
- Manually exclude from the analysis the regions that are out of focus or auto-fluorescent or have artefact. To do this, click the ‘Select Polygon Containing The Sample’ button (labelled 11, Figure 4A). Once the crosshair cursor appears, select the region of the membrane to include for analysis. Once an enclosed polygon is obtained, double right click to end the polygon selection (Figure 4B).
- (2)
- (3)
- Wait for the tiled image to update before re-adjusting the slider, since this step takes a few seconds to process (same for adjustment of the LB Cluster Area slider below).
- (4)
- Adjust the lower bound of the cluster area size using the ‘LB Cluster Area’ slider (labelled 13, Figure 4A) to filter out clusters smaller than ~10 µm (20 pixels in the sample image file provided). The inset in Figure 4C shows the same area of filter before (Figure 4D) and after (Figure 4E) cluster area filtering.
- (5)
- Proceed to the next step only after both ‘Binarize’ and ‘LB Cluster Area’ sliders have been adjusted; otherwise, the GUI will not generate the statistics excel in step 9.
- (6)
- Repeat steps 2–4 for acetylated tubulin or MUC5AC by adjusting the ‘Binarize Ch2’ and ‘LB Cluster Area’ sliders (labelled 14 and 15, Figure 4A).
- (7)
- (8)
- Proceed to the next step only after all images are successfully exported.
- (9)
- (10)
- Wait for the export of statistics to finish before opening the excel file; otherwise, it will incur an error. Use the ‘Preview’ pane in File Explorer (Windows) or Finder (Mac) to check the progress of the data export without opening the file.
- (11)
- Save the defined parameters by clicking the ‘Save Parameters’ button (labelled 18, Figure 4A) so that the same parameters can be applied to all tiled images from the same experiment.
- (12)
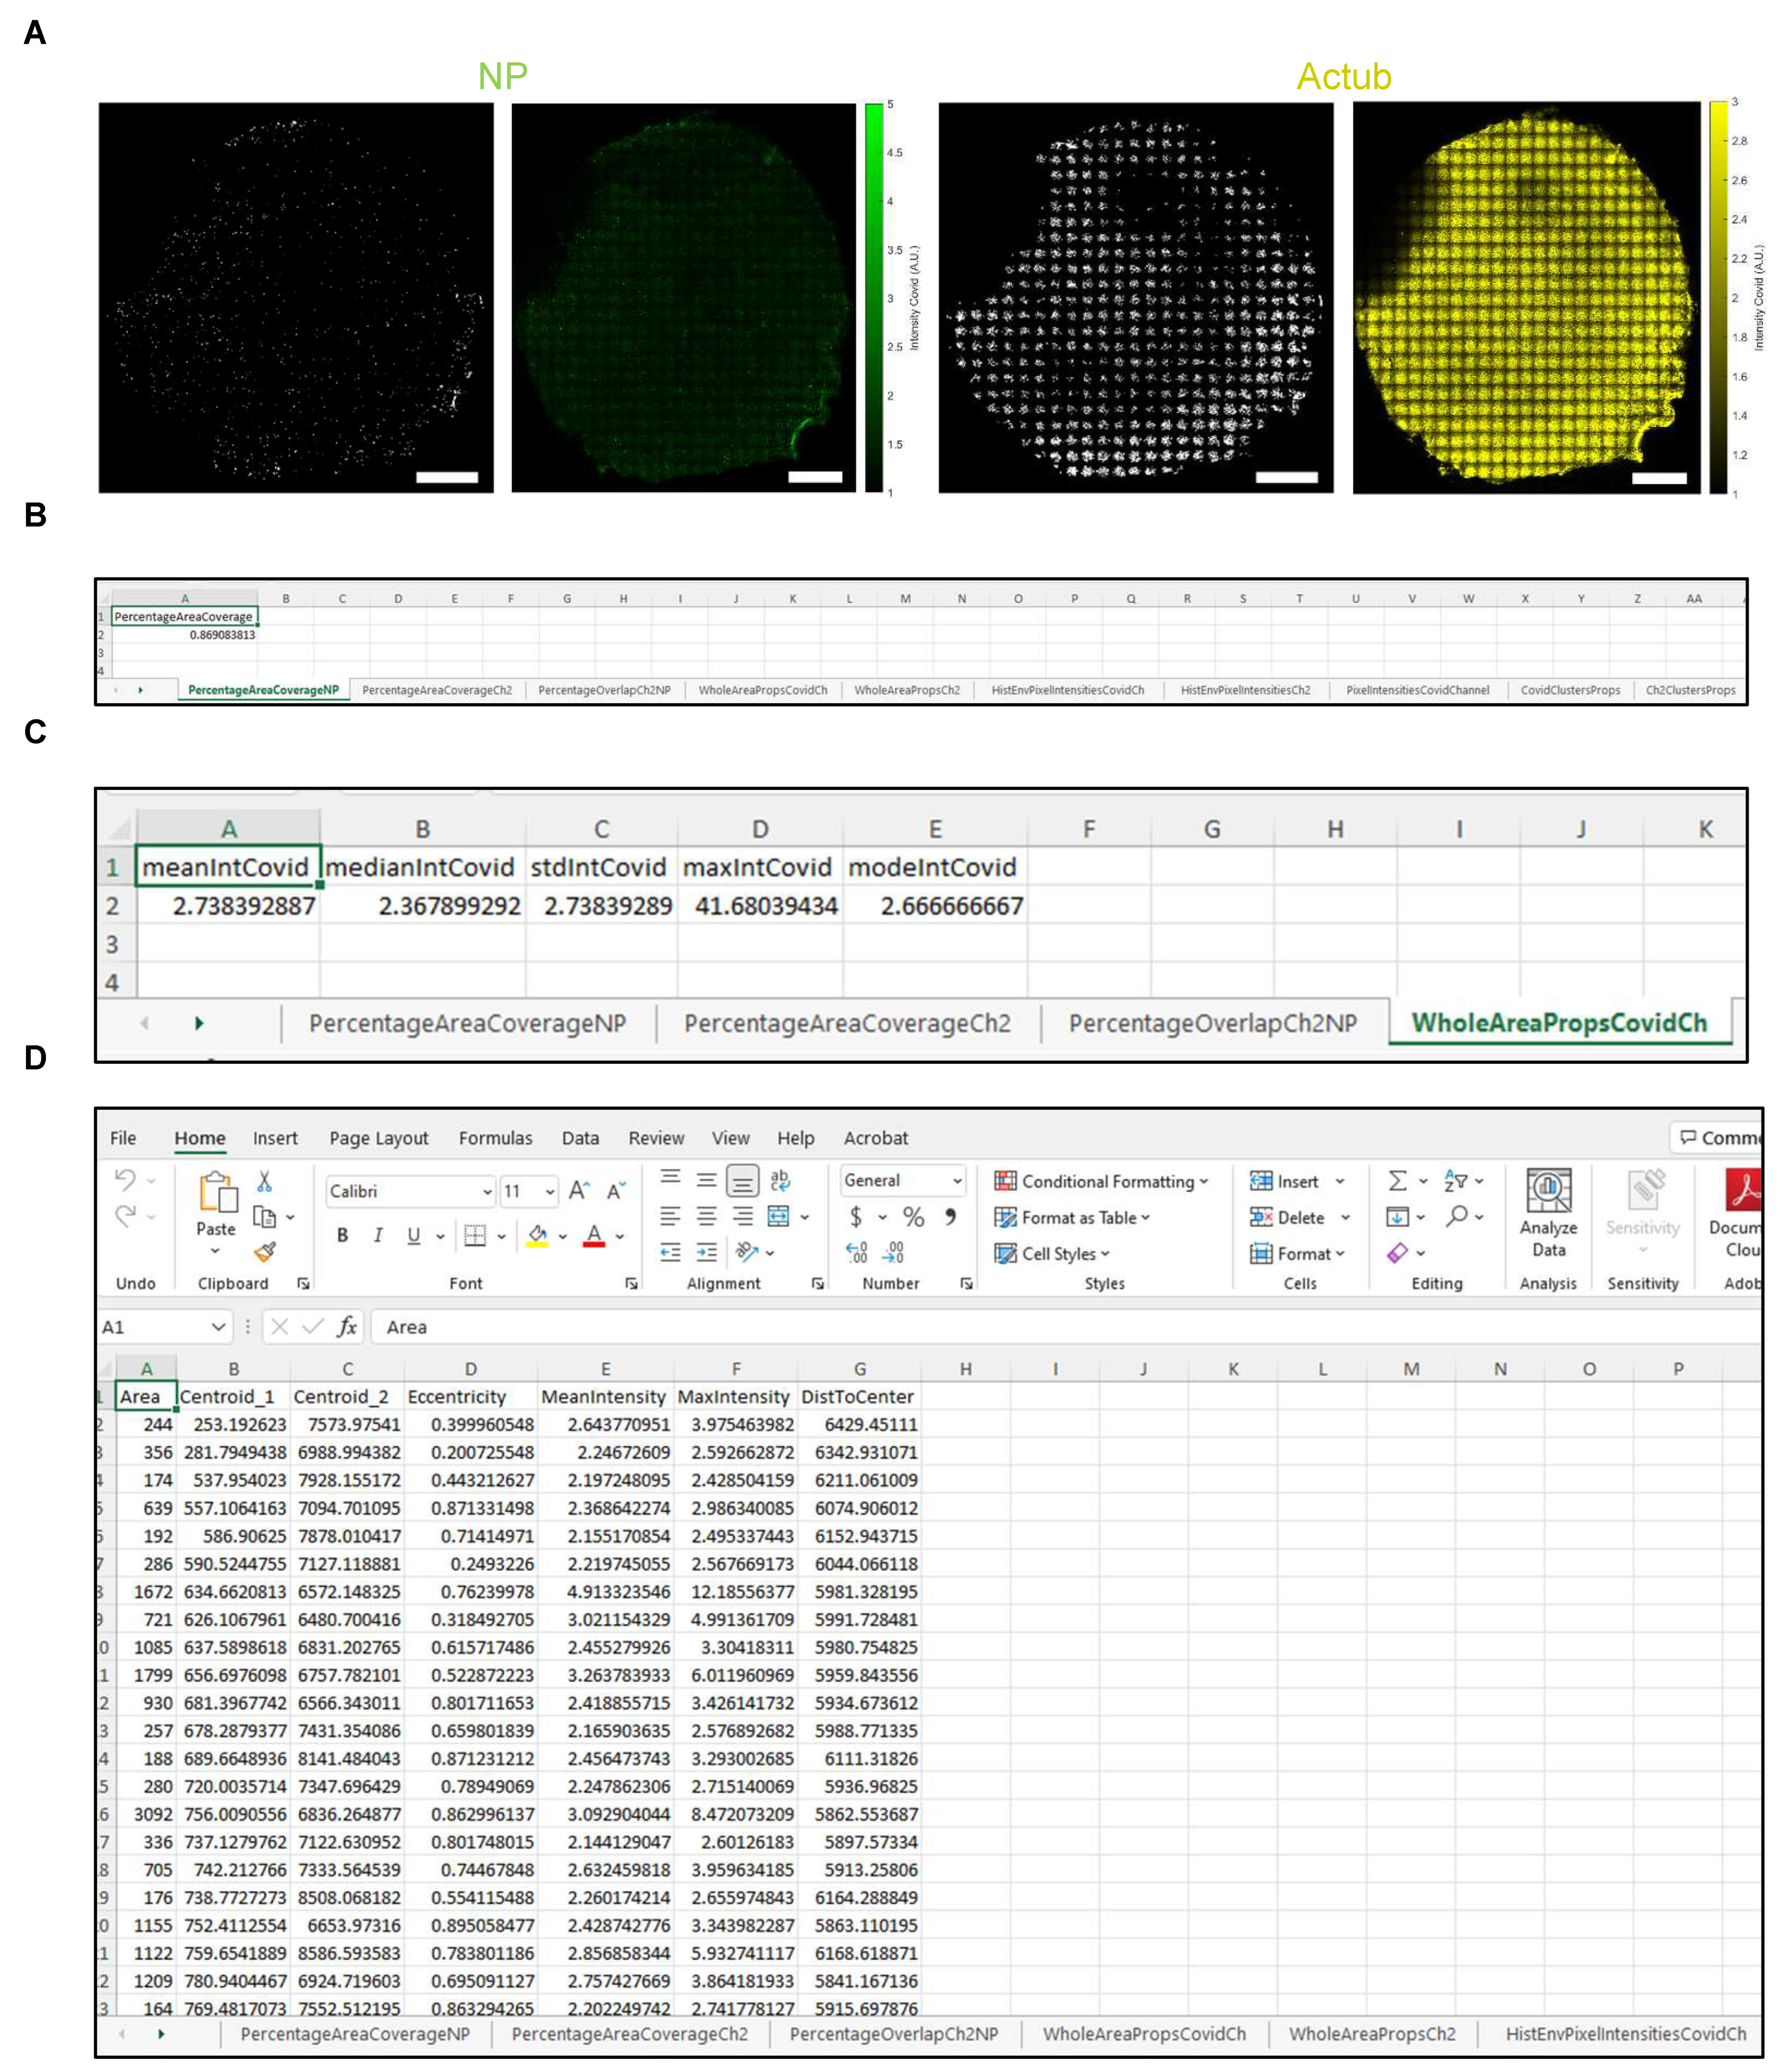
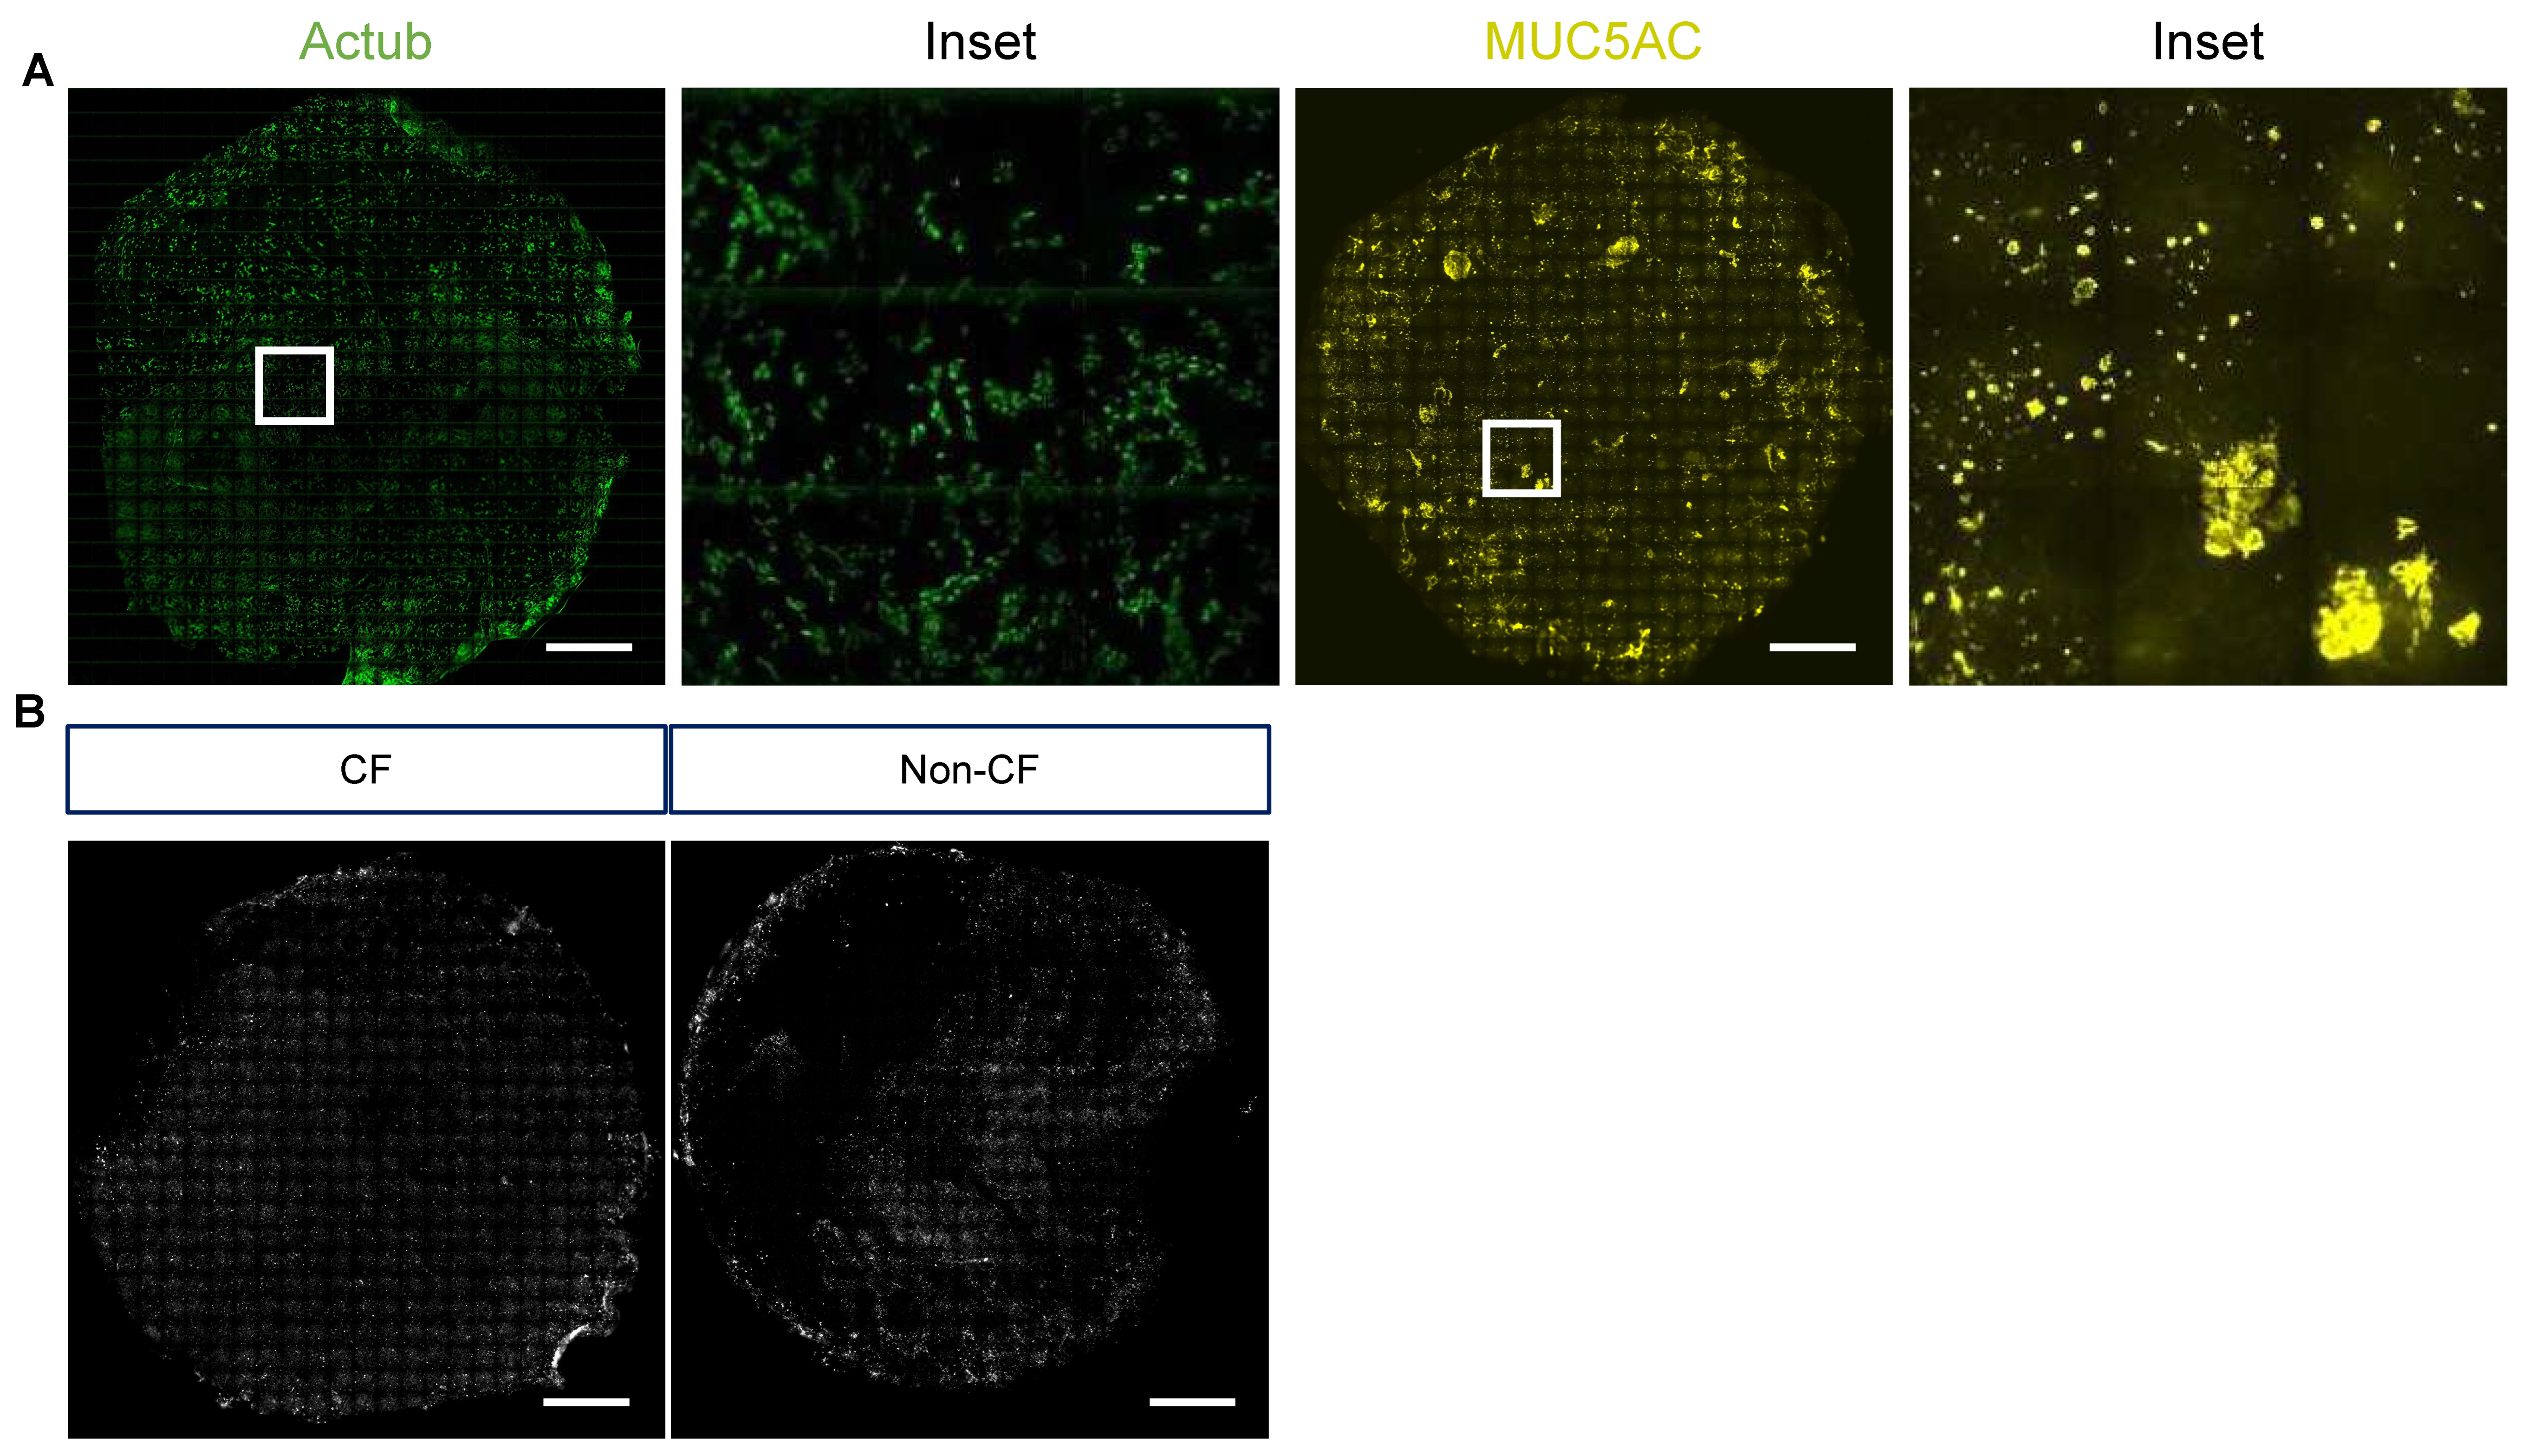
- Representative stitched tiled images of acetylated tubulin, MUC5AC and NP signal are shown in Figure 6A,B.

| Tab Name | Output |
|---|---|
| PercentageAreaCoverageNP | Area coverage (%) of dsRNA or NP signal (channel 1). |
| PercentageAreaCoverageCh2 | Area coverage (%) of acetylated tubulin or MUC5AC signal (channel 2). |
| PercentageOverlapCh2NP | Overlapping area (%) between dsRNA or NP (channel 1) and acetylated tubulin or MUC5AC (channel 2) signal. |
| WholeAreaPropsCovidCh | Intensity of dsRNA or NP signal (channel 1). |
| WholeAreaPropsCh2 | Intensity of acetylated tubulin or MUC5AC signal (channel 2). |
| HistEnvPixelIntensitiesCovidCh | x and y envelopes of the histogram of intensity for NP-positive pixels |
| HistEnvPixelIntensitiesCh2 | x and y envelopes of the histogram of intensity for acetylated tubulin- or MUC5AC-positive pixels |
| PixelIntensitiesCovidChannel | Intensity of all NP-positive pixels |
| CovidClustersProps | Statistics of the NP-positive clusters after segmentation and filtering. NOTE: Properties such as cluster area, centroid location and distance to filter center are expressed in pixels and need to be multiplied by pixel size to obtain physical units. Cluster eccentricity is unitless and is equal to 0 if the object is close to the circle and is 1 if it is line-like. The mean and max intensities of the cluster are expressed in relative fluorescence units. |
| Ch2ClustersProps | Statistics of the acetylated tubulin- or MUC5AC-positive clusters after segmentation and filtering |
3. Discussion
| Problem | Troubleshooting |
|---|---|
| Regions of the stitched tilescan image are out of focus. | This may be because the membrane is not flat or the cells appear as several layers due to the pseudostratified epithelial structure. Remounting the membrane may help if the membrane is not flat. Alternatively, acquire the stitched tilescan at multiple z-sections or manually outline and exclude the out of focus regions when performing quantification. |
| Fluorescent signal at the basal side (e.g., basal cell marker, p63) is dim and noisy. | This is likely because the basal side of the membrane is furthest away from the laser light source (most scattering and least penetration of light) and will have a lower signal-to-noise ratio. Use the Alexa Fluor 488 secondary antibody for a protein marker at the basal side to enhance the signal or perform tissue clearing to reduce scattering/increase the penetration of light. Ensure PBS wash is performed at least five times, five min each, to prevent non-specific binding. |
| Photobleaching | Photobleaching (fluorophore losing ability to fluoresce due to photochemical damage and covalent modification) is inevitable when imaging vertical Z-stack, considering the ALI cultures can be up to 50 µm thick. If a protein of interest has a dim signal and is localised to either the apical or basal half of the membrane, begin Z-stack imaging from that side of the membrane. Use detectors with higher sensitivity than the standard photomultiplier tubes (PMT) where available, such as the hybrid detector (HyD), which enables the use of reduced laser power and/or exposure time given its single-photon sensitivity and low dark noise (higher signal-to-noise ratio). Furthermore, ensure that photostable secondary antibodies and antifade mountants are used [33]. A comparison of antifade reagents was reviewed in detail in [33]. |
| Autofluorescence | Dead cells are generally known to cause autofluorescence due to increased non-specific binding [41]. Extracellular matrix components such as collagen and elastin also often present with intrinsic fluorescence, contributing to autofluorescence in the sample [42]. Ensure that PBS wash is performed at least five times, five min each, to remove debris to prevent non-specific binding. Overfixing with aldehyde fixatives routinely generates autofluorescence, as excessive reagents react with amines and proteins to generate fluorescent products [12]. Prevent overfixing by using only enough volume and duration of 4% PFA to fix membranes. It is also possible to quench excess unreacted PFA with glycine [43]. Avoid using mounting media with DAPI, as the exposure of DAPI to just a few seconds of UV excitation light during fluorescence imaging can photoconvert the dye to stable green- and red-emitting forms [44]. Alternatively, solvents such as Eriochrome black T, Sudan black B and sodium borohydride have been shown to be effective in reducing autofluorescence in stained airway samples [42,45,46]. |
Supplementary Materials
Author Contributions
Funding
Institutional Review Board Statement
Informed Consent Statement
Data Availability Statement
Acknowledgments
Conflicts of Interest
References
- Gruenert, D.C.; Finkbeiner, W.E.; Widdicombe, J.H. Culture and transformation of human airway epithelial cells. Am. J. Physiol. Cell. Mol. Physiol. 1995, 268 Pt 1, L347–L360. [Google Scholar] [CrossRef] [PubMed]
- Levardon, H.; Yonker, L.M.; Hurley, B.P.; Mou, H. Expansion of Airway Basal Cells and Generation of Polarized Epithelium. BIO-PROTOCOL 2018, 8, e2877. [Google Scholar] [CrossRef] [PubMed]
- Dijkman, R.; Jebbink, M.F.; Koekkoek, S.M.; Deijs, M.; Jónsdóttir, H.R.; Molenkamp, R.; Ieven, M.; Goossens, H.; Thiel, V.; van der Hoek, L. Isolation and Characterization of Current Human Coronavirus Strains in Primary Human Epithelial Cell Cultures Reveal Differences in Target Cell Tropism. J. Virol. 2013, 87, 6081–6090. [Google Scholar] [CrossRef] [PubMed] [Green Version]
- Zhu, N.; Wang, W.; Liu, Z.; Liang, C.; Wang, W.; Ye, F.; Huang, B.; Zhao, L.; Wang, H.; Zhou, W.; et al. Morphogenesis and cytopathic effect of SARS-CoV-2 infection in human airway epithelial cells. Nat. Commun. 2020, 11, 3910. [Google Scholar] [CrossRef]
- Tran, B.M.; Grimley, S.L.; McAuley, J.L.; Hachani, A.; Earnest, L.; Wong, S.L.; Caly, L.; Druce, J.; Purcell, D.F.; Jackson, D.C.; et al. Air-Liquid-Interface Differentiated Human Nose Epithelium: A Robust Primary Tissue Culture Model of SARS-CoV-2 Infection. Int. J. Mol. Sci. 2022, 23, 835. [Google Scholar] [CrossRef]
- Kiedrowski, M.R.; Bomberger, J.M. Viral-Bacterial Co-infections in the Cystic Fibrosis Respiratory Tract. Front. Immunol. 2018, 9, 3067. [Google Scholar]
- Gannon, A.D.; Darch, S.E. Same Game, Different Players: Emerging Pathogens of the CF Lung. mBio 2021, 12, e01217-20. [Google Scholar] [CrossRef]
- Morrison, C.B.; Edwards, C.E.; Shaffer, K.M.; Araba, K.C.; Wykoff, J.A.; Williams, D.R.; Asakura, T.; Dang, H.; Morton, L.C.; Gilmore, R.C.; et al. SARS-CoV-2 infection of airway cells causes intense viral and cell shedding, two spreading mechanisms affected by IL-13. Proc. Natl. Acad. Sci. USA 2022, 119, e2119680119. [Google Scholar] [CrossRef]
- Hou, Y.J.; Okuda, K.; Edwards, C.E.; Martinez, D.R.; Asakura, T.; Dinnon, K.H., III; Kato, T.; Lee, R.E.; Yount, B.L.; Mascenik, T.M.; et al. SARS-CoV-2 Reverse Genetics Reveals a Variable Infection Gradient in the Respiratory Tract. Cell 2020, 182, 429–446.e14. [Google Scholar] [CrossRef]
- Gamage, A.M.; Tan, K.S.; Chan, W.O.; Lew, Z.Z.; Liu, J.; Tan, C.W.; Rajagopalan, D.; Lin, Q.X.; Tan, L.M.; Venkatesh, P.N.; et al. Human Nasal Epithelial Cells Sustain Persistent SARS-CoV-2 Infection In Vitro, despite Eliciting a Prolonged Antiviral Response. mBio 2022, 13, e03436-21. [Google Scholar] [CrossRef]
- Capraro, A.; Wong, S.L.; Adhikari, A.; Allan, K.M.; Patel, H.R.; Zhong, L.; Raftery, M.; Jaffe, A.; Yeang, M.; Aggarwal, A.; et al. Ageing impairs the airway epithelium defence response to SARS-CoV-2. bioRxiv 2021. [Google Scholar] [CrossRef]
- Piña, R.; Santos-Díaz, A.I.; Orta-Salazar, E.; Aguilar-Vazquez, A.R.; Mantellero, C.A.; Acosta-Galeana, I.; Estrada-Mondragon, A.; Prior-Gonzalez, M.; Martinez-Cruz, J.I.; Rosas-Arellano, A. Ten Approaches That Improve Immunostaining: A Review of the Latest Advances for the Optimization of Immunofluorescence. Int. J. Mol. Sci. 2022, 23, 1426. [Google Scholar] [CrossRef] [PubMed]
- Im, K.; Mareninov, S.; Diaz, M.F.P.; Yong, W.H. An Introduction to Performing Immunofluorescence Staining. Method Mol. Biol. 2018, 1897, 299–311. [Google Scholar]
- Gentzsch, M.; Boyles, S.E.; Cheluvaraju, C.; Chaudhry, I.G.; Quinney, N.L.; Cho, C.; Dang, H.; Liu, X.; Schlegel, R.; Randell, S.H. Pharmacological Rescue of Conditionally Reprogrammed Cystic Fibrosis Bronchial Epithelial Cells. Am. J. Respir. Cell Mol. Biol. 2017, 56, 568–574. [Google Scholar] [CrossRef] [PubMed]
- Li, Y.; Renner, D.M.; Comar, C.E.; Whelan, J.N.; Reyes, H.M.; Cardenas-Diaz, F.L.; Truitt, R.; Tan, L.H.; Dong, B.; Alysandratos, K.D.; et al. SARS-CoV-2 induces double-stranded RNA-mediated innate immune responses in respiratory epithelial-derived cells and cardiomyocytes. Proc. Natl. Acad. Sci. USA 2021, 118, e2022643118. [Google Scholar] [CrossRef]
- Lamers, M.M.; van der Vaart, J.; Knoops, K.; Riesebosch, S.; Breugem, T.I.; Mykytyn, A.Z.; Beumer, J.; Schipper, D.; Bezstarosti, K.; Koopman, C.D.; et al. An organoid-derived bronchioalveolar model for SARS-CoV-2 infection of human alveolar type II-like cells. EMBO J. 2021, 40, e105912. [Google Scholar] [CrossRef]
- Mulay, A.; Konda, B.; Garcia, G., Jr.; Yao, C.; Beil, S.; Villalba, J.M.; Koziol, C.; Sen, C.; Purkayastha, A.; Kolls, J.K.; et al. SARS-CoV-2 infection of primary human lung epithelium for COVID-19 modeling and drug discovery. Cell Rep. 2021, 35, 109055. [Google Scholar] [CrossRef]
- Awatade, N.T.; Wong, S.L.; Capraro, A.; Pandzic, E.; Slapetova, I.; Zhong, L.; Turgutoglu, N.; Fawcett, L.K.; Whan, R.M.; Jaffe, A.; et al. Significant functional differences in differentiated Conditionally Reprogrammed (CRC)- and Feeder-free Dual SMAD inhibited-expanded human nasal epithelial cells. J. Cyst. Fibros. 2021, 20, 364–371. [Google Scholar]
- Wong, S.L.; Awatade, N.T.; Astore, M.A.; Allan, K.M.; Carnell, M.J.; Slapetova, I.; Chen, P.-C.; Setiadi, J.; Pandzic, E.; Fawcett, L.K.; et al. Molecular Dynamics and Theratyping in Airway and Gut Organoids Reveal R352Q-CFTR Conductance Defect. Am. J. Respir. Cell Mol. Biol. 2022, 67, 99–111. [Google Scholar] [CrossRef]
- Allan, K.M.; Wong, S.L.; Fawcett, L.K.; Capraro, A.; Jaffe, A.; Herbert, C.; Pandzic, E.; Waters, S.A. Collection, Expansion, and Differentiation of Primary Human Nasal Epithelial Cell Models for Quantification of Cilia Beat Frequency. J. Vis. Exp. 2021, 177, e63090. [Google Scholar] [CrossRef]
- Mallek, N.; Simmons, A.; McCullough, S. Measurement of Trans-Epithelial Electrical Resistance (TEER) with EndOhm Cup and EVOM2_Version 2.0. Research Square 2022. Available online: https://assets.researchsquare.com/files/pex-1891/v1/ca1d76f0-114c-4014-a3fa-470caff8e800.pdf?c=1649837629 (accessed on 29 July 2022).
- Buckley, A.G.; Looi, K.; Iosifidis, T.; Ling, K.-M.; Sutanto, E.N.; Martinovich, K.M.; Kicic-Starcevich, E.; Garratt, L.W.; Shaw, N.C.; Lannigan, F.J.; et al. Visualisation of Multiple Tight Junctional Complexes in Human Airway Epithelial Cells. Biol. Proced. Online 2018, 20, 3. [Google Scholar] [CrossRef] [PubMed] [Green Version]
- Oshana, R. 4—Overview of Digital Signal Processing Algorithms. In DSP Software Development Techniques for Embedded and Real-Time Systems; Oshana, R., Ed.; Newnes: Burlington, NJ, USA, 2006; pp. 59–121. [Google Scholar]
- Eltoum, I.; Fredenburgh, J.; Myers, R.B.; Grizzle, W.E. Introduction to the Theory and Practice of Fixation of Tissues. J. Histotechnol. 2001, 24, 173–190. [Google Scholar] [CrossRef]
- Singh, H.; Bishen, K.A.; Garg, D.; Sukhija, H.; Sharma, D.; Tomar, U. Fixation and Fixatives: Roles and Functions—A Short Review. Dent. J. Adv. Stud. 2019, 07, 051–055. [Google Scholar] [CrossRef]
- Hobro, A.J.; Smith, N. An evaluation of fixation methods: Spatial and compositional cellular changes observed by Raman imaging. Vib. Spectrosc. 2016, 91, 31–45. [Google Scholar] [CrossRef] [Green Version]
- Kiernan, J.A. Formaldehyde, Formalin, Paraformaldehyde And Glutaraldehyde: What They Are And What They Do. Microsc. Today 2000, 8, 8–13. [Google Scholar] [CrossRef] [Green Version]
- Pileri, S.A.; Roncador, G.; Ceccarelli, C.; Piccioli, M.; Briskomatis, A.; Sabattini, E.; Ascani, S.; Santini, D.; Piccaluga, P.P.; Leone, O.; et al. Antigen retrieval techniques in immunohistochemistry: Comparison of different methods. J. Pathol. 1997, 183, 116–123. [Google Scholar] [CrossRef]
- Brewington, J.J.; Filbrandt, E.T.; LaRosa, F.J., 3rd; Moncivaiz, J.D.; Ostmann, A.J.; Strecker, L.M.; Clancy, J.P. Brushed nasal epithelial cells are a surrogate for bronchial epithelial CFTR studies. JCI Insight 2018, 3, e99385. [Google Scholar] [CrossRef] [Green Version]
- Wong, K.; Lister, N.L.; Barsanti, M.; Lim, J.M.; Hammett, M.V.; Khong, D.M.; Siatskas, C.; Gray, D.H.; Boyd, R.L.; Chidgey, A.P. Multilineage Potential and Self-Renewal Define an Epithelial Progenitor Cell Population in the Adult Thymus. Cell Rep. 2014, 8, 1198–1209. [Google Scholar] [CrossRef] [Green Version]
- Tacha, D.; Teixeira, M. History and Overview of Antigen Retrieval: Methodologies and Critical Aspects. J. Histotechnol. 2002, 25, 237–242. [Google Scholar] [CrossRef]
- Acharya, P.; Quinlan, A.; Neumeister, V. The ABCs of finding a good antibody: How to find a good antibody, validate it, and publish meaningful data. F1000Research 2017, 6, 851. [Google Scholar] [CrossRef]
- Collins, T.J. Mounting Media and Antifade Reagents. Microsc. Today 2006, 14, 34–39. [Google Scholar] [CrossRef] [Green Version]
- Thorn, K. A quick guide to light microscopy in cell biology. Mol. Biol. Cell 2016, 27, 219–222. [Google Scholar] [CrossRef] [PubMed]
- Gill, G. Cover Glasses. In Cytopreparation; Springer: New York, NY, USA, 2013; pp. 279–292. Available online: https://www.researchgate.net/publication/302212093_Cover_Glasses (accessed on 29 July 2022).
- Dvorak, A.; Tilley, A.E.; Shaykhiev, R.; Wang, R.; Crystal, R.G. Do airway epithelium air-liquid cultures represent the in vivo airway epithelium transcriptome? Am. J. Respir. Cell Mol. Biol. 2011, 44, 465–473. [Google Scholar] [CrossRef] [PubMed]
- Bukowy-Bieryłło, Z. Long-term differentiating primary human airway epithelial cell cultures: How far are we? Cell Commun. Signal. 2021, 19, 63. [Google Scholar] [CrossRef]
- Ghosh, B.; Park, B.; Bhowmik, D.; Nishida, K.; Lauver, M.; Putcha, N.; Gao, P.; Ramanathan, M., Jr.; Hansel, N.N.; Biswal, S.; et al. Strong correlation between air-liquid interface cultures and in vivo transcriptomics of nasal brush biopsy. Am. J. Physiol. Cell. Mol. Physiol. 2020, 318, L1056–L1062. [Google Scholar] [CrossRef]
- Pezzulo, A.A.; Starner, T.D.; Scheetz, T.E.; Traver, G.L.; Tilley, A.E.; Harvey, B.-G.; Crystal, R.G.; McCray, P.B., Jr.; Zabner, J. The air-liquid interface and use of primary cell cultures are important to recapitulate the transcriptional profile of in vivo airway epithelia. Am. J. Physiol. Lung Cell. Mol. Physiol. 2011, 300, L25–L31. [Google Scholar] [CrossRef] [Green Version]
- Lotti, V.; Merigo, F.; Lagni, A.; Di Clemente, A.; Ligozzi, M.; Bernardi, P.; Rossini, G.; Concia, E.; Plebani, R.; Romano, M.; et al. CFTR Modulation Reduces SARS-CoV-2 Infection in Human Bronchial Epithelial Cells. Cells 2022, 11, 1347. [Google Scholar] [CrossRef]
- Kozlova, A.A.; Verkhovskii, R.A.; Ermakov, A.V.; Bratashov, D.N. Changes in Autofluorescence Level of Live and Dead Cells for Mouse Cell Lines. J. Fluoresc. 2020, 30, 1483–1489. [Google Scholar] [CrossRef]
- Davis, A.; Richter, A.; Becker, S.; Moyer, J.E.; Sandouk, A.; Skinner, J.; Taubenberger, J.K. Characterizing and Diminishing Autofluorescence in Formalin-fixed Paraffin-embedded Human Respiratory Tissue. J. Histochem. Cytochem. 2014, 62, 405–423. [Google Scholar] [CrossRef] [Green Version]
- Hoffman, E.A.; Frey, B.L.; Smith, L.M.; Auble, D.T. Formaldehyde Crosslinking: A Tool for the Study of Chromatin Complexes. J. Biol. Chem. 2015, 290, 26404–26411. [Google Scholar] [CrossRef] [Green Version]
- Roberts, L.M. Tips for Avoiding Artifacts from UV Photoconversion of DAPI. Microsc. Today 2019, 27, 18–24. [Google Scholar] [CrossRef] [Green Version]
- Baschong, W.; Suetterlin, R.; Laeng, R.H. Control of Autofluorescence of Archival Formaldehyde-fixed, Paraffin-embedded Tissue in Confocal Laser Scanning Microscopy (CLSM). J. Histochem. Cytochem. 2001, 49, 1565–1571. [Google Scholar] [CrossRef] [PubMed] [Green Version]
- Viegas, M.S.; Martins, T.C.; Seco, F.; Carmo, A. An improved and cost-effective methodology for the reduction of autofluorescence in direct immunofluorescence studies on formalin-fixed paraffin-embedded tissues. Eur. J. Histochem. 2007, 51, 59–66. [Google Scholar] [PubMed]


| Reagent or Resource | Source | Identifier |
|---|---|---|
| Antibodies|Dilution | ||
| Mouse monoclonal anti-dsRNA antibody J2|1:50 | Jena Bioscience, Jena, Germany | RNT-SCI-10010200 |
| Rabbit polyclonal anti-SARS Nucleocapsid Protein antibody|1:50 | Novus Biologicals, Centennial, CO, USA | NB100-56576SS |
| Mouse monoclonal anti-Acetylated Tubulin|1:250 | Sigma-Aldrich, St. Louis, MO, USA | T7451 |
| Mouse monoclonal anti-MUC5AC (45M1)|1:250 | Life Technologies, Carlsbad, CA, USA | MA5-12178 |
| Rabbit monoclonal anti-p63 antibody [EPR5701]|1:100 | Abcam, Cambridge, UK | ab124762 |
| Rabbit polyclonal anti-ZO-1 antibody|1:100 | Invitrogen, Waltham, MA, USA | 61-7300 |
| Goat polyclonal anti-mouse IgG antibody, Alexa Fluor 647|1:500 | Life Technologies | A-21236 |
| Goat polyclonal anti-rabbit IgG antibody, Alexa Fluor 488|1:500 | Life Technologies | A-11034 |
| Goat polyclonal anti-rabbit IgG antibody, Alexa Fluor 555|1:500 | Life Technologies | A-21429 |
| Biological samples | ||
| Human nasal epithelial cells | Molecular and Integrative Cystic Fibrosis (miCF) Research Centre Biobank, Randwick, Australia | https://wch.med.unsw.edu.au/micf-research-centre (accessed on 29 July 2022) |
| Human bronchial epithelial cells | Molecular and Integrative Cystic Fibrosis (miCF) Research Centre Biobank | https://wch.med.unsw.edu.au/micf-research-centre (accessed on 29 July 2022) |
| 3T3-J2 Irradiated feeder cells | STEMCELL Technologies, Vancouver, BC, Canada | 100-0353 |
| Media/Supplements | ||
| Conditional Reprogramming (CR) Medium | STEMCELL Technologies | 100-0352 |
| PneumaCult™-Ex Plus Medium | STEMCELL Technologies | 05040 |
| PneumaCult™-ALI Medium | STEMCELL Technologies | 05001 |
| Hydrocortisone Stock Solution | STEMCELL Technologies | 07925 |
| Heparin Solution | STEMCELL Technologies | 07980 |
| PureCol® | Advanced Biomatrix, Carlsbad, CA, USA | 5005 |
| Chemicals/Buffers | ||
| PBS, with Ca2+/Mg2+ | Sigma-Aldrich | D8662 |
| Phalloidin-Atto 565 | Sigma-Aldrich | 94072 |
| 4′,6-diamidino-2-phenylindole (DAPI) | Life Technologies | D1306 |
| Vectashield Plus Antifade Mounting medium | Vector Laboratories, Burlingame, CA, USA | H-1900 |
| 16% Formaldehyde (w/v), Methanol-free | Thermo Fisher, Waltham, MA, USA | 28908 |
| Methanol | Ajax Finechem, Seven Hills, Australia | AJA318 |
| Acetone | Ajax Finechem | AJA6 |
| Glycine | Sigma-Aldrich | G7126 |
| Triton-X | Sigma-Aldrich | T8787 |
| Tween 20 | Sigma-Aldrich | P2287 |
| BSA | Sigma-Aldrich | A2153 |
| Normal goat serum | Sigma-Aldrich | G9023 |
| Other | ||
| Corning 6.5 mm Transwell with 0.4 μm pore polyester membrane insert | Sigma-Aldrich | CLS3470 |
| Petri dish (60 mm) | Thermo Fisher | 150326 |
| SuperFrost® Plus Slides | Thermo Fisher | MENSF41296SP |
| Glass cover slips #1, 22 mm × 50 mm | Thermo Fisher | MENCS22501GP |
| Scalpel size 11 | - | - |
| Disposable wipes (Kimwipes) | Kimberly-Clark, Irving, TX, USA | - |
| Software and algorithms | ||
| MATLAB v9.9.0.1467703 | MathWorks, Natick, MA, USA | |
| Image J software v1.53c | National Institute of Health, Bethesda, MD, USA | |
| Microscope | ||
| EVOS fluorescence microscope | Thermo Fisher | - |
| Zeiss Elyra PALM/SIM microscope | Carl Zeiss, Jena, Germany | |
| Leica SP8 DLS confocal microscope | Leica Microsystems, Wetzlar, Germany |
| Buffers | Storage |
|---|---|
| Fixative: 4% paraformaldehyde (PFA) 1 mL 16% Formaldehyde (w/v), methanol-free 3 mL PBS | Aliquot and store at −20 °C for up to 6 months. Avoid exposure to light. |
| Neutralisation buffer: 100 mM glycine in PBS 75.07 mg glycine 10 mL PBS | Prepare fresh. |
| Permeabilisation buffer: 0.5% Triton-X in PBS 50 µL Triton-X 10 mL PBS. | Store at 4 °C for up to 1 year. |
| Immunofluorescence (IF) buffer: PBS with 0.1% BSA, 0.2% Triton, 0.05% Tween 20 40 mg BSA 40 mL PBS 80 µL Triton-X 20 µL Tween 20 | Store at 4 °C for up to 2 days. |
Publisher’s Note: MDPI stays neutral with regard to jurisdictional claims in published maps and institutional affiliations. |
© 2022 by the authors. Licensee MDPI, Basel, Switzerland. This article is an open access article distributed under the terms and conditions of the Creative Commons Attribution (CC BY) license (https://creativecommons.org/licenses/by/4.0/).
Share and Cite
Wong, S.L.; Pandzic, E.; Kardia, E.; Allan, K.M.; Whan, R.M.; Waters, S.A. Quantifying Intracellular Viral Pathogen: Specimen Preparation, Visualization and Quantification of Multiple Immunofluorescent Signals in Fixed Human Airway Epithelium Cultured at Air-Liquid Interface. J. Pers. Med. 2022, 12, 1668. https://doi.org/10.3390/jpm12101668
Wong SL, Pandzic E, Kardia E, Allan KM, Whan RM, Waters SA. Quantifying Intracellular Viral Pathogen: Specimen Preparation, Visualization and Quantification of Multiple Immunofluorescent Signals in Fixed Human Airway Epithelium Cultured at Air-Liquid Interface. Journal of Personalized Medicine. 2022; 12(10):1668. https://doi.org/10.3390/jpm12101668
Chicago/Turabian StyleWong, Sharon L., Elvis Pandzic, Egi Kardia, Katelin M. Allan, Renee M. Whan, and Shafagh A. Waters. 2022. "Quantifying Intracellular Viral Pathogen: Specimen Preparation, Visualization and Quantification of Multiple Immunofluorescent Signals in Fixed Human Airway Epithelium Cultured at Air-Liquid Interface" Journal of Personalized Medicine 12, no. 10: 1668. https://doi.org/10.3390/jpm12101668