Abstract
Background: This study aimed to retrospectively analyze dosimetric indicators recorded since 2012 for thoracic, abdominal or pelvic embolizations to evaluate the contribution of new tools and technologies in dose reduction. Methods: Dosimetric indicators (dose area product (DAP) and air kerma (AK)) from 1449 embolizations were retrospectively reviewed from August 2012 to March 2022. A total of 1089 embolizations were performed in an older fixed C-Arm system (A1), 222 in a newer fixed C-Arm system (A2) and 138 in a 4DCT system (A3). The embolization procedures were gathered to compare A1, A2 and A3. Results: DAP were significantly lower with A2 compared to A1 for all procedures (median −50% ± 5%, p < 0.05), except for uterine elective embolizations and gonadal vein embolization. The DAP values were significantly lower with A3 than with A1 (p < 0.001). CT scan was used for guidance in 90% of embolization procedures. Conclusions: The last C-Arm technology allowed a median reduction of 50% of the X-ray dose. The implementation of a CT scan inside the IR room allowed for more precise 3D-guidance with no increase of the dose delivered.
1. Introduction
Thoracic, abdominal or pelvic embolizations represent an important proportion of all procedures performed in interventional radiology (IR), with many indications [1,2,3,4]. Embolizations may be long and complex procedures, with high radiation doses delivered to the patients, and it is possible that the patient skin dose may exceed the threshold of deterministic effects (2 to 3 Gy), leading to radiodermatitis or alopecia [5,6,7,8]. Another issue, even when relatively low doses are delivered in IR, is the risk of long-term stochastic effects, including induced cancer [9,10]. Optimization of IR practices is thus needed to reduce these risks [11].
The International Commission on Radiological Protection (ICRP) has recommended the collection and monitoring of dose indicators for each patient exposed to ionizing radiation [11]. In IR, this collection allows for improved detection and follow-up of patients at risk of a deterministic effect to improve their therapeutic management. In addition, an evaluation of the skin dose can be performed when the air kerma at the interventional reference point (AK) or the dose area product (DAP) are high [12,13].
To reduce the doses delivered during interventional procedures, the optimization principle must be applied with great rigor. Dose optimization consists in reducing radiation doses as low as reasonably achievable while maintaining sufficient image quality. For this purpose, the protocols are often optimized by the medical physicists and the resulting image quality for each protocol is validated by the interventional radiologists [14]. Medical physicists may also train radiologists on good patient radiation protection practices. Finally, manufacturers develop new equipment to reduce the dose delivered to the patients, with a sufficient image quality, using new tools or new modalities to facilitate guidance and improve patient management [15,16,17,18,19,20,21].
In our institution, dosimetric indicators have been collected daily by medical physicists for all IR procedures since 2012 and methods to calculate or measure the skin dose have been implemented since 2013 [22,23]. Between 2012 and 2020, all embolizations were performed in a single vascular room equipped with a fixed C-arm. In 2020, this room was replaced by two new IR rooms: a room with a fixed C-arm and equipped with the ClarityIQ technology, which allows reducing the dose while maintaining an equivalent image quality, and a second room with a fixed C-arm coupled with a CT-scan. The use of the CT-scan in this new room allows improving percutaneous and vascular guidance, controlling the environment of the treated area and performing a control at the end of the procedure. For these two new equipped rooms, the protocols and practices have also been optimized. We therefore assumed that the new features introduced in these two rooms may modify the doses delivered and the management of the patients.
The purpose of our study was to retrospectively analyze the dosimetric indicators recorded since 2012 and evaluate the contribution of the new tools and new rooms in dose reduction and patient management.
2. Materials and Methods
2.1. Patient Study
The present retrospective study was approved by the local institutional review board (Interface Recherche Bioethique Institutional Review Board, number 22.04.03) and patient approval was waived due to the study retrospective character. The study was carried out in accordance with current guidelines and regulations. Patients (or their legal guardians) were systematically informed that their data were collected in an anonymous manner for a retrospective study and that they could refuse at any time to participate in the study (non-opposition statement).
Data were acquired consecutively for all adult participants undergoing thoracic or abdomen-pelvic embolization from August 2012 to March 2022 in our institute. Ten embolization procedures were studied (Table 1):

Table 1.
Patients’ characteristics.
- Bronchial artery embolizations (BE);
- Abdominal elective embolizations for scheduled treatment and visceral aneurysm (except for renal artery) treatments (AEE);
- Abdominal urgent embolizations for active bleedings or vascular injuries of digestive arteries (AUE);
- Hepatic chemoembolizations (HCE);
- Radioembolization for primary and metastatic liver cancers (RaE);
- Renal artery embolizations (RE);
- Pelvic embolizations for planned prostatic embolizations (PE);
- Uterine elective embolizations for leiomyomas or vascular malformations (UEE);
- Uterine urgent embolizations for postpartum hemorrhages (UUE);
- Gonadal vein embolizations (GVE).
Patients were not included in the study if they were under 18 years old or if they refused to participate in the study (opposition statement).
For all patients, the age, total dose area product (DAP), air kerma (AK), total fluoroscopy time (FT) and number of fluorography images were collected. The total dose length product (DLP) was collected only for patients who had undergone a CT scan during the procedure. For all procedures, the dosimetric indicators were collected daily from the dose reports available in the Picture Archiving and Communication System (PACS) or in the Dose Archiving and Communication System (DACS) by the medical physicists and were archived in a database.
2.2. X-ray Sources
From August 2012 to September 2020, all embolization procedures were performed on the fixed C arm Allura® Xper FD 20 (Philips Healthcare Systems, Best, The Netherlands) system (A1). Since Sept ember 2020, the embolization procedures were performed on the fixed C-arm Azurion 7 M20 (Philips Healthcare Systems, Best, The Netherlands) system (A2) or on the Alphenix 4DCT (Canon Medical Systems, Otawara, Japan) system (A3), which combines a flat-panel Angio C-arm (Alphenix) and a CT unit (Aquilion One Genesis). Seven embolization procedures studied were preferentially performed using the A2 system (BE, AEE, AUE, RE, UEE, UUE and GVE) and the three others preferentially using the A3 system (HCE, PE and RaE).
For the two Philips systems, the pulsed fluoroscopy mode (7.5 pulses) with an additional filtration of 0.9 mm Cu and 0.1 mm for the Al system were used. Digital subtraction angiography images were used for all embolization procedures with a frame rate of 2 or 3 frames according to the procedure performed and an additional filtration of 0.1 mm Cu and 0.1 mm for the Al system. Cone-beam CT acquisition was used for all PEs but not for the other procedures.
For the C-arm of the 4DCT, the low-pulsed fluoroscopy mode (5 or 7.5 pulses) and the additional filtration were used (from 0.2 to 0.5 mm Cu) depending on the procedure type, the difficulties encountered and the operator. For all embolization procedures, digital subtraction angiography images were used at a 3-frames rate and an additional 0.2 mm-Cu filtration. CT acquisitions were usually performed during the procedure to assess the proper vascular targeting of the embolization. CT acquisitions were initially performed for planning, guidance or post-embolization control [15,22].
For the A1 and A2 systems, the detector was rectangular with a diagonal length of 48 cm while in A3, the diagonal length was 40 cm. Eight electronic zooms were available in A1 and A2 (diagonals of 48/42/37/31/27/22/19/15 cm) and six in A3 (diagonals of 40/30/20/15/11/8 cm).
For the A1 and A2 systems, the AK was measured in air at a distance of 66 cm from the X-ray tube. For A3, the AK was measured in air at 55 cm from the X-ray tube but took into account the table and mattress attenuation. To compare the AK of the different systems, for A3, AK was corrected to be obtained at a 66-cm distance from the X-ray tube (correction factor of 0.694) and its measurement was performed in the air without taking into account the table and mattress attenuation (correction factor of 1.225).
The average field size during each procedure was calculated as the ratio of the total DAP to the total AK (in air at 66 cm from the X-ray tube). The proportion of fluoroscopy in the total dose was also calculated as the ratio of fluoroscopy DAP to total DAP.
2.3. Statistical Analysis
Statistical analyses were performed using the 3.5.1 version of R (R Core Team (2017); R: A language and environment for statistical computing; R Foundation for Statistical Computing, Vienna, Austria). For all quantitative data, normality was tested using the Shapiro–Wilk test. Data are presented as means and standard deviations or medians and 1st and 3rd quartiles, according to the variable statistical distribution.
The comparison of dosimetric indicators between the A1 and A2 systems was performed for the following embolization procedures: BE, AEE, AUE, RE, UEE, UUE and GVE, and for HCE, PE and RaE for the comparison between the A1 and A3 systems. The comparison between all dosimetric indicators was performed using the paired Mann–Whitney–Wilcoxon test. A p-value less than 0.05 was considered significant.
3. Results
3.1. Patients
During the study period, 1449 procedures were performed. There were 472 women and 977 men, of mean age 59.9 ± 19.9 (SD) (range: 18.0–99.8) years old (Table 1). A total of 1089 embolization procedures of all 10 procedure types were performed with the A1 system, 222 embolization procedures were performed with the A2 system, including 7 types of procedures (BE, AEE, AUE, RE, UEE, UUE and GVE), and 138 procedures of 3 different types (HCE, PE, and RaE) were performed with the A3 system. No adult patients objected to their participation in the study but 26 pediatric patients were excluded.
3.2. Comparison of the Dosimetric Indicators between the Allura FD 20 (A1) and the Azurion 7 M20 (A2) Systems
The dosimetric indicator values obtained with the A1 and A2 systems for the 7 embolization procedures performed with A2 are depicted in Table 2. The DAP values were significantly lower with A2 compared to A1 for all procedures (p < 0.05), except for GVE and UEE. For these two procedures, the differences between the medians were −32% for GVE (p = 0.09) and −26% for UEE (p = 0.481) while they were on average of −50% ± 5% for the 5 other procedures. AK values were lower with A2 compared to A1 for all procedures (p < 0.05), except for UUE (p = 0.224). The average difference between the medians for the 6 procedures were −56% ± 8% but −23% for UEE. The average field size was higher with A2 than with A1 (Figure 1A).
Table 2.
Comparison of the dosimetric indicators between the Allura FD20 (A1) and Azurion 7 M20 (A2) C-arms systems for 7 embolization procedures.
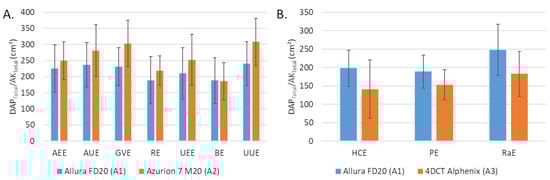
Figure 1.
Average field size corresponding to the total dose area product (DAP) on total air kerma at 66 cm ratio (A) between Allura FD20 (A1) and Azurion 7 M20 (A2) for 7 embolization procedures and (B) between Allura FD20 (A1) and 4DCT Alphenix (A3) for 3 embolization procedures (B). Values are expressed as means ± standard deviations (error bars). DAP: dose area product; AK: air kerma; AEE: abdominal elective embolizations for tumors and visceral aneurysms; AUE: abdominal urgent embolizations for active bleedings or vascular injuries of digestive arteries; BE: bronchial artery embolizations; HCE: hepatic chemoembolizations; PE: pelvic embolizations for planned prostatic embolizations; RaE: radioembolisations; RE: renal artery embolizations; UEE: uterine elective embolizations for leiomyomas or vascular malformations; UUE: uterine urgent embolizations for postpartum hemorrhages; GVE: gonadal vein embolization.
For the fluoroscopy time, similar values were found between the A1 and A2 systems for AEE, AUE and RE. FT were higher with A2 compared to A1 for the other 4 procedures with significant differences for GVE (p < 0.001) and UEE (p = 0.001).
The number of fluorographies was significantly lower with A2 compared to A1 for AEE, AUE and RE but the opposite for the other embolization procedures (GVE, UEE, BE and UUE). The differences were significant for UEE (p = 0.022) and UUE (p = 0.032). The proportion scopy DAP in the total DAP was greater with A2 than with A1 (Figure 2A).
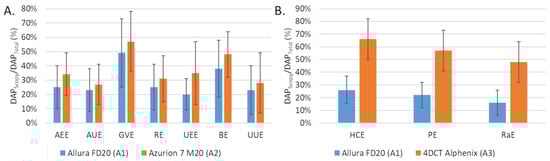
Figure 2.
Comparison of the fluoroscopy dose area product (DAP) to total DAP ratio (A) between the Allura FD20 (A1) and Azurion 7 M20 (A2) systems for 7 embolization procedures and (B) between the Allura FD20 (A2) and 4DCT Alphenix (A3) systems for 3 embolization procedures. Values are expressed as means ± standard deviations (error bars). DAP: dose area product; AEE: abdominal elective embolizations for tumors and visceral aneurysms; AUE: abdominal urgent embolizations for active bleedings or vascular injuries of digestive arteries; BE: bronchial artery embolizations; HCE: hepatic chemoembolizations; PE: pelvic embolizations for planned prostatic embolizations; RaE: radioembolisations; RE: renal artery embolizations; UEE: uterine elective embolizations for leiomyomas or vascular malformations; UUE: uterine urgent embolizations for postpartum hemorrhages; GVE: gonadal vein embolization.
3.3. Comparison of the Dosimetric Indicators between the Allura FD20 (A1) and the 4DCT Alphenix (A3) Systems
The dosimetric indicator values obtained with the A1 and A3 systems for HCE, PE and RaE procedures are depicted in Table 3. The DAP values were significantly lower with A3 than with A1 (p < 0.001). The corrected AK with the A3 system were significantly lower than with A1 for PE and RaE (p < 0.001) but the opposite for HCE (p = 0.827). The average field size was lower with A3 compared with A1, 120 ± 67 cm² vs. 198 ± 49 cm² for HCE, 130 ± 35 cm² vs. 189 ± 45 cm² for PE, 156 ± 52 cm² vs. 248 ± 69 cm² for RaE (Figure 1B).
Table 3.
Comparison of the dosimetric indicators between the Allura FD20 (A1) and 4DCT Alphenix (A3) C-arms systems for 3 embolization procedures.
The fluoroscopy time was higher with A3 than with A1 for the 3 procedures and the differences were significant for HCE (p < 0.001) and PE (p = 0.024). The number of graphy images was significantly lower with A3 than with A1 for all procedures. The proportion was higher for A2 than for A1 (Figure 1B).
With the A3 system, the CT-scan was used for 91% of HCE and PE procedures and 88% for RaE (Table 4). The median DLP were 267 (185; 629) mGy.cm for HCE, 228 (139; 392) mGy.cm for PE and 282 (189; 530) mGy.cm for RaE. The median number of CT acquisitions were 3 (2; 4) for HCE, 3 (2; 3) for PE and 2 (2; 4) for RaE.
Table 4.
Dose length product and number of CT acquisitions.
The proportion of CT acquisition types for the three embolization procedures studied are depicted in Figure 3. Volumic CT acquisitions represented 65% of the total CT acquisitions for HCE, 44% for PE and 52% for RaE. Perfusion CT acquisitions were used for HCE (1%) and PE (9%).
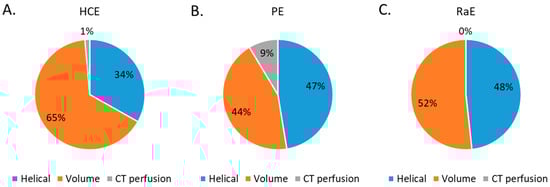
Figure 3.
Percentage of CT acquisition types for all 3 embolization procedures. (A) HCE: hepatic chemoembolizations; (B) PE: pelvic embolizations for planned prostatic embolizations; (C) RaE: radioembolisations.
3.4. Comparison of the Dosimetric Indicators with the Litterature
The dosimetric indicator values for the 5 embolization procedures studied (BE, UEE, UUE, RE, HCE) were lower than the proposed DRL, except for the fluoroscopic time of BE with A2 and that of HCE with A3, and for the number of graph images of HCE with A3 (Table 5).
Table 5.
Comparison of dosimetric indicators with the reference levels proposed by Etard et al. [10].
4. Discussion
A retrospective analysis of the doses delivered during 1449 thoracic, abdominal and/or pelvic embolization procedures was performed over a 10-year period during which three IR systems were used. The doses delivered in an older and a newer version of the IR system were compared. The contribution of CT in a multimodal room equipped with a scanner and a fixed C-arm was also compared to the older IR system.
The results of this study showed that the dosimetric indicator values collected for 7 embolization procedures were lower with the Azurion 7 M20 system (newer version) than with the Allura FD20 system (older version). AK values measured at the same interventional reference point were lower for the 7 embolization procedures studied. These differences were not related to differences in additional filtration or cadence for scopy (pulses/s) and graphy (images/s) as the same values were used with the two IR systems. They were directly related to the use of the ClarityIQ technology available in the new IR system. This technology was shown to reduce the image noise that improves image quality, and therefore reduces the dose while keeping the same image quality [16,17,18,19,20]. In this study, we found that the ClarityIQ technology reduced the AK by an average of 52% (24–65%), and the DAP to a lesser extent. Similar outcomes were found for AK reductions in different studies on uterine fibroid embolizations [16,18,19], bronchial artery embolization [20] and transarterial chemoembolization [17]. However, the reductions in DAP were smaller than those found in these studies [16,17,18,19,20]. This can be explained by the fact that the DAP variation was related to the increase in mean field size values, which may be related to the new service organization replacing a single room by two newly equipped rooms. Indeed, the room with the C-arm alone, which was mainly dedicated to the emergency embolizations and short-term endovascular procedures, was mostly used by junior radiologists (fellows and trainees). The complex and time-consuming procedures were usually performed in the 4DCT room by the senior radiologists. In the older IR room, the procedures were performed by both junior and senior radiologists. Junior radiologists often tend to use larger fields of exposure and increase the number of X-ray control, which resulted in an increased number of graphy images and a longer fluoroscopy time. This was reported for BE, UEE, UUE and GVE procedures while the other studies found similar or decreased fluoroscopy times using a C-arm system equipped with the ClarityIQ technology [16,17,18]. Training junior radiologists to good patient radiation protection practices is therefore essential to harmonize and improve practices, and thus reduce the doses delivered to the patients. Furthermore, the DAP and AK values obtained in this study for these two IR systems were lower than the national DRL values [10], which shows that the practices in our institution were already optimized [14] and were even more so with the arrival of this new IR system. Last, the median DAP values of UEE and BE for both C-arm systems used in our study were lower than the DAP values found in the literature [16,18,19,20]. For these procedures, our fluoroscopy times were within the range of those found in these studies [16,18,20].
The variations in dosimetric indicators obtained between the older IR system and the 4DCT room depended on the procedure performed. The AK values were lower with the 4DCT than with the older IR system for PE and RaE procedures but for HCE AK values were slightly higher with the 4DCT. These results are directly related to the use of CT acquisitions during the procedure, which changes patient management. For PE and RaE procedures, the helical and volume angiographic CT acquisitions were performed at the beginning, during and at the end of the procedure. These images provide a more accurate anatomy and a 3D artery volume, which could be merged with the IR images to improve treatment planning and simplify the procedure. Conversely, for HCE procedures, the use of CT angiography allows the treatment of several targets that could not be treated with standard IR systems and CBCT acquisitions. An ancillary study could be carried out to correlate the AK values with the number of targets treated. Additionally, the use of CT during the procedure changed the operators’ practices. Compared to the older IR system, the fluoroscopy times were increased but the number of graphy images were significantly reduced. The radiologists do their planning under CT and their follow-up with fluoroscopy with a sufficient and adapted image quality. This reduces the radiologist’s need for digital subtraction angiography acquisitions, which significantly reduces the number of graphy images. It should also be noted that the average field size was reduced using the Alphenix C-arm. In contrast to Azurion 7 M20, the most complex procedures were performed in the 4DCT system with the help of CT and were performed by senior radiologists who were more aware of the good practices. The AK and DAP values obtained for HCE were lower than the national DRL values [10]. However, the DAP, AK and fluoroscopy time values were higher in our study than those found by Piron et al. [15] for HCE. Although this result may be explained by the differences in the complexity of the procedures and the number of targets treated (not evaluated in this study), optimization of the procedure is required to be implemented in our 4DCT system to reduce the dose delivered to patients. Additionally, the dose reduction tools proposed by Canon “Live Zoom” and “Spot fluoro” were rarely used in the 4DCT room whereas they were used for all HCE procedures in the Piron et al. study [15]. Awareness of the use of these tools in the 4DCT room should be performed by the interventional radiologists. On the other hand, the DLP values found in our study were lower than those found by Piron et al. [15]. This result may be linked to the use of a deep-learning image reconstruction algorithm (AiCE) in our CT system compared to the iterative reconstruction algorithm (AIDR 3D) used in their study [24]. Indeed, this new algorithm was shown to improve the image quality and have a high potential for dose reduction compared to the iterative reconstruction algorithm.
This study has some limitations. It reflects the practices of a single center, with a 10-year experience of thorough optimization processes and the presence of two medical physicists. As the two new IR systems were installed in September 2020, the patient samples may be different from the older IR system. However, the number of patients was sufficient to perform a statistical analysis. In addition, this study only focused on the dosimetric indicators; clinical factors were not taken into account. Another limitation is that the experience of the operators was only indirectly taken into account in the study of the new organization with two new rooms dedicated to the junior and senior radiologists, unlike the older room. The 4DCT, with its much higher anatomical precision, allows carrying out more complex procedures which should impact the dose received by the patients [25]. Furthermore, we did not evaluate the differences in image quality between the different rooms for the different procedures studied. Also, the acquisition protocols were defined by the medical physicist and the application engineer and the resulting image quality was validated by the interventional radiologists in each room. However, for some patients and some complex procedures, the image quality proposed may not have been sufficient and adapted, especially in scopy, which may explain the higher scopy time in the 4DCT room. Further targeted studies will be carried out to validate the image quality. Last, ancillary studies may now be performed to correlate the dose indicators with the number of targets or with the type of arteries/veins or organs treated.
5. Conclusions
This monocentric retrospective analysis of the doses delivered during thoracic, abdominal and pelvic embolization procedures over a 10-year period showed the contribution of the new IR tools in dose reduction and patient management. The last C-arm technology reduced the image noise and improved image quality, allowing a 50% reduction of the air kerma and showing a significant dose reduction. The implementation of a CT scan inside the IR room allowed a more precise 3D guidance without increasing the dose delivered to the patients.
Author Contributions
Conceptualization, J.G. (Joël Greffier) and J.F.; methodology, J.G. (Joël Greffier), D.D. and J.F.; validation, J.G. (Joël Greffier) and J.F.; formal analysis, J.G. (Joël Greffier) and J.F.; investigation, J.G. (Joël Greffier) and J.F.; resources, J.-P.B. and J.F.; data curation, J.G. (Joël Greffier), D.D. and J.F.; writing—original draft preparation, J.G. (Joël Greffier) and J.F.; writing—review and editing, all authors; visualization, J.G. (Jean Goupil), T.K., G.T.B., L.B., J.F. and J.-P.B.; supervision, J.F. and J.-P.B.; project administration, J.-P.B. and J.F.; funding acquisition, no funding. All authors have read and agreed to the published version of the manuscript.
Funding
This research received no external funding.
Institutional Review Board Statement
The study was conducted in accordance with the Declaration of Helsinki, and approved by the Institutional Review Board of the Nîmes University Hospital (number 22.04.03, approved on 22 April 2022).
Informed Consent Statement
Patient consent was waived due to the retrospective character of the study. According to the current national regulation, patients (or their legal guardian when necessary) were systematically informed that their data were collected for an anonymous retrospective study and could refuse at any time to participate in the study (non-opposition statement).
Data Availability Statement
The data presented in this study are available on request from the corresponding author.
Acknowledgments
The authors would like to thank Hélène de Forges for her help in writing and editing the manuscript.
Conflicts of Interest
The authors declare no conflict of interest.
References
- Szemitko, M.; Golubinska-Szemitko, E.; Warakomski, M.; Falkowski, A. Evaluation of CRC-Metastatic Hepatic Lesion Chemoembolization with Irinotecan-Loaded Microspheres, According to the Site of Embolization. J. Pers. Med. 2022, 12, 414. [Google Scholar] [CrossRef] [PubMed]
- Talaie, R.; Torkian, P.; Moghadam, A.D.; Tradi, F.; Vidal, V.; Sapoval, M.; Golzarian, J. Hemorrhoid embolization: A review of current evidences. Diagn. Interv. Imaging 2022, 103, 3–11. [Google Scholar] [CrossRef] [PubMed]
- Chevallier, O.; Comby, P.O.; Guillen, K.; Pellegrinelli, J.; Mouillot, T.; Falvo, N.; Bardou, M.; Midulla, M.; Aho-Glele, S.; Loffroy, R. Efficacy, safety and outcomes of transcatheter arterial embolization with N-butyl cyanoacrylate glue for non-variceal gastrointestinal bleeding: A systematic review and meta-analysis. Diagn. Interv. Imaging 2021, 102, 479–487. [Google Scholar] [CrossRef]
- Young, S. Prostate artery embolization for benign prostatic hyperplasia: The hunt for the ideal patient population. Diagn. Interv. Imaging 2021, 102, 119–120. [Google Scholar] [CrossRef]
- Balter, S.; Hopewell, J.W.; Miller, D.L.; Wagner, L.K.; Zelefsky, M.J. Fluoroscopically guided interventional procedures: A review of radiation effects on patients’ skin and hair. Radiology 2010, 254, 326–341. [Google Scholar] [CrossRef] [PubMed]
- Koenig, T.R.; Wolff, D.; Mettler, F.A.; Wagner, L.K. Skin injuries from fluoroscopically guided procedures: Part 1, characteristics of radiation injury. AJR Am. J. Roentgenol. 2001, 177, 3–11. [Google Scholar] [CrossRef] [PubMed]
- Miller, D.L.; Balter, S.; Cole, P.E.; Lu, H.T.; Berenstein, A.; Albert, R.; Schueler, B.A.; Georgia, J.D.; Noonan, P.T.; Russell, E.J.; et al. Radiation doses in interventional radiology procedures: The RAD-IR study: Part II: Skin dose. J. Vasc. Interv. Radiol. 2003, 14, 977–990. [Google Scholar] [CrossRef] [PubMed]
- Valentin, J. Avoidance of radiation injuries from medical interventional procedures. Ann. ICRP 2000, 30, 7–67. [Google Scholar] [CrossRef]
- Pearce, M.S.; Salotti, J.A.; Little, M.P.; McHugh, K.; Lee, C.; Kim, K.P.; Howe, N.L.; Ronckers, C.M.; Rajaraman, P.; Sir Craft, A.W.; et al. Radiation exposure from CT scans in childhood and subsequent risk of leukaemia and brain tumours: A retrospective cohort study. Lancet 2012, 380, 499–505. [Google Scholar] [CrossRef]
- Etard, C.; Bigand, E.; Salvat, C.; Vidal, V.; Beregi, J.P.; Hornbeck, A.; Greffier, J. Patient dose in interventional radiology: A multicentre study of the most frequent procedures in France. Eur. Radiol. 2017, 27, 4281–4290. [Google Scholar] [CrossRef] [PubMed]
- ICRP Publication 103: The 2007 Recommendations of the International Commission on Radiological Protection. Ann. ICRP 2007, 37, 1–332.
- Stecker, M.S.; Balter, S.; Towbin, R.B.; Miller, D.L.; Vano, E.; Bartal, G.; Angle, J.F.; Chao, C.P.; Cohen, A.M.; Dixon, R.G.; et al. Guidelines for patient radiation dose management. J. Vasc. Interv. Radiol. 2009, 20, S263–S273. [Google Scholar] [CrossRef] [PubMed]
- Miller, D.L.; Balter, S.; Schueler, B.A.; Wagner, L.K.; Strauss, K.J.; Vano, E. Clinical radiation management for fluoroscopically guided interventional procedures. Radiology 2010, 257, 321–332. [Google Scholar] [CrossRef] [PubMed]
- Greffier, J.; Goupil, J.; Larbi, A.; Stefanovic, X.; Pereira, F.; Moliner, G.; Ovtchinnikoff, S.; Beregi, J.P.; Frandon, J. Assessment of patient’s peak skin dose during abdominopelvic embolization using radiochromic (Gafchromic) films. Diagn. Interv. Imaging 2018, 99, 321–329. [Google Scholar] [CrossRef]
- Piron, L.; Le Roy, J.; Cassinotto, C.; Delicque, J.; Belgour, A.; Allimant, C.; Beregi, J.P.; Greffier, J.; Molinari, N.; Guiu, B. Radiation Exposure During Transarterial Chemoembolization: Angio-CT Versus Cone-Beam CT. Cardiovasc. Interv. Radiol. 2019, 42, 1609–1618. [Google Scholar] [CrossRef] [PubMed]
- Schernthaner, R.E.; Haroun, R.R.; Nguyen, S.; Duran, R.; Sohn, J.H.; Sahu, S.; Chapiro, J.; Zhao, Y.; Radaelli, A.; van der Bom, I.M.; et al. Characteristics of a New X-ray Imaging System for Interventional Procedures: Improved Image Quality and Reduced Radiation Dose. Cardiovasc. Interv. Radiol. 2018, 41, 502–508. [Google Scholar] [CrossRef]
- Schernthaner, R.E.; Duran, R.; Chapiro, J.; Wang, Z.; Geschwind, J.F.; Lin, M. A new angiographic imaging platform reduces radiation exposure for patients with liver cancer treated with transarterial chemoembolization. Eur. Radiol. 2015, 25, 3255–3262. [Google Scholar] [CrossRef]
- Kohlbrenner, R.; Kolli, K.P.; Taylor, A.G.; Kohi, M.P.; Lehrman, E.D.; Fidelman, N.; Conrad, M.; LaBerge, J.M.; Kerlan, R.K.; Gould, R. Radiation Dose Reduction during Uterine Fibroid Embolization Using an Optimized Imaging Platform. J. Vasc. Interv. Radiol. 2017, 28, 1129–1135 e1121. [Google Scholar] [CrossRef]
- Thomaere, E.; Dehairs, M.; Laenen, A.; Mehrsima, A.; Timmerman, D.; Cornelissen, S.; Op de Beeck, K.; Bosmans, H.; Maleux, G. A new imaging technology to reduce the radiation dose during uterine fibroid embolization. Acta Radiol. 2018, 59, 1446–1450. [Google Scholar] [CrossRef]
- Spink, C.; Avanesov, M.; Schmidt, T.; Grass, M.; Schoen, G.; Adam, G.; Koops, A.; Ittrich, H.; Bannas, P. Noise reduction angiographic imaging technology reduces radiation dose during bronchial artery embolization. Eur. J. Radiol. 2017, 97, 115–118. [Google Scholar] [CrossRef]
- Spink, C.; Avanesov, M.; Schmidt, T.; Grass, M.; Schoen, G.; Adam, G.; Bannas, P.; Koops, A. Radiation dose reduction during transjugular intrahepatic portosystemic shunt implantation using a new imaging technology. Eur. J. Radiol. 2017, 86, 284–288. [Google Scholar] [CrossRef]
- Greffier, J.; Belaouni, A.; Dabli, D.; Goupil, J.; Perolat, R.; Akessoul, P.; Kammoun, T.; Hoballah, A.; Beregi, J.P.; Frandon, J. Comparison of peak skin dose and dose map obtained with real-time software and radiochromic films in patients undergoing abdominopelvic embolization. Diagn. Interv. Imaging 2022, 103, 338–344. [Google Scholar] [CrossRef]
- Greffier, J.; Grussenmeyer-Mary, N.; Hamard, A.; Goupil, J.; Miller, D.E.; Cayla, G.; Ledermann, B.; Demattei, C.; Beregi, J.P.; Frandon, J. Clinical evaluation of a dose management system-integrated 3D skin dose map by comparison with radiochromic films. Eur. Radiol. 2020, 30, 5071–5081. [Google Scholar] [CrossRef]
- Greffier, J.; Dabli, D.; Frandon, J.; Hamard, A.; Belaouni, A.; Akessoul, P.; Fuamba, Y.; Le Roy, J.; Guiu, B.; Beregi, J.P. Comparison of two versions of a deep learning image reconstruction algorithm on CT image quality and dose reduction: A phantom study. Med. Phys. 2021, 48, 5743–5755. [Google Scholar] [CrossRef]
- Schembri, V.; Piron, L.; Le Roy, J.; Hermida, M.; Lonjon, J.; Escal, L.; Pierredon, M.A.; Belgour, A.; Cassinotto, C.; Guiu, B. Percutaneous ablation of obscure hypovascular liver tumours in challenging locations using arterial CT-portography guidance. Diagn. Interv. Imaging 2020, 101, 707–713. [Google Scholar] [CrossRef]


Publisher’s Note: MDPI stays neutral with regard to jurisdictional claims in published maps and institutional affiliations. |
© 2022 by the authors. Licensee MDPI, Basel, Switzerland. This article is an open access article distributed under the terms and conditions of the Creative Commons Attribution (CC BY) license (https://creativecommons.org/licenses/by/4.0/).