
Computed Tomography-Based L1 Bone Mineral Density in 624 Dutch Trauma Patients—Are North American Reference Values Valid in Europe?

 , , ,
, , ,
Abstract
:1. Introduction
2. Materials and Methods
2.1. Study Population
2.2. Radiologic Assessment
2.3. Statistical Analysis
3. Results
4. Discussion
Author Contributions
Funding
Institutional Review Board Statement
Informed Consent Statement
Data Availability Statement
Conflicts of Interest
Appendix A

| β-Coefficient | S.E. | t-Value | p-Value | Pearson’s Correlation Coefficient (ρ; 95% CI) | |
|---|---|---|---|---|---|
| Total | −0.77 (−0.80–−0.73) | ||||
| Intercept | 273.39 | 4.43 | 61.75 | <0.001 | |
| Age | −2.42 | 0.08 | −29.99 | <0.001 | |
| Men | −0.73 (−0.77–−0.68) | ||||
| Intercept | 264.09 | 5.55 | 47.54 | <0.001 | |
| Age | −2.31 | 0.11 | −21.93 | <0.001 | |
| Women | −0.85 (−0.88–−0.80) | ||||
| Intercept | 298.01 | 7.25 | 41.09 | <0.001 | |
| Age | −2.72 | 0.12 | −22.25 | <0.001 |

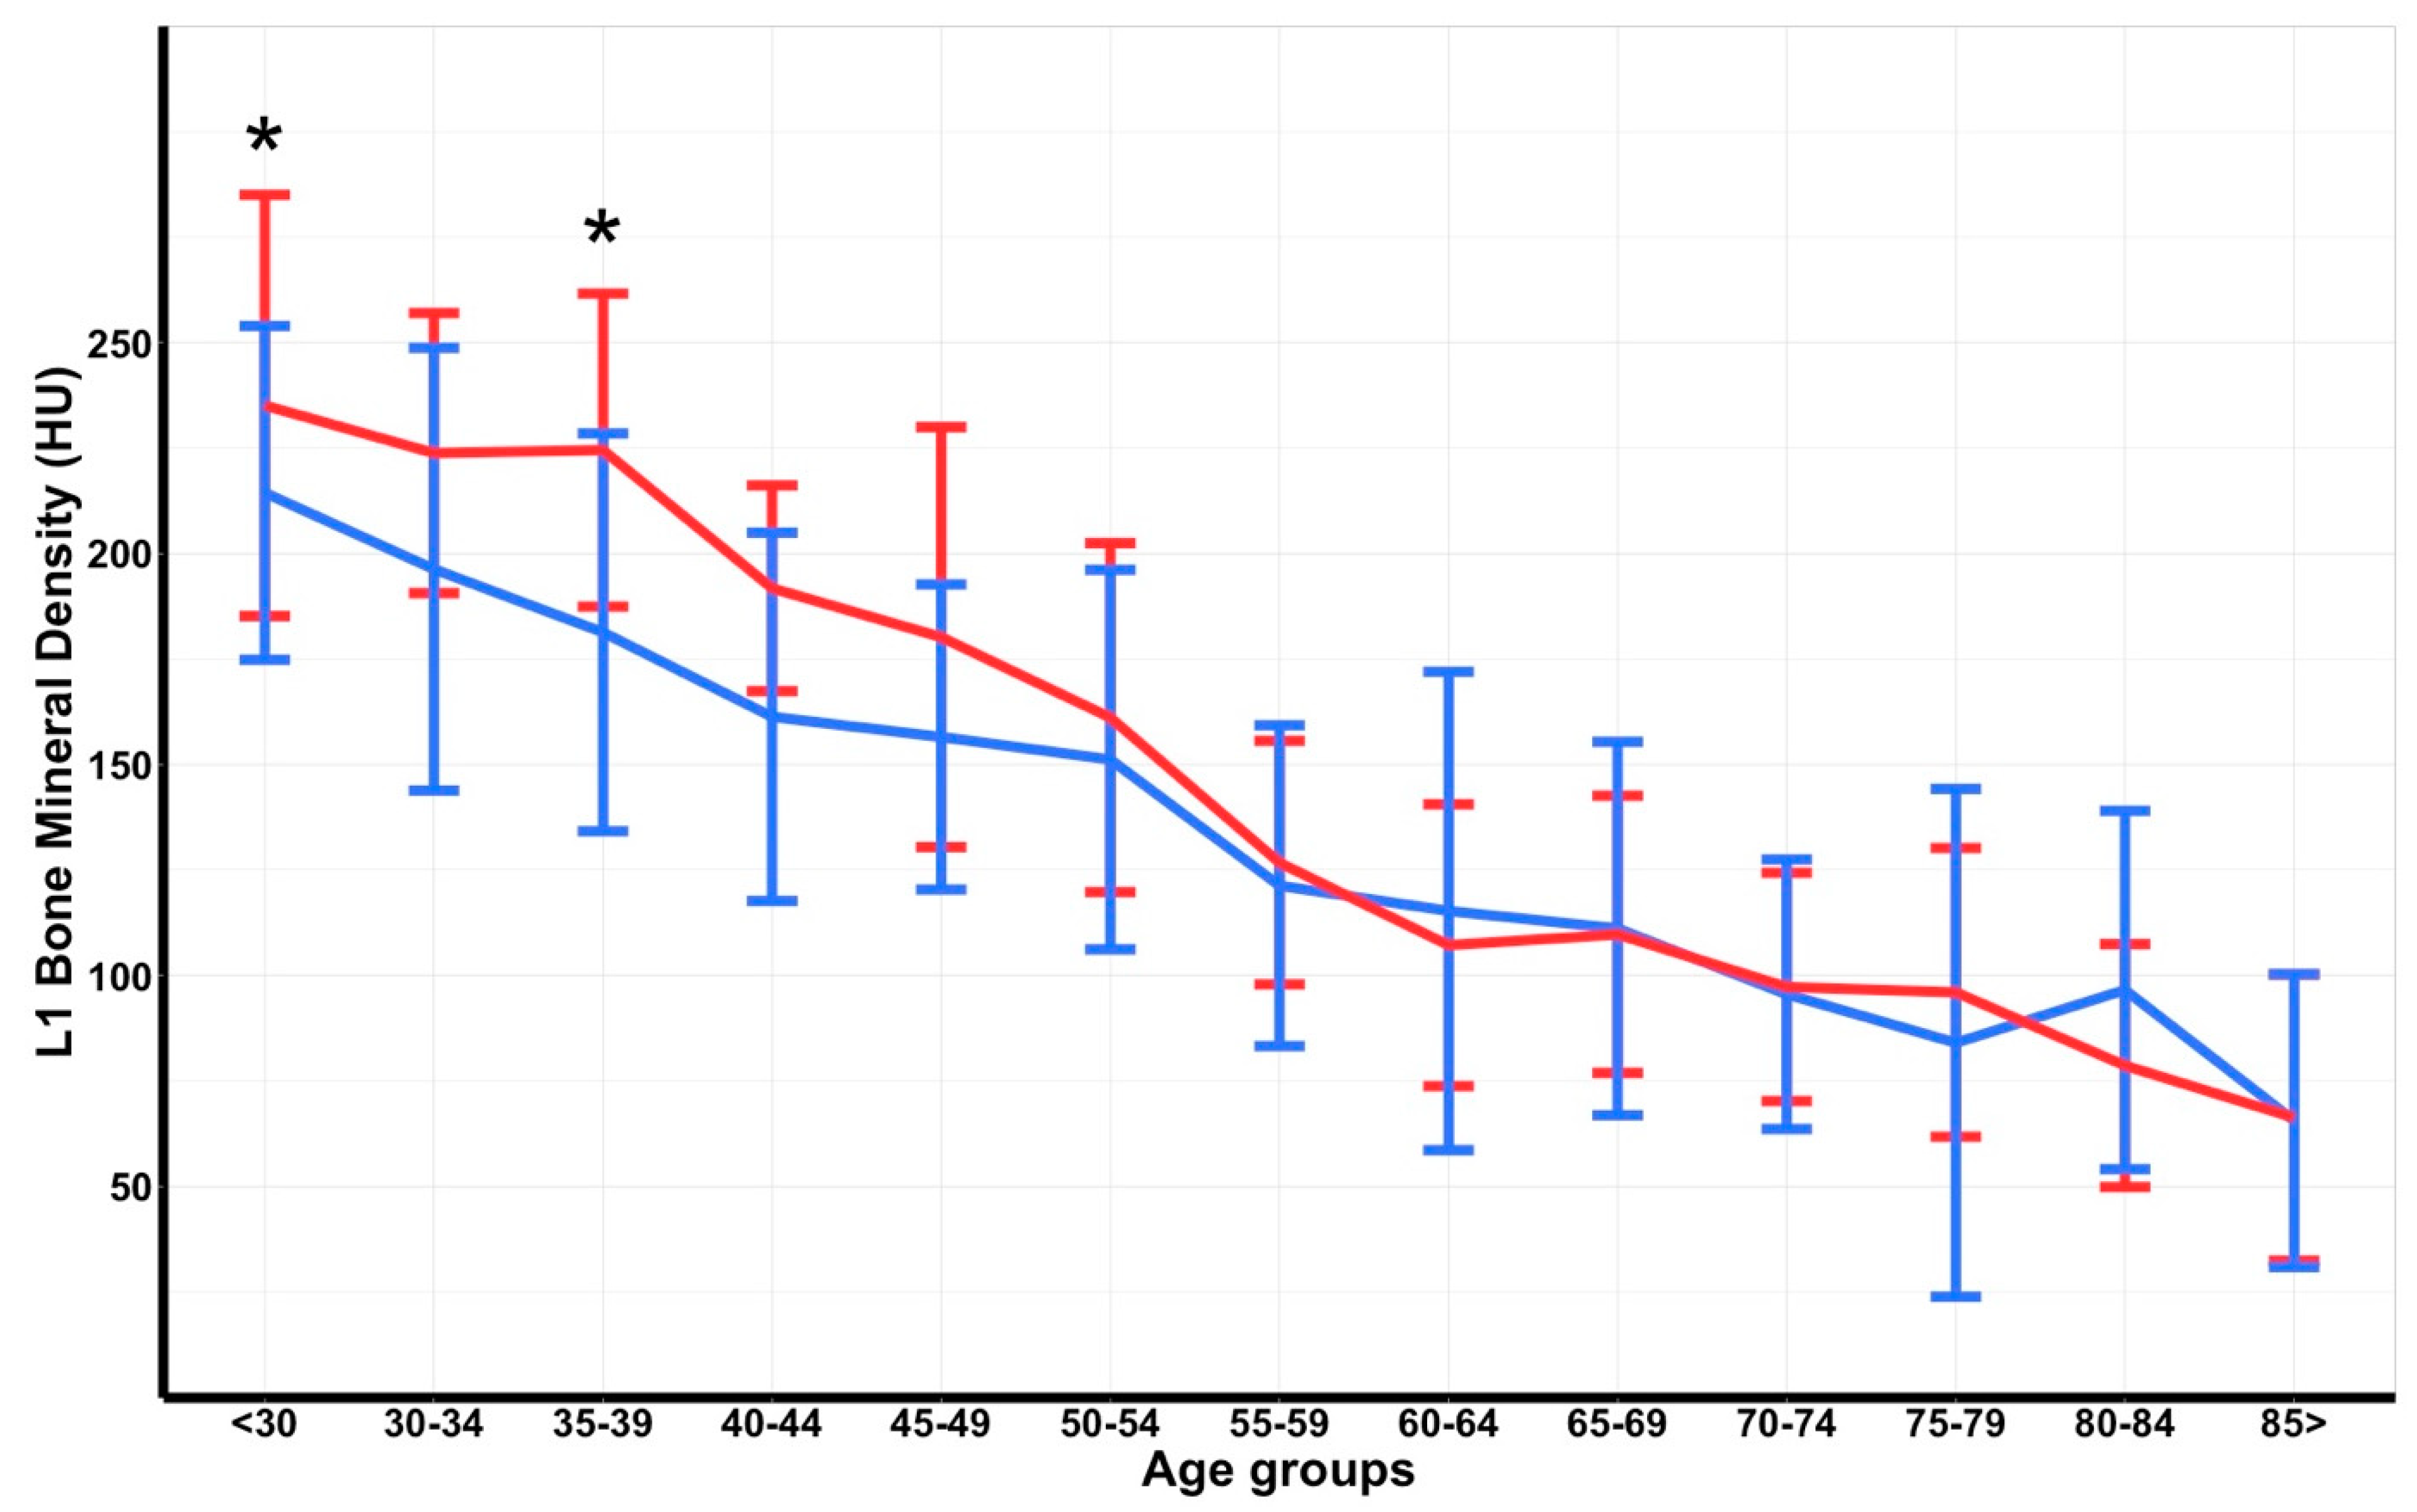
| Age Group | Women | Men | ||||||||
|---|---|---|---|---|---|---|---|---|---|---|
| Dutch Cohort | Reference Cohort | p-Value | Dutch Cohort | Reference Cohort | p-Value | |||||
| Mean ± SD | n | Mean ± SD | n | Mean ± SD | n | Mean ± SD | n | |||
| <30 | 235 ± 50 | 37 | 233 ± 38 | 143 | 0.790 | 214 ± 40 | 104 | 219 ± 48 | 132 | 0.394 |
| 30–34 | 224 ± 33 | 10 | 218 ± 39 | 131 | 0.637 | 196 ± 52 | 23 | 205 ± 41 | 127 | 0.355 |
| 35–39 | 225 ± 37 | 8 | 219 ± 41 | 151 | 0.686 | 181 ± 47 | 30 | 191 ± 38 | 134 | 0.215 |
| 40–44 | 192 ± 24 | 4 | 206 ± 45 | 161 | 0.537 | 161 ± 44 | 26 | 191 ± 51 | 91 | 0.008 |
| 45–49 | 180 ± 50 | 12 | 198 ± 38 | 276 | 0.114 | 157 ± 36 | 34 | 182 ± 39 | 151 | <0.001 |
| 50–54 | 161 ± 41 | 17 | 188 ± 41 | 2915 | 0.007 | 151 ± 45 | 42 | 175 ± 36 | 2144 | <0.001 |
| 55–59 | 127 ± 29 | 15 | 166 ± 38 | 2351 | <0.001 | 121 ± 38 | 37 | 166 ± 39 | 1731 | <0.001 |
| 60–64 | 107 ± 33 | 17 | 157 ± 39 | 1741 | <0.001 | 115 ± 57 | 28 | 157 ± 38 | 1383 | <0.001 |
| 65–69 | 110 ± 33 | 14 | 145 ± 53 | 1272 | 0.014 | 111 ± 44 | 27 | 142 ± 47 | 1205 | <0.001 |
| 70–74 | 97 ± 27 | 18 | 139 ± 51 | 915 | <0.001 | 96 ± 32 | 34 | 135 ± 43 | 734 | <0.001 |
| 75–79 | 96 ± 34 | 13 | 120 ± 44 | 633 | 0.051 | 84 ± 60 | 20 | 125 ± 42 | 604 | <0.001 |
| 80–84 | 79 ± 29 | 14 | 112 ± 46 | 355 | 0.008 | 97 ± 42 | 14 | 120 ± 41 | 286 | 0.042 |
| >85 | 66 ± 34 | 18 | 97 ± 41 | 404 | 0.002 | 66 ± 35 | 8 | 99 ± 49 | 224 | 0.061 |
References
- Burge, R.; Dawson-Hughes, B.; Solomon, D.H.; Wong, J.B.; King, A.; Tosteson, A. Incidence and economic burden of osteoporosis-related fractures in the United States, 2005–2025. J. Bone Miner. Res. 2007, 22, 465–475. [Google Scholar] [CrossRef] [PubMed]
- Hernlund, E.; Svedbom, A.; Ivergard, M.; Compston, J.; Cooper, C.; Stenmark, J.; McCloskey, E.V.; Jönsson, B.; Kanis, J.A. Osteoporosis in the European Union: Medical management, epidemiology and economic burden. A report prepared in collaboration with the International Osteoporosis Foundation (IOF) and the European Federation of Pharmaceutical Industry Associations (EFPIA). Arch. Osteoporos. 2013, 8, 136. [Google Scholar] [CrossRef] [PubMed] [Green Version]
- Borgstrom, F.; Karlsson, L.; Ortsater, G.; Norton, N.; Halbout, P.; Cooper, C.; Lorentzon, M.; McCloskey, E.V.; Harvey, N.C.; Javaid, M.K.; et al. Fragility fractures in Europe: Burden, management and opportunities. Arch. Osteoporos. 2020, 15, 59. [Google Scholar] [CrossRef] [PubMed] [Green Version]
- Kanis, J.A.; McCloskey, E.V.; Johansson, H.; Oden, A.; Melton, L.J., 3rd; Khaltaev, N. A reference standard for the description of osteoporosis. Bone 2008, 42, 467–475. [Google Scholar] [CrossRef] [PubMed]
- Nuti, R.; Brandi, M.L.; Checchia, G.; Di Munno, O.; Dominguez, L.; Falaschi, P.; Fiore, C.E.; Iolascon, G.; Maggi, S.; Michieli, R.; et al. Guidelines for the management of osteoporosis and fragility fractures. Intern. Emerg. Med. 2019, 14, 85–102. [Google Scholar] [CrossRef] [PubMed] [Green Version]
- Cosman, F.; De Beur, S.J.; LeBoff, M.S.; Lewiecki, E.M.; Tanner, B.; Randall, S.; Lindsay, R. Clinician's Guide to Prevention and Treatment of Osteoporosis. Osteoporos. Int. 2014, 25, 2359–2381. [Google Scholar] [CrossRef] [Green Version]
- Pickhardt, P.J.; Pooler, B.D.; Lauder, T.; del Rio, A.M.; Bruce, R.J.; Binkley, N. Opportunistic screening for osteoporosis using abdominal computed tomography scans obtained for other indications. Ann. Intern. Med. 2013, 158, 588–595. [Google Scholar] [CrossRef]
- Schreiber, J.J.; Anderson, P.A.; Rosas, H.G.; Buchholz, A.L.; Au, A.G. Hounsfield units for assessing bone mineral density and strength: A tool for osteoporosis management. J. Bone Jt. Surg. Am. 2011, 93, 1057–1063. [Google Scholar] [CrossRef]
- Lee, S.; Chung, C.K.; Oh, S.H.; Park, S.B. Correlation between Bone Mineral Density Measured by Dual-Energy X-Ray Absorptiometry and Hounsfield Units Measured by Diagnostic CT in Lumbar Spine. J. Korean NeuroSurg. Soc. 2013, 54, 384–389. [Google Scholar] [CrossRef]
- Alacreu, E.; Moratal, D.; Arana, E. Opportunistic screening for osteoporosis by routine CT in Southern Europe. Osteoporos. Int. 2017, 28, 983–990. [Google Scholar] [CrossRef]
- Bandaru, S.; Hare, K.; Krueger, D.; Binkley, N. Do patients that fracture with normal DXA-measured BMD have normal bone? Arch. Osteoporos. 2020, 15, 70. [Google Scholar] [CrossRef] [PubMed]
- Zaidi, Q.; Danisa, O.A.; Cheng, W. Measurement Techniques and Utility of Hounsfield Unit Values for Assessment of Bone Quality Prior to Spinal Instrumentation: A Review of Current Literature. Spine 2019, 44, E239–E244. [Google Scholar] [CrossRef] [PubMed]
- Jang, S.; Graffy, P.M.; Ziemlewicz, T.J.; Lee, S.J.; Summers, R.M.; Pickhardt, P.J. Opportunistic Osteoporosis Screening at Routine Abdominal and Thoracic CT: Normative L1 Trabecular Attenuation Values in More than 20,000 Adults. Radiology 2019, 291, 360–367. [Google Scholar] [CrossRef] [PubMed]
- Altman, D.G.; Royston, P. What do we mean by validating a prognostic model. Statist. Med. 2000, 19, 453–473. [Google Scholar] [CrossRef]
- Seeman, E. Age- and menopause-related bone loss compromise cortical and trabecular microstructure. J. Gerontol. A Biol. Sci. Med. Sci. 2013, 68, 1218–1225. [Google Scholar] [CrossRef] [Green Version]
- Baum, T.; Müller, D.; Dobritz, M.; Wolf, P.; Rummeny, E.J.; Link, T.M.; Bauer, J.S. Converted lumbar BMD values derived from sagittal reformations of contrast-enhanced MDCT predict incidental osteoporotic vertebral fractures. Calcif. Tissue Int. 2012, 90, 481–487. [Google Scholar] [CrossRef]
- Kaplan, S.; Pham, T.N.; Arbabi, S.; Gross, J.A.; Damodarasamy, M.; Bentov, I.; Taitsman, L.A.; Mitchell, S.H.; Reed, M.J. Association of Radiologic Indicators of Frailty With 1-Year Mortality in Older Trauma Patients: Opportunistic Screening for Sarcopenia and Osteopenia. JAMA Surg. 2017, 152, e164604. [Google Scholar] [CrossRef]
- Graffy, P.M.; Lee, S.J.; Ziemlewicz, T.J.; Pickhardt, P.J. Prevalence of Vertebral Compression Fractures on Routine CT Scans According to L1 Trabecular Attenuation: Determining Relevant Thresholds for Opportunistic Osteoporosis Screening. AJR Am. J. Roentgenol. 2017, 209, 491–496. [Google Scholar] [CrossRef]
- Lee, S.J.; Graffy, P.M.; Zea, R.D.; Ziemlewicz, T.J.; Pickhardt, P.J. Future Osteoporotic Fracture Risk Related to Lumbar Vertebral Trabecular Attenuation Measured at Routine Body CT. J. Bone Miner. Res. 2018, 33, 860–867. [Google Scholar] [CrossRef] [Green Version]
- Fried, L.P.; Darer, J.; Walston, J. Frailty. In Geriatric Medicine: An Evidence-Based Approach; Springer: New York, NY, USA, 2003; pp. 1067–1076. [Google Scholar] [CrossRef]
- Wu, Q.; Lefante, J.J.; Rice, J.C.; Magnus, J.H. Age, race, weight, and gender impact normative values of bone mineral density. Gend. Med. 2011, 8, 189–201. [Google Scholar] [CrossRef]
- Binkley, N.; Krueger, D.; Vallarta-Ast, N. An overlying fat panniculus affects femur bone mass measurement. J. Clin. Densitom. 2003, 6, 199–204. [Google Scholar] [CrossRef]
- Evans, E.M.; Mojtahedi, M.C.; Kessinger, R.B.; Misic, M.M. Simulated change in body fatness affects Hologic QDR 4500A whole body and central DXA bone measures. J. Clin. Densitom. 2006, 9, 315–322. [Google Scholar] [CrossRef] [PubMed]
- Yu, E.W.; Thomas, B.J.; Brown, J.K.; Finkelstein, J.S. Simulated increases in body fat and errors in bone mineral density measurements by DXA and QCT. J. Bone Miner. Res. 2012, 27, 119–124. [Google Scholar] [CrossRef] [PubMed] [Green Version]
- Burch, S.; Feldstein, M.; Hoffmann, P.F.; Keaveny, T.M. Prevalence of Poor Bone Quality in Women Undergoing Spinal Fusion Using Biomechanical-CT Analysis. Spine 2016, 41, 246–252. [Google Scholar] [CrossRef] [PubMed]
- Glinkowski, W.M.; Narloch, J. Bone Density at the Entry Point Correlates With the Trabecular Bone of the Thoracolumbar Vertebral Bodies—Quantitative Computed Tomography Study. J. Clin. Densitom. 2019, 22, 367–373. [Google Scholar] [CrossRef] [PubMed]
- Salzmann, S.N.; Shirahata, T.; Yang, J.; Miller, C.O.; Carlson, B.B.; Rentenberger, C.; Carrino, J.A.; Shue, J.; Sama, A.A.; Cammisa, F.P.; et al. Regional bone mineral density differences measured by quantitative computed tomography: Does the standard clinically used L1-L2 average correlate with the entire lumbosacral spine? Spine J. 2019, 19, 695–702. [Google Scholar] [CrossRef] [PubMed]
- Gerety, E.L.; Bearcroft, P.W. L1 vertebral density on CT is too variable with different scanning protocols to be a useful screening tool for osteoporosis in everyday practice. Br. J. Radiol. 2018, 91, 20170395. [Google Scholar] [CrossRef]
- Acu, K.; Scheel, M.; Issever, A.S. Time dependency of bone density estimation from computed tomography with intravenous contrast agent administration. Osteoporos. Int. 2014, 25, 535–542. [Google Scholar] [CrossRef] [Green Version]
- Pickhardt, P.J.; Lauder, T.; Pooler, B.D.; Del Rio, A.M.; Rosas, H.G.; Bruce, R.J.; Binkley, N. Effect of IV contrast on lumbar trabecular attenuation at routine abdominal CT: Correlation with DXA and implications for opportunistic osteoporosis screening. Osteoporos. Int. 2016, 27, 147–152. [Google Scholar] [CrossRef]
- Pompe, E.; Willemink, M.J.; Dijkhuis, G.R.; Verhaar, H.J.; Mohamed Hoesein, F.A.; de Jong, P.A. Intravenous contrast injection significantly affects bone mineral density measured on CT. Eur. Radiol. 2015, 25, 283–289. [Google Scholar] [CrossRef]
- Sande, E.P.; Martinsen, A.C.; Hole, E.O.; Olerud, H.M. Interphantom and interscanner variations for Hounsfield units—Establishment of reference values for HU in a commercial QA phantom. Phys. Med. Biol. 2010, 55, 5123–5135. [Google Scholar] [CrossRef] [PubMed]
- Kaptoge, S.; Da Silva, J.A.; Brixen, K.; Reid, D.M.; Kröger, H.; Nielsen, T.L.; Andersen, M.; Hagen, C.; Lorenc, R.; Boonen, S.; et al. Geographical variation in DXA bone mineral density in young European men and women. Results from the Network in Europe on Male Osteoporosis (NEMO) study. Bone 2008, 43, 332–339. [Google Scholar] [CrossRef] [PubMed]
- Strozyk, D.; Gress, T.M.; Breitling, L.P. Smoking and bone mineral density: Comprehensive analyses of the third National Health and Nutrition Examination Survey (NHANES III). Arch. Osteoporos. 2018, 13, 16. [Google Scholar] [CrossRef] [PubMed]
- Yuan, S.; Michaelsson, K.; Wan, Z.; Larsson, S.C. Associations of Smoking and Alcohol and Coffee Intake with Fracture and Bone Mineral Density: A Mendelian Randomization Study. Calcif. Tissue Int. 2019, 105, 582–588. [Google Scholar] [CrossRef] [PubMed] [Green Version]
| Variable | Total Cohort n = 624 |
|---|---|
| Age, median (IQR) | 51 (31–68) |
| Range | 16–95 |
| Male, (%) | 427 (68.4%) |
| ASA classification, (%) | |
| 1–2 | 550 (88.1%) |
| 3–4 | 70 (11.2%) |
| Missing | 4 (0.6%) |
| BMD in HU, mean (±SD) | 152 (±66) |
| CT vertebra, (%) | |
| Th12 | 35 (5.6%) |
| L1 | 578 (92.6%) |
| L2 | 11 (1.8%) |
| Intravenous contrast agent used, (%) | 574 (92.0%) |
| Mechanism of injury, (%) | |
| Motor vehicle crash | 201 (32.2%) |
| Bicycle | 125 (20.0%) |
| High-energetic fall | 95 (15.2%) |
| Low-energetic fall | 130 (20.8%) |
| Other | 73 (11.7%) |
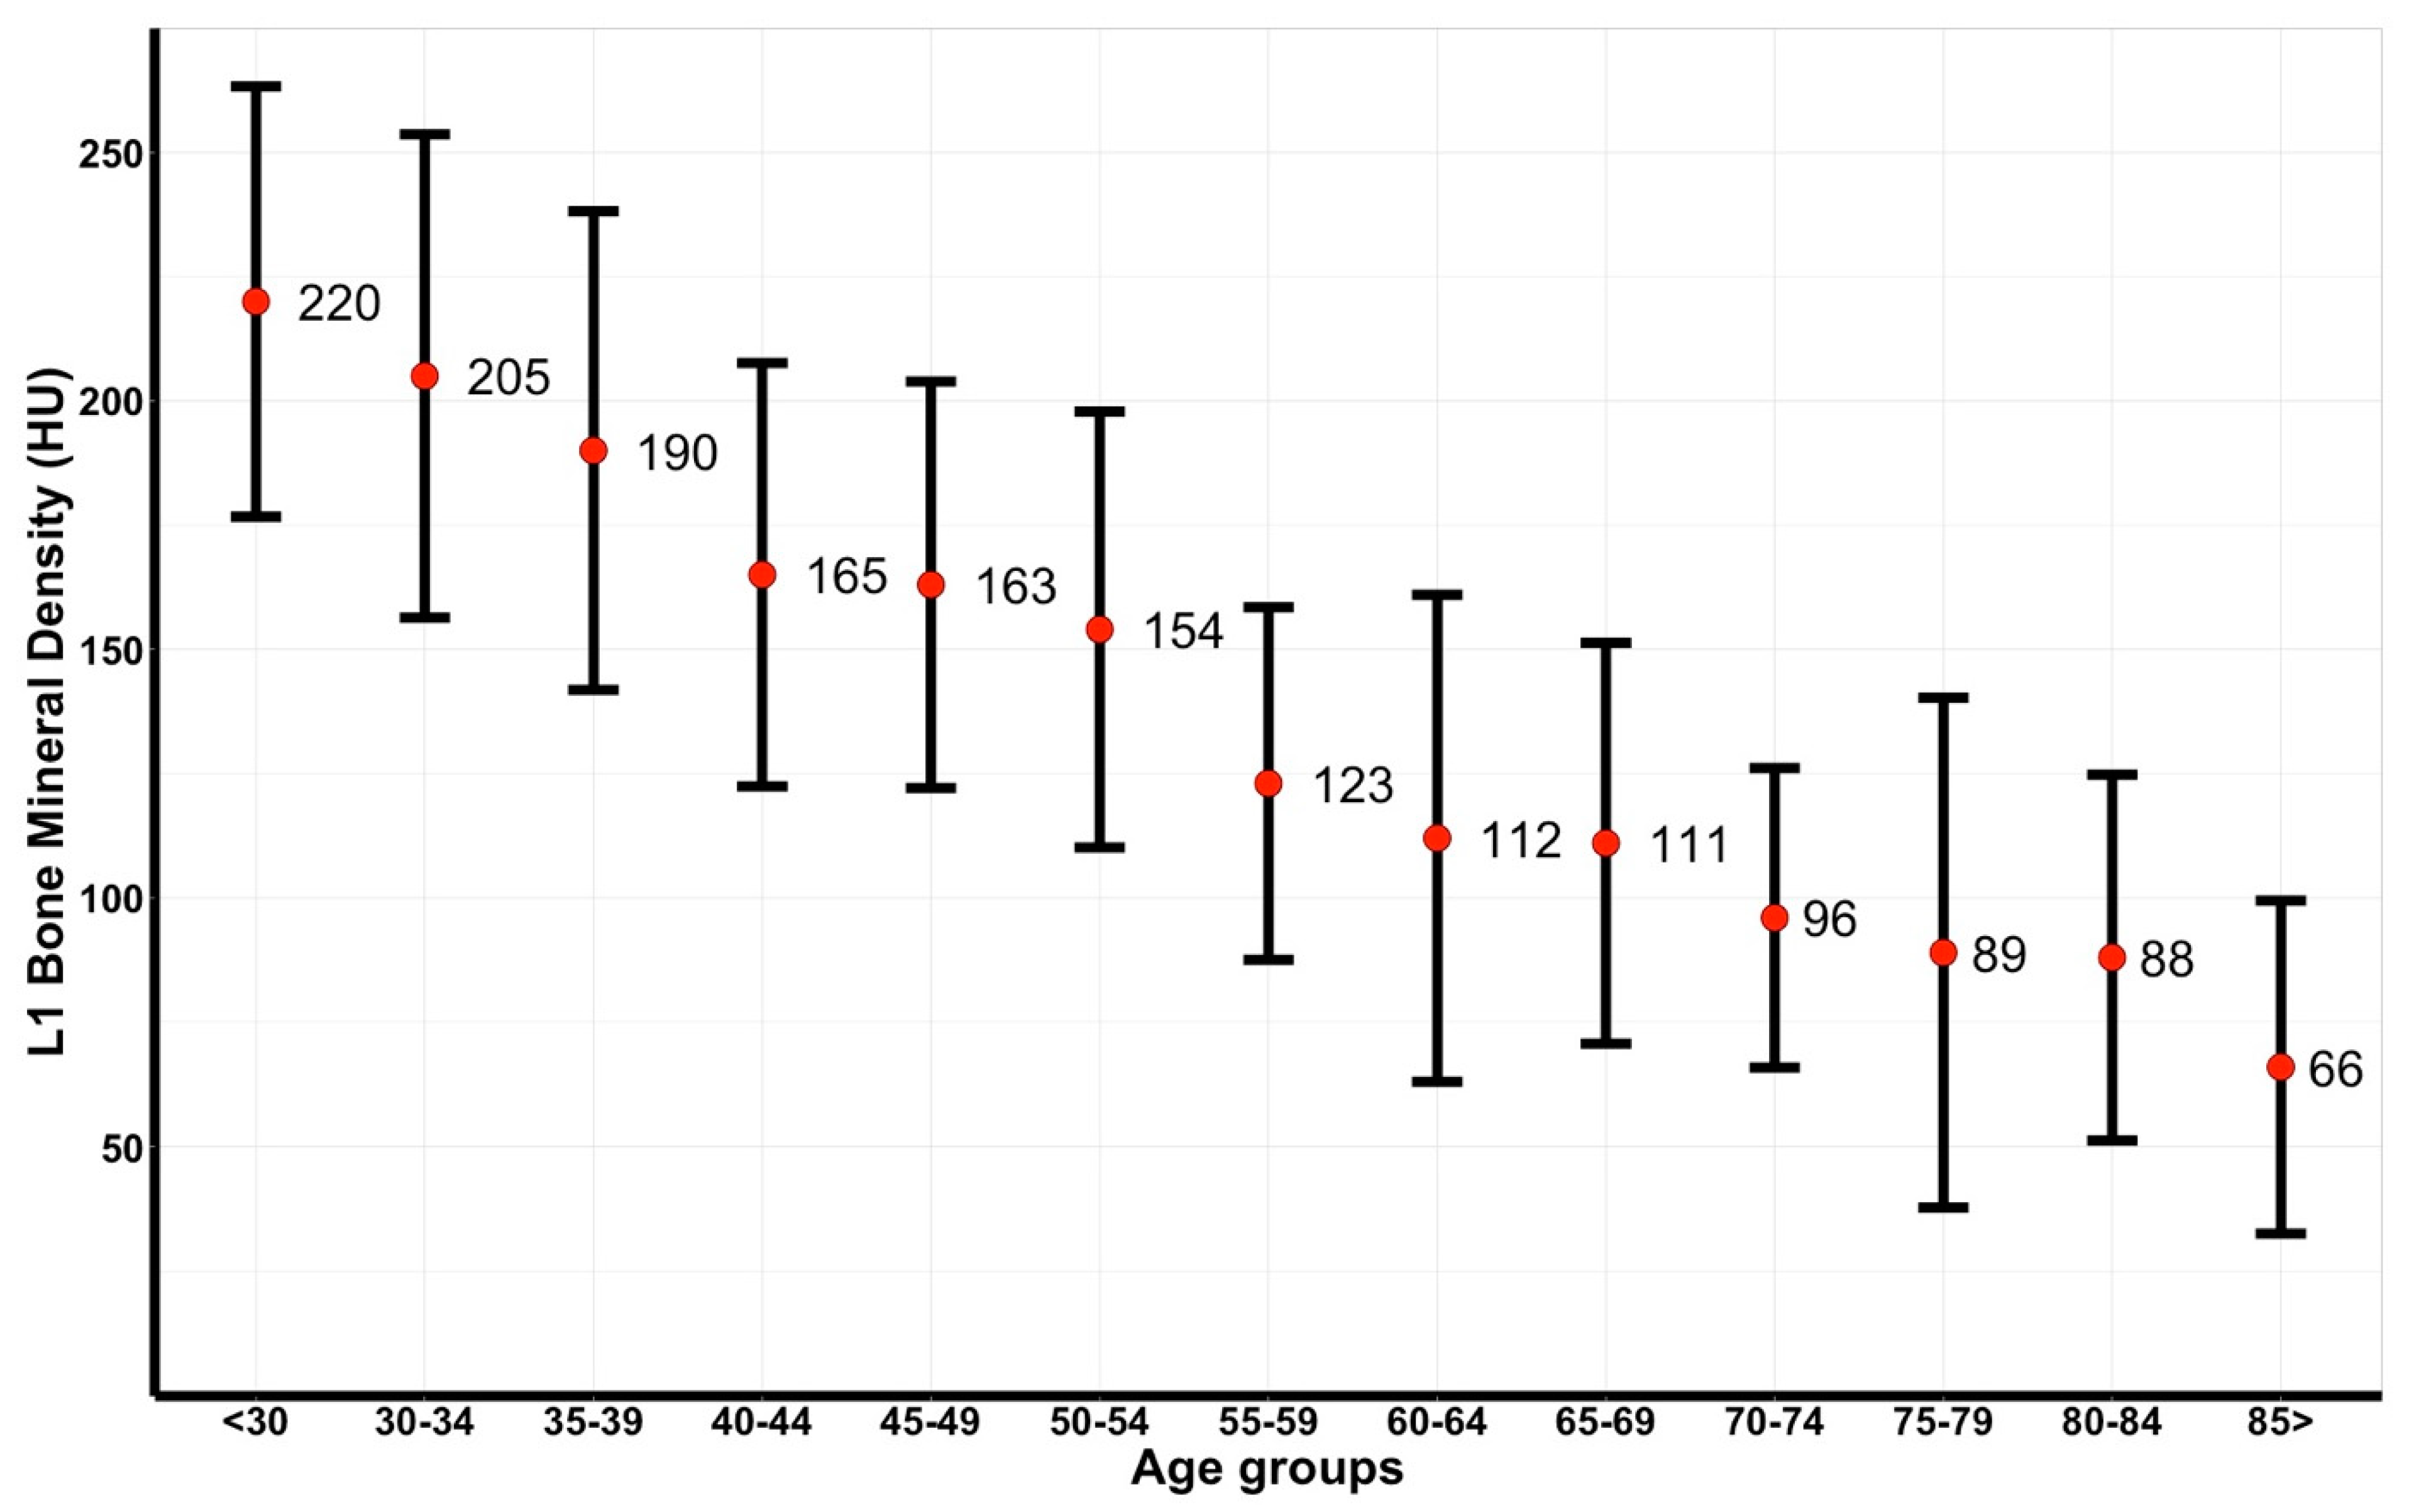
| Age Group | Dutch Cohort | Men | Women | p-Value a | |||
|---|---|---|---|---|---|---|---|
| Group Size | Total | Group Size | Total | Group Size | Total | ||
| <30 | 141 | 220 ± 43 | 104 | 214 ± 40 | 37 | 235 ± 50 | 0.027 |
| 30–34 | 33 | 205 ± 49 | 23 | 196 ± 52 | 10 | 224 ± 33 | 0.081 |
| 35–39 | 38 | 190 ± 48 | 30 | 181 ± 47 | 8 | 225 ± 37 | 0.016 |
| 40–44 | 30 | 165 ± 43 | 26 | 161 ± 44 | 4 | 192 ± 24 | 0.083 |
| 45–49 | 46 | 163 ± 41 | 34 | 157 ± 36 | 12 | 180 ± 50 | 0.151 |
| 50–54 | 59 | 154 ± 44 | 42 | 151 ± 45 | 17 | 161 ± 41 | 0.421 |
| 55–59 | 52 | 123 ± 35 | 37 | 121 ± 38 | 15 | 127 ± 29 | 0.579 |
| 60–64 | 45 | 112 ± 49 | 28 | 115 ± 57 | 17 | 107 ± 33 | 0.549 |
| 65–69 | 41 | 111 ± 40 | 27 | 111 ± 44 | 14 | 110 ± 33 | 0.910 |
| 70–74 | 52 | 96 ± 30 | 34 | 96 ± 32 | 18 | 97 ± 27 | 0.838 |
| 75–79 | 33 | 89 ± 51 | 20 | 84 ± 60 | 13 | 96 ± 34 | 0.473 |
| 80–84 | 28 | 88 ± 37 | 14 | 97 ± 42 | 14 | 79 ± 29 | 0.204 |
| >85 | 26 | 66 ± 33 | 8 | 66 ± 35 | 18 | 66 ± 34 | 0.962 |
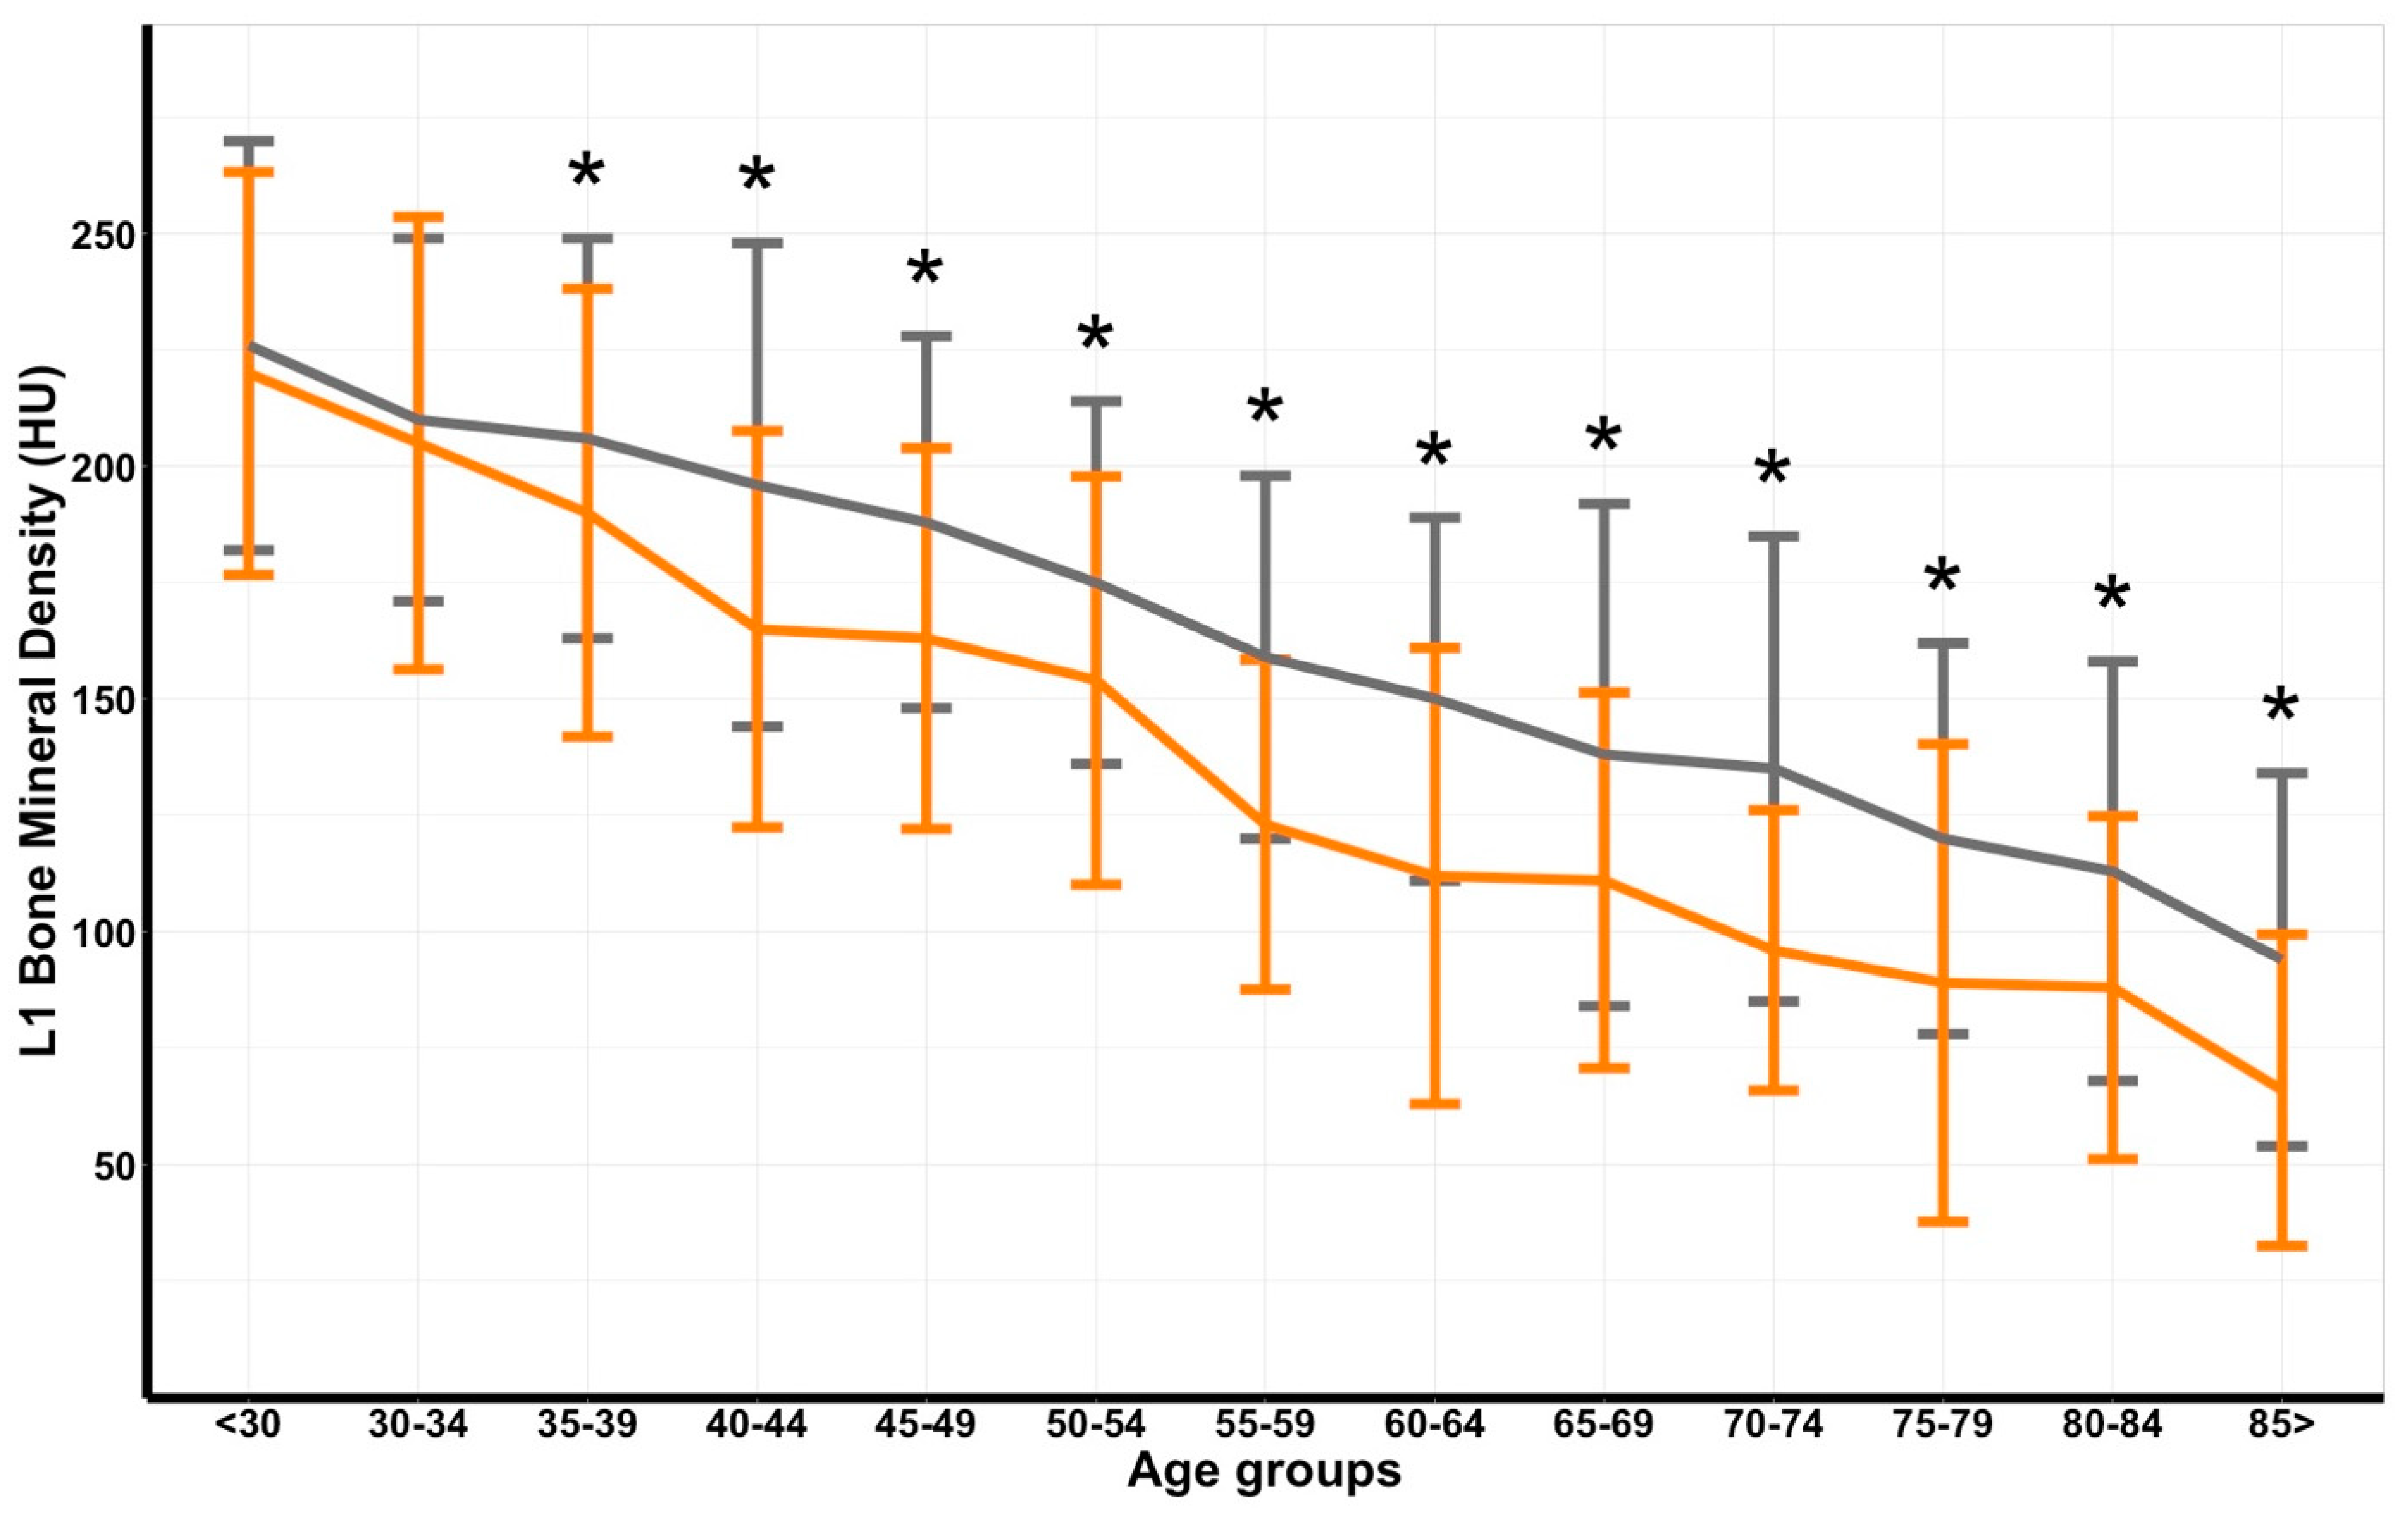
| Age Group | Dutch Cohort | Reference Cohort | p-Value a | ||
|---|---|---|---|---|---|
| Group Size | Total | Group Size | Total | ||
| <30 | 141 | 220 ± 43 | 262 | 226 ± 44 | 0.189 |
| 30–34 | 33 | 205 ± 49 | 239 | 210 ± 39 | 0.505 |
| 35–39 | 38 | 190 ± 48 | 257 | 206 ± 43 | 0.036 |
| 40–44 | 30 | 165 ± 43 | 165 | 196 ± 52 | 0.003 |
| 45–49 | 46 | 163 ± 41 | 178 | 188 ± 40 | <0.001 |
| 50–54 | 59 | 154 ± 44 | 1229 | 175 ± 39 | <0.001 |
| 55–59 | 52 | 123 ± 35 | 1135 | 159 ± 39 | <0.001 |
| 60–64 | 45 | 112 ± 49 | 917 | 150 ± 39 | <0.001 |
| 65–69 | 41 | 111 ± 40 | 1528 | 138 ± 54 | 0.002 |
| 70–74 | 52 | 96 ± 30 | 1143 | 135 ± 50 | <0.001 |
| 75–79 | 33 | 89 ± 51 | 997 | 120 ± 42 | <0.001 |
| 80–84 | 28 | 88 ± 37 | 503 | 113 ± 45 | 0.004 |
| >85 | 26 | 66 ± 33 | 551 | 94 ± 40 | 0.001 |
Publisher’s Note: MDPI stays neutral with regard to jurisdictional claims in published maps and institutional affiliations. |
© 2022 by the authors. Licensee MDPI, Basel, Switzerland. This article is an open access article distributed under the terms and conditions of the Creative Commons Attribution (CC BY) license (https://creativecommons.org/licenses/by/4.0/).
Share and Cite
Kobes, T.; Sweet, A.; Verstegen, S.; Houwert, M.; Veldhuis, W.; Leenen, L.; de Jong, P.; van Baal, M. Computed Tomography-Based L1 Bone Mineral Density in 624 Dutch Trauma Patients—Are North American Reference Values Valid in Europe? J. Pers. Med. 2022, 12, 472. https://doi.org/10.3390/jpm12030472
Kobes T, Sweet A, Verstegen S, Houwert M, Veldhuis W, Leenen L, de Jong P, van Baal M. Computed Tomography-Based L1 Bone Mineral Density in 624 Dutch Trauma Patients—Are North American Reference Values Valid in Europe? Journal of Personalized Medicine. 2022; 12(3):472. https://doi.org/10.3390/jpm12030472
Chicago/Turabian StyleKobes, Tim, Arthur Sweet, Sophie Verstegen, Marijn Houwert, Wouter Veldhuis, Luke Leenen, Pim de Jong, and Mark van Baal. 2022. "Computed Tomography-Based L1 Bone Mineral Density in 624 Dutch Trauma Patients—Are North American Reference Values Valid in Europe?" Journal of Personalized Medicine 12, no. 3: 472. https://doi.org/10.3390/jpm12030472