1. Introduction
Lung and colorectal cancer are the first and second leading cause of cancer death, respectively [
1]. In several studies, neoadjuvant radiochemotherapy has been shown to be both downgrading for nodal staging and beneficial in terms of overall survival [
2,
3,
4]. Tumor regrowth is an important clinical parameters during chemo and radio therapy [
5] and the probability of treatment benefit critically depends on the tumor progression pattern not only in the interval between the fractional doses but also at the end of the therapy [
6]. The effect of preoperative radiochemotherapy in both lung and colorectal cancer improves survival and become the standard of care before tumor resection [
7,
8]. To evaluate the clinical results on the tumor volume reduction in radiotherapy (for constant cellular density systems), the tumor cell survival fraction,
S, after
n treatments at dose per fraction
d, in the overall treatment time
t, is usually written according to the linear quadratic model
where the tumor radiosensitivity is expressed by the parameters
and
.
Concerning the regrowth during radiotherapy, one has that:
the untreated tumor growth has been usually described by means of the Gompertz law (GL) [
9,
10,
11,
12,
13], a non linear growth pattern previously proposed in actuarial mathematics [
14];
in a transplantable rat tumor, it was shown that control and regrowth curves could be fitted by the same Gompertzian law [
15];
Gompertzian growth has been assumed to describe human tumor repopulation during fractional radiotherapy by Hansen et al. [
16] and by O’Donougue [
17].
Regarding chemotherapy, the GL regrowth requires a time increasing drug concentration to obtain an exponential depletion of the tumor cells: the Norton-Simon hypothesis [
18,
19]. In various tumor phenotypes the volume reduction still persists many weeks after the end of therapy and, for example, in colon-rectal cancer the best time for surgery has been estimated between 8–12 weeks after the completion of the neo-adjuvant radiochemotherapy. In other terms, at the end of treatment, tumor volume can increase or decline, according to specific microbiological conditions. Microbial community interacts with the host modifying its immune response, metabolism and oncogenesis [
20]. Several studies on locally advanced rectal cancer (LARC) show that the persistence of a bacterium after neoadjuvant therapy is associated with a high relapse rates [
21] and that alterations in the gut microbiome play an important role in predicting response to neoadjuvant therapy [
22].
More generally, in in-vivo systems the time to tumor response to radiation therapy (RT) differs among different histologies for several factors depending on tumor location, oxygen landscape, vasculature, cell composition, etc. For example, tumors located in poorly lymph drained body sites (i.e., brain) or made of cells not migrating through lymph flow (i.e., some types of sarcoma) may develop a slower volume reduction following RT compared to tumors rich of lymph drainage (i.e., head and neck cancer, colorectal carcinoma, etc.), which acts as a scavenger of dead cells by means of immune system cells (i.e., lymphocytes, macrophages, dendritic cells, etc.) reacting against tumor cells damaged by radiation [
23,
24]. Indeed, the presence of dead material within a tumor could affect tumor dynamics in terms of volume loss following the administration of fractionated RT, as the tumor volume may even increase at the initial stages of treatment due to the coexistence of a proliferating cell proportion not yet adequately stopped by radiation and of an increasing dead material not yet adequately drained off [
25,
26]. Moreover, also the tumor vasculature is surely influenced by radiation, which can give rise to an ever-changing tumor oxygen landscape [
27,
28]. Endothelial cells swell as a consequence of radiation damage significantly reducing tumor oxygen supply. This unintentionally generates hypoxic cancer cells that are less prone to die when the subsequent radiation fractions are delivered. At these stages, on the other side, the removal of well-oxygenated cells re-enables the starved hypoxic cells to proliferation. At the end of treatment, it is expected that tumor vasculature is permanently disrupted so as to definitively impair tumor regrowth. This is another reason why tumor response assessment is several days after the RT finishes [
29,
30]. In clinical practice, when the classic fractionated RT is unable to remove all radioresistant niches, one assists to downsized still active tumors requiring salvage RT treatments [
31,
32]. Additionally, tumors are composed also of healthy cells surviving to RT. These could replace dead cancer cells or result in transforming fibrosis, which can alter tumor volume reduction and then perception of tumor response to RT. Lastly, the radiation-induced immune imprinting continues to work even several weeks after the end of RT treatment, being able to further downsize tumor until its disappearance when irradiation is ended in a long time [
33,
34]. Therefore the microscopic dynamics which produces the different evolution patterns of the tumor coarse-grain size during and after neo-adjuvant therapy is a complex phenomenon where different cell subpopulations (resistent and sensitive cells, apoptosis, necrotic core, …) are involved.
In this paper we propose a method, based on macroscopic variables [
35,
36] and with no explicit reference to the underlying dynamics, to analyze the quantitative evolution during and after the therapy. The starting point is the observation that the GL, initially applied to human mortality tables (i.e., aging), describes tumor growth. It has been also applied to kinetics of enzymatic reactions, oxygenation of hemoglobin, intensity of photosynthesis as a function of CO2 concentration, drug dose-response curve, dynamics of growth in bacteria and normal eukaryotic organisms and, more recently, in Covid-19 spreading. The GL, as other macroscopic growth laws, depends on two parameters, which for cancer are related to the initial exponential trend and to the maximum number of cell,
, called carrying capacity, that can be supported by the local microbiological conditions (angiogenesis, immune system, …). It is well known that the carrying capacity changes according to some “external” conditions in many biological, economical and social systems [
37]. In tumor growth it is related to a multi-stage evolution [
38]. In population dynamics, new technologies affect how resources are consumed, and since the carrying capacity depends on the availability of that resource, its value changes [
38]. Therefore a simple method of monitoring the tumor evolution during and after radiochemotherapy is to understand how the carrying capacity (CC) changes, for the specific patient, due to the radiation and drug effects previously discussed [
26]. This modification is difficult to predict, but different scenarios of regrowth (with different dependence of CC on the radiation dose, for example) are initially analyzed in the next sections both mathematically and by in vivo experimental data derived from mouse model, after tumor cell xenotransplantation, undergoing radiotherapy. Then the same algorithm is applied to the tumor volume regression pattern observed in rectal cancer during and after neoadjuvant radiochemotherapy for 23 patients [
39,
40]. The final results show how a modified carrying capacity is a useful macroscopic tool to describe the tumor size evolution during and after the end of therapy. The same conclusion is reached with the logistic growth law, showing the robustness of the proposed method. Moreover the approach is model independent, that is there is no assumption on the time evolution of the CC during and after therapy. On the other hand, more specific models consider the explicit time dependence of the CC by an additional differential equation, which requires assumptions and many more free parameters but have the advantage of a deep connection with the microscopic dynamics. In ref. [
8], for example, the time evolution of the CC is directly related, through diffusion equations, with different aspect of vasculature (specific loss, stimulator capacity, inhibition, …) with a direct control on the effects of endostatin, angiostatin, and TNP-470 on tumor growth dynamics.
3. Results
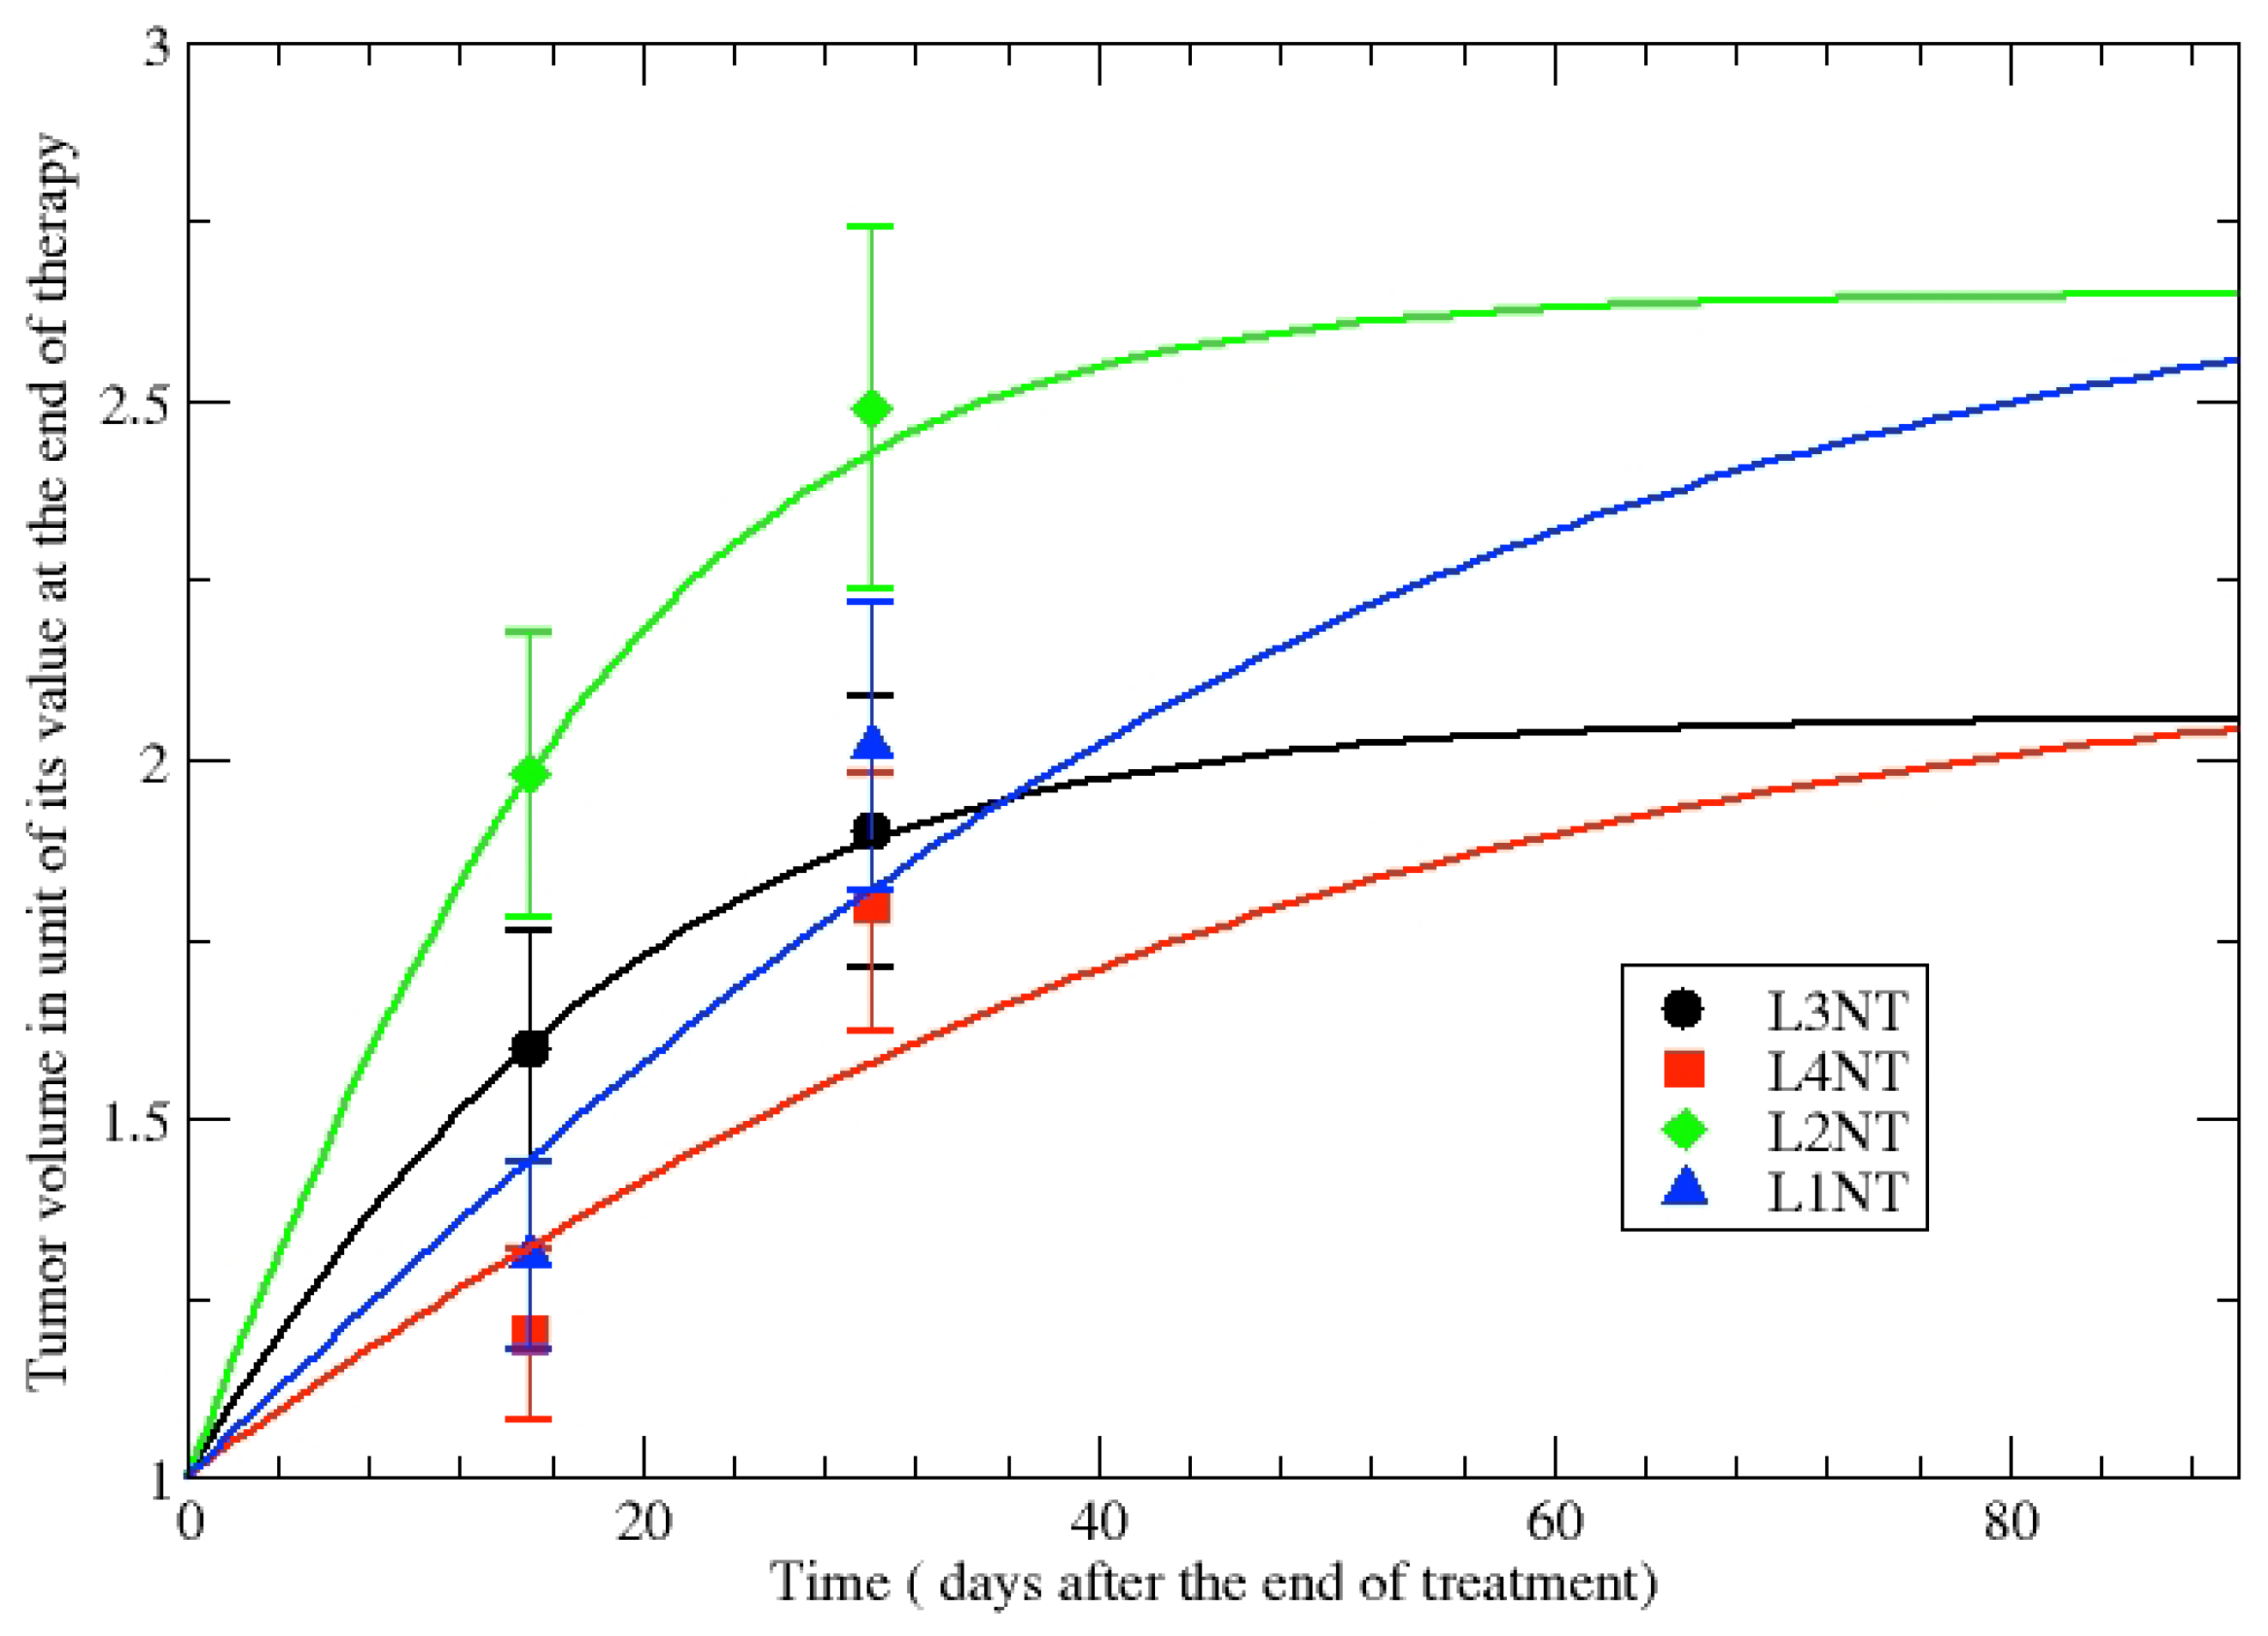
The first step of our analysis is the evaluation of the GL parameters in NT cell lines in order to assess untreated tumor growth.
Table 2 shows the parameters obtained for the volumes of untreated tumor after 15 and 30 days as they appear in
Table 1. The GL parameters are fixed by data and the comparison of the phenomenological GL curves with data is depicted in
Figure 4.
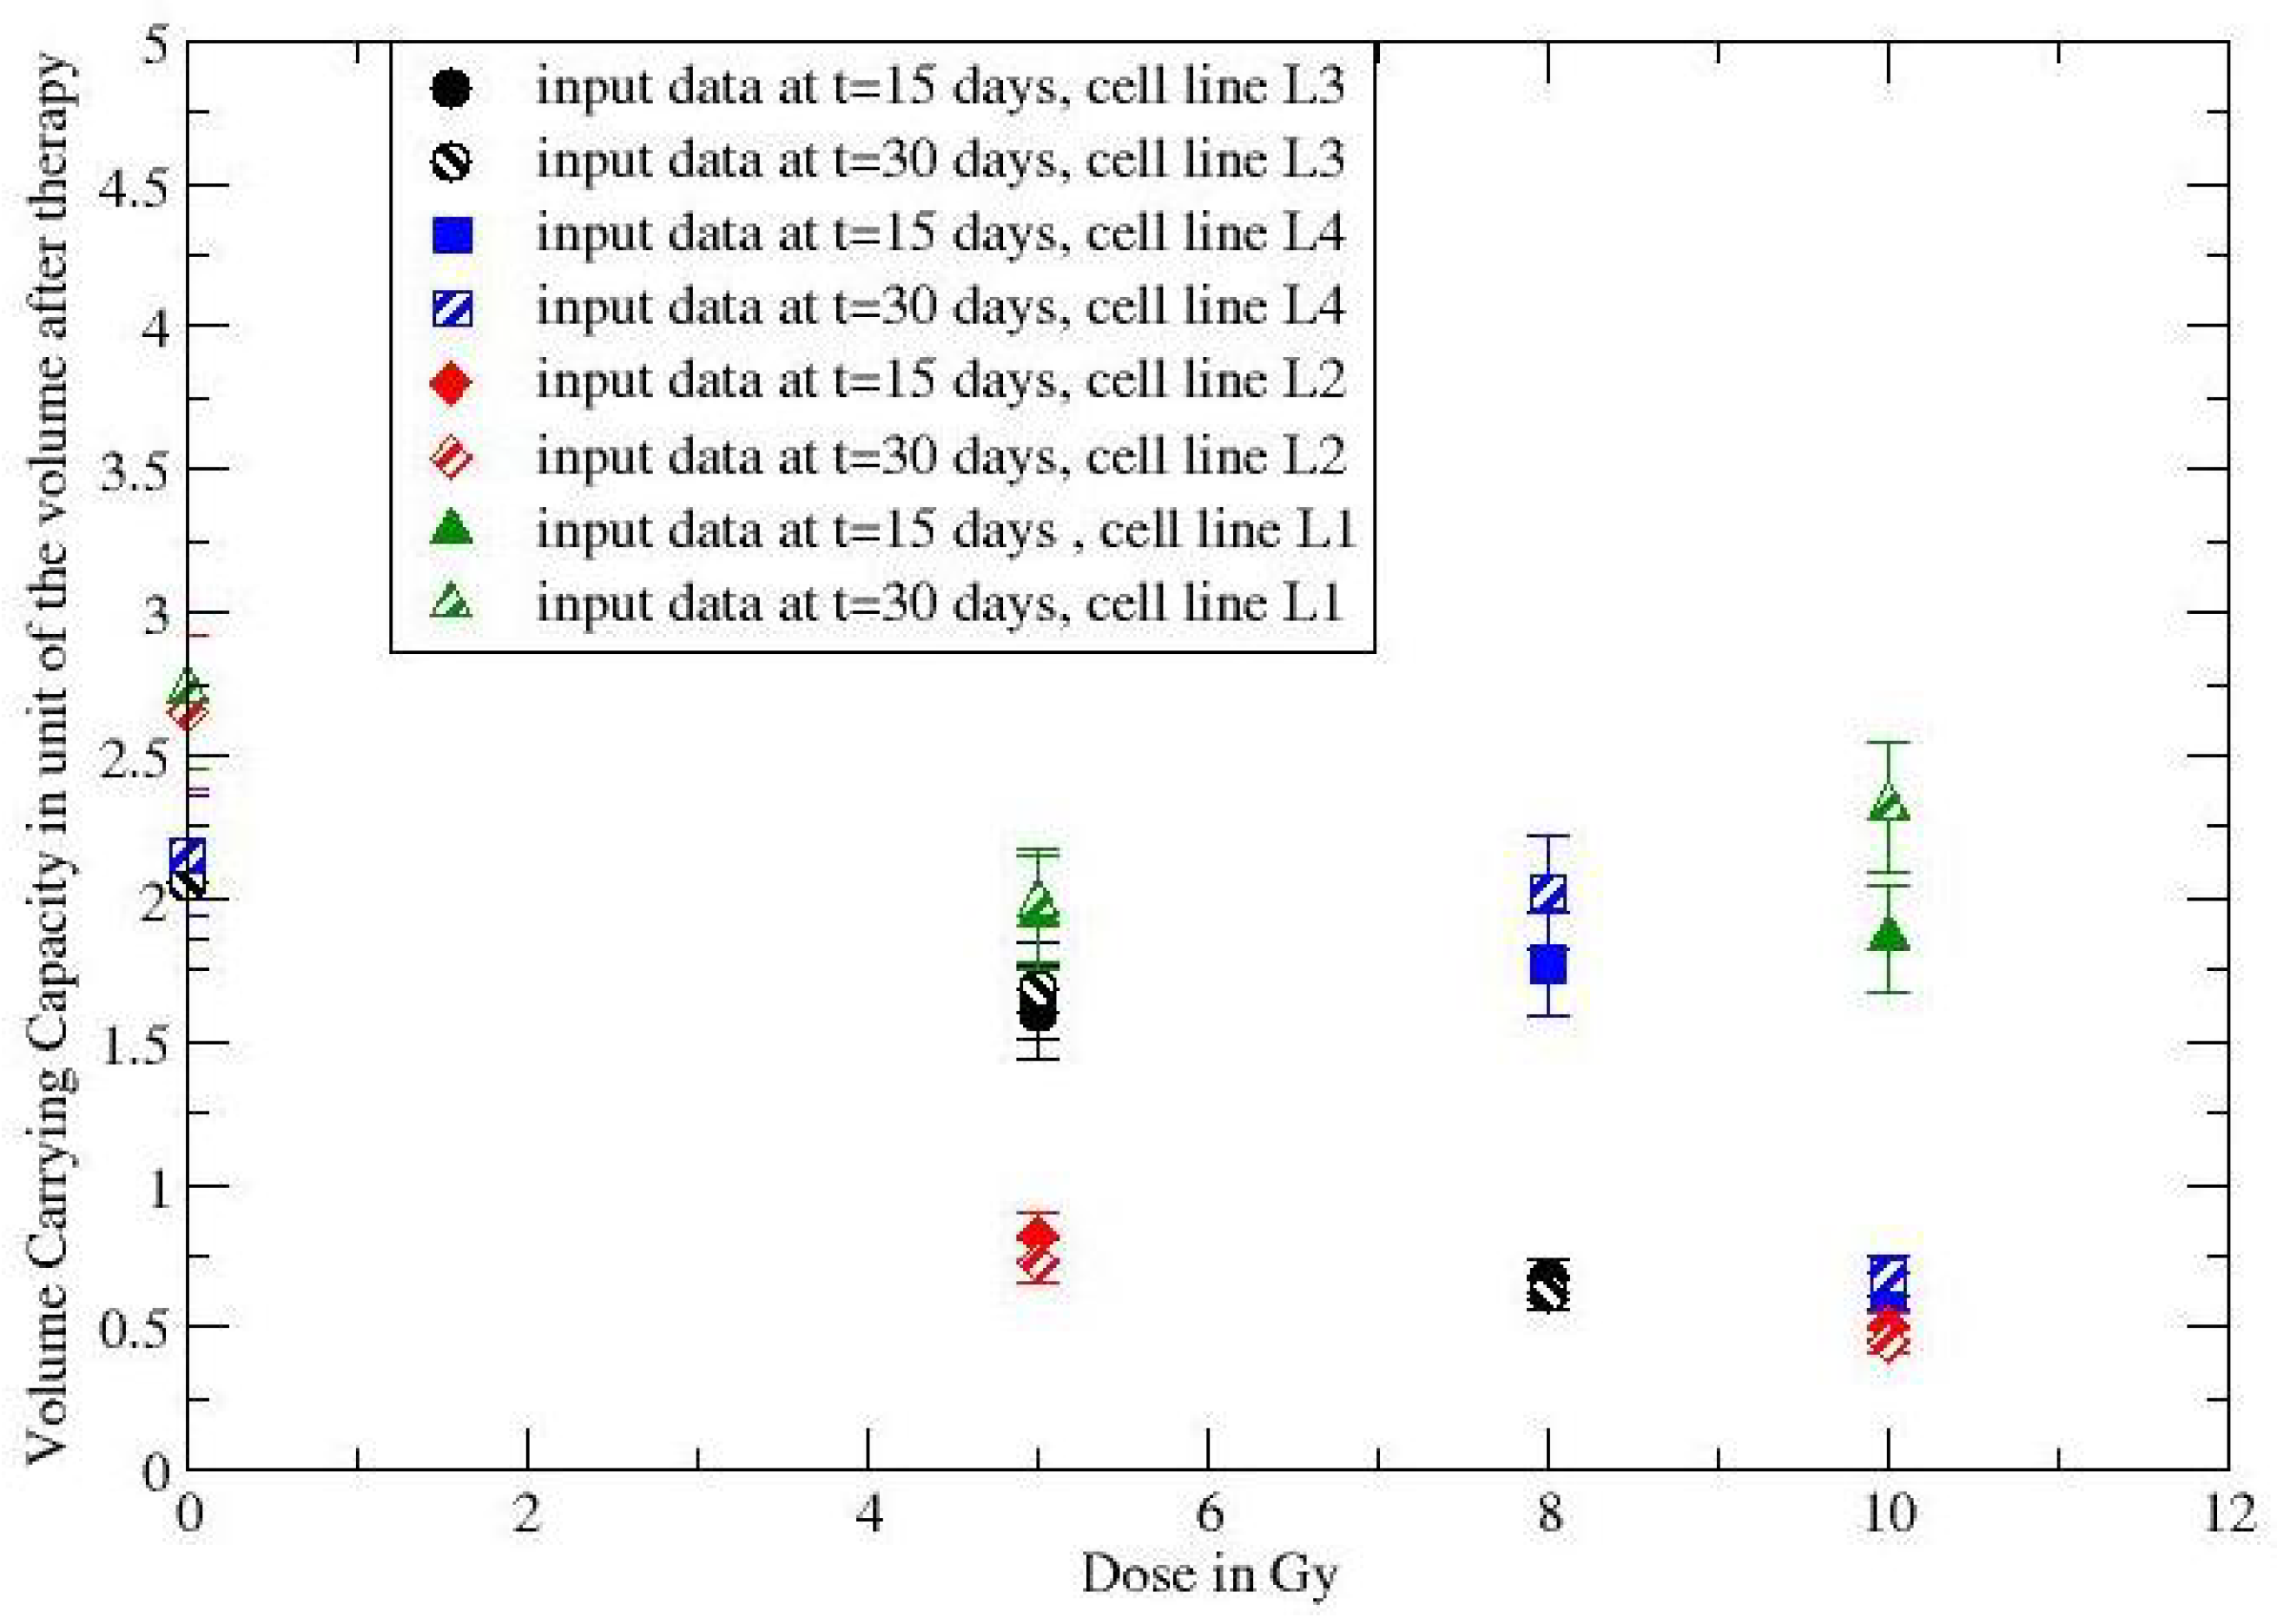
The observed moderate volume variations and the logarithmic dependence on the CC suggest to consider
constant and, therefore, by a simple inversion of Equation (
3), one derives the dependence of the volume carrying capacity,
. The volume regression after the end of the irradiation treatment is, then, described by GL with a change in the volume CC. In
Figure 5 the ratios
as a function of
d have been evaluated by data at 15 days and 30 days, showing complete consistency and the dose dependence of the modified carrying capacity. The responding (non-responding) cell lines have
(
). Although few data points are analyzed, the result suggests to apply the proposed method to the larger in vivo data set in refs. [
39,
40].
The observed regression of rectal tumor during and after chemotherapy in ref. [
39] can be directly fitted by GL with a volume CC less than the initial volume
. The comparison in
Figure 1 gives a volume CC
,
in day
.
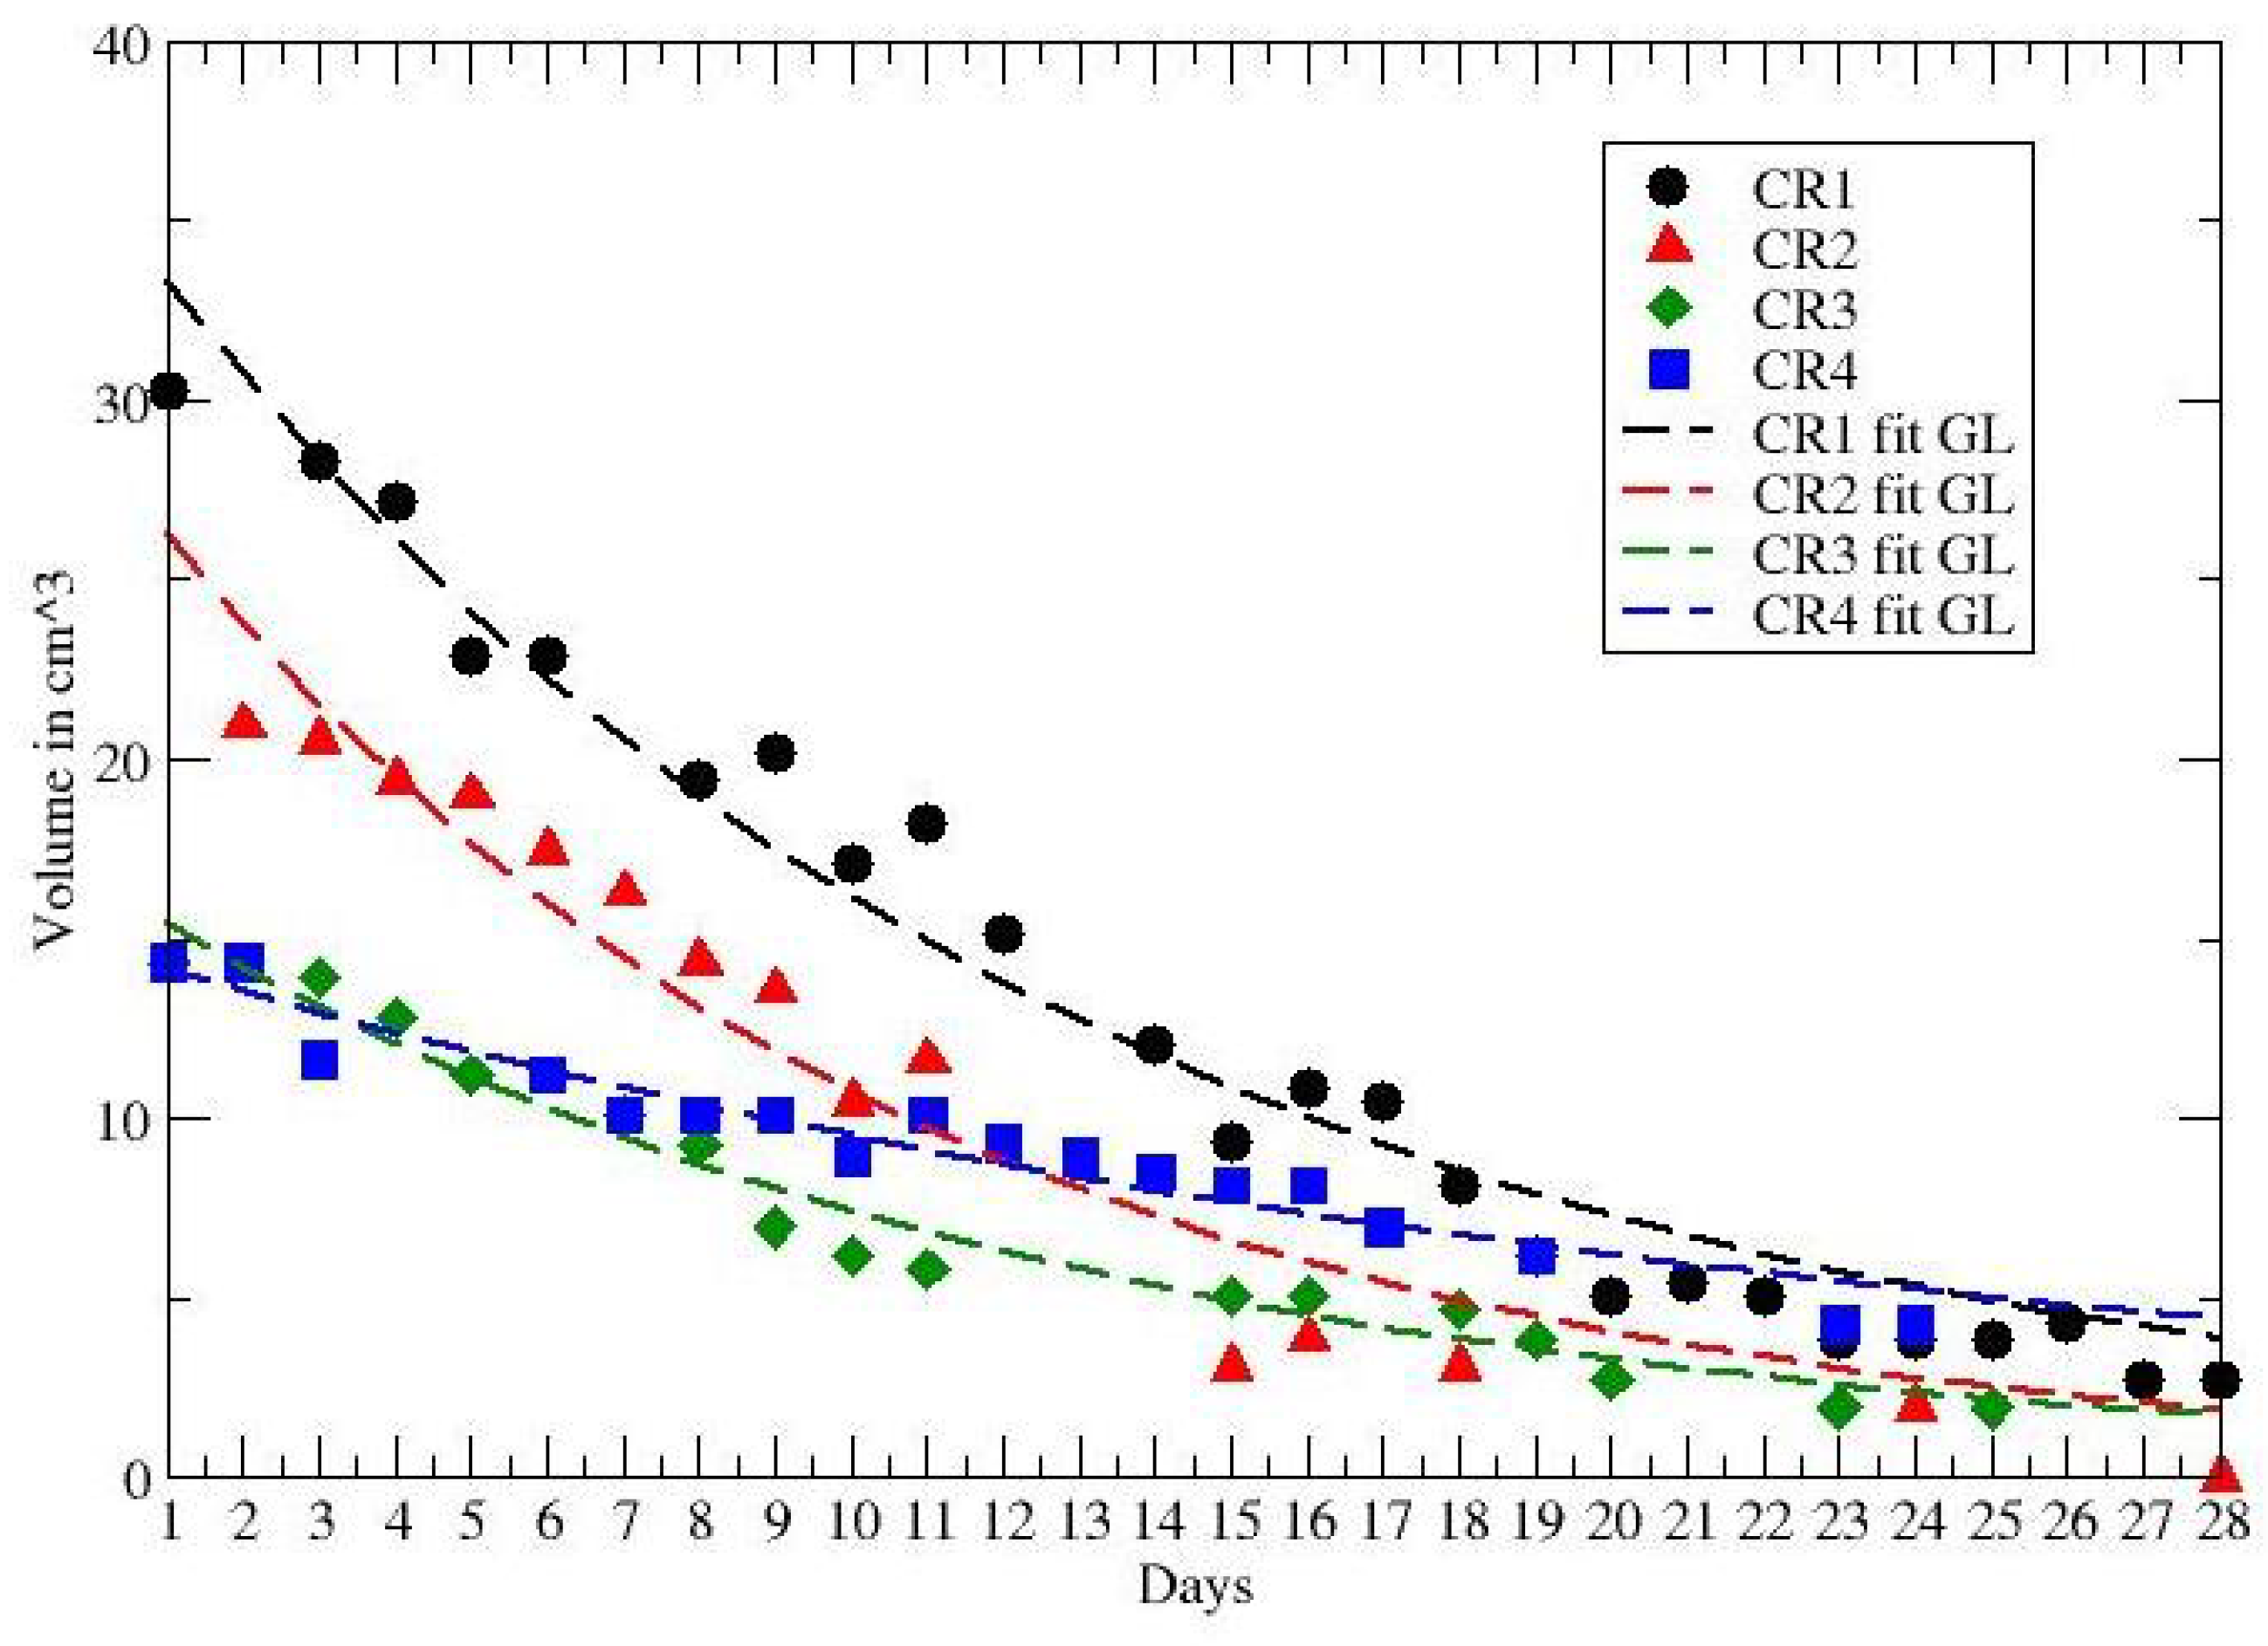
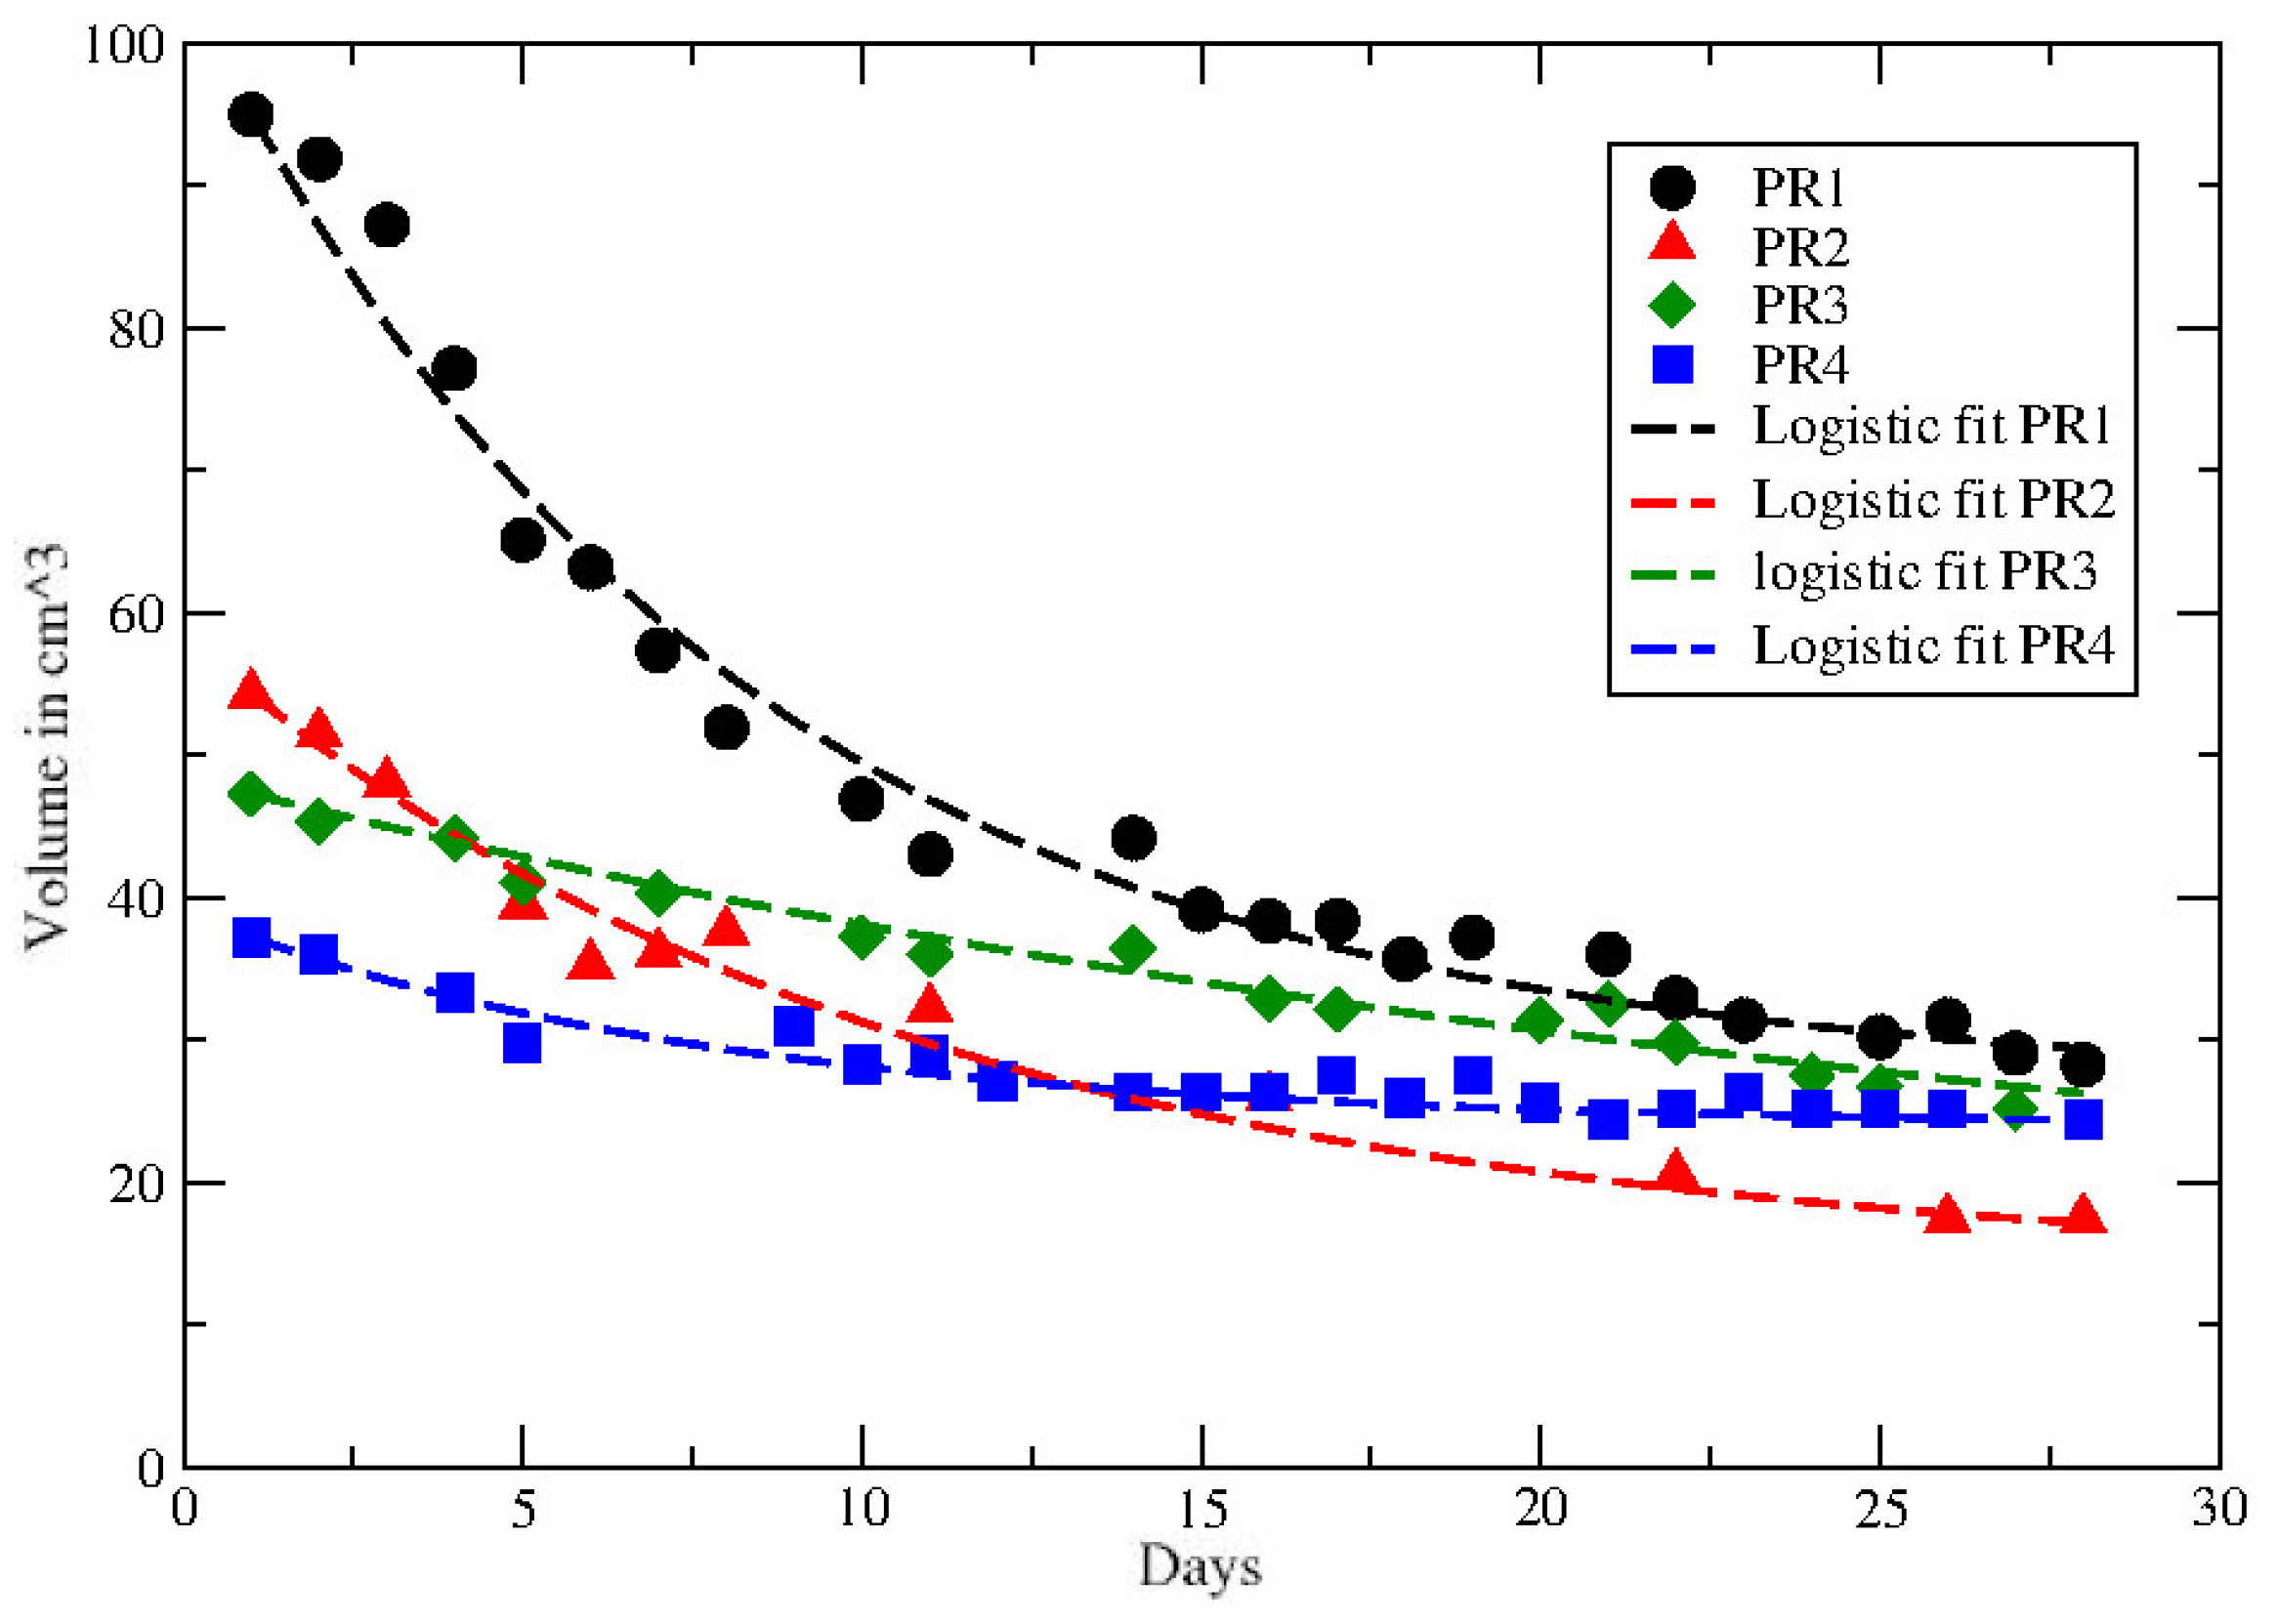
The other data in ref. [
40] report the volume reduction in rectal cancer during neoadjuvant radiochemotherapy for 8 patients, with partial (PR) and complete (CR) recovery. The time series cover about 28 days and the observed behaviour of each PR and CR patient is compared with the GL in
Figure 2 and
Figure 3. The corresponding GL parameters, given in
Table 3 and
Table 4, show a clear difference between PR and CR. Indeed for CR the CC is much smaller than the PR cases.
It should be recalled the Gompertz law parameters for many untreated tumor phenotypes are correlated [
10,
13]. More precisely, the two parameters,
k and
, should be anti-correlated. However this can be obtained only a-posteriori. A priori there is no clinical reason to expect the anti-correlation, which is still unexplained. From this point of view, the correct procedure is to consider a priori two different parameters since, moreover, the correlation has been observed for tumor growth without treatment or with radiotherapy, but our more relevant analysis concerns patients with neo-adjuvant radio and chemotherapy. Previous data can be analyzed by different macroscopic growth law. The logistic law (LL) (see
Appendix A),
gives similar fits of the data, as reported in
Figure 6 and
Figure 7, with the values of the parameters given in
Table 5.
4. Discussion
The application of coarse-grain algorithms to describe/predict the therapy effects on the time evolution of tumor size are often underestimated. The main reason is the difficult collection of experimental data in vivo, as evidenced by the few available data in literature.
On the other hand, our results pave the way for the construction of a, model independent, phenomenological approach to predict the shrinkage of the tumor size on the basis of a small number of data during the therapy or after its end.
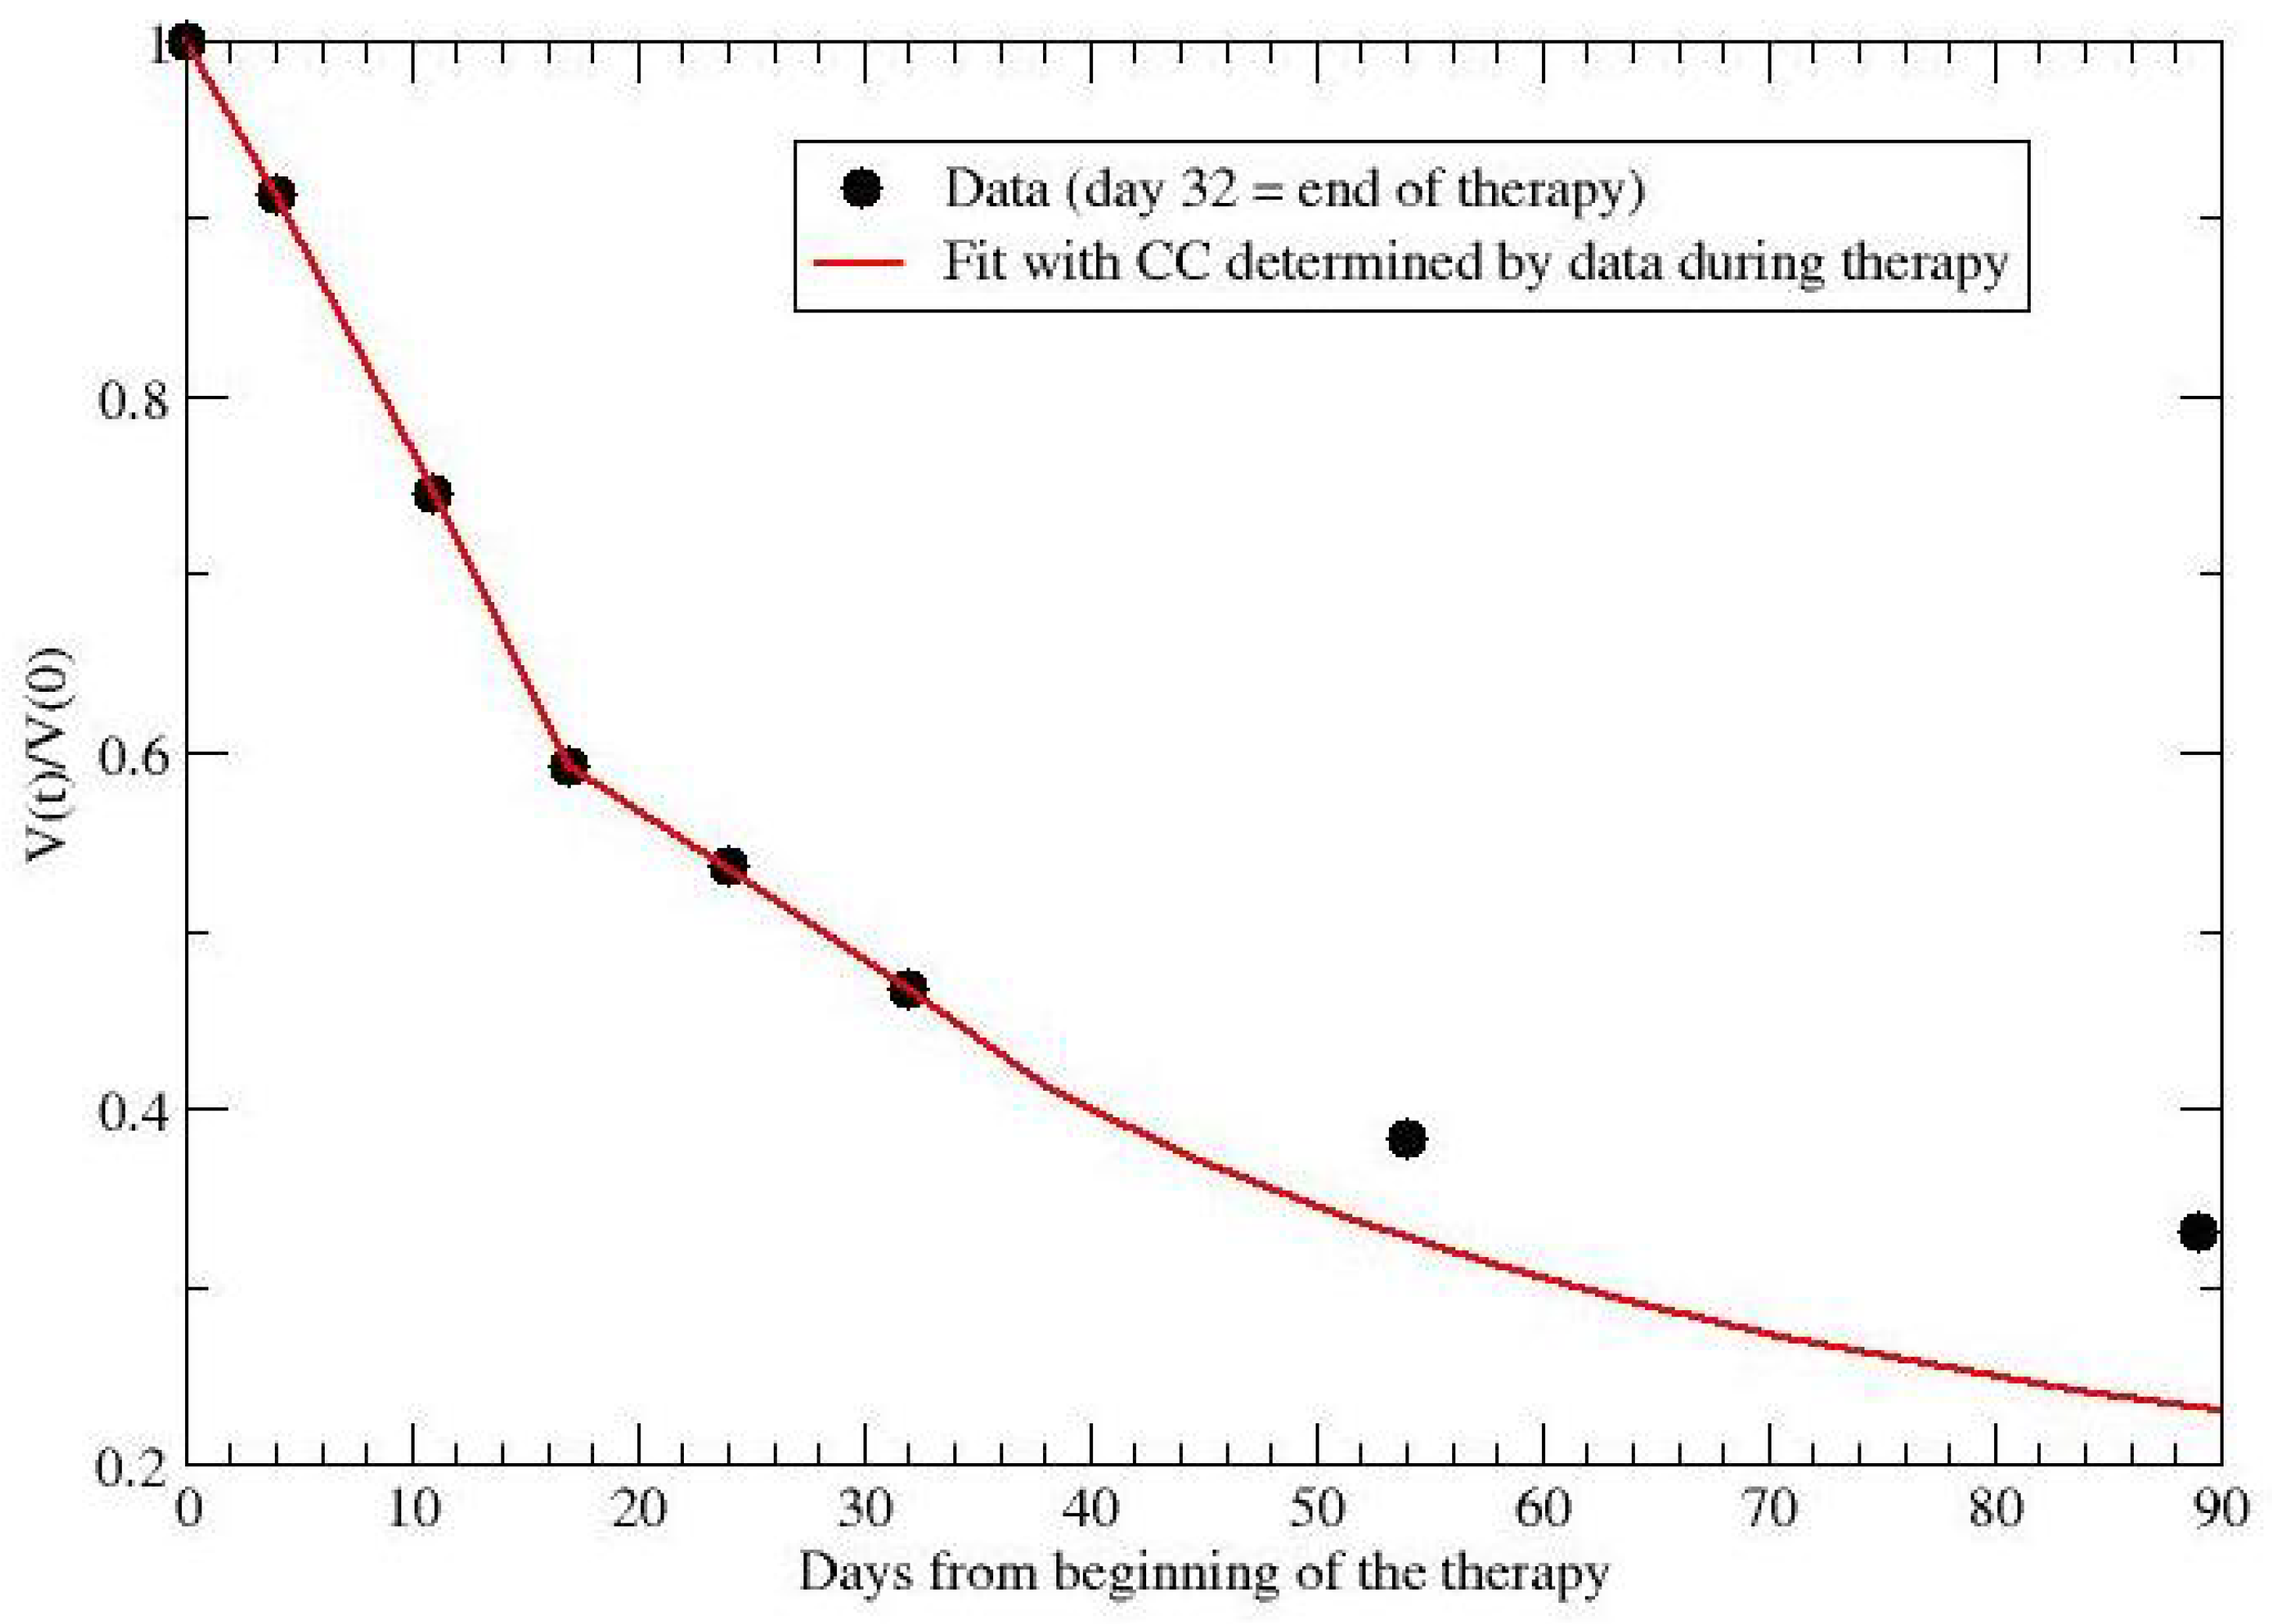
For example, for the data in ref. [
39], one can compare the observed data after the end of therapy with the prediction based on the CC fitted by data during radio and chemo treatment. By collecting data during the first 32 days, one predicts the evolution for almost two months later. The comparison is reported in
Figure 8 and gives 0.33 (data) versus 0.23 (prediction) for the final observation time (day 89).
Analogously, for patient PR1, cm and per day, but one gets cm and per day by considering the first 11/23 data. In other terms, by a limited set of observations one could obtain a good approximation for the complete evolution.
This indication should be extremely useful for clinical decisions concerning modified treatments and/or surgery in a patient oriented way. However, a sufficient amount of data is required to disantangle the GL or the LL from an exponential or linear behavior and the evaluation of the smallest data subset to obtain reliable predictions is in progress.


