
Whole-Genome Sequencing of 100 Genomes Identifies a Distinctive Genetic Susceptibility Profile of Qatari Patients with Hypertension


Abstract
:1. Introduction
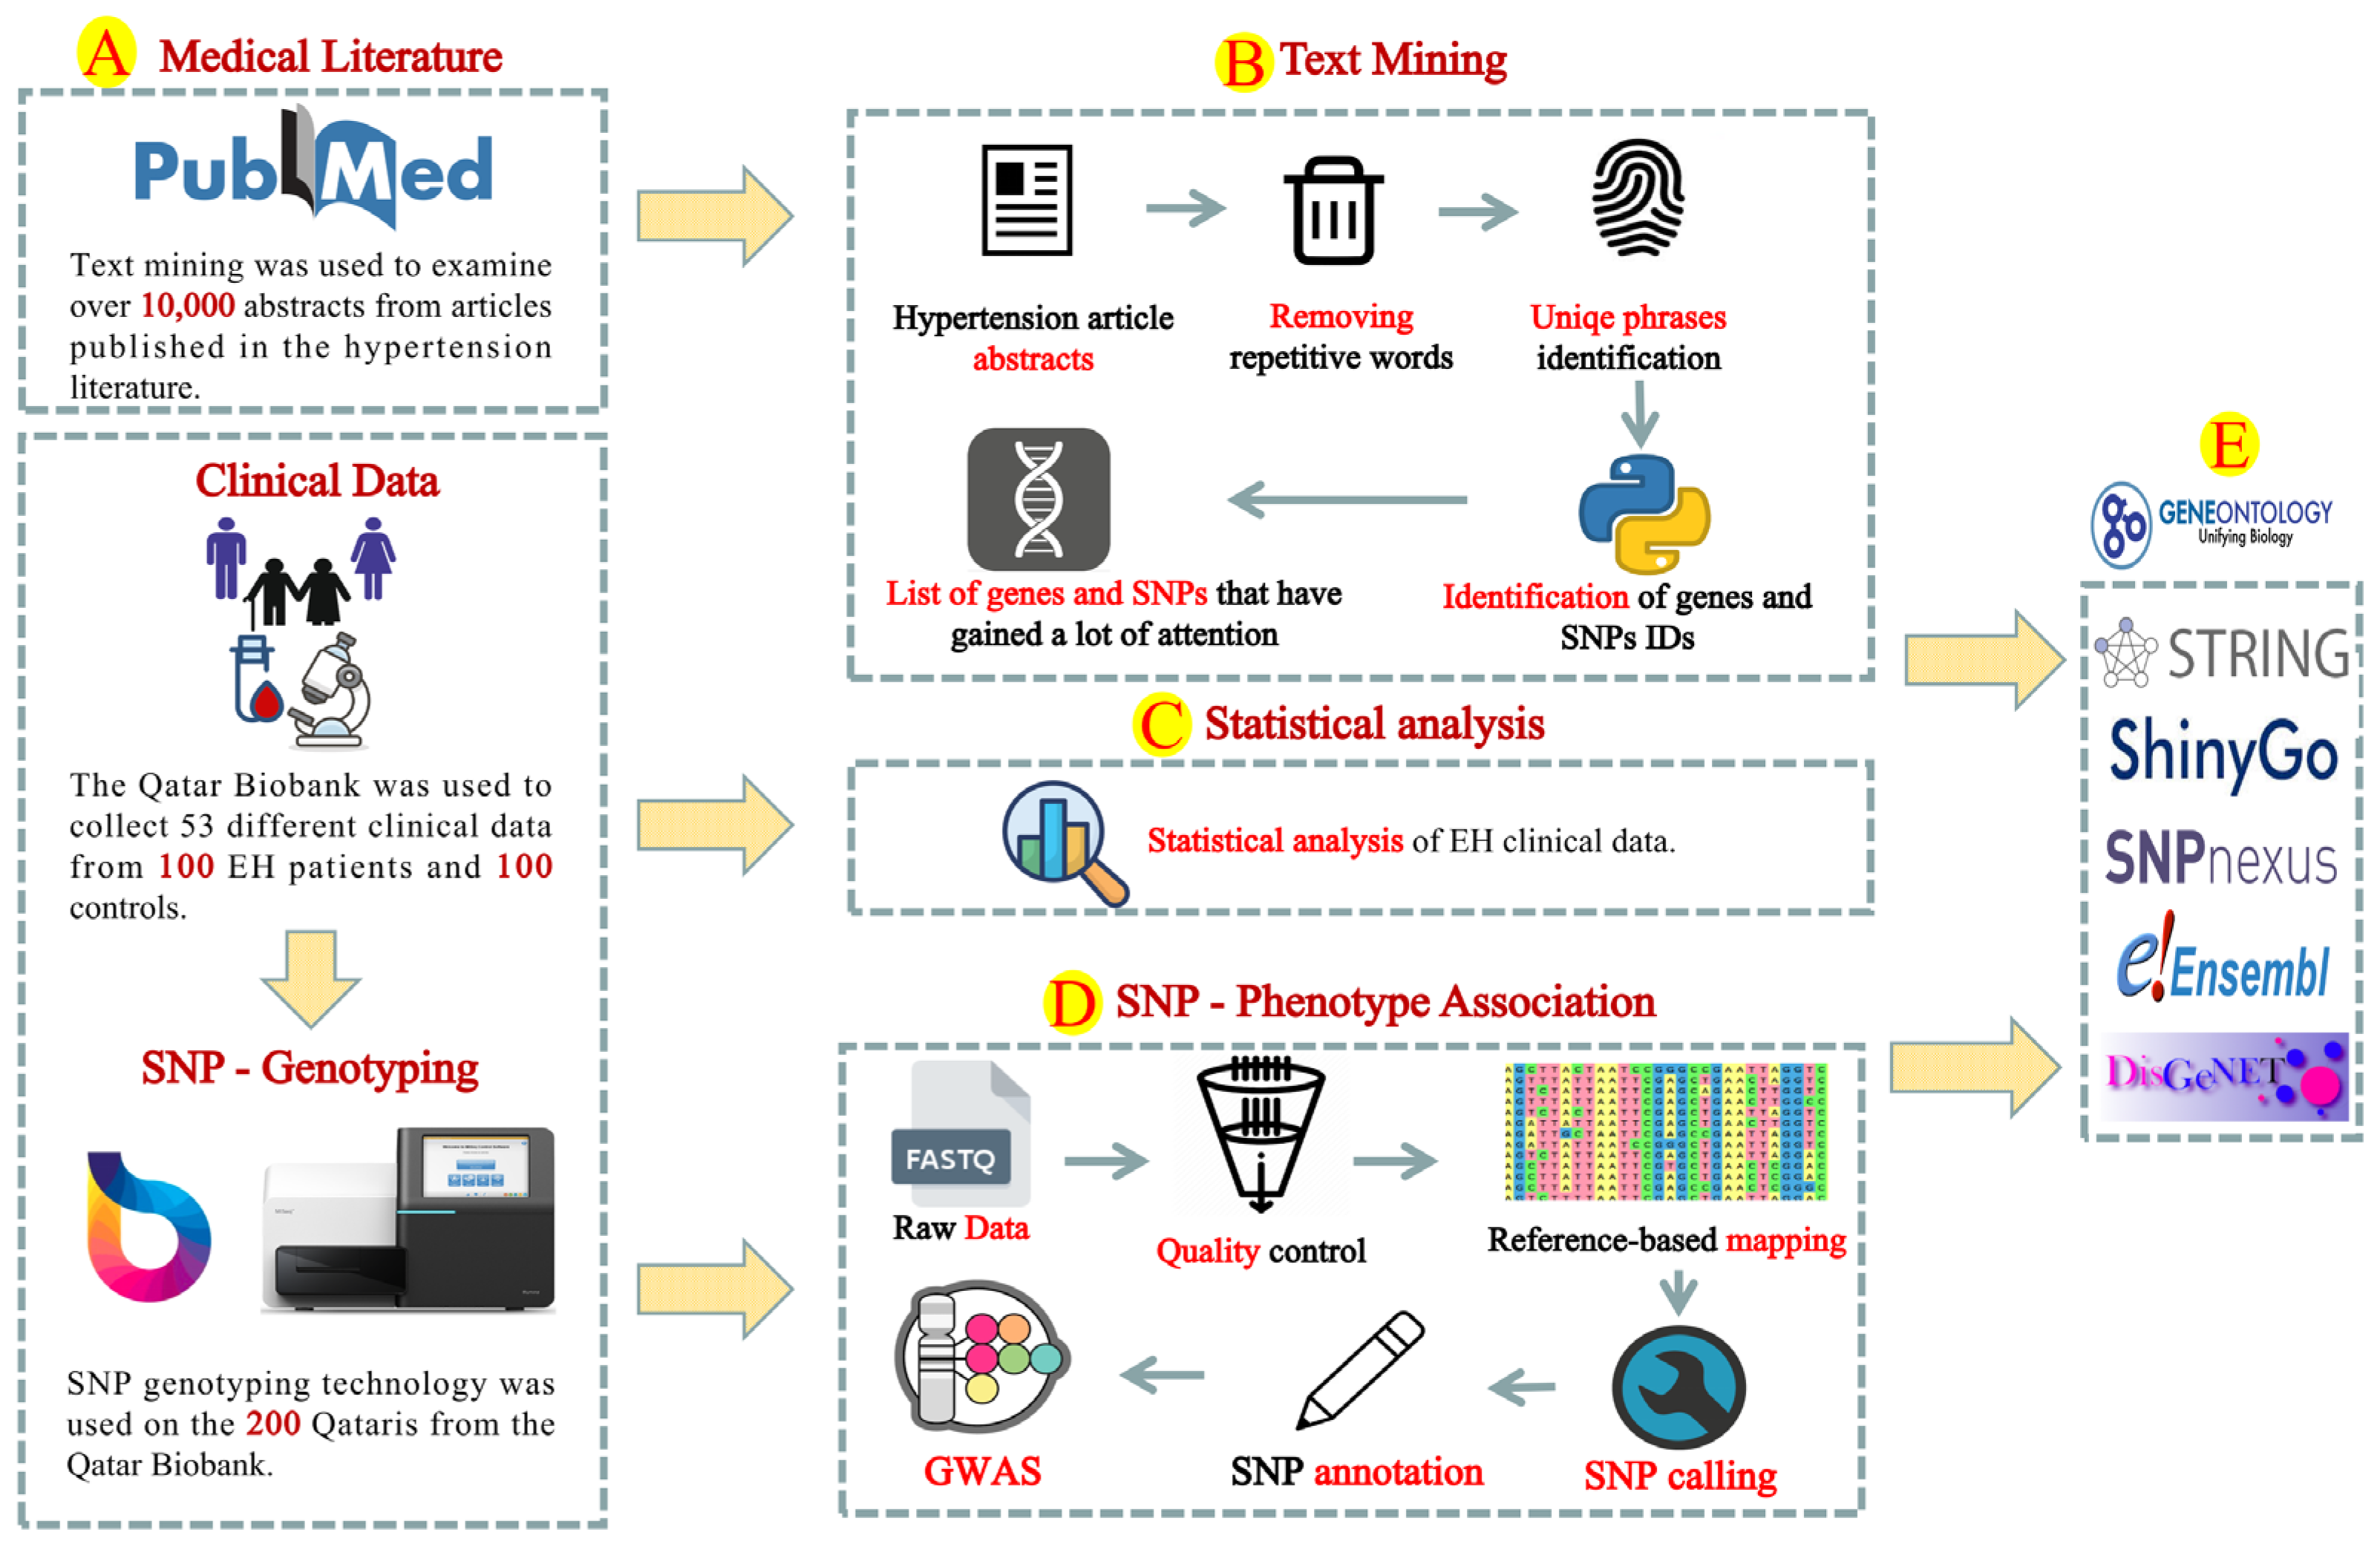
2. Methodology
2.1. SNPs Associated with EH in Qatari Population
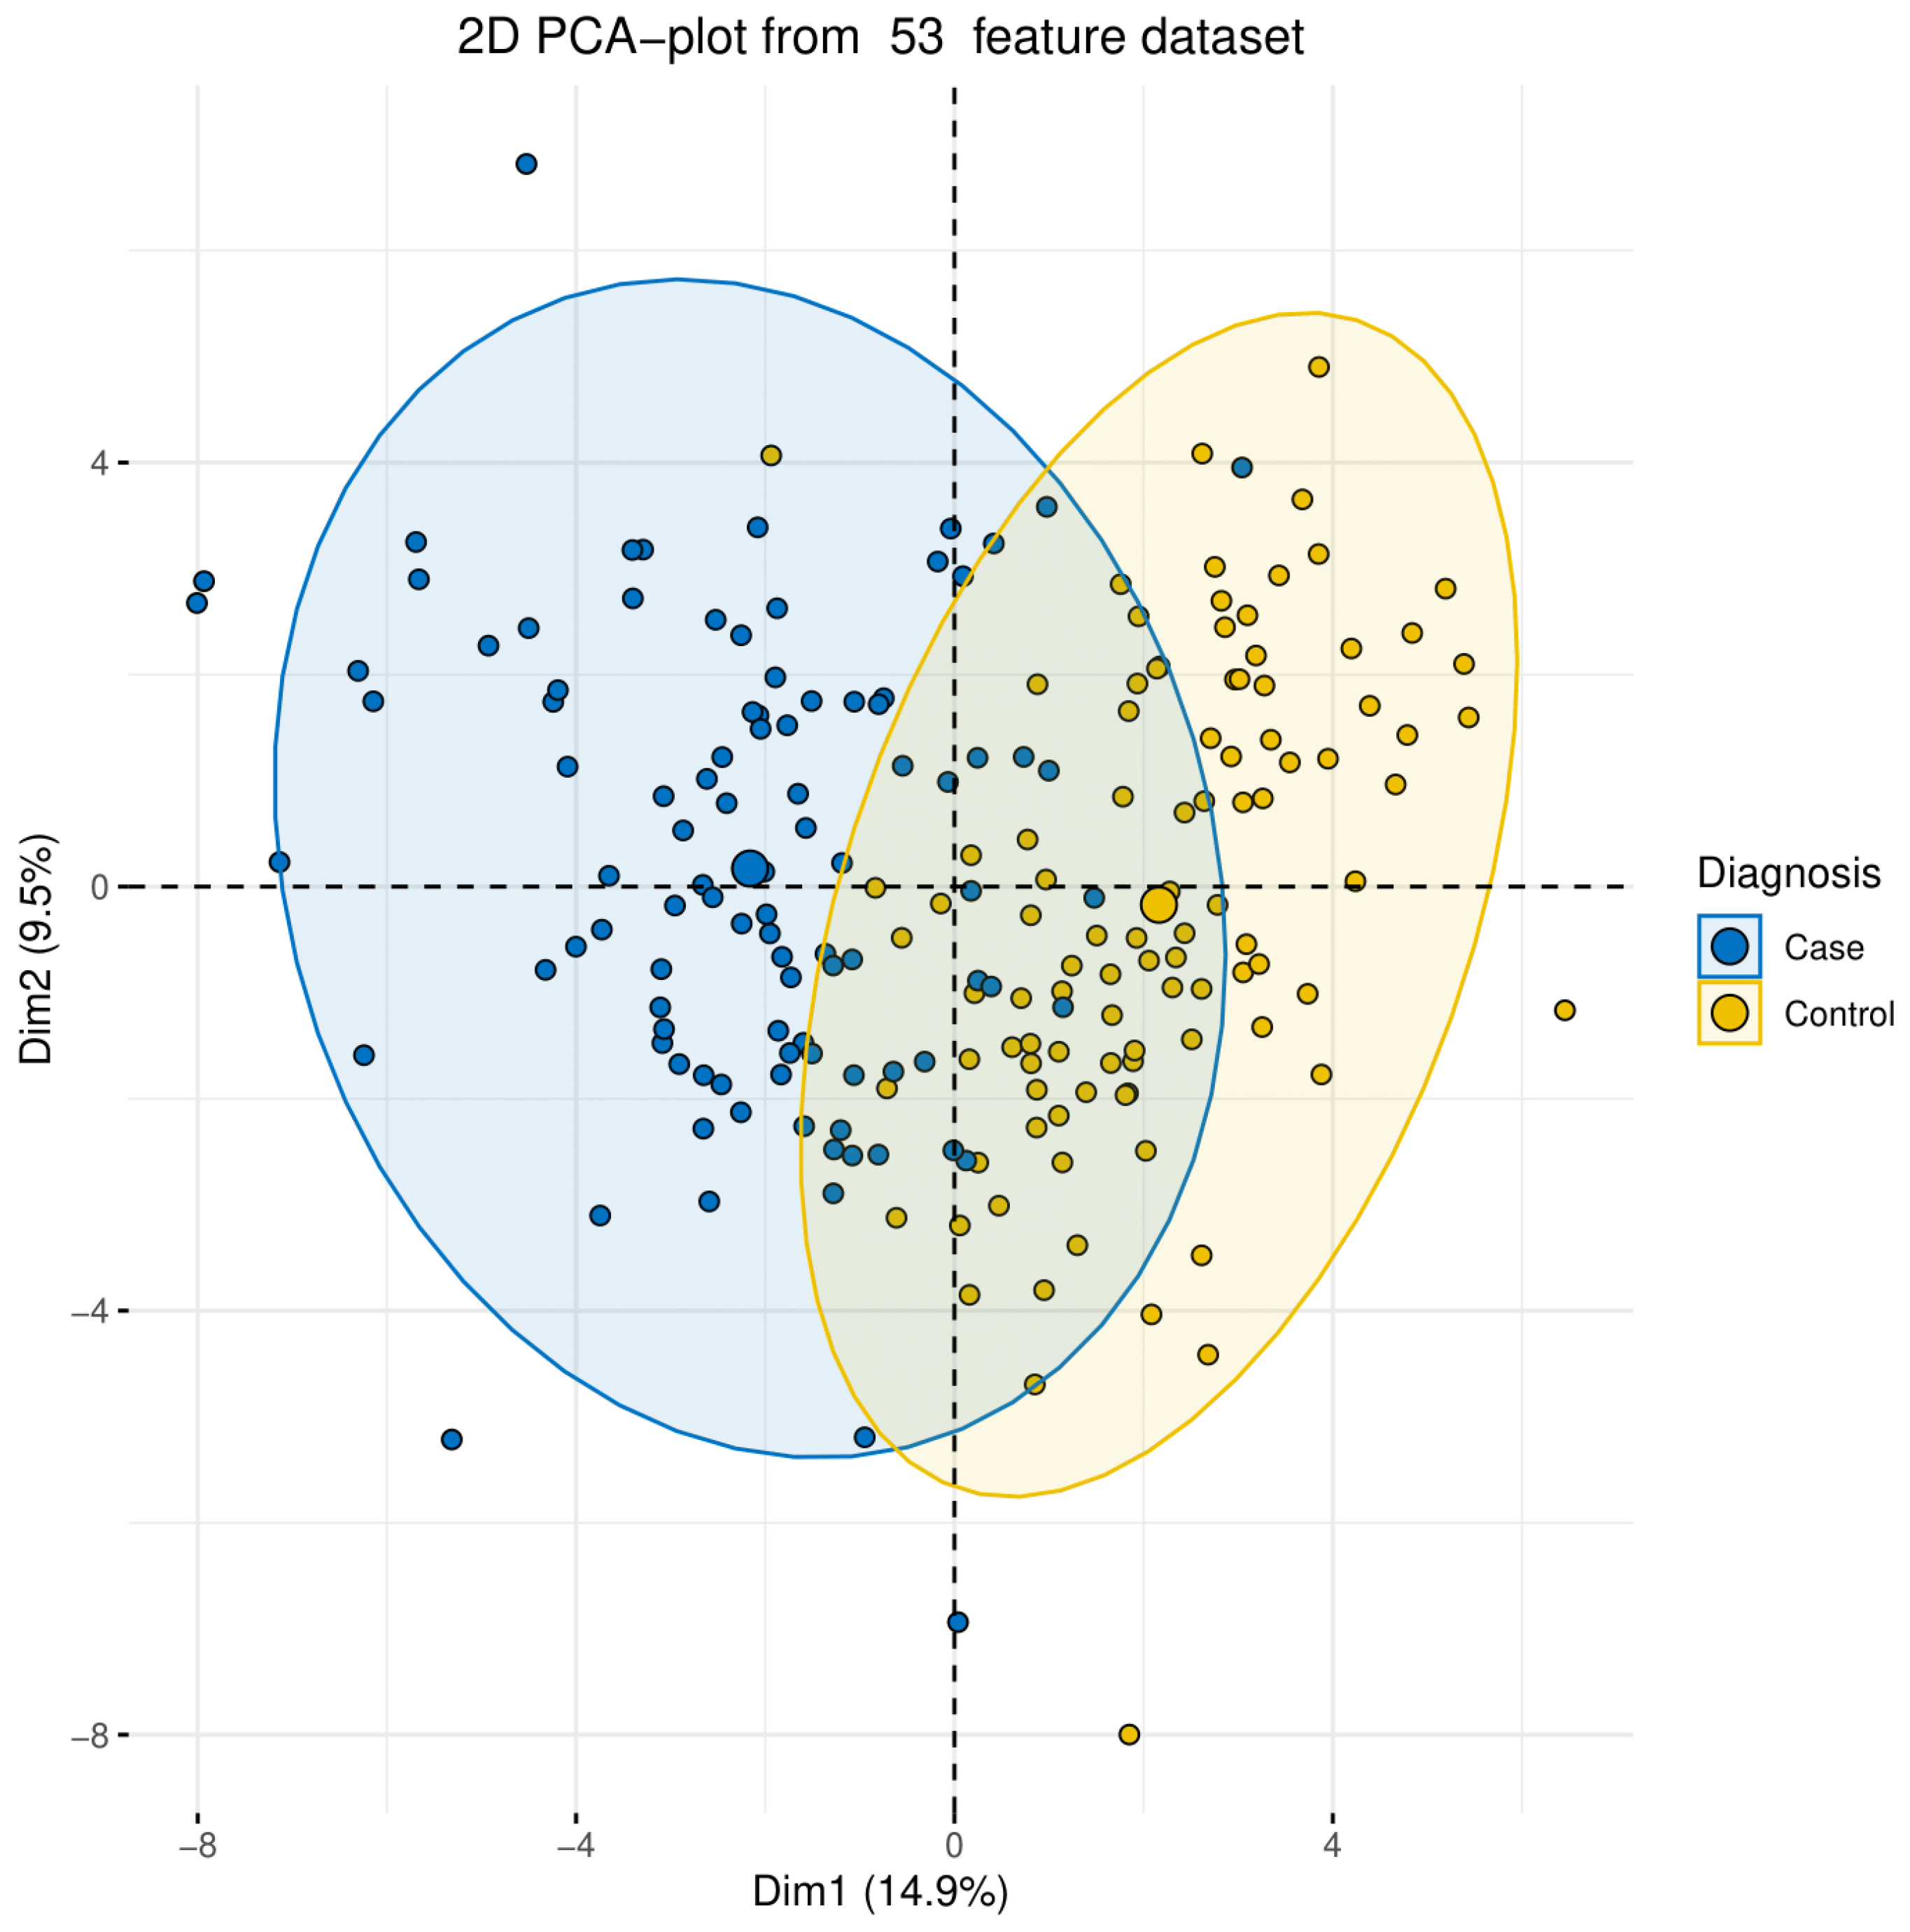
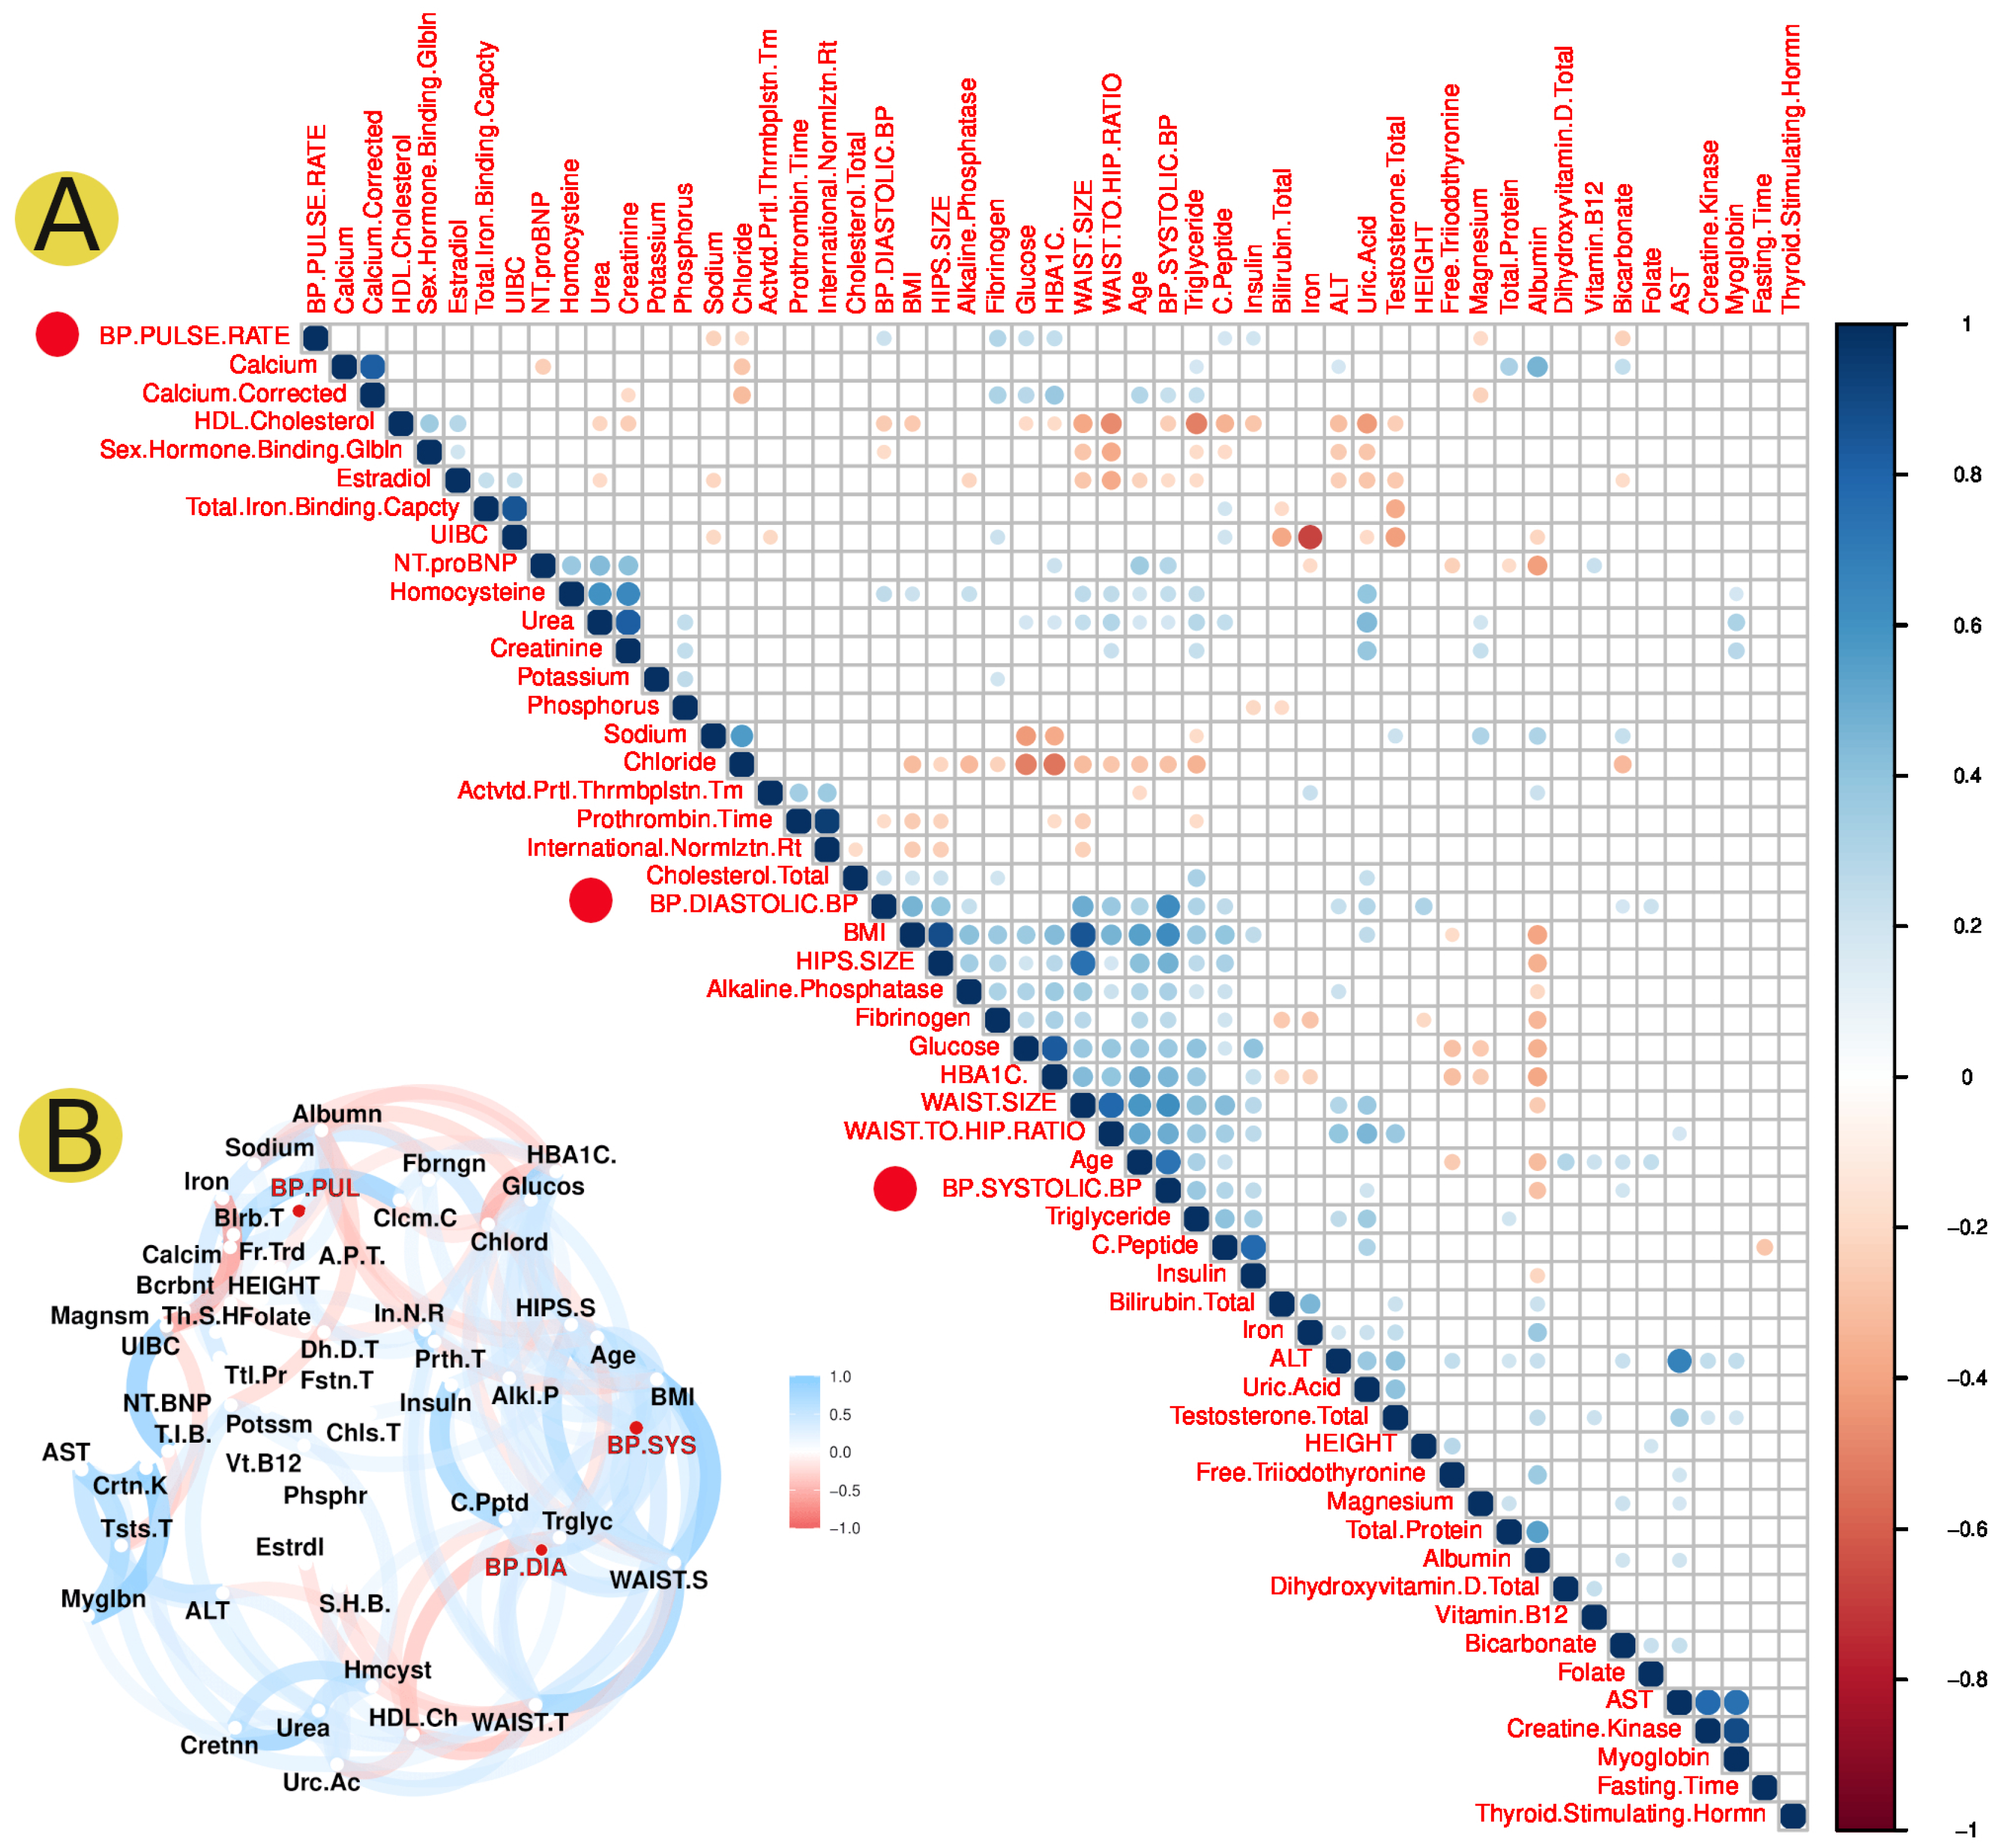
2.1.1. Study Design and Statistical Analysis
2.1.2. SNP Genotyping and Computational Analysis
2.2. Exploring Published Hypertension Literature
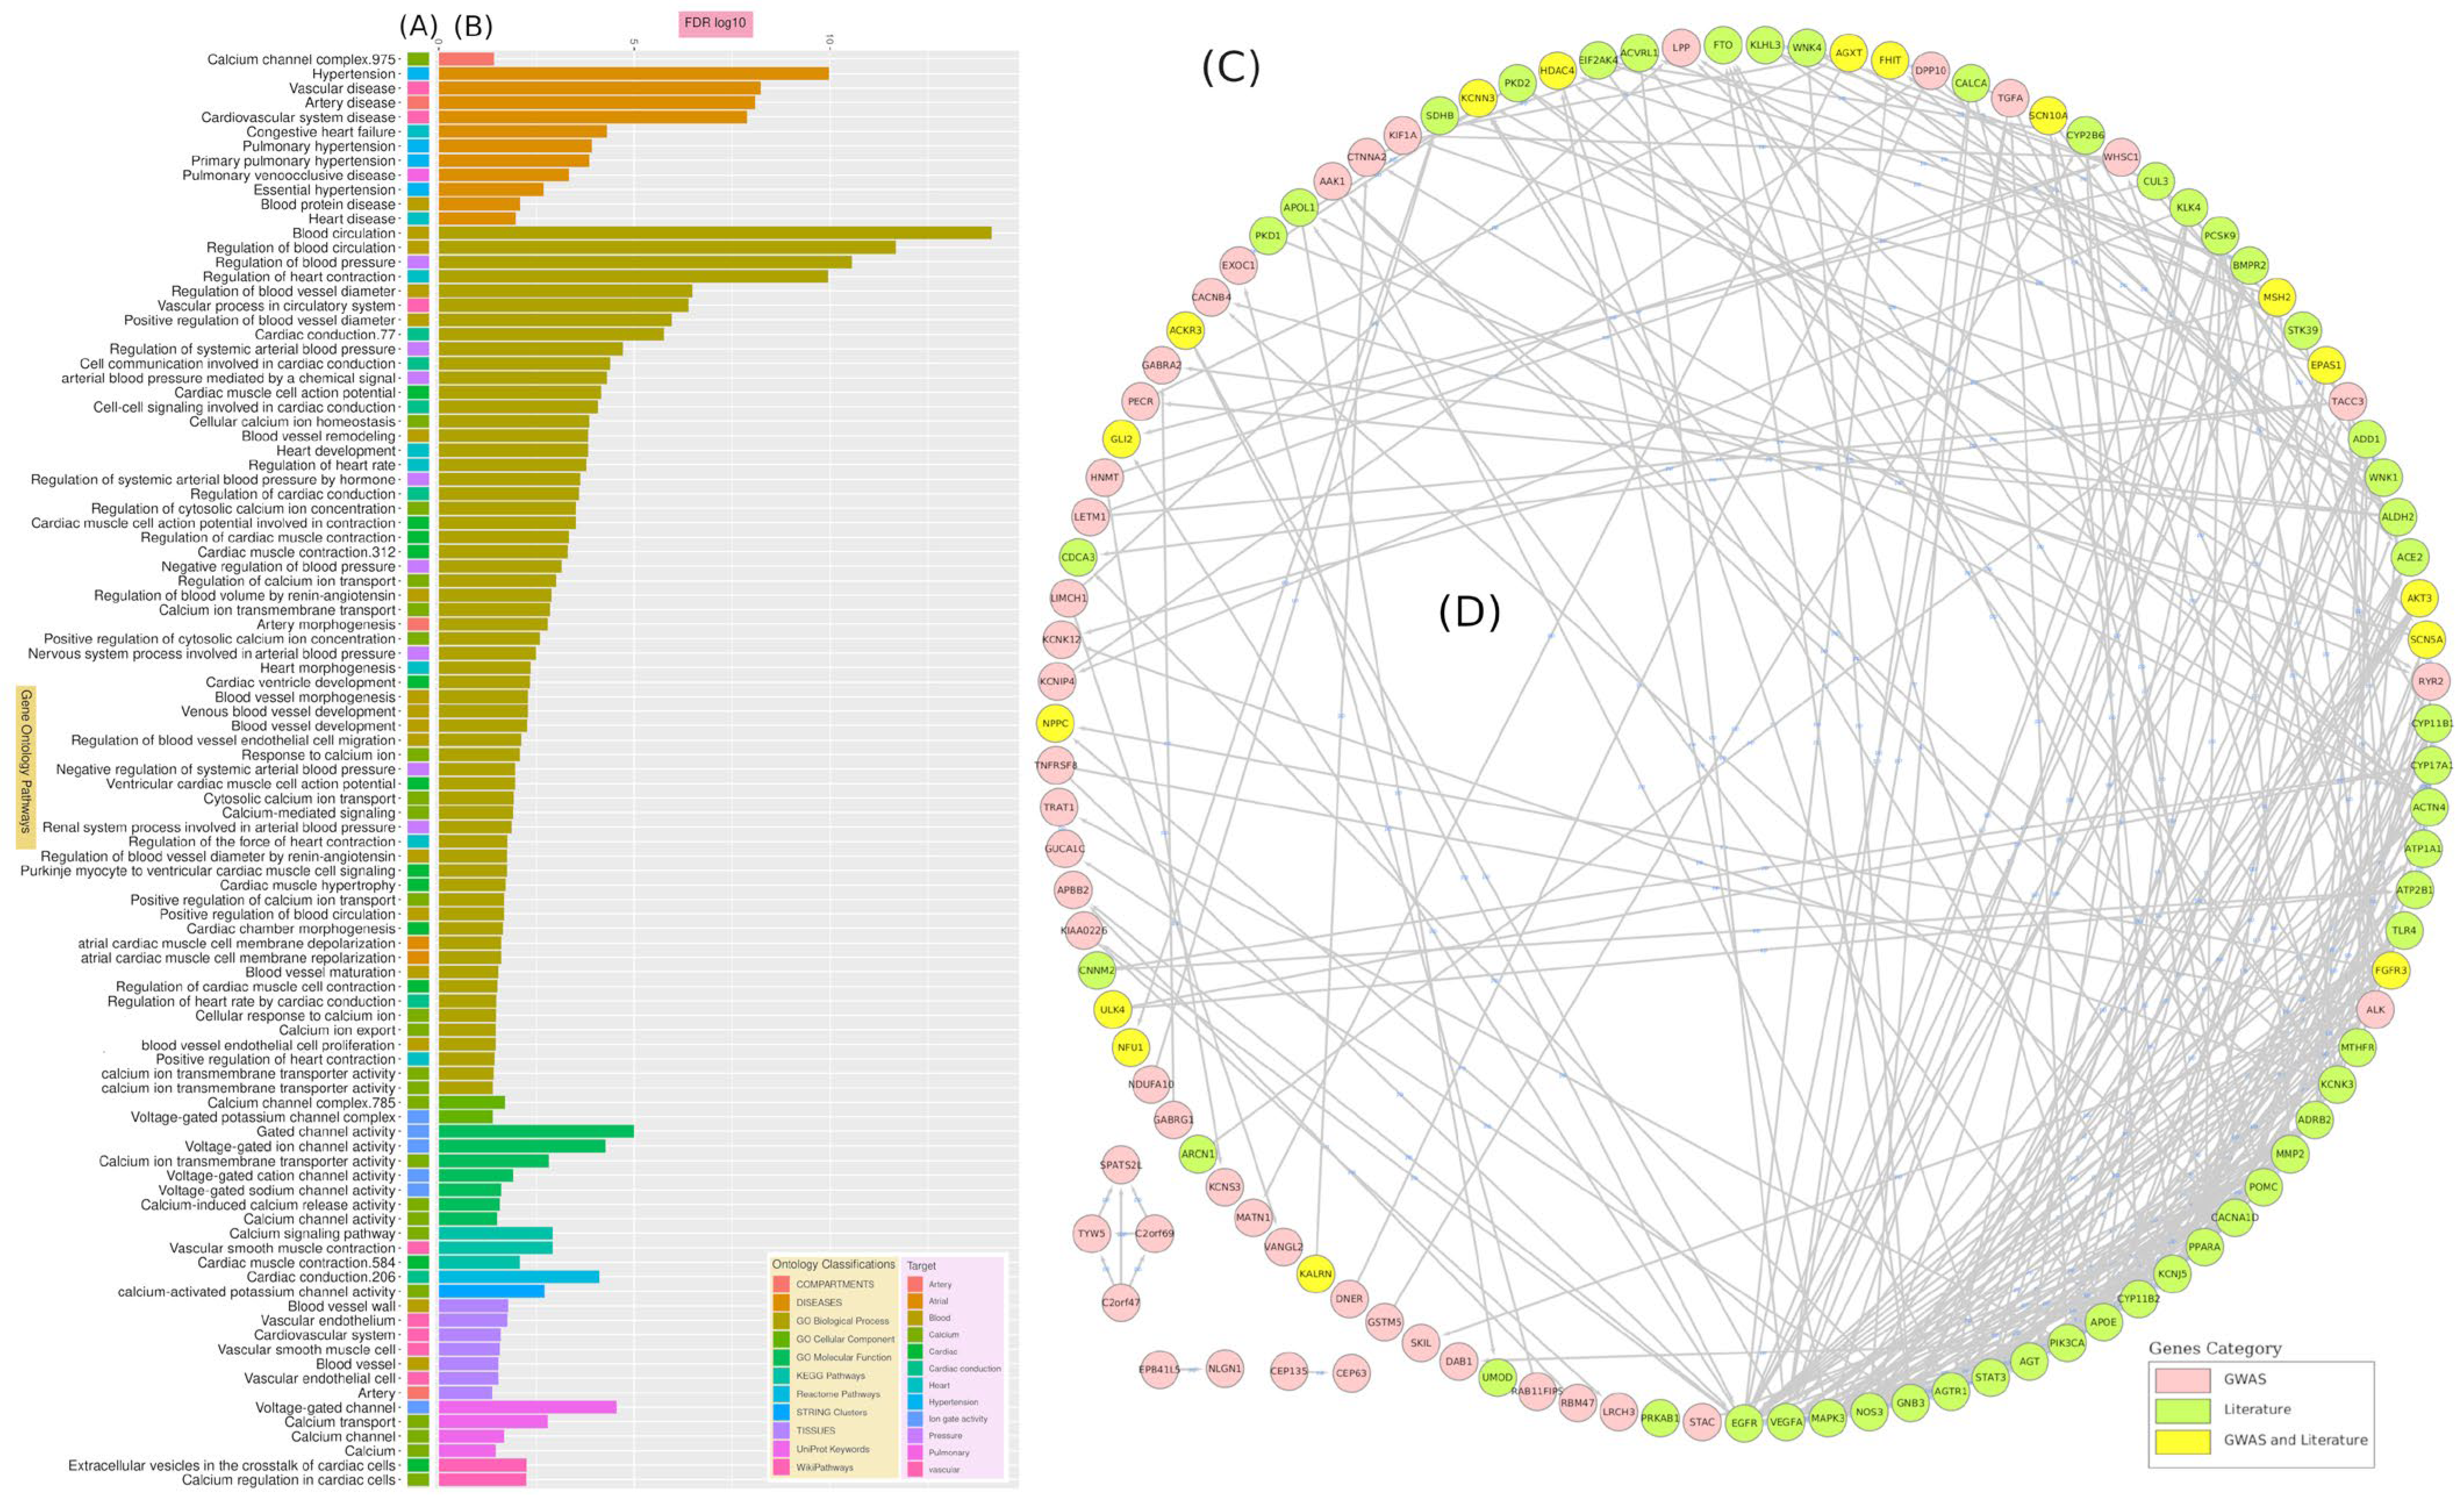
2.3. Gene and SNP Enrichment Analysis
3. Results
3.1. Statistical Analysis
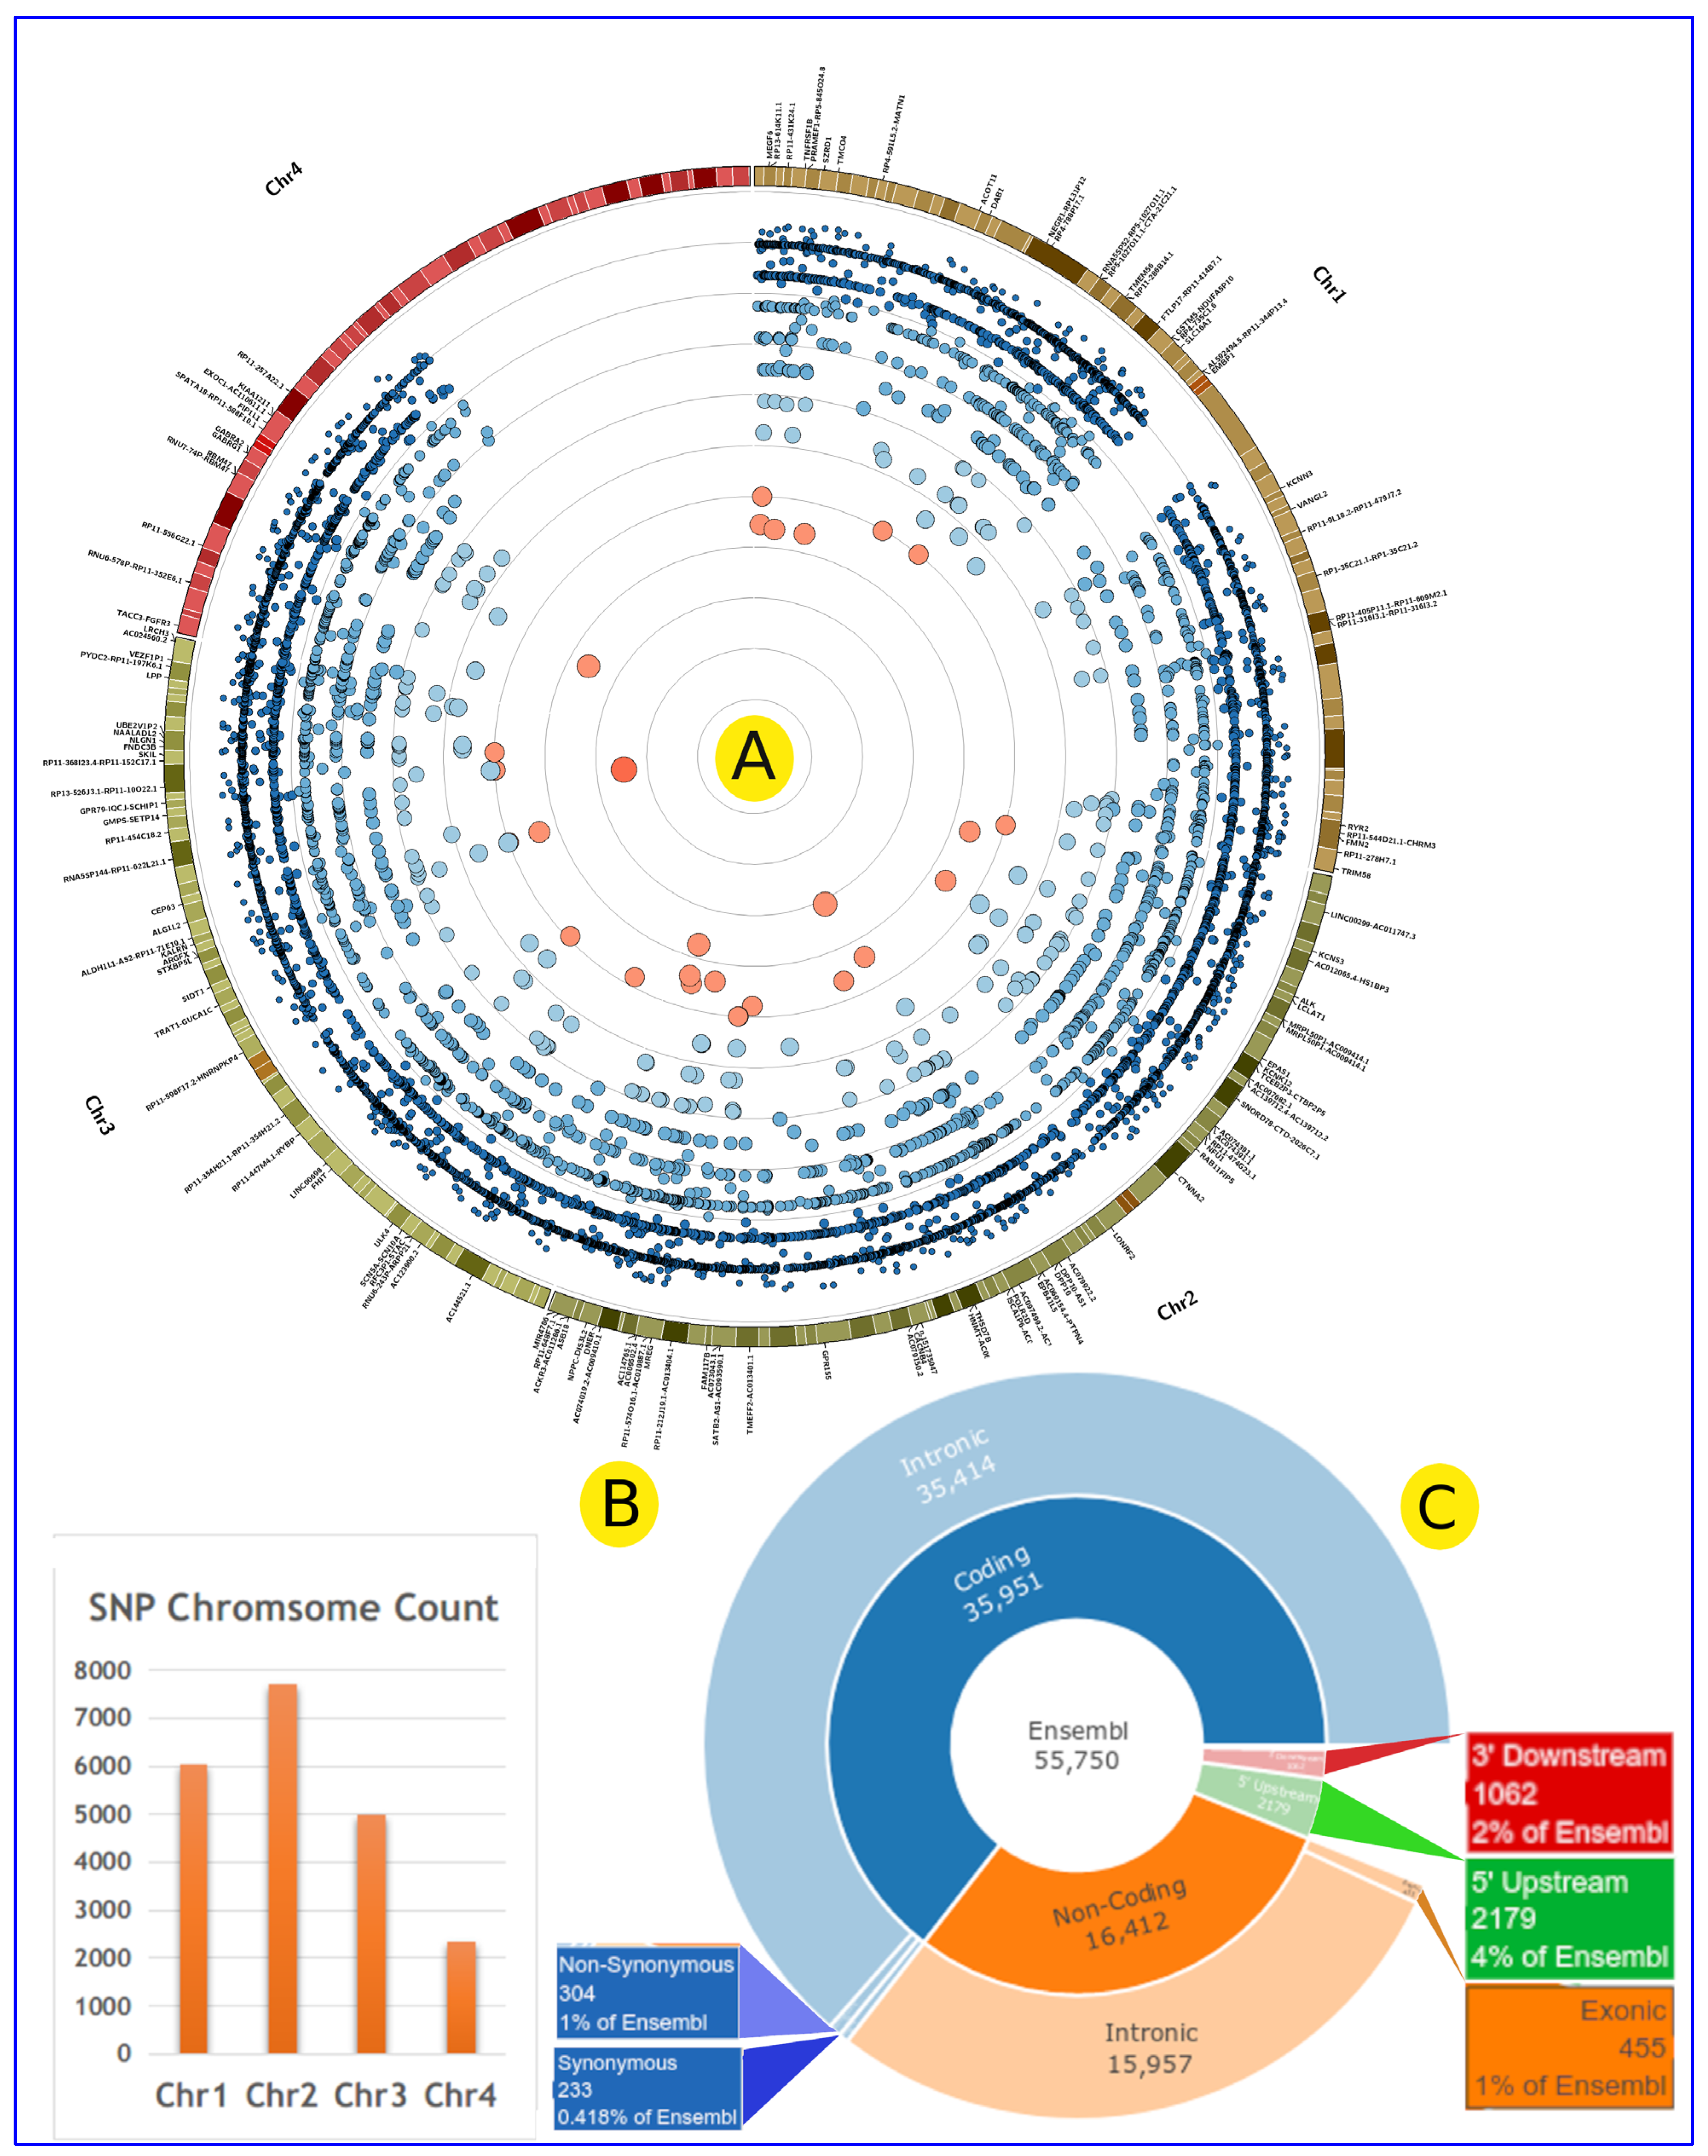
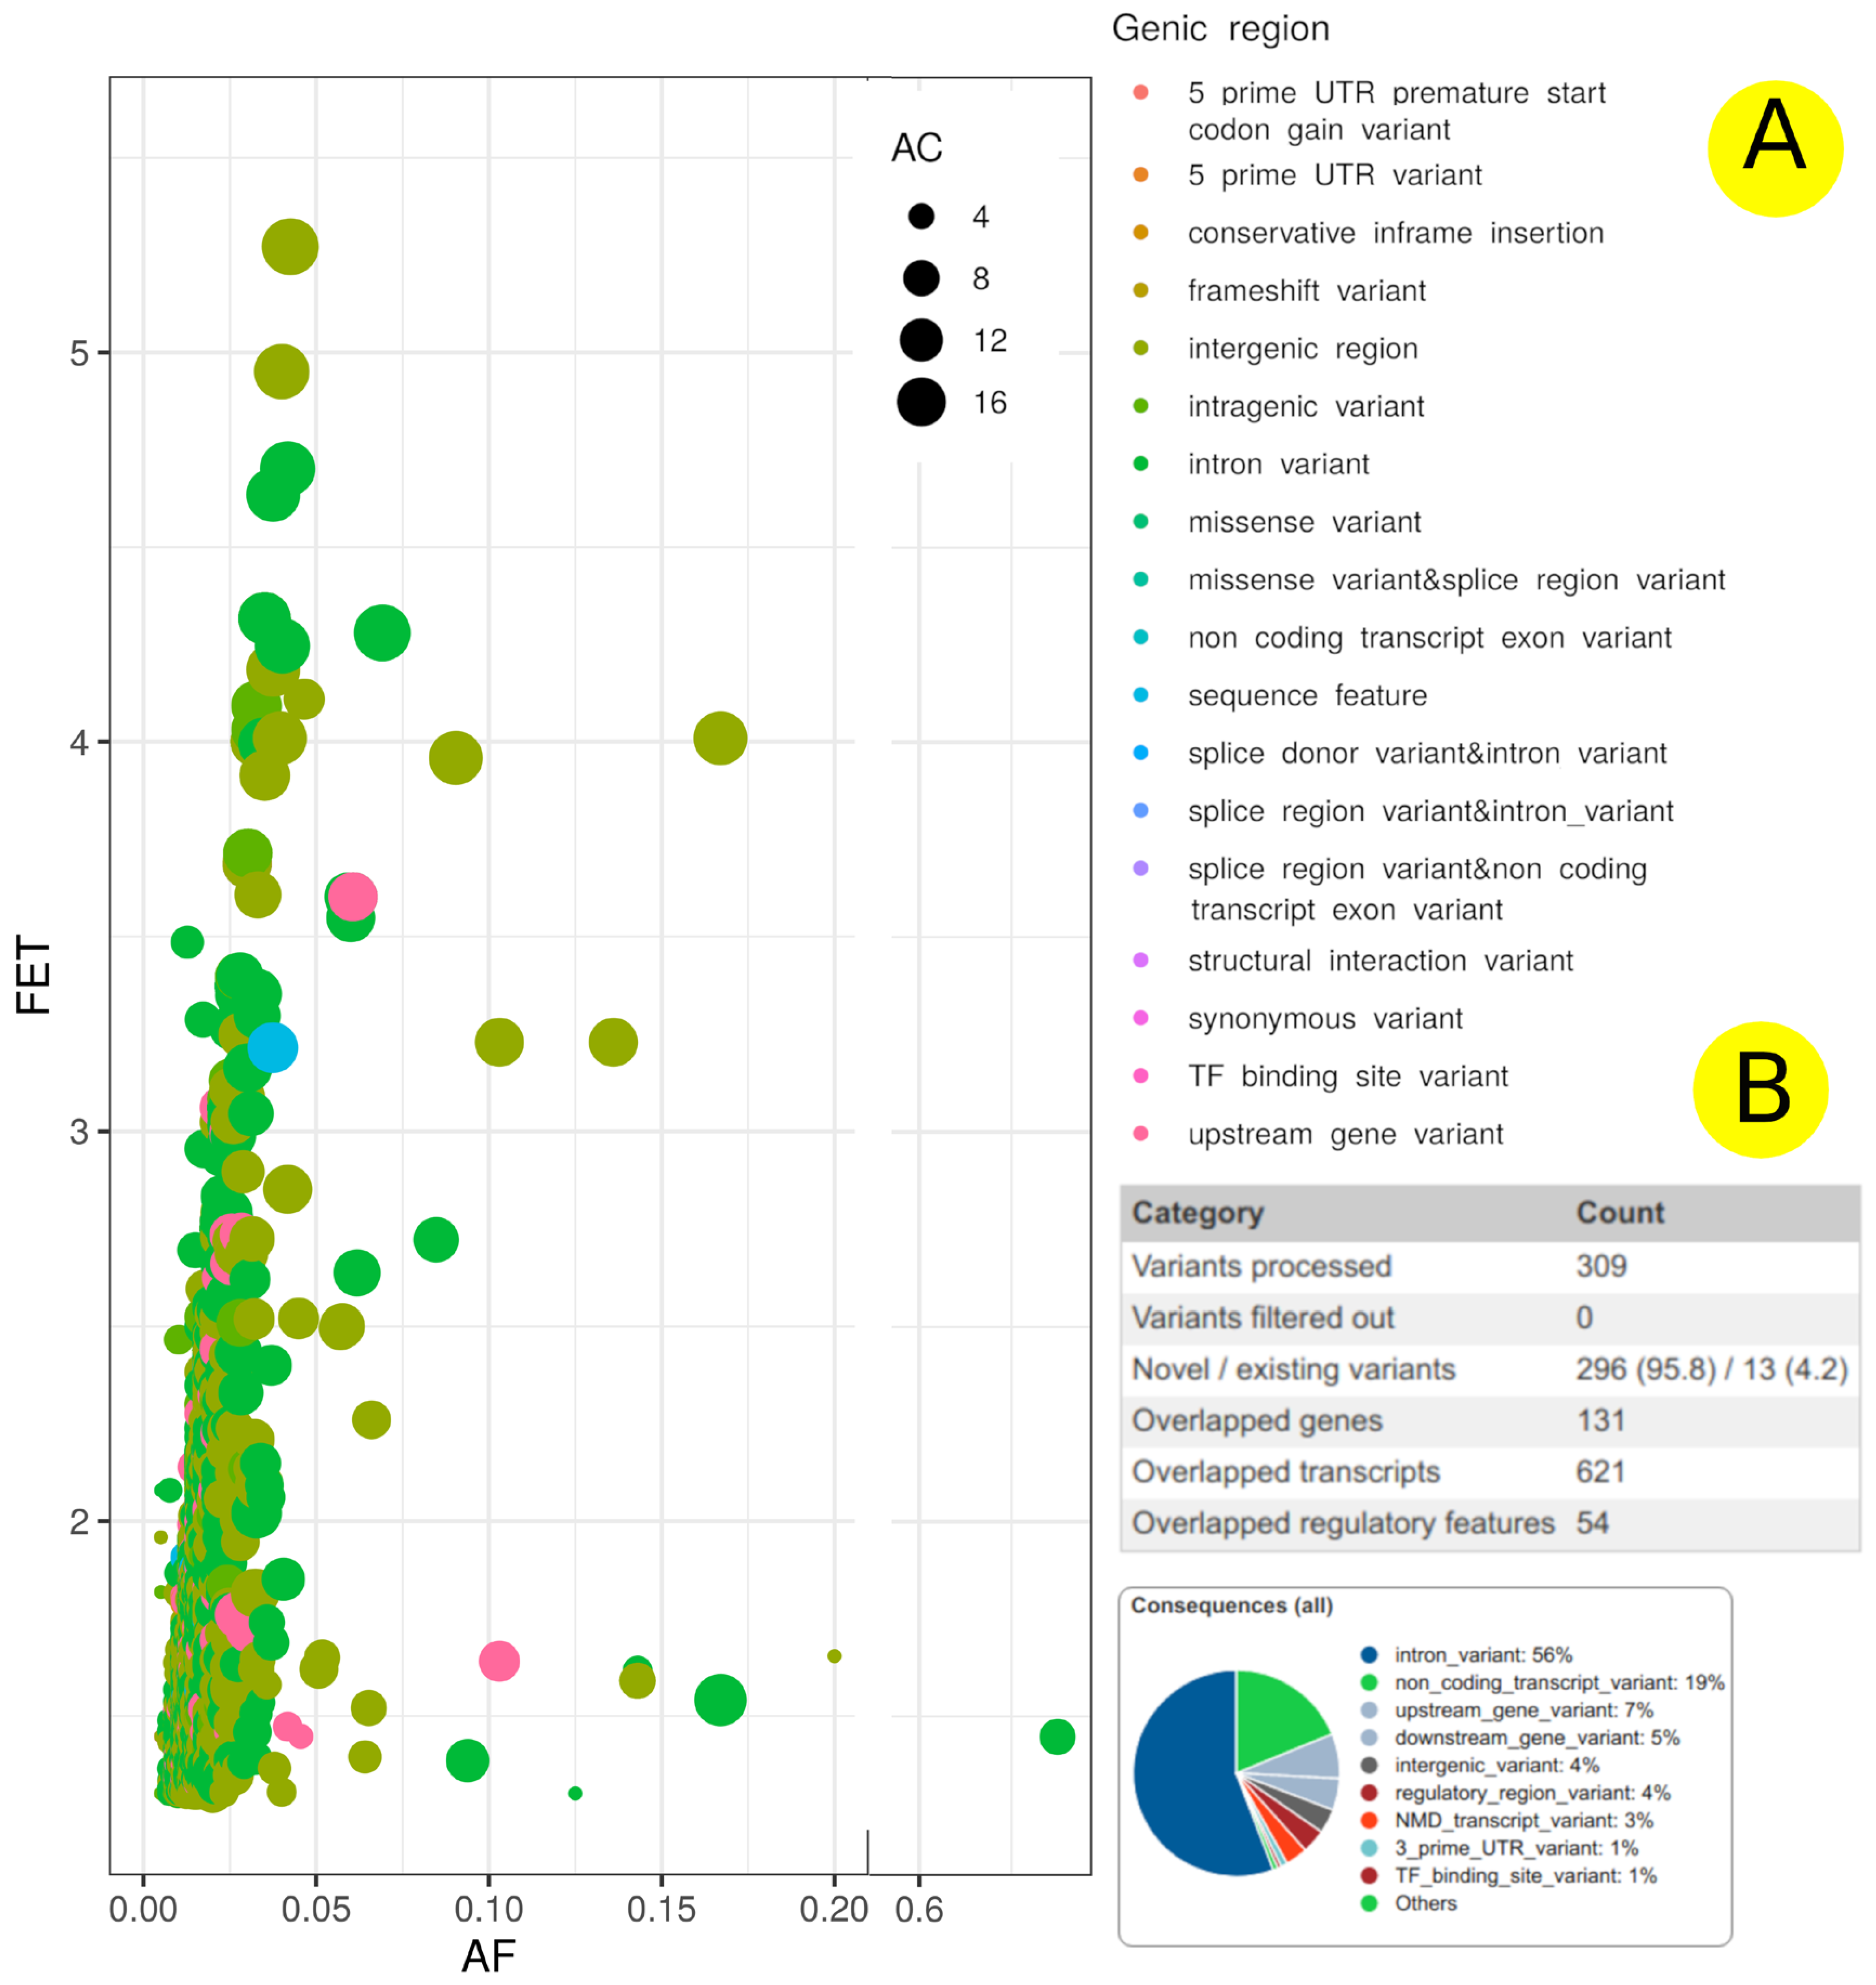
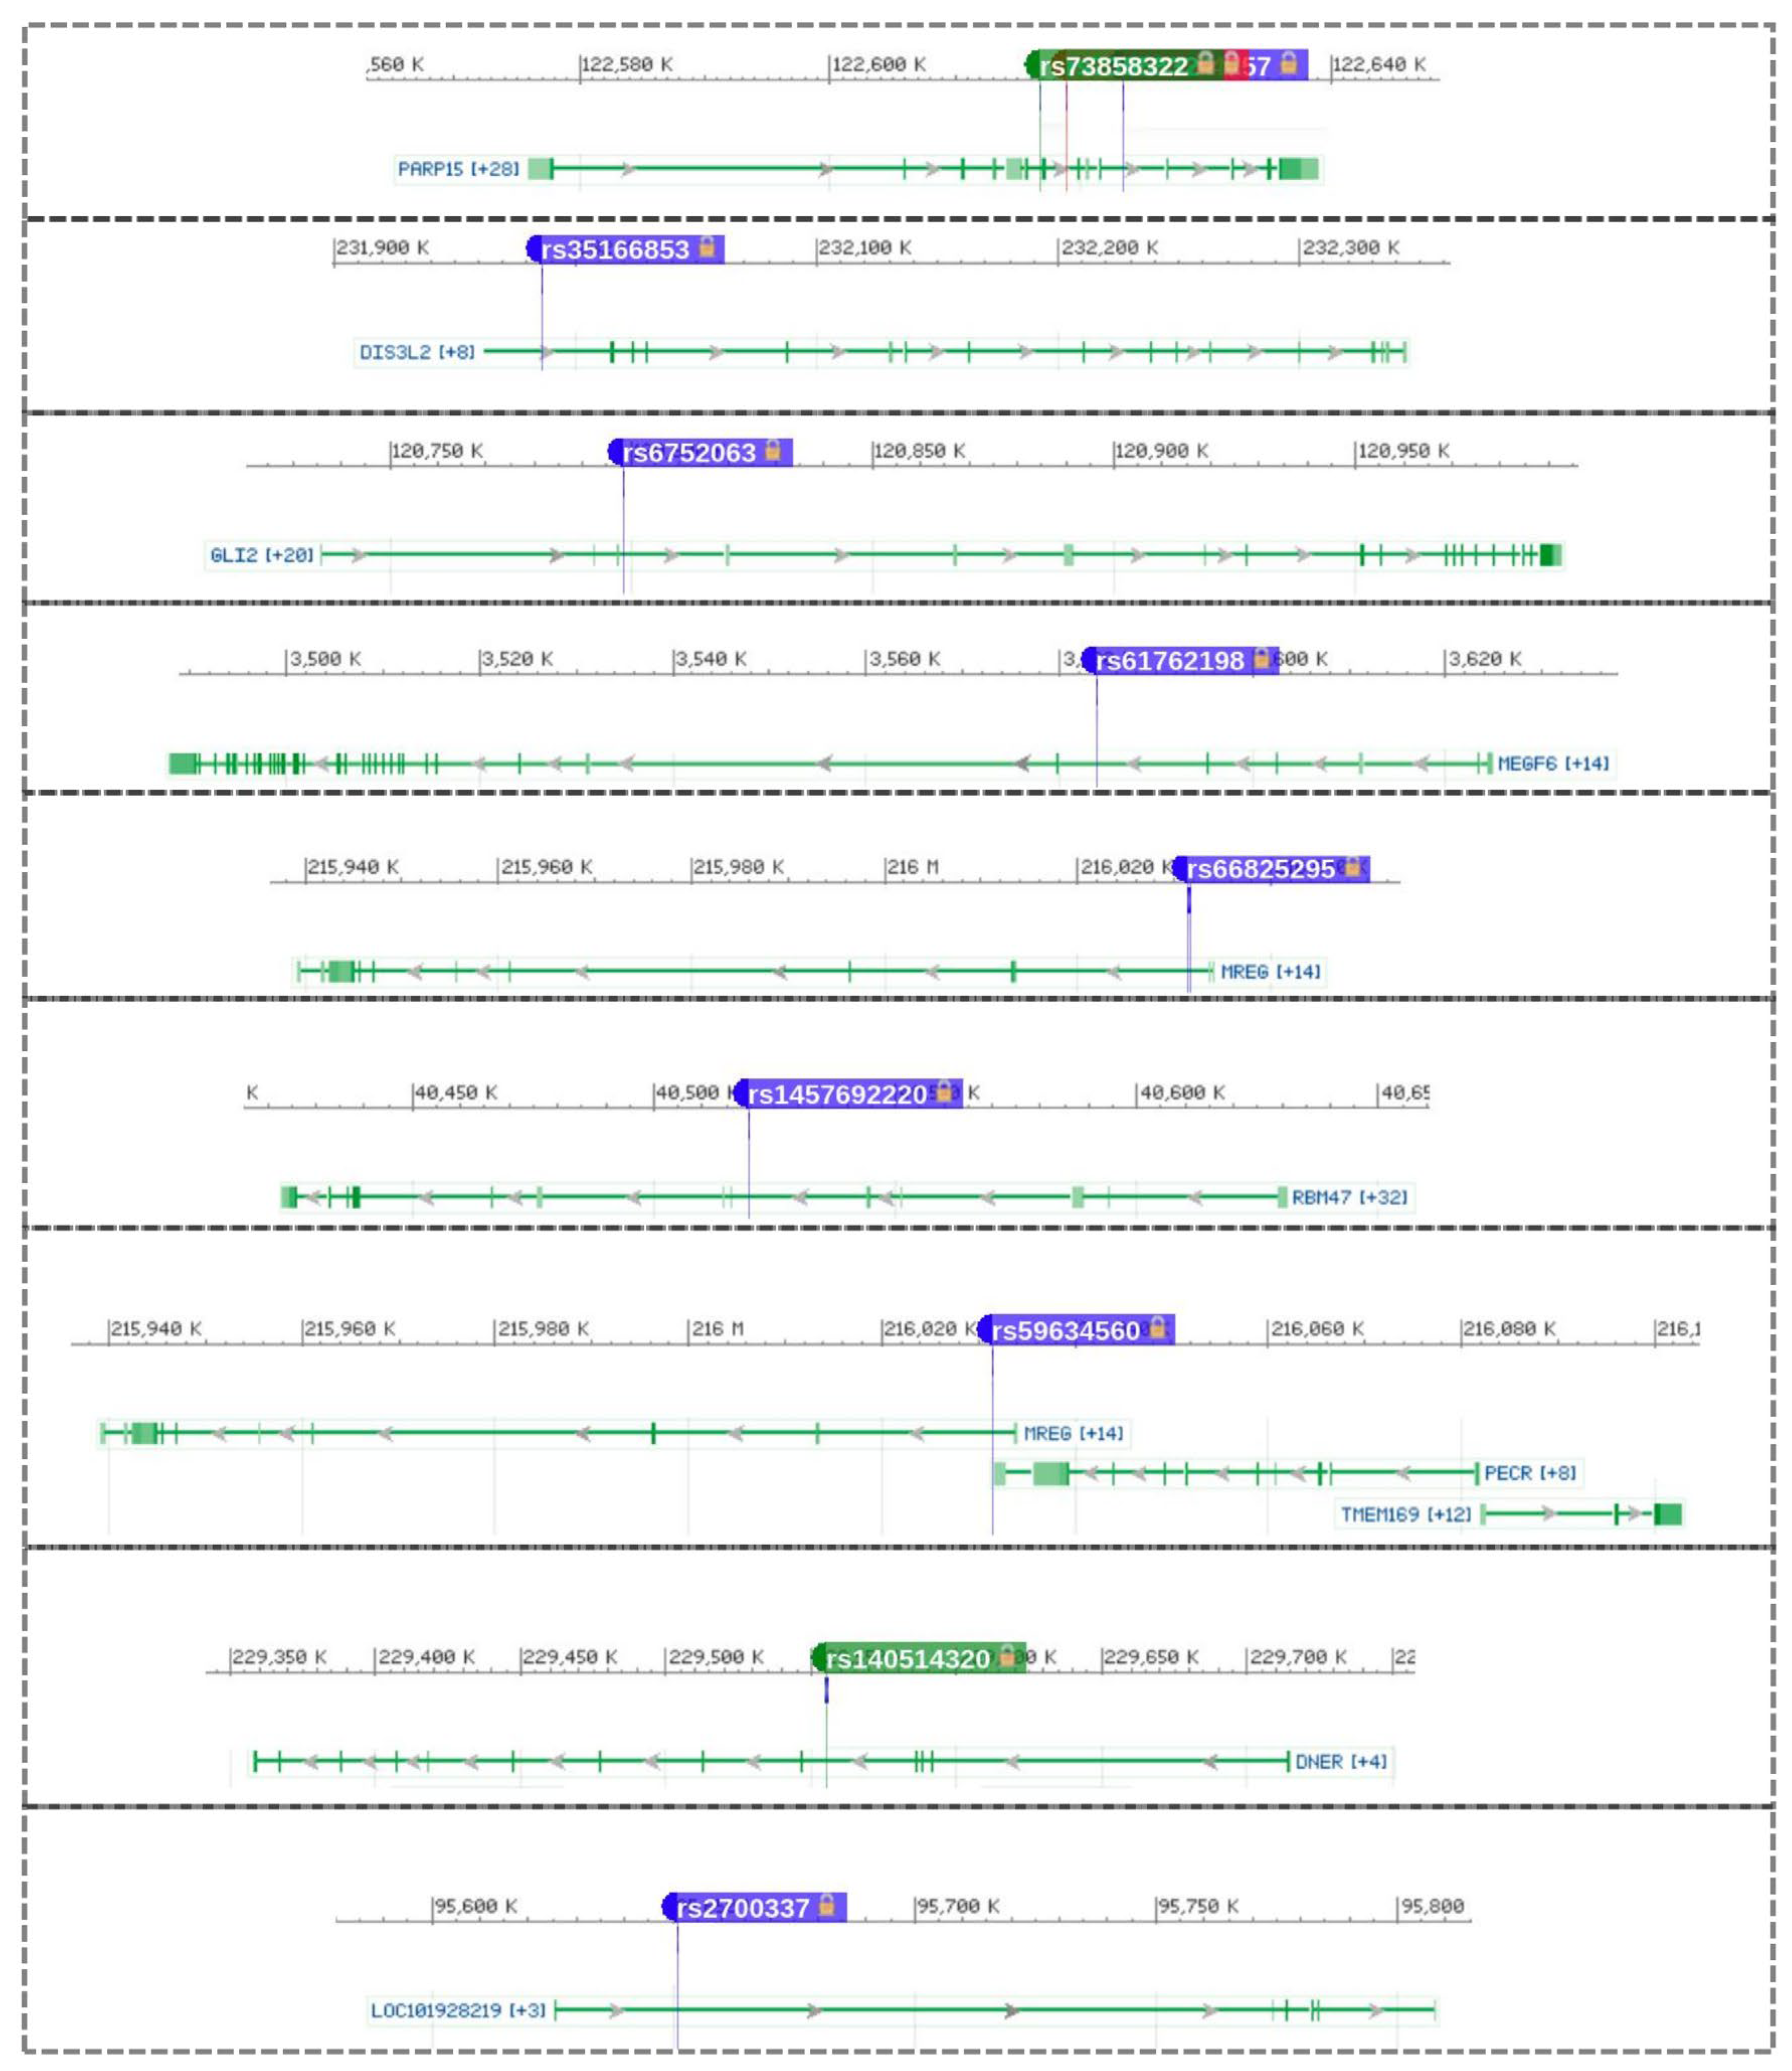
3.2. SNPs Associated with EH in Qatari Population
3.3. Hypertension-Associated Genes’ Recent Status in the Literature
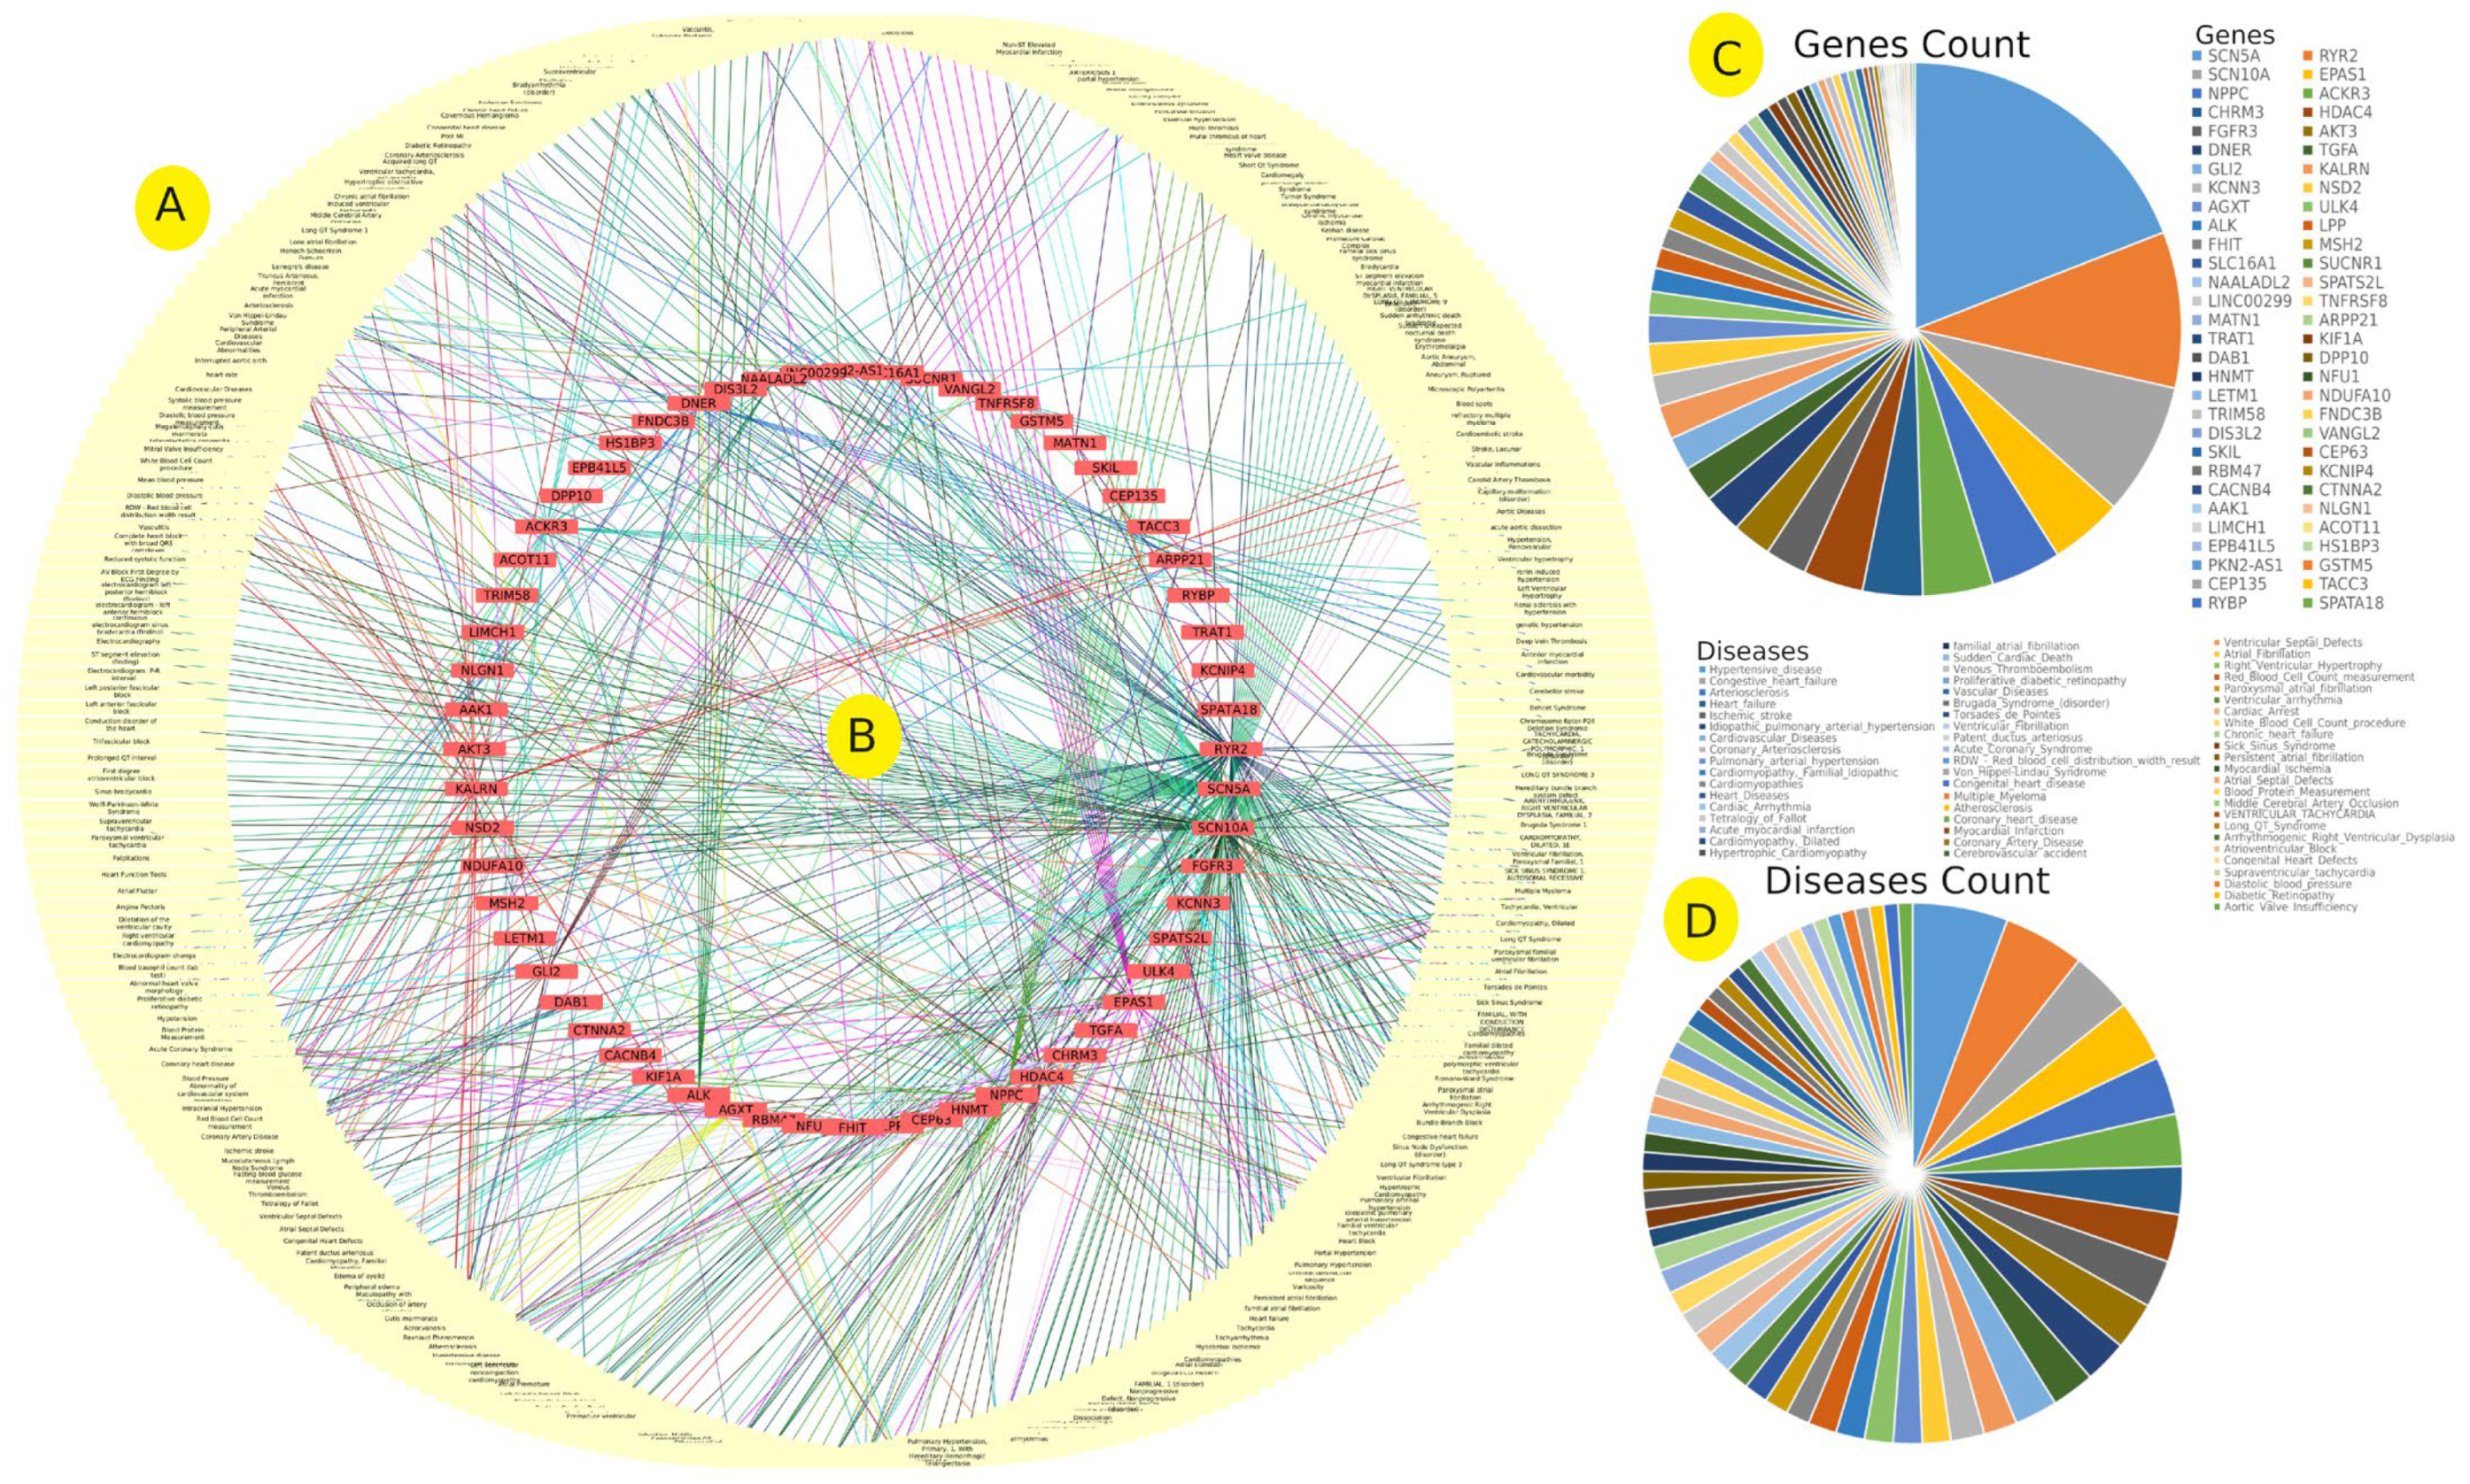
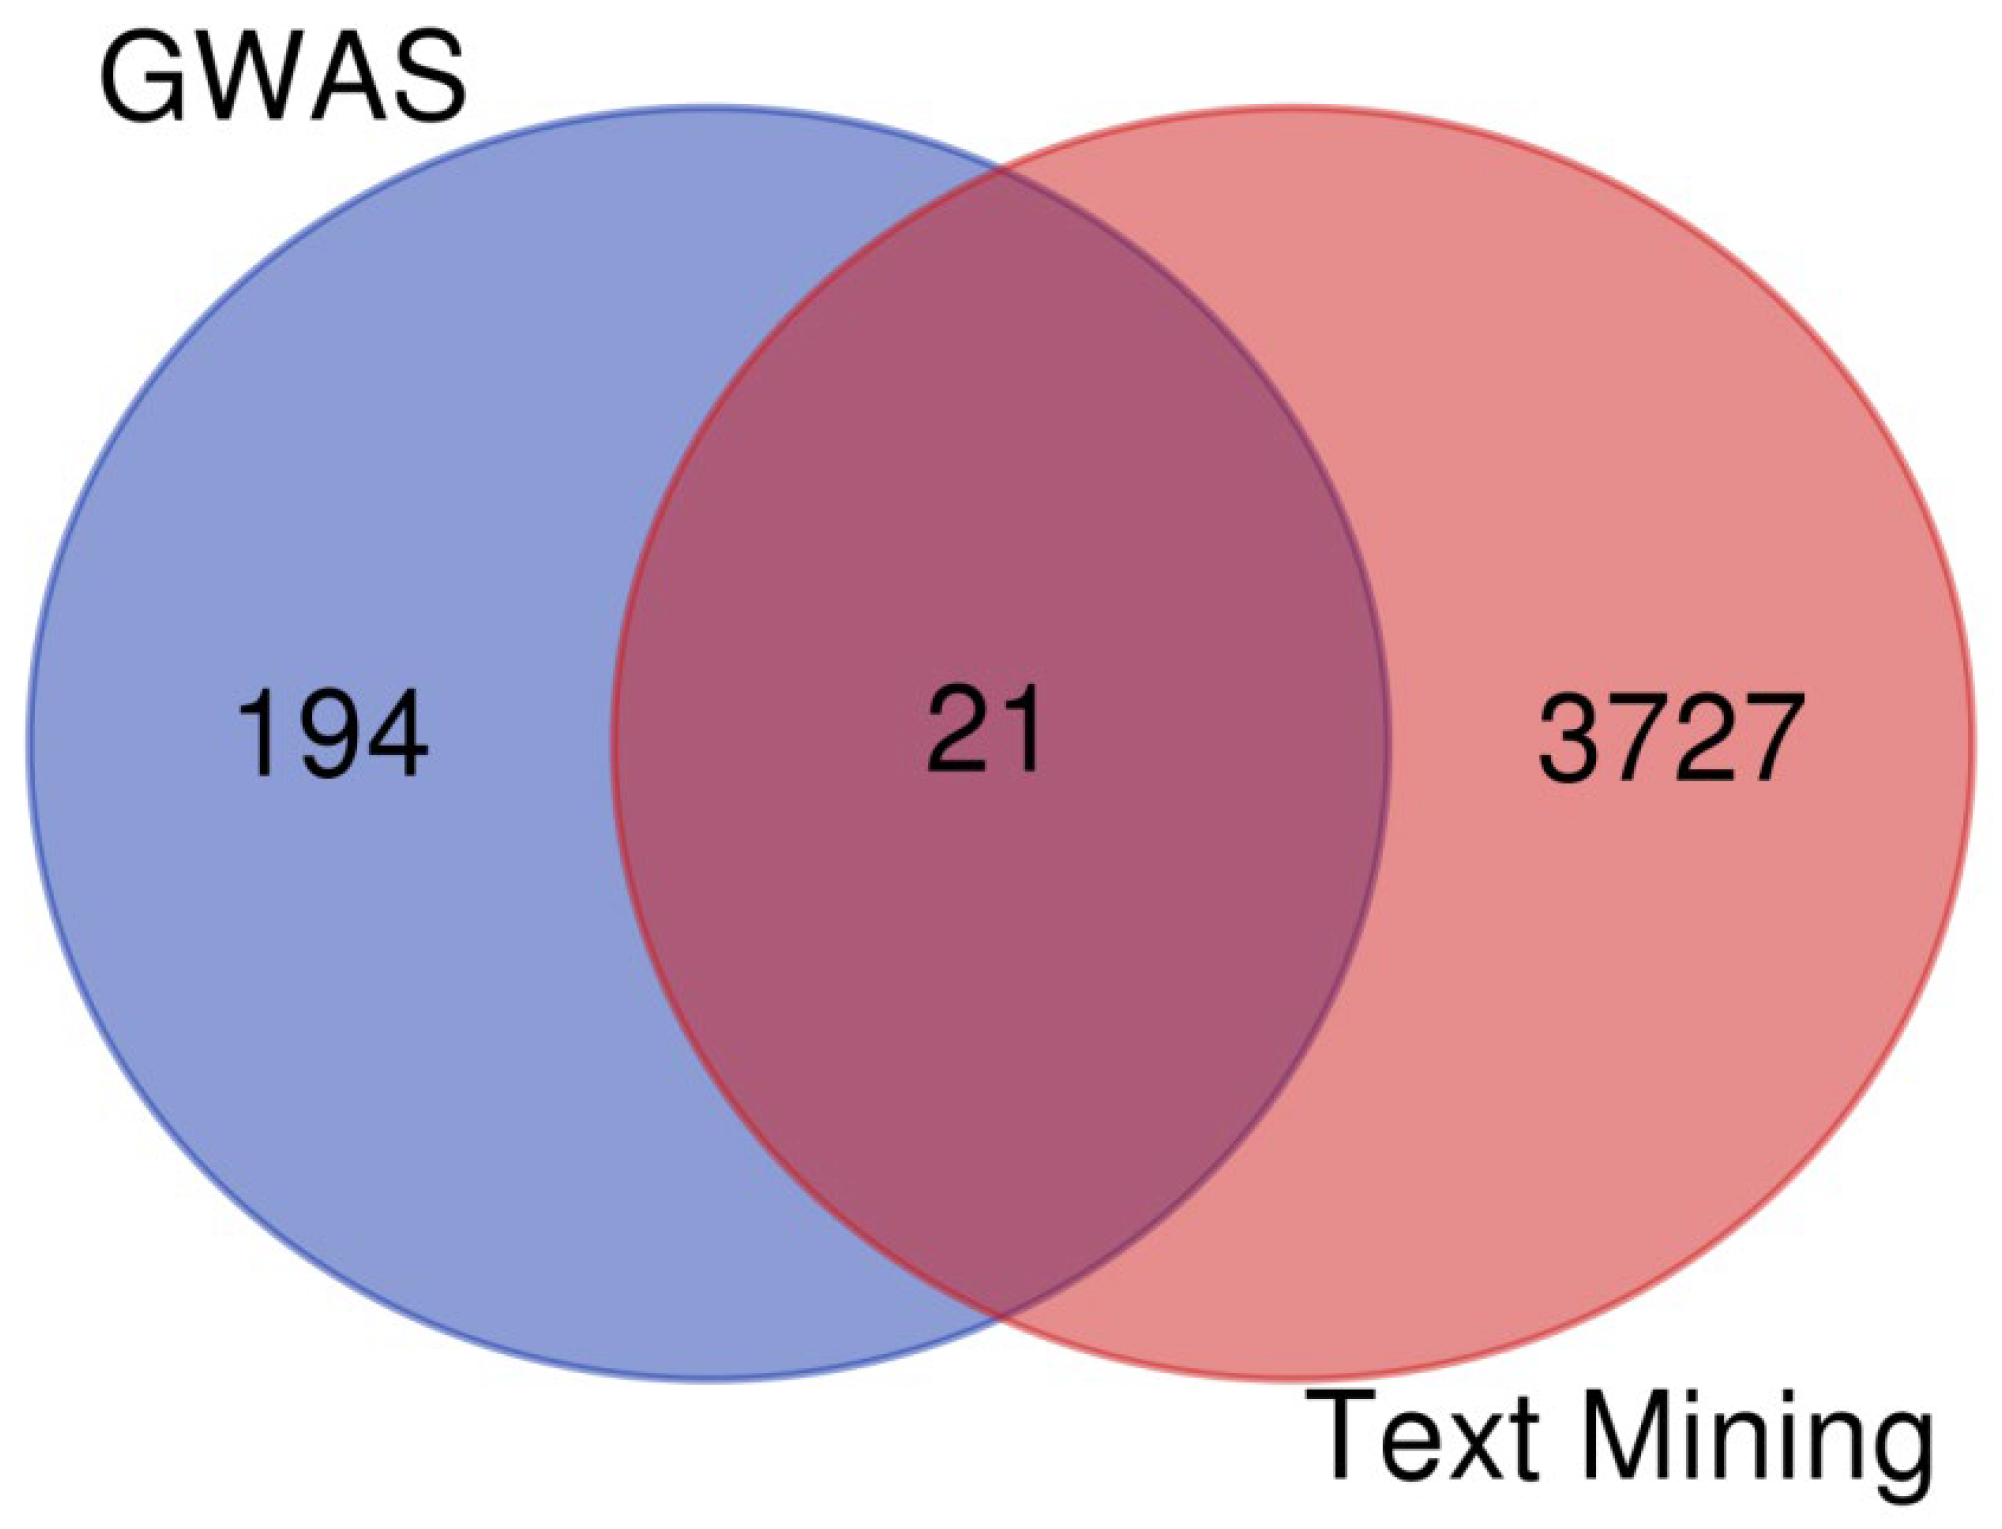
3.4. GWAS and Text Mining Results Comparison
3.5. Allele Frequency of EH-Associated SNPs across Ethnic Groups
4. Discussion
4.1. Genome-Wide Association
Disease–Gene Relationship
4.2. Text Mining in the Hypertension Literature
4.3. Differences and Similarities between the GWAS and Text Mining
4.4. Allele Frequency of EH-Associated SNPs across Ethnic Groups
5. Conclusions
Supplementary Materials
Author Contributions
Funding
Institutional Review Board Statement
Informed Consent Statement
Data Availability Statement
Acknowledgments
Conflicts of Interest
References
- Lim, S.S.; Vos, T.; Flaxman, A.D.; Danaei, G.; Shibuya, K.; Adair-Rohani, H.; AlMazroa, M.A.; Amann, M.; Anderson, H.R.; Andrews, K.G.; et al. A comparative risk assessment of burden of disease and injury attributable to 67 risk factors and risk factor clusters in 21 regions, 1990–2010: A systematic analysis for the Global Burden of Disease Study 2010. Lancet 2012, 380, 2224–2260. [Google Scholar] [CrossRef] [Green Version]
- Staessen, J.A.; Wang, J.; Bianchi, G.; Birkenhger, W.H. Essential hypertension. Lancet 2003, 361, 1629–1641. [Google Scholar] [CrossRef]
- Lawes, C.M.M.; Hoorn, S.V.; Rodgers, A.; International Society of Hypertension. Global burden of blood-pressure-related disease, 2001. Lancet 2008, 371, 1513–1518. [Google Scholar] [CrossRef]
- Forouzanfar, M.H.; Liu, P.; Roth, G.A.; Ng, M.; Biryukov, S.; Marczak, L.; Alexander, L.; Estep, K.; Abate, K.H.; Akinyemiju, T.F.; et al. Global burden of hypertension and systolic blood pressure of at least 110 to 115 mm hg, 1990–2015. JAMA 2017, 317, 165–182. [Google Scholar] [CrossRef] [Green Version]
- Yagil, Y.; Yagil, C. The search for the genetic basis of hypertension. Curr. Opin. Nephrol. Hypertens. 2005, 14, 141–147. [Google Scholar] [CrossRef]
- Chobanian, A.V.; Bakris, G.L.; Black, H.R.; Cushman, W.C.; Green, L.A.; Izzo, J.L., Jr.; Jones, D.W.; Materson, B.J.; Oparil, S.; Wright, J.T., Jr.; et al. Seventh report of the joint national committee on prevention, detection, evaluation, and treatment of high blood pressure. Hypertension 2003, 42, 1206–1252. [Google Scholar] [CrossRef] [Green Version]
- Singh, M.; Singh, A.K.; Pandey, P.; Chandra, S.; Singh, K.A.; Gambhir, I.S. Molecular genetics of essential hypertension. Clin. Exp. Hypertens. 2016, 38, 268–277. [Google Scholar] [CrossRef]
- Niiranen, T.J.; McCabe, E.L.; Larson, M.G.; Henglin, M.; Lakdawala, N.K.; Vasan, R.S.; Cheng, S. Risk for hypertension crosses generations in the community: A multi-generational cohort study. Eur. Heart J. 2017, 38, 2300–2308. [Google Scholar] [CrossRef] [Green Version]
- Luft, F.C. Twins in cardiovascular genetic research. Hypertension 2001, 37, 350–356. [Google Scholar] [CrossRef] [Green Version]
- Naber, C.K.; Siffert, W. Genetics of human arterial hypertension. Minerva Med. 2004, 95, 347–356. [Google Scholar]
- Cowley, A.W. The genetic dissection of essential hypertension. Nat. Rev. Genet. 2006, 7, 829–840. [Google Scholar] [CrossRef]
- Arif, M.; Sadayappan, S.; Becker, R.C.; Martin, L.J.; Urbina, E.M. Epigenetic modification: A regulatory mechanism in essential hypertension. Hypertens. Res. 2019, 42, 1099–1113. [Google Scholar] [CrossRef]
- Ueda, K.; Nishimoto, M.; Hirohama, D.; Ayuzawa, N.; Kawarazaki, W.; Watanabe, A.; Shimosawa, T.; Loffing, J.; Zhang, M.-Z.; Marumo, T.; et al. Renal dysfunction induced by kidney-specific gene deletion of hsd11b2 as a primary cause of salt-dependent hypertension. Hypertension 2017, 70, 111–118. [Google Scholar] [CrossRef] [Green Version]
- Sogawa, Y.; Nagasu, H.; Itano, S.; Kidokoro, K.; Taniguchi, S.; Takahashi, M.; Kadoya, H.; Satoh, M.; Sasaki, T.; Kashihara, N. The eNOS-NO pathway attenuates kidney dysfunction via suppression of inflammasome activation in aldosterone-induced renal injury model mice. PLoS ONE 2018, 13, e0203823. [Google Scholar] [CrossRef] [Green Version]
- Woo, Y.H.; Li, W.-H. DNA replication timing and selection shape the landscape of nucleotide variation in cancer genomes. Nat. Commun. 2012, 3, 1004. [Google Scholar] [CrossRef] [Green Version]
- Doris, P.A. Hypertension genetics, single nucleotide polymorphisms, and the common disease: Common variant hypothesis. Hypertension 2002, 39, 323–331. [Google Scholar] [CrossRef]
- Bodily, P.M.; Fujimoto, M.S.; Page, J.T.; Clement, M.J.; Ebbert, M.T.W.; Ridge, P.G. A novel approach for multi-SNP GWAS and its application in Alzheimer’s disease. BMC Bioinform. 2016, 17, 455–463. [Google Scholar] [CrossRef] [Green Version]
- Padmanabhan, S.; Joe, B. Towards precision medicine for hypertension: A review of genomic, epigenomic, and microbiomic effects on blood pressure in experimental rat models and humans. Physiol. Rev. 2017, 97, 1469–1528. [Google Scholar] [CrossRef]
- Giri, A.; Hellwege, J.N.; Keaton, J.M.; Park, J.; Qiu, C.; Warren, H.R.; Torstenson, E.S.; Kovesdy, C.P.; Sun, Y.V.; Wilson, O.D.; et al. Trans-ethnic association study of blood pressure determinants in over 750,000 individuals. Nat. Genet. 2019, 51, 51–62. [Google Scholar] [CrossRef] [Green Version]
- Flister, M.J.; Tsaih, S.-W.; O’Meara, C.C.; Endres, B.; Hoffman, M.J.; Geurts, A.M.; Dwinell, M.R.; Lazar, J.; Jacob, H.J.; Moreno, C. Identifying multiple causative genes at a single GWAS locus. Genome Res. 2013, 23, 1996–2002. [Google Scholar] [CrossRef] [Green Version]
- Fowdar, J.Y.; Grealy, R.; Lu, Y.; Griffiths, L.R. A genome-wide association study of essential hypertension in an Australian population using a DNA pooling approach. Mol. Genet. Genom. 2017, 292, 307–324. [Google Scholar] [CrossRef] [Green Version]
- Davies, R. The creation of new knowledge by information retrieval and classification. J. Doc. 1989, 45, 273–301. [Google Scholar] [CrossRef]
- Bhardwaj, P.; Khosla, P. Review of text mining techniques. IITM J. Manag. IT 2017, 8, 27–31. [Google Scholar]
- Luque, C.; Luna, J.M.; Luque, M.; Ventura, S. An advanced review on text mining in medicine. WIREs Data Min. Knowl. Discov. 2019, 9, e1302. [Google Scholar] [CrossRef]
- Alsamman, A.M.; Habib, P.T. GeneSyno: Simple tool to extract gene sequence from the human genome despite synonymous gene terms. Highlights Biosci. 2019, 2. [Google Scholar] [CrossRef]
- Baker, S.; Ali, I.; Silins, I.; Pyysalo, S.; Guo, Y.; Högberg, J.; Stenius, U.; Korhonen, A. Cancer Hallmarks Analytics Tool (CHAT): A text mining approach to organize and evaluate scientific literature on cancer. Bioinformatics 2017, 33, 3973–3981. [Google Scholar] [CrossRef]
- Hansson, L.K.; Hansen, R.B.; Pletscher-Frankild, S.; Berzins, R.; Hansen, D.H.; Madsen, D.; Christensen, S.B.; Christiansen, M.R.; Boulund, U.; Wolf, X.A.; et al. Semantic text mining in early drug discovery for type 2 diabetes. PLoS ONE 2020, 15, e0233956. [Google Scholar] [CrossRef]
- Nam, H.J.; Ryu, S. Text-Mining Analyses of News Articles on Schizophrenia. Korean J. Schizophr. Res. 2020, 23, 58–64. [Google Scholar] [CrossRef]
- Rodzuan, N.A.S.; Kasim, S.; Sithambranathan, M.; Hassan, M.Z. Classification of biomedical literature in hypertension and diabetes. Int. J. Data Sci. 2020, 1, 114–119. [Google Scholar] [CrossRef]
- Al Kuwari, H.; Al Thani, A.; Al Marri, A.; Al Kaabi, A.; Abderrahim, H.; Afifi, N.; Qafoud, F.; Chan, Q.; Tzoulaki, I.; Downey, P.; et al. The Qatar Biobank: Background and methods. BMC Public Health 2015, 15, 1–9. [Google Scholar] [CrossRef] [Green Version]
- Zayed, H. The Arab genome: Health and wealth. Gene 2016, 592, 239–243. [Google Scholar] [CrossRef]
- Zhang, Z. Multiple imputation with multivariate imputation by chained equation (MICE) package. Ann. Transl. Med. 2016, 4, 30. [Google Scholar] [CrossRef]
- McKenna, A.; Hanna, M.; Banks, E.; Sivachenko, A.; Cibulskis, K.; Kernytsky, A.; Garimella, K.; Altshuler, D.; Gabriel, S.; Daly, M.; et al. The Genome Analysis Toolkit: A MapReduce framework for analyzing next-generation DNA sequencing data. Genome Res. 2010, 20, 1297–1303. [Google Scholar] [CrossRef] [Green Version]
- Cingolani, P.; Platts, A.; Wang, L.L.; Coon, M.; Nguyen, T.; Wang, L.; Land, S.J.; Lu, X.; Ruden, D.M. A program for annotating and predicting the effects of single nucleotide polymorphisms, SnpEff: SNPs in the genome of Drosophila melanogaster strain w1118; iso-2; iso-3. Fly 2012, 6, 80–92. [Google Scholar] [CrossRef] [Green Version]
- Fisher, R.A. On the interpretation of χ2 from contingency tables, and the calculation of P. J. R. Stat. Soc. 1922, 85, 87–94. [Google Scholar] [CrossRef]
- Ge, S.X.; Jung, D.; Yao, R. ShinyGO: A graphical gene-set enrichment tool for animals and plants. Bioinformatics 2020, 36, 2628–2629. [Google Scholar] [CrossRef]
- UniProt Consortium. UniProt: A hub for protein information. Nucleic Acids Res. 2015, 43, D204–D212. [Google Scholar] [CrossRef]
- Ullah, A.Z.D.; Oscanoa, J.; Wang, J.; Nagano, A.; Lemoine, N.R.; Chelala, C. SNPnexus: Assessing the functional relevance of genetic variation to facilitate the promise of precision medicine. Nucleic Acids Res. 2018, 46, W109–W113. [Google Scholar] [CrossRef] [Green Version]
- von Mering, C.; Huynen, M.; Jaeggi, D.; Schmidt, S.; Bork, P.; Snel, B. STRING: A database of predicted functional associations between proteins. Nucleic Acids Res. 2003, 31, 258–261. [Google Scholar] [CrossRef]
- Krzywinski, M.; Schein, J.; Birol, I.; Connors, J.; Gascoyne, R.; Horsman, D.; Jones, S.J.; Marra, M.A. Circos: An information aesthetic for comparative genomics. Genome Res. 2009, 19, 1639–1645. [Google Scholar] [CrossRef] [Green Version]
- Wickham, H. ggplot2. WIREs Comput. Stat. 2011, 3, 180–185. [Google Scholar] [CrossRef]
- Metsalu, T.; Vilo, J. ClustVis: A web tool for visualizing clustering of multivariate data using Principal Component Analysis and heatmap. Nucleic Acids Res. 2015, 43, W566–W570. [Google Scholar] [CrossRef]
- Piñero, J.; Ramírez-Anguita, J.M.; Saüch-Pitarch, J.; Ronzano, F.; Centeno, E.; Sanz, F.; Furlong, L.I. The DisGeNET knowledge platform for disease genomics: 2019 update. Nucleic Acids Res. 2020, 48, D845–D855. [Google Scholar] [CrossRef] [Green Version]
- Wang, J.; Wu, Y.; Li, Y.; Wang, Y.; Shen, F.; Zhou, J.; Chen, Y. Guanosine monophosphate synthase upregulation mediates cervical cancer progression by inhibiting the apoptosis of cervical cancer cells via the Stat3/P53 pathway. Int. J. Oncol. 2021, 58, 3. [Google Scholar] [CrossRef]
- Ying, W.; Zhao, D.; Ouyang, P.; Subramanya, V.; Vaidya, D.; Ndumele, C.E.; Guallar, E.; Sharma, K.; Shah, S.J.; Kass, D.A.; et al. Associations between the cyclic guanosine monophosphate pathway and cardiovascular risk factors: MESA. J. Am. Heart Assoc. 2019, 8, e013149. [Google Scholar] [CrossRef]
- Muraki, Y.; Naito, T.; Tohyama, K.; Shibata, S.; Kuniyeda, K.; Nio, Y.; Hazama, M.; Matsuo, T. Improvement of pulmonary arterial hypertension, inflammatory response, and epithelium injury by dual activation of cAMP/cGMP pathway in a rat model of monocrotaline-induced pulmonary hypertension. Biosci. Biotechnol. Biochem. 2019, 83, 1000–1010. [Google Scholar] [CrossRef]
- Cheng, G.; He, L.; Zhang, Y. LincRNA-Cox2 promotes pulmonary arterial hypertension by regulating the let-7a-mediated STAT3 signaling pathway. Mol. Cell. Biochem. 2020, 475, 239–247. [Google Scholar] [CrossRef]
- Lv, H.; Tong, J.; Yang, J.; Lv, S.; Li, W.-P.; Zhang, C.; Chen, Z.-J. Dysregulated pseudogene HK2P1 may contribute to preeclampsia as a competing endogenous RNA for hexokinase 2 by impairing decidualization. Hypertension 2018, 71, 648–658. [Google Scholar] [CrossRef]
- Nojima, H.; Sokabe, H. Genes and pseudogenes for calmodulin in the spontaneously hypertensive rat. J. Hypertens. 1988, 6, S231–S233. [Google Scholar] [CrossRef]
- Qi, Y.; Wang, X.; Li, W.; Chen, D.; Meng, H.; An, S. Pseudogenes in cardiovascular disease. Front. Mol. Biosci. 2021, 7, 622540. [Google Scholar] [CrossRef]
- Radine, C.; Peters, D.; Reese, A.; Neuwahl, J.; Budach, W.; Jänicke, R.U.; Sohn, D. The RNA-binding protein RBM47 is a novel regulator of cell fate decisions by transcriptionally controlling the p53-p21-axis. Cell Death Differ. 2020, 27, 1274–1285. [Google Scholar] [CrossRef]
- Russo, A.; Di Gaetano, C.; Cugliari, G.; Matullo, G. Advances in the genetics of hypertension: The effect of rare variants. Int. J. Mol. Sci. 2018, 19, 688. [Google Scholar] [CrossRef] [Green Version]
- Ji, L.-D.; Tang, N.L.S.; Xu, Z.-F.; Xu, J. Genes regulate blood pressure, but “environments” cause hypertension. Front. Genet. 2020, 11, 580443. [Google Scholar] [CrossRef]
- Surendran, P.; Drenos, F.; Young, R.; Warren, H.; Cook, J.P.; Manning, A.K.; Grarup, N.; Sim, X.; Barnes, D.R.; Witkowska, K.; et al. Trans-ancestry meta-analyses identify rare and common variants associated with blood pressure and hypertension. Nat. Genet. 2016, 48, 1151–1161. [Google Scholar] [CrossRef]
- Overcash, R.F.; Chappell, V.A.; Green, T.; Geyer, C.B.; Asch, A.S.; Ruiz-Echevarría, M.J. Androgen signaling promotes translation of TMEFF2 in prostate cancer cells via phosphorylation of the α subunit of the translation initiation factor 2. PLoS ONE 2013, 8, e55257. [Google Scholar] [CrossRef] [Green Version]
- Kumarasamy, S.; Gopalakrishnan, K.; Toland, E.J.; Yerga-Woolwine, S.; Farms, P.; Morgan, E.E.; Joe, B. Refined mapping of blood pressure quantitative trait loci using congenic strains developed from two genetically hypertensive rat models. Hypertens. Res. 2011, 34, 1263–1270. [Google Scholar] [CrossRef] [Green Version]
- Himes, B.E.; Jiang, X.; Hu, R.; Wu, A.C.; Lasky-Su, J.A.; Klanderman, B.J.; Ziniti, J.; Senter-Sylvia, J.; Lima, J.J.; Irvin, C.G.; et al. Genome-wide association analysis in asthma subjects identifies SPATS2L as a novel bronchodilator response gene. PLoS Genet. 2012, 8, e1002824. [Google Scholar] [CrossRef] [Green Version]
- Min, P.; Li, W.; Zeng, D.; Ma, Y.; Xu, D.; Zheng, W.; Tang, F.; Chen, J.; Shi, J.; Hu, H.; et al. A single nucleotide variant in microRNA-1269a promotes the occurrence and process of hepatocellular carcinoma by targeting to oncogenes SPATS2L and LRP6. Bull. Cancer 2017, 104, 311–320. [Google Scholar] [CrossRef]
- van Ouwerkerk, A.F.; Bosada, F.M.; van Duijvenboden, K.; Hill, M.C.; Montefiori, L.E.; Scholman, K.T.; Liu, J.; de Vries, A.A.F.; Boukens, B.J.; Ellinor, P.T.; et al. Identification of atrial fibrillation associated genes and functional non-coding variants. Nat. Commun. 2019, 10, 1–14. [Google Scholar] [CrossRef] [Green Version]
- Guo, D.-C.; Grove, M.L.; Prakash, S.K.; Eriksson, P.; Hostetler, E.M.; LeMaire, S.A.; Body, S.C.; Shalhub, S.; Estrera, A.L.; Safi, H.J.; et al. Genetic variants in LRP1 and ULK4 are associated with acute aortic dissections. Am. J. Hum. Genet. 2016, 99, 762–769. [Google Scholar] [CrossRef] [Green Version]
- Datta, A.S.; Zhang, Y.; Zhang, L.; Biswas, S. Association of rare haplotypes on ULK4 and MAP4 genes with hypertension. BMC Proc. 2016, 10, 363–369. [Google Scholar] [CrossRef] [Green Version]
- Lang, B.; Pu, J.; Hunter, I.; Liu, M.; Martin-Granados, C.; Reilly, T.J.; Gao, G.-D.; Guan, Z.-L.; Li, W.-D.; Shi, Y.-Y.; et al. Recurrent deletions of ULK4 in schizophrenia: A novel gene crucial for neuritogenesis and neuronal motility. J. Cell Sci. 2013, 127, 630–640. [Google Scholar] [CrossRef] [Green Version]
- Kraja, A.T.; Cook, J.P.; Warren, H.R.; Surendran, P.; Liu, C.; Evangelou, E.; Manning, A.K.; Grarup, N.; Drenos, F.; Sim, X.; et al. New blood pressure—Associated loci identified in meta-analyses of 475,000 individuals. Circ. Cardiovasc. Genet. 2017, 10, e001778. [Google Scholar] [CrossRef] [Green Version]
- Croce, C.M.; Sozzi, G.; Huebner, K. Role of FHIT in human cancer. J. Clin. Oncol. 1999, 17, 1618. [Google Scholar] [CrossRef]
- Prosseda, S.D.; Tian, X.; Kuramoto, K.; Boehm, M.; Sudheendra, D.; Miyagawa, K.; Zhang, F.; Solow-Cordero, D.; Saldivar, J.C.; Austin, E.D.; et al. FHIT, a novel modifier gene in pulmonary arterial hypertension. Am. J. Respir. Crit. Care Med. 2019, 199, 83–98. [Google Scholar] [CrossRef]
- Cox, R.H.; Rusch, N.J. New expression profiles of voltage-gated ion channels in arteries exposed to high blood pressure. Microcirculation 2002, 9, 243–257. [Google Scholar] [CrossRef]
- Glazer, A.M.; Wada, Y.; Li, B.; Muhammad, A.; Kalash, O.R.; O’Neill, M.J.; Shields, T.; Hall, L.; Short, L.; Blair, M.A.; et al. High-throughput reclassification of SCN5A variants. Am. J. Hum. Genet. 2020, 107, 111–123. [Google Scholar] [CrossRef]
- Wilde, A.A.M.; Amin, A.S. Clinical spectrum of SCN5A mutations: Long QT syndrome, brugada syndrome, and cardiomyopathy. JACC Clin. Electrophysiol. 2018, 4, 569–579. [Google Scholar] [CrossRef]
- Li, W.; Yin, L.; Shen, C.; Hu, K.; Ge, J.; Sun, A. SCN5A variants: Association with cardiac disorders. Front. Physiol. 2018, 9, 1372. [Google Scholar] [CrossRef]
- Hamilton, S.; Terentyeva, R.; Martin, B.; Perger, F.; Li, J.; Stepanov, A.; Bonilla, I.M.; Knollmann, B.C.; Radwański, P.B.; Györke, S.; et al. Increased RyR2 activity is exacerbated by calcium leak-induced mitochondrial ROS. Basic Res. Cardiol. 2020, 115, 38. [Google Scholar] [CrossRef]
- Chambers, J.C.; Zhao, J.; Terracciano, C.M.N.; Bezzina, C.R.; Zhang, W.; Kaba, R.; Navaratnarajah, M.; Lotlikar, A.; Sehmi, J.S.; Kooner, M.K.; et al. Genetic variation in SCN10A influences cardiac conduction. Nat. Genet. 2010, 42, 149–152. [Google Scholar] [CrossRef]
- Tanaka, T.; Akiyama, H.; Kanai, H.; Sato, M.; Takeda, S.; Sekiguchi, K.; Yokoyama, T.; Kurabayashi, M. Endothelial PAS domain protein 1 (EPAS1) induces adrenomedullin gene expression in cardiac myocytes: Role of EPAS1 in an inflammatory response in cardiac myocytes. J. Mol. Cell. Cardiol. 2002, 34, 739–748. [Google Scholar] [CrossRef]
- Luque, Y.; Lenoir, O.; Bonnin, P.; Hardy, L.; Chipont, A.; Placier, S.; Vandermeersch, S.; Xu-Dubois, Y.-C.; Robin, B.; Lazareth, H.; et al. Endothelial Epas1 deficiency is sufficient to promote parietal epithelial cell activation and FSGS in experimental hypertension. J. Am. Soc. Nephrol. 2017, 28, 3563–3578. [Google Scholar] [CrossRef] [Green Version]
- Shih, P.B.; O’Connor, D.T. Hereditary determinants of human hypertension: Strategies in the setting of genetic complexity. Hypertension 2008, 51, 1456–1464. [Google Scholar] [CrossRef] [Green Version]
- Prasad, K. Age–rage stress in the pathophysiology of pulmonary hypertension and its treatment. Int. J. Angiol. 2019, 28, 71–79. [Google Scholar] [CrossRef] [Green Version]
- Wald, N.J.; Law, M.R. A strategy to reduce cardiovascular disease by more than 80%. BMJ 2003, 326, 1419. [Google Scholar] [CrossRef] [Green Version]
- Flaten, H.K.; Monte, A.A. The pharmacogenomic and metabolomic predictors of ace inhibitor and angiotensin ii receptor blocker effectiveness and safety. Cardiovasc. Drugs Ther. 2017, 31, 471–482. [Google Scholar] [CrossRef] [Green Version]
- Hasty, A.H.; Linton, M.F.; Brandt, S.J.; Babaev, V.R.; Gleaves, L.A.; Fazio, S. Retroviral gene therapy in ApoE-deficient mice: ApoE expression in the artery wall reduces early foam cell lesion formation. Circulation 1999, 99, 2571–2576. [Google Scholar] [CrossRef] [Green Version]
- Holderfield, M.T.; Hughes, C.C.W. Crosstalk between vascular endothelial growth factor, notch, and transforming growth factor-β in vascular morphogenesis. Circ. Res. 2008, 102, 637–652. [Google Scholar] [CrossRef] [Green Version]
- de Ruijter, A.J.; van Gennip, A.H.; Caron, H.N.; Kemp, S.; van Kuilenburg, A.B. Histone deacetylases (HDACs): Characterization of the classical HDAC family. Biochem. J. 2003, 370, 737–749. [Google Scholar] [CrossRef]
- Backs, J.; Song, K.; Bezprozvannaya, S.; Chang, S.; Olson, E.N. CaM kinase II selectively signals to histone deacetylase 4 during cardiomyocyte hypertrophy. J. Clin. Investig. 2006, 116, 1853–1864. [Google Scholar] [CrossRef]
- Kido, T.; Sikora-Wohlfeld, W.; Kawashima, M.; Kikuchi, S.; Kamatani, N.; Patwardhan, A.; Chen, R.; Sirota, M.; Kodama, K.; Hadley, D.; et al. Are minor alleles more likely to be risk alleles? BMC Med. Genom. 2018, 11, 1–11. [Google Scholar] [CrossRef]
- Dzudie, A.; Rayner, B.; Ojji, D.; Schutte, A.E.; Twagirumukiza, M.; Damasceno, A.; Ba, S.A.; Kane, A.; Kramoh, E.; Kacou, J.B.A.; et al. Roadmap to achieve 25% hypertension control in Africa by 2025. Glob. Heart 2018, 13, 45–59. [Google Scholar] [CrossRef] [Green Version]
- Hong, K.-W.; Lim, J.-E.; Oh, B. A regulatory SNP in AKAP13 is associated with blood pressure in Koreans. J. Hum. Genet. 2011, 56, 205–210. [Google Scholar] [CrossRef] [Green Version]
- de las Fuentes, L.; Sung, Y.J.; Schwander, K.L.; Kalathiveetil, S.; Hunt, S.C.; Arnett, D.K.; Rao, D.C. The role of SNP-loop diuretic interactions in hypertension across ethnic groups in HyperGEN. Front. Genet. 2013, 4, 304. [Google Scholar] [CrossRef] [Green Version]


| SNP ID | Chr | Position | Ref | Alt | Gene | AC | FET Logpval |
|---|---|---|---|---|---|---|---|
| rs921932379 | 3 | 155674348 | T | TA | GMPS-SETP14 | 17 | 5.27 |
| rs113688672 | 2 | 129289164 | C | T | ISCA1P6-AC012451.1 | 16 | 4.95 |
| rs_new-95 | 4 | 40521676 | CTTTTTTTTTTTTT | C | RBM47 | 16 | 4.7 |
| rs35166853 | 2 | 232850730 | C | T | DIS3L2 | 15 | 4.63 |
| rs11591086 | 1 | 30925979 | G | A | RP4-591L5.2-MATN1 | 14 | 4.32 |
| rs11893181 | 2 | 18313644 | G | A | KCNS3 | 14 | 4.32 |
| rs1491266756 | 2 | 52292323 | TTA | T | AC007682.1 | 14 | 4.32 |
| rs17199733 | 2 | 232824585 | G | A | DIS3L2 | 14 | 4.32 |
| rs34189801 | 2 | 232808692 | G | A | NPPC-DIS3L2 | 14 | 4.32 |
| rs34553499 | 2 | 232820162 | C | T | NPPC-DIS3L2 | 14 | 4.32 |
| rs60554757 | 3 | 122342303 | G | A | PARP15 | 14 | 4.32 |
| rs652625 | 1 | 12225351 | T | A | TNFRSF1B | 14 | 4.32 |
| rs66825295 | 2 | 216896216 | GAGAA | G | MREG | 14 | 4.32 |
| rs6752063 | 2 | 121556047 | G | A | GLI2 | 14 | 4.32 |
| rs73858324 | 3 | 122337678 | G | A | PARP15 | 14 | 4.32 |
| rs61762198 | 1 | 3500434 | G | GCAGCCACCAGACAACGCA | MEGF6 | 17 | 4.28 |
| rs1217727360 | 2 | 230419573 | A | AAAGAG | DNER | 16 | 4.25 |
| rs369201055 | 2 | 138779802 | A | AAC | HNMT-AC069394.1 | 15 | 4.19 |
| rs_new-56 | 2 | 193355414 | A | ACAGGGCTGCAGGAAAAAGGGAATGCCTATAGAC | TMEFF2-AC013401.1 | 8 | 4.11 |
| rs1345206935 | 3 | 18848380 | G | GTTTTTTTTTTTTTTTTTTTTTTTTTT | AC144521.1 | 13 | 4.09 |
| rs57679512 | 3 | 61057088 | GA | G | FHIT | 13 | 4.03 |
| rs7646137 | 3 | 162408311 | T | A | RP13-526J3.1-RP11-10O22.1 | 15 | 4.01 |
| rs770631619 | 1 | 72759661 | C | CTTTTTTTTTTTTT | NEGR1-RPL31P12 | 15 | 4.01 |
| rs10931882 | 2 | 200917613 | T | C | C2orf47-SPATS2L | 13 | 4 |
| rs10931883 | 2 | 200917675 | T | C | C2orf47-SPATS2L | 13 | 4 |
| rs11291368 | 3 | 172047831 | AG | A | FNDC3B | 13 | 4 |
| rs11897782 | 2 | 200916495 | G | A | C2orf47-SPATS2L | 13 | 4 |
| rs11903185 | 2 | 200916506 | T | C | C2orf47-SPATS2L | 13 | 4 |
| rs12032899 | 1 | 3999592 | G | C | RP13-614K11.1 | 13 | 4 |
| rs12464998 | 2 | 200893820 | T | C | C2orf47-SPATS2L | 13 | 4 |
| rs12470336 | 2 | 201000860 | A | T | C2orf47-SPATS2L | 13 | 4 |
| rs2700337 | 1 | 96116213 | A | G | RP11-286B14.1 | 13 | 4 |
| rs4673652 | 2 | 200903578 | C | T | C2orf47-SPATS2L | 13 | 4 |
| rs73141887 | 2 | 8590888 | T | G | LINC00299-AC011747.3 | 13 | 4 |
| rs73858322 | 3 | 122335609 | T | A | PARP15 | 13 | 4 |
| rs7608345 | 2 | 8590943 | G | A | LINC00299-AC011747.3 | 13 | 4 |
| rs77321003 | 2 | 201005171 | C | A | C2orf47-SPATS2L | 13 | 4 |
| rs79953652 | 2 | 200913138 | T | C | C2orf47-SPATS2L | 13 | 4 |
Publisher’s Note: MDPI stays neutral with regard to jurisdictional claims in published maps and institutional affiliations. |
© 2022 by the authors. Licensee MDPI, Basel, Switzerland. This article is an open access article distributed under the terms and conditions of the Creative Commons Attribution (CC BY) license (https://creativecommons.org/licenses/by/4.0/).
Share and Cite
Alsamman, A.M.; Almabrazi, H.; Zayed, H. Whole-Genome Sequencing of 100 Genomes Identifies a Distinctive Genetic Susceptibility Profile of Qatari Patients with Hypertension. J. Pers. Med. 2022, 12, 722. https://doi.org/10.3390/jpm12050722
Alsamman AM, Almabrazi H, Zayed H. Whole-Genome Sequencing of 100 Genomes Identifies a Distinctive Genetic Susceptibility Profile of Qatari Patients with Hypertension. Journal of Personalized Medicine. 2022; 12(5):722. https://doi.org/10.3390/jpm12050722
Chicago/Turabian StyleAlsamman, Alsamman M., Hakeem Almabrazi, and Hatem Zayed. 2022. "Whole-Genome Sequencing of 100 Genomes Identifies a Distinctive Genetic Susceptibility Profile of Qatari Patients with Hypertension" Journal of Personalized Medicine 12, no. 5: 722. https://doi.org/10.3390/jpm12050722