
Biomarkers Predictive of Metabolic Syndrome and Cardiovascular Disease in Childhood Cancer Survivors

 , , ,
, , , 
Abstract
:1. Introduction
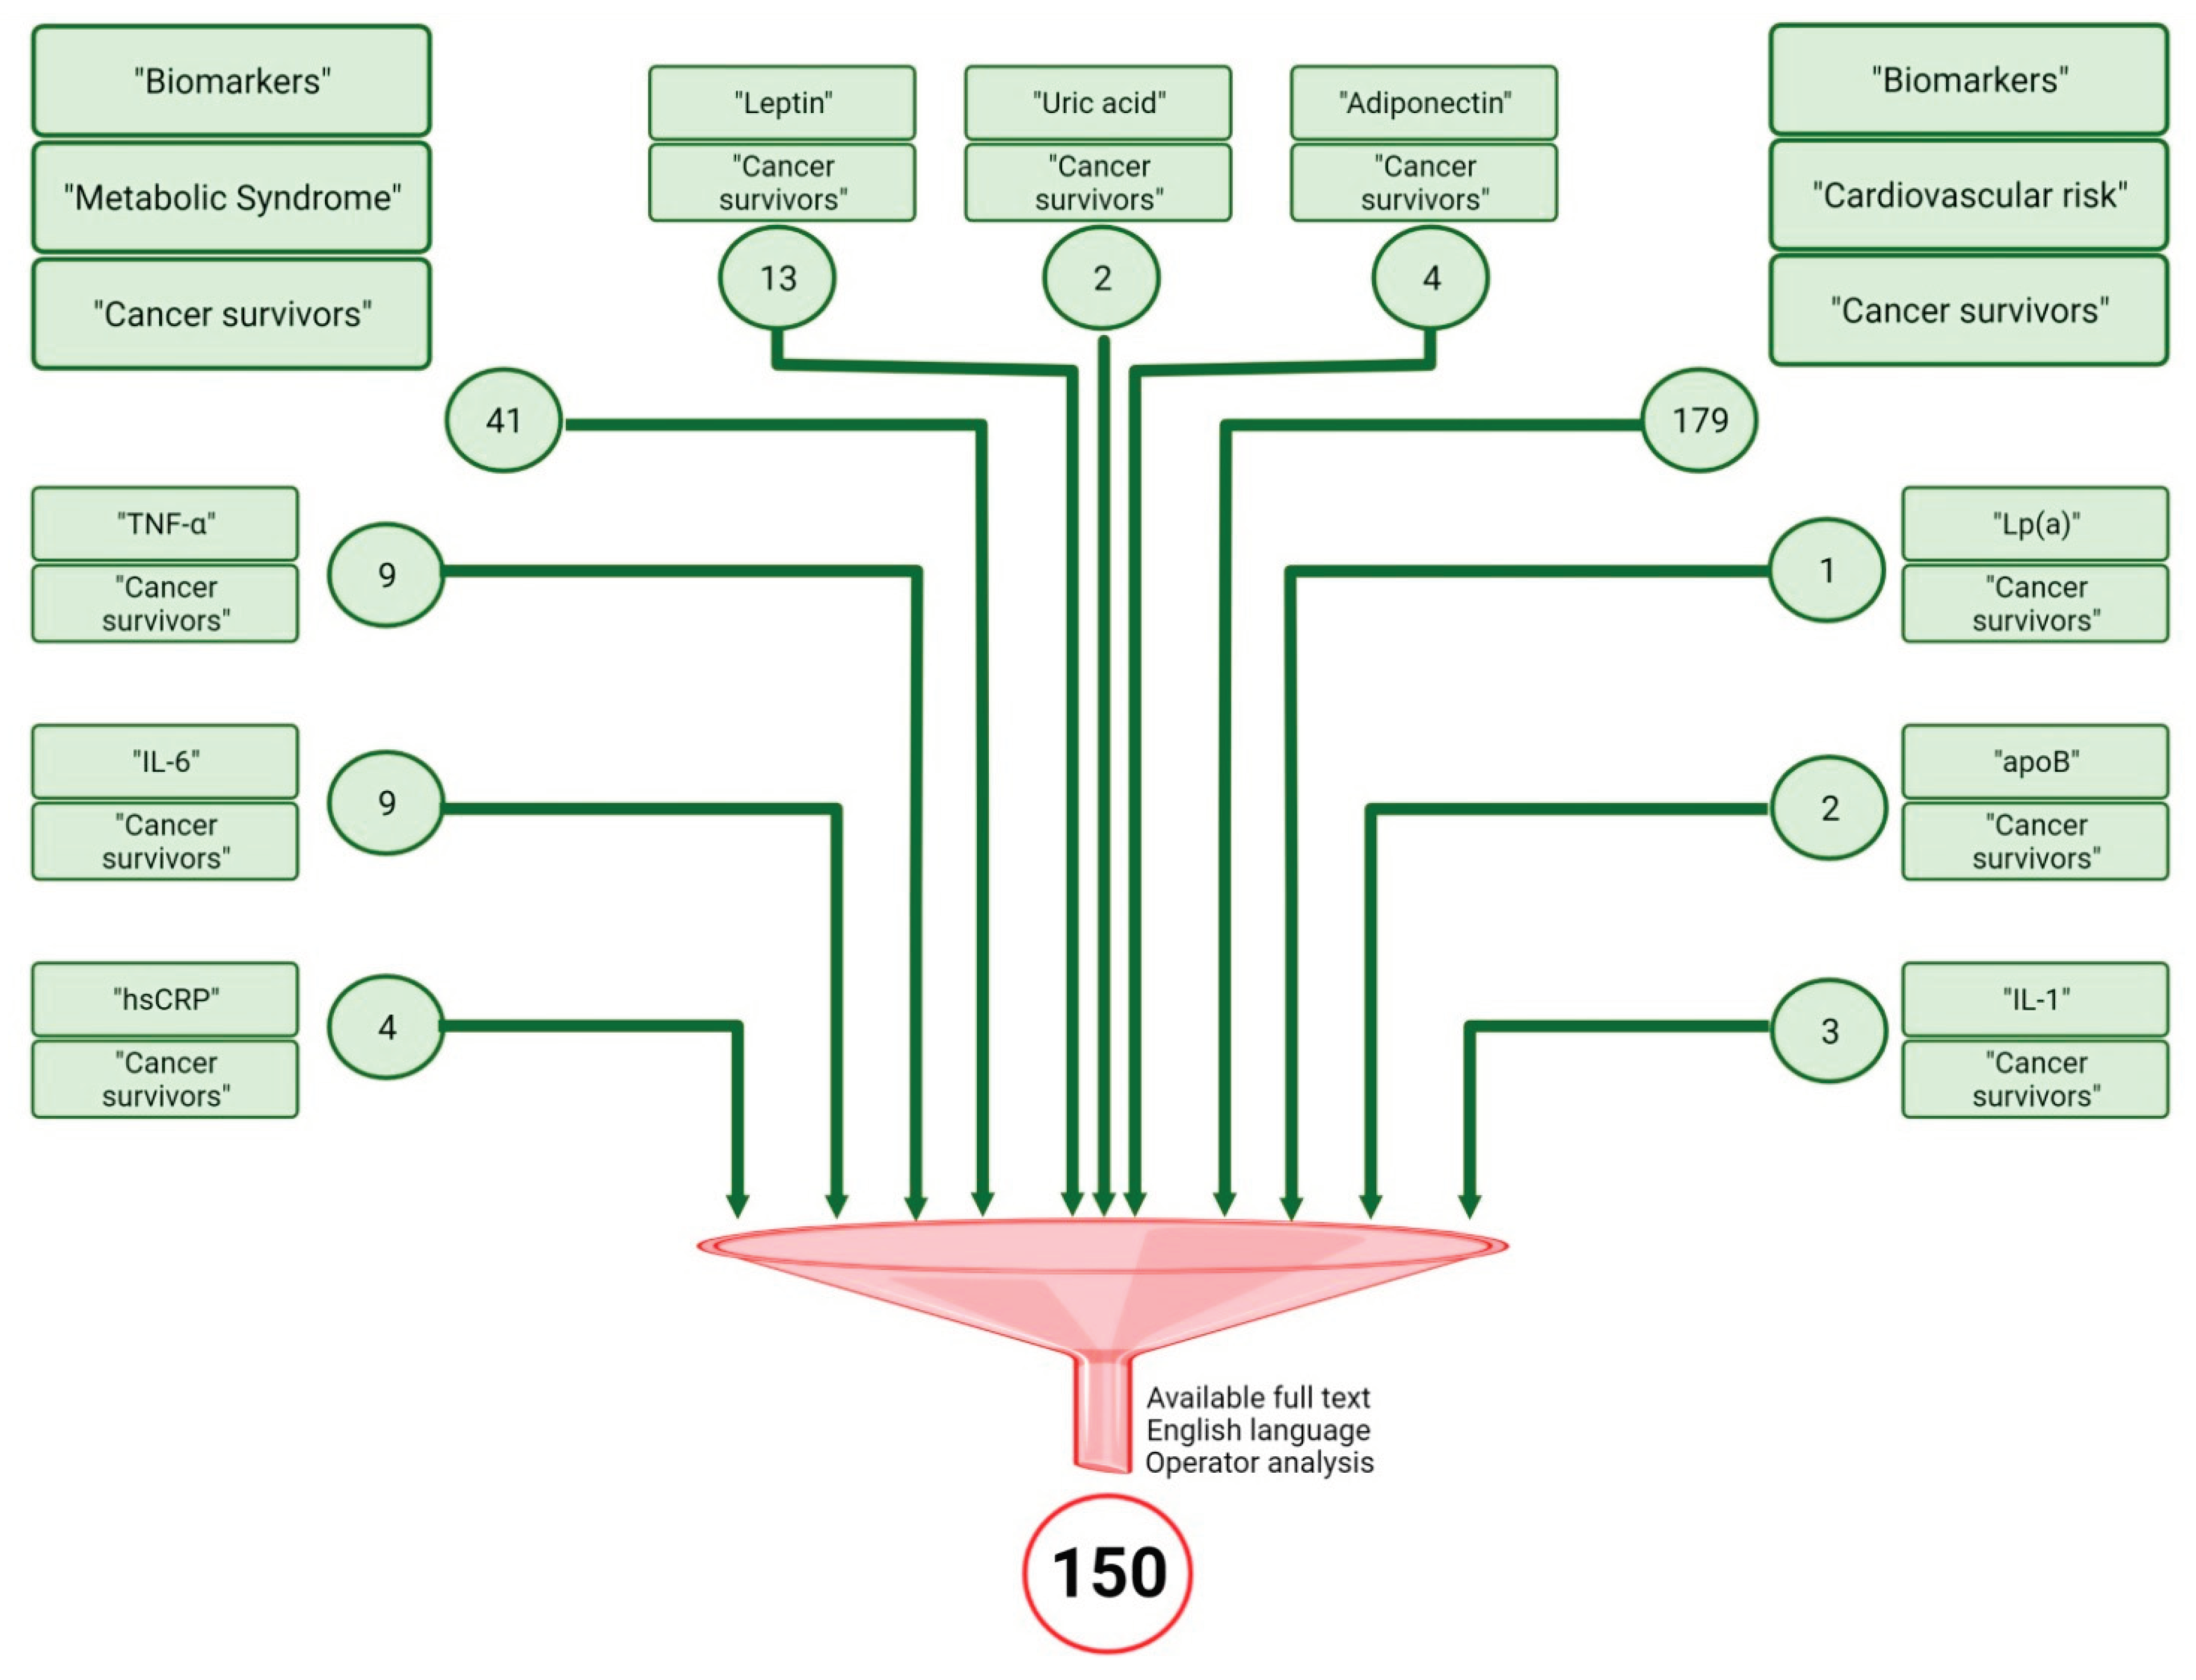
Research Methods
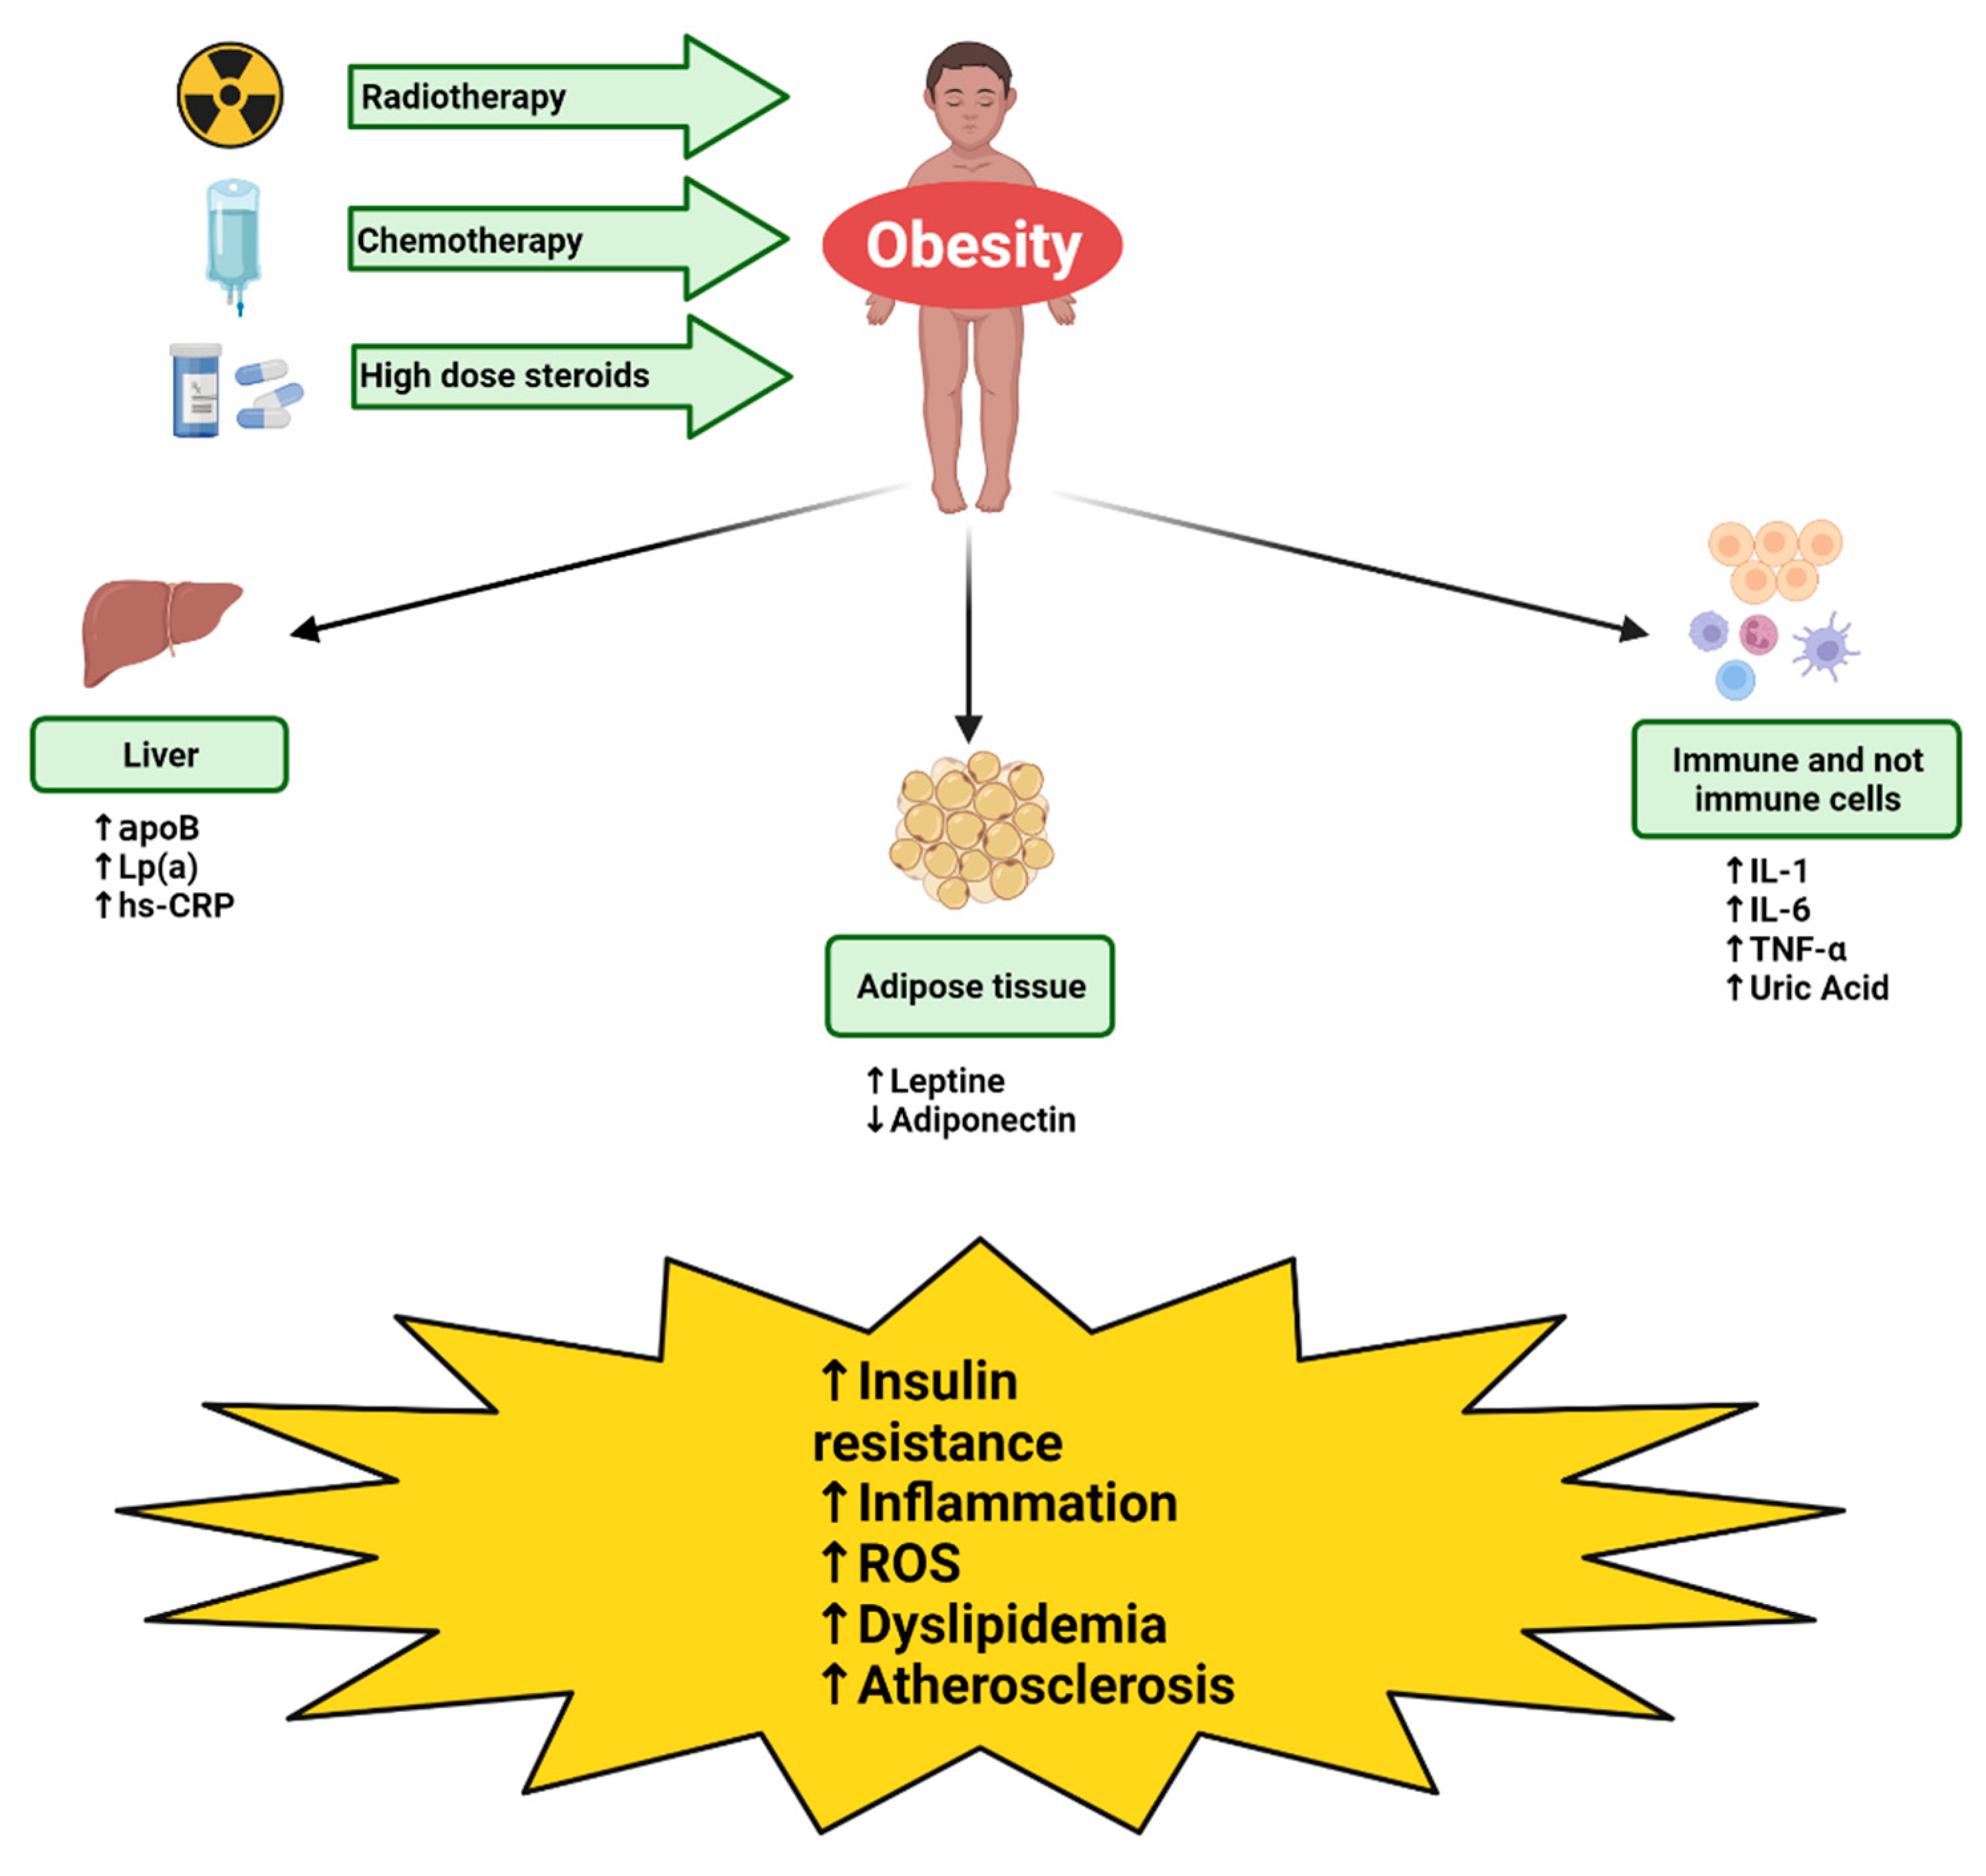
2. Pathogenesis of Metabolic Syndrome and Cardiovascular Disease in CCS
- Raised Waist Circumference (population- and country-specific definitions)
- Fasting Plasma Glucose Concentration ≥ 100 mg/dL or on diabetes treatment
- Blood Pressure ≥ 130/85 mmHg, or on antihypertensive treatment
- Triglycerides ≥ 150 mg/dL or on treatment
- High-density lipoprotein cholesterol < 40 mg/dL in men and < 50 mg/dL in women, or on treatment.
2.1. Radiotherapy
2.2. Steroid Therapy
2.3. Chemotherapy
3. Biomarkers Predictive of Metabolic Syndrome and Cardiovascular Disease in CCS
3.1. Adiponectin
3.2. Leptin
3.3. Uric Acid
3.4. Hs-RCP
3.5. TNF-α
3.6. IL-1
3.7. IL-6
3.8. ApoB
3.9. Lp(a)
4. Effectiveness of Biomarkers in Predicting Metabolic Syndrome and Cardiovascular Disease in CCS
5. Conclusions
Author Contributions
Funding
Institutional Review Board Statement
Informed Consent Statement
Data Availability Statement
Acknowledgments
Conflicts of Interest
References
- Gatta, G.; Botta, L.; Rossi, S.; Aareleid, T.; Bielska-Lasota, M.; Clavel, J.; Dimitrova, N.; Jakab, Z.; Kaatsch, P.; Lacour, B.; et al. Childhood Cancer Survival in Europe 1999–2007: Results of EUROCARE-5—A Population-Based Study. Lancet Oncol. 2014, 15, 35–47. [Google Scholar] [CrossRef]
- Vassal, G.; Schrappe, M.; Pritchard-Jones, K.; Arnold, F.; Basset, L.; Biondi, A.; Bode, G.; Eggert, A.; Hjorth, L.; Kamerić, L.; et al. The SIOPE Strategic Plan: A European Cancer Plan for Children and Adolescents. J. Cancer Policy 2016, 8, 17–32. [Google Scholar] [CrossRef] [Green Version]
- Haupt, R.; Essiaf, S.; Dellacasa, C.; Ronckers, C.M.; Caruso, S.; Sugden, E.; Zadravec Zaletel, L.; Muraca, M.; Morsellino, V.; Kienesberger, A.; et al. The “Survivorship Passport” for Childhood Cancer Survivors. Eur. J. Cancer 2018, 102, 69–81. [Google Scholar] [CrossRef] [Green Version]
- Attinà, G.; Romano, A.; Maurizi, P.; D’Amuri, S.; Mastrangelo, S.; Capozza, M.A.; Triarico, S.; Ruggiero, A. Management of Oral Mucositis in Children With Malignant Solid Tumors. Front. Oncol. 2021, 11, 599243. [Google Scholar] [CrossRef] [PubMed]
- Romano, A.; Capozza, M.A.; Mastrangelo, S.; Maurizi, P.; Triarico, S.; Rolesi, R.; Attinà, G.; Fetoni, A.R.; Ruggiero, A. Assessment and Management of Platinum-Related Ototoxicity in Children Treated for Cancer. Cancers 2020, 12, 1266. [Google Scholar] [CrossRef]
- Ruggiero, A.; Ferrara, P.; Attinà, G.; Rizzo, D.; Riccardi, R. Renal Toxicity and Chemotherapy in Children with Cancer. Br. J. Clin. Pharmacol. 2017, 83, 2605–2614. [Google Scholar] [CrossRef]
- Sofia, R.; Melita, V.; De Vita, A.; Ruggiero, A.; Romano, A.; Attinà, G.; Birritella, L.; Lamendola, P.; Lombardo, A.; Lanza, G.A.; et al. Cardiac Surveillance for Early Detection of Late Subclinical Cardiac Dysfunction in Childhood Cancer Survivors After Anthracycline Therapy. Front. Oncol. 2021, 11, 624057. [Google Scholar] [CrossRef]
- Talvensaari, K.K.; Lanning, M.; Tapanainen, P.; Knip, M. Long-Term Survivors of Childhood Cancer Have an Increased Risk of Manifesting the Metabolic Syndrome. J. Clin. Endocrinol. Metab. 1996, 81, 3051–3055. [Google Scholar] [CrossRef] [Green Version]
- Baker, K.S.; Chow, E.J.; Goodman, P.J.; Leisenring, W.M.; Dietz, A.C.; Perkins, J.L.; Chow, L.; Sinaiko, A.; Moran, A.; Petryk, A.; et al. Impact of Treatment Exposures on Cardiovascular Risk and Insulin Resistance in Childhood Cancer Survivors. Cancer Epidemiol. Biomark. Prev. 2013, 22, 1954–1963. [Google Scholar] [CrossRef] [Green Version]
- de Haas, E.C.; Oosting, S.F.; Lefrandt, J.D.; Wolffenbuttel, B.H.; Sleijfer, D.T.; Gietema, J.A. The Metabolic Syndrome in Cancer Survivors. Lancet Oncol. 2010, 11, 193–203. [Google Scholar] [CrossRef]
- Pluimakers, V.; van Waas, M.; Neggers, S.J.C.M.M.; Van den Heuvel-Eibrink, M. Metabolic Syndrome as Cardiovascular Risk Factor in Childhood Cancer Survivors. Crit. Rev. Oncol. Hematol. 2019, 133, 129–141. [Google Scholar] [CrossRef] [PubMed]
- Alberti, K.G.M.M.; Eckel, R.H.; Grundy, S.M.; Zimmet, P.Z.; Cleeman, J.I.; Donato, K.A.; Fruchart, J.-C.; James, W.P.T.; Loria, C.M.; Smith, S.C., Jr. Harmonizing the Metabolic Syndrome: A Joint Interim Statement of the International Diabetes Federation Task Force on Epidemiology and Prevention; National Heart, Lung, and Blood Institute; American Heart Association; World Heart Federation; International Atherosclerosis Society; and International Association for the Study of Obesity. Circulation 2009, 120, 1640–1645. [Google Scholar] [CrossRef] [PubMed] [Green Version]
- Weiss, R.; Bremer, A.A.; Lustig, R.H. What Is Metabolic Syndrome, and Why Are Children Getting It? Ann. N. Y. Acad. Sci. 2013, 1281, 123–140. [Google Scholar] [CrossRef] [PubMed] [Green Version]
- Al-Hamad, D.; Raman, V. Metabolic Syndrome in Children and Adolescents. Transl. Pediatr. 2017, 6, 397–407. [Google Scholar] [CrossRef] [Green Version]
- Smith, W.; Li, C.; Nottage, K.; Mulrooney, D.; Armstrong, G.; Lanctot, J.; Chemaitilly, W.; Laver, J.; Srivastava, D.; Robison, L.; et al. Lifestyle and Metabolic Syndrome in Adult Survivors of Childhood Cancer: A report from the St. Jude Lifetime Cohort Study. Cancer 2014, 120, 2742–2750. [Google Scholar] [CrossRef]
- McCracken, E.; Monaghan, M.; Sreenivasan, S. Pathophysiology of the Metabolic Syndrome. Clin. Dermatol. 2018, 36, 14–20. [Google Scholar] [CrossRef]
- Follin, C.; Erfurth, E.M. Long-Term Effect of Cranial Radiotherapy on Pituitary-Hypothalamus Area in Childhood Acute Lymphoblastic Leukemia Survivors. Curr. Treat. Options Oncol. 2016, 17, 50. [Google Scholar] [CrossRef] [Green Version]
- Pluimakers, V.G.; van Waas, M.; Looman, C.W.N.; de Maat, M.P.; de Jonge, R.; Delhanty, P.; Huisman, M.; Mattace-Raso, F.U.S.; van den Heuvel-Eibrink, M.M.; Neggers, S.J.C.M.M. Metabolic Syndrome Detection with Biomarkers in Childhood Cancer Survivors. Endocr. Connect. 2020, 9, 676–686. [Google Scholar] [CrossRef]
- Pluimakers, V.G.; van Santen, S.S.; Fiocco, M.; Bakker, M.-C.E.; van der Lelij, A.J.; van den Heuvel-Eibrink, M.M.; Neggers, S.J.C.M.M. Can Biomarkers Be Used to Improve Diagnosis and Prediction of Metabolic Syndrome in Childhood Cancer Survivors? A Systematic Review. Obes. Rev. 2021, 22, e13312. [Google Scholar] [CrossRef]
- Sklar, C.A.; Antal, Z.; Chemaitilly, W.; Cohen, L.E.; Follin, C.; Meacham, L.R.; Murad, M.H. Hypothalamic-Pituitary and Growth Disorders in Survivors of Childhood Cancer: An Endocrine Society Clinical Practice Guideline. J. Clin. Endocrinol. Metab. 2018, 103, 2761–2784. [Google Scholar] [CrossRef] [Green Version]
- Miller, T.L.; Lipsitz, S.R.; Lopez-Mitnik, G.; Hinkle, A.S.; Constine, L.S.; Adams, M.J.; French, C.; Proukou, C.; Rovitelli, A.; Lipshultz, S.E. Characteristics and Determinants of Adiposity in Pediatric Cancer Survivors. Cancer Epidemiol. Biomark. Prev. 2010, 19, 2013–2022. [Google Scholar] [CrossRef] [PubMed] [Green Version]
- Jørgensen, J.O.L.; Vestergaard, E.; Gormsen, L.; Jessen, N.; Nørrelund, H.; Christiansen, J.S.; Møller, N. Metabolic Consequences of GH Deficiency. J. Endocrinol. Investig. 2005, 28, 47–51. [Google Scholar]
- Barbosa-Cortés, L.; López-Alarcón, M.; Mejía-Aranguré, J.M.; Klünder-Klünder, M.; Del Carmen Rodríguez-Zepeda, M.; Rivera-Márquez, H.; de la Vega-Martínez, A.; Martin-Trejo, J.; Shum-Luis, J.; Solis-Labastida, K.; et al. Adipokines, Insulin Resistance, and Adiposity as a Predictors of Metabolic Syndrome in Child Survivors of Lymphoma and Acute Lymphoblastic Leukemia of a Developing Country. BMC Cancer 2017, 17, 125. [Google Scholar] [CrossRef] [PubMed] [Green Version]
- Meacham, L.R.; Chow, E.J.; Ness, K.K.; Kamdar, K.Y.; Chen, Y.; Yasui, Y.; Oeffinger, K.C.; Sklar, C.A.; Robison, L.L.; Mertens, A.C. Cardiovascular Risk Factors in Adult Survivors of Pediatric Cancer—A Report from the Childhood Cancer Survivor Study. Cancer Epidemiol. Biomark. Prev. 2010, 19, 170–181. [Google Scholar] [CrossRef] [Green Version]
- Lipshultz, S.E.; Franco, V.I.; Miller, T.L.; Colan, S.D.; Sallan, S.E. Cardiovascular Disease in Adult Survivors of Childhood Cancer. Annu. Rev. Med. 2015, 66, 161–176. [Google Scholar] [CrossRef] [Green Version]
- Green, D.M.; Wang, M.; Krasin, M.J.; Davidoff, A.M.; Srivastava, D.; Jay, D.W.; Ness, K.K.; Shulkin, B.L.; Spunt, S.L.; Jones, D.P.; et al. Long-Term Renal Function after Treatment for Unilateral, Nonsyndromic Wilms Tumor. A Report from the St. Jude Lifetime Cohort Study. Pediatr. Blood Cancer 2020, 67, e28271. [Google Scholar] [CrossRef]
- Rossi, F.; Di Paola, A.; Pota, E.; Argenziano, M.; Di Pinto, D.; Marrapodi, M.M.; Di Leva, C.; Di Martino, M.; Tortora, C. Biological Aspects of Inflamm-Aging in Childhood Cancer Survivors. Cancers 2021, 13, 4933. [Google Scholar] [CrossRef]
- Friedman, D.N.; Tonorezos, E.S.; Cohen, P. Diabetes and Metabolic Syndrome in Survivors of Childhood Cancer. Horm. Res. Paediatr. 2019, 91, 118–127. [Google Scholar] [CrossRef]
- Perez, A.; Jansen-Chaparro, S.; Saigi, I.; Bernal-Lopez, M.R.; Miñambres, I.; Gomez-Huelgas, R. Glucocorticoid-Induced Hyperglycemia. J. Diabetes 2014, 6, 9–20. [Google Scholar] [CrossRef]
- Tosur, M.; Viau-Colindres, J.; Astudillo, M.; Redondo, M.J.; Lyons, S.K. Medication-Induced Hyperglycemia: Pediatric Perspective. BMJ Open Diabetes Res. Care 2020, 8, e000801. [Google Scholar] [CrossRef] [Green Version]
- Kanai, F.; Ito, K.; Todaka, M.; Hayashi, H.; Kamohara, S.; Ishii, K.; Okada, T.; Hazeki, O.; Ui, M.; Ebina, Y. Insulin-Stimulated GLUT4 Translocation Is Relevant to the Phosphorylation of IRS-1 and the Activity of PI3 Kinase. Biochem. Biophys. Res. Commun. 1993, 195, 762–768. [Google Scholar] [CrossRef] [PubMed]
- Ronsley, R.; Rassekh, S.R.; Fleming, A.; Empringham, B.; Jennings, W.; Portwine, C.; Burrow, S.; Zelcer, S.; Johnston, D.L.; Thabane, L.; et al. High Molecular Weight Adiponectin Levels Are Inversely Associated with Adiposity in Pediatric Brain Tumor Survivors. Sci. Rep. 2020, 10, 18606. [Google Scholar] [CrossRef] [PubMed]
- Vegiopoulos, A.; Herzig, S. Glucocorticoids, Metabolism and Metabolic Diseases. Mol. Cell. Endocrinol. 2007, 275, 43–61. [Google Scholar] [CrossRef] [PubMed] [Green Version]
- Lipshultz, S.E.; Landy, D.C.; Lopez-Mitnik, G.; Lipsitz, S.R.; Hinkle, A.S.; Constine, L.S.; French, C.A.; Rovitelli, A.M.; Proukou, C.; Adams, M.J.; et al. Cardiovascular Status of Childhood Cancer Survivors Exposed and Unexposed to Cardiotoxic Therapy. J. Clin. Oncol. 2012, 30, 1050–1057. [Google Scholar] [CrossRef] [PubMed]
- Antoniak, S.; Phungphong, S.; Cheng, Z.; Jensen, B.C. Novel Mechanisms of Anthracycline-Induced Cardiovascular Toxicity: A Focus on Thrombosis, Cardiac Atrophy, and Programmed Cell Death. Front. Cardiovasc. Med. 2021, 8, 817977. [Google Scholar] [CrossRef] [PubMed]
- Sims, E.D.; Jennings, W.J.; Empringham, B.; Fleming, A.; Portwine, C.; Johnston, D.L.; Zelcer, S.M.; Rassekh, S.R.; Burrow, S.; Thabane, L.; et al. Circulating Leptin Levels Are Associated with Adiposity in Survivors of Childhood Brain Tumors. Sci. Rep. 2020, 10, 4711. [Google Scholar] [CrossRef] [Green Version]
- Feldman, D.R.; Schaffer, W.L.; Steingart, R.M. Late Cardiovascular Toxicity Following Chemotherapy for Germ Cell Tumors. J. Natl. Compr. Cancer Netw. JNCCN 2012, 10, 537–544. [Google Scholar] [CrossRef] [Green Version]
- Shi, Y.; Inoue, S.; Shinozaki, R.; Fukue, K.; Kougo, T. Release of Cytokines from Human Umbilical Vein Endothelial Cells Treated with Platinum Compounds in Vitro. Jpn. J. Cancer Res. 1998, 89, 757–767. [Google Scholar] [CrossRef]
- Aisyi, M.; Andriastuti, M.; Kurniati, N. The Effect of Combination of Steroid and L-Asparaginase on Hyperglycemia in Children with Acute Lymphoblastic Leukemia (ALL). Asian Pac. J. Cancer Prev. APJCP 2019, 20, 2619–2624. [Google Scholar] [CrossRef]
- Pui, C.H.; Burghen, G.A.; Bowman, W.P.; Aur, R.J. Risk Factors for Hyperglycemia in Children with Leukemia Receiving L-Asparaginase and Prednisone. J. Pediatr. 1981, 99, 46–50. [Google Scholar] [CrossRef]
- Causes of Mortality in Adults Treated for Hodgkin Lymphoma. Available online: https://www.cancertherapyadvisor.com/home/cancer-topics/lymphoma/hodgkin-lymphoma-mortality-adults-treatment-risk/ (accessed on 6 April 2022).
- Varricchi, G.; Ameri, P.; Cadeddu, C.; Ghigo, A.; Madonna, R.; Marone, G.; Mercurio, V.; Monte, I.; Novo, G.; Parrella, P.; et al. Antineoplastic Drug-Induced Cardiotoxicity: A Redox Perspective. Front. Physiol. 2018, 9, 167. [Google Scholar] [CrossRef] [PubMed]
- Ariffin, H.; Azanan, M.S.; Abd Ghafar, S.S.; Oh, L.; Lau, K.H.; Thirunavakarasu, T.; Sedan, A.; Ibrahim, K.; Chan, A.; Chin, T.F.; et al. Young Adult Survivors of Childhood Acute Lymphoblastic Leukemia Show Evidence of Chronic Inflammation and Cellular Aging. Cancer 2017, 123, 4207–4214. [Google Scholar] [CrossRef] [PubMed] [Green Version]
- Durack, J.; Lynch, S.V. The Gut Microbiome: Relationships with Disease and Opportunities for Therapy. J. Exp. Med. 2019, 216, 20–40. [Google Scholar] [CrossRef] [PubMed] [Green Version]
- Burns, S.F.; Lee, S.J.; Arslanian, S.A. Surrogate Lipid Markers for Small Dense Low-Density Lipoprotein Particles in Overweight Youth. J. Pediatr. 2012, 161, 991–996. [Google Scholar] [CrossRef] [PubMed] [Green Version]
- Achari, A.E.; Jain, S.K. Adiponectin, a Therapeutic Target for Obesity, Diabetes, and Endothelial Dysfunction. Int. J. Mol. Sci. 2017, 18, 1321. [Google Scholar] [CrossRef] [Green Version]
- Khoramipour, K.; Chamari, K.; Hekmatikar, A.A.; Ziyaiyan, A.; Taherkhani, S.; Elguindy, N.M.; Bragazzi, N.L. Adiponectin: Structure, Physiological Functions, Role in Diseases, and Effects of Nutrition. Nutrients 2021, 13, 1180. [Google Scholar] [CrossRef]
- Ramakrishnan, N.; Auger, K.; Jialal, I. Biochemistry, Adiponecti. In StatPearls; StatPearls Publishing: Treasure Island, FL, USA, 2021. [Google Scholar]
- Turer, A.T.; Scherer, P.E. Adiponectin: Mechanistic Insights and Clinical Implications. Diabetologia 2012, 55, 2319–2326. [Google Scholar] [CrossRef] [Green Version]
- Devaraj, S.; Torok, N.; Dasu, M.R.; Samols, D.; Jialal, I. Adiponectin Decreases C-Reactive Protein Synthesis and Secretion from Endothelial Cells: Evidence for an Adipose Tissue-Vascular Loop. Arterioscler. Thromb. Vasc. Biol. 2008, 28, 1368–1374. [Google Scholar] [CrossRef] [Green Version]
- Giordano, P.; Muggeo, P.; Delvecchio, M.; Carbonara, S.; Romano, A.; Altomare, M.; Ricci, G.; Valente, F.; Zito, A.; Scicchitano, P.; et al. Endothelial Dysfunction and Cardiovascular Risk Factors in Childhood Acute Lymphoblastic Leukemia Survivors. Int. J. Cardiol. 2017, 228, 621–627. [Google Scholar] [CrossRef]
- Nigro, E.; Scudiero, O.; Monaco, M.L.; Palmieri, A.; Mazzarella, G.; Costagliola, C.; Bianco, A.; Daniele, A. New Insight into Adiponectin Role in Obesity and Obesity-Related Diseases. BioMed Res. Int. 2014, 2014, 658913. [Google Scholar] [CrossRef]
- Bielorai, B.; Weintraub, Y.; Hutt, D.; Hemi, R.; Kanety, H.; Modan-Moses, D.; Goldstein, G.; Hadar, D.; Lerner-Geva, L.; Toren, A.; et al. The Metabolic Syndrome and Its Components in Pediatric Survivors of Allogeneic Hematopoietic Stem Cell Transplantation. Clin. Transplant. 2017, 31, e12903. [Google Scholar] [CrossRef] [PubMed]
- Reference Values for Leptin and Adiponectin in Children below the Age of 10 Based on the IDEFICS Cohort—PubMed. Available online: https://pubmed.ncbi.nlm.nih.gov/25219410/ (accessed on 6 April 2022).
- Lausten-Thomsen, U.; Christiansen, M.; Fonvig, C.E.; Trier, C.; Pedersen, O.; Hansen, T.; Holm, J.-C. Reference Values for Serum Total Adiponectin in Healthy Non-Obese Children and Adolescents. Clin. Chim. Acta 2015, 450, 11–14. [Google Scholar] [CrossRef] [PubMed]
- Wasim, M.; Awan, F.R.; Najam, S.S.; Khan, A.R.; Khan, H.N. Role of Leptin Deficiency, Inefficiency, and Leptin Receptors in Obesity. Biochem. Genet. 2016, 54, 565–572. [Google Scholar] [CrossRef] [PubMed]
- Dornbush, S.; Aeddula, N.R. Physiology, Leptin. In StatPearls; StatPearls Publishing: Treasure Island, FL, USA, 2022. [Google Scholar]
- Amjad, S.; Baig, M.; Zahid, N.; Tariq, S.; Rehman, R. Association between Leptin, Obesity, Hormonal Interplay and Male Infertility. Andrologia 2019, 51, e13147. [Google Scholar] [CrossRef] [Green Version]
- Farr, O.M.; Gavrieli, A.; Mantzoros, C.S. Leptin Applications in 2015: What Have We Learned about Leptin and Obesity? Curr. Opin. Endocrinol. Diabetes Obes. 2015, 22, 353–359. [Google Scholar] [CrossRef] [Green Version]
- Funcke, J.-B.; von Schnurbein, J.; Lennerz, B.; Lahr, G.; Debatin, K.-M.; Fischer-Posovszky, P.; Wabitsch, M. Monogenic Forms of Childhood Obesity Due to Mutations in the Leptin Gene. Mol. Cell. Pediatr. 2014, 1, 3. [Google Scholar] [CrossRef] [Green Version]
- Farooqi, I.S.; O’Rahilly, S. 20 Years of Leptin: Human Disorders of Leptin Action. J. Endocrinol. 2014, 223, T63–T70. [Google Scholar] [CrossRef]
- Peters, T.; Antel, J.; Föcker, M.; Esber, S.; Hinney, A.; Schéle, E.; Dickson, S.L.; Albayrak, Ö.; Hebebrand, J. The Association of Serum Leptin Levels with Food Addiction Is Moderated by Weight Status in Adolescent Psychiatric Inpatients. Eur. Eat. Disord. Rev. 2018, 26, 618–628. [Google Scholar] [CrossRef]
- Wabitsch, M.; Blum, W.F.; Muche, R.; Braun, M.; Hube, F.; Rascher, W.; Heinze, E.; Teller, W.; Hauner, H. Contribution of Androgens to the Gender Difference in Leptin Production in Obese Children and Adolescents. J. Clin. Investig. 1997, 100, 808–813. [Google Scholar] [CrossRef] [Green Version]
- Zimmet, P.; Hodge, A.; Nicolson, M.; Staten, M.; de Courten, M.; Moore, J.; Morawiecki, A.; Lubina, J.; Collier, G.; Alberti, G.; et al. Serum Leptin Concentration, Obesity, and Insulin Resistance in Western Samoans: Cross Sectional Study. BMJ 1996, 313, 965–969. [Google Scholar] [CrossRef] [Green Version]
- Franks, P.W.; Brage, S.; Luan, J.; Ekelund, U.; Rahman, M.; Farooqi, I.S.; Halsall, I.; O’Rahilly, S.; Wareham, N.J. Leptin Predicts a Worsening of the Features of the Metabolic Syndrome Independently of Obesity. Obes. Res. 2005, 13, 1476–1484. [Google Scholar] [CrossRef] [PubMed]
- Wallace, A.M.; McMahon, A.D.; Packard, C.J.; Kelly, A.; Shepherd, J.; Gaw, A.; Sattar, N. Plasma Leptin and the Risk of Cardiovascular Disease in the West of Scotland Coronary Prevention Study (WOSCOPS). Circulation 2001, 104, 3052–3056. [Google Scholar] [CrossRef] [PubMed] [Green Version]
- Galletti, F.; D’Elia, L.; Barba, G.; Siani, A.; Cappuccio, F.P.; Farinaro, E.; Iacone, R.; Russo, O.; De Palma, D.; Ippolito, R.; et al. High-Circulating Leptin Levels Are Associated with Greater Risk of Hypertension in Men Independently of Body Mass and Insulin Resistance: Results of an Eight-Year Follow-up Study. J. Clin. Endocrinol. Metab. 2008, 93, 3922–3926. [Google Scholar] [CrossRef]
- Madeira, I.; Bordallo, M.A.; Rodrigues, N.C.; Carvalho, C.; Gazolla, F.; Collett-Solberg, P.; Medeiros, C.; Bordallo, A.P.; Borges, M.; Monteiro, C.; et al. Leptin as a Predictor of Metabolic Syndrome in Prepubertal Children. Arch. Endocrinol. Metab. 2017, 61, 7–13. [Google Scholar] [CrossRef] [PubMed] [Green Version]
- Annaloro, C.; Usardi, P.; Airaghi, L.; Giunta, V.; Forti, S.; Orsatti, A.; Baldini, M.; Delle Volpe, A.; Lambertenghi Deliliers, G. Prevalence of Metabolic Syndrome in Long-Term Survivors of Hematopoietic Stem Cell Transplantation. Bone Marrow Transplant. 2008, 41, 797–804. [Google Scholar] [CrossRef]
- Gijón-Conde, T.; Graciani, A.; Guallar-Castillón, P.; Aguilera, M.T.; Rodríguez-Artalejo, F.; Banegas, J.R. Leptin Reference Values and Cutoffs for Identifying Cardiometabolic Abnormalities in the Spanish Population. Rev. Esp. Cardiol. Engl. Ed. 2015, 68, 672–679. [Google Scholar] [CrossRef] [Green Version]
- Venner, A.A.; Doyle-Baker, P.K.; Lyon, M.E.; Fung, T.S. A Meta-Analysis of Leptin Reference Ranges in the Healthy Paediatric Prepubertal Population. Ann. Clin. Biochem. 2009, 46, 65–72. [Google Scholar] [CrossRef]
- Savino, F.; Rossi, L.; Benetti, S.; Petrucci, E.; Sorrenti, M.; Silvestro, L. Serum Reference Values for Leptin in Healthy Infants. PLoS ONE 2014, 9, e113024. [Google Scholar] [CrossRef]
- Joosten, L.A.B.; Crişan, T.O.; Bjornstad, P.; Johnson, R.J. Asymptomatic Hyperuricaemia: A Silent Activator of the Innate Immune System. Nat. Rev. Rheumatol. 2020, 16, 75–86. [Google Scholar] [CrossRef]
- López-Cruz, R.I.; Crocker, D.E.; Gaxiola-Robles, R.; Bernal, J.A.; Real-Valle, R.A.; Lugo-Lugo, O.; Zenteno-Savín, T. Plasma Hypoxanthine-Guanine Phosphoribosyl Transferase Activity in Bottlenose Dolphins Contributes to Avoiding Accumulation of Non-Recyclable Purines. Front. Physiol. 2016, 7, 213. [Google Scholar] [CrossRef] [Green Version]
- Zhang, C.; Li, L.; Zhang, Y.; Zeng, C. Recent Advances in Fructose Intake and Risk of Hyperuricemia. Biomed. Pharmacother. 2020, 131, 110795. [Google Scholar] [CrossRef] [PubMed]
- Li, L.; Zhang, Y.; Zeng, C. Update on the Epidemiology, Genetics, and Therapeutic Options of Hyperuricemia. Am. J. Transl. Res. 2020, 12, 3167–3181. [Google Scholar] [PubMed]
- Toyoki, D.; Shibata, S.; Kuribayashi-Okuma, E.; Xu, N.; Ishizawa, K.; Hosoyamada, M.; Uchida, S. Insulin Stimulates Uric Acid Reabsorption via Regulating Urate Transporter 1 and ATP-Binding Cassette Subfamily G Member 2. Am. J. Physiol. Renal Physiol. 2017, 313, F826–F834. [Google Scholar] [CrossRef] [PubMed]
- Wang, Y.; Chi, J.; Che, K.; Chen, Y.; Sun, X.; Wang, Y.; Wang, Z. Fasting Plasma Glucose and Serum Uric Acid Levels in a General Chinese Population with Normal Glucose Tolerance: A U-Shaped Curve. PLoS ONE 2017, 12, e0180111. [Google Scholar] [CrossRef] [Green Version]
- MacFarlane, L.A.; Liu, C.-C.; Solomon, D.H. The Effect of Initiating Pharmacologic Insulin on Serum Uric Acid Levels in Patients with Diabetes: A Matched Cohort Analysis. Semin. Arthritis Rheum. 2015, 44, 592–596. [Google Scholar] [CrossRef] [Green Version]
- Mandal, A.K.; Leask, M.P.; Estiverne, C.; Choi, H.K.; Merriman, T.R.; Mount, D.B. Genetic and Physiological Effects of Insulin on Human Urate Homeostasis. Front. Physiol. 2021, 12, 713710. [Google Scholar] [CrossRef]
- Kimura, Y.; Tsukui, D.; Kono, H. Uric Acid in Inflammation and the Pathogenesis of Atherosclerosis. Int. J. Mol. Sci. 2021, 22, 12394. [Google Scholar] [CrossRef]
- King, C.; Lanaspa, M.A.; Jensen, T.; Tolan, D.R.; Sánchez-Lozada, L.G.; Johnson, R.J. Uric Acid as a Cause of the Metabolic Syndrome. Contrib. Nephrol. 2018, 192, 88–102. [Google Scholar] [CrossRef]
- Cheung, Y.T.; Edelmann, M.N.; Mulrooney, D.A.; Green, D.M.; Chemaitilly, W.; John, N.; Robison, L.L.; Hudson, M.M.; Krull, K.R. Uric Acid and Neurocognitive Function in Survivors of Childhood Acute Lymphoblastic Leukemia Treated with Chemotherapy Only. Cancer Epidemiol. Biomark. Prev. 2016, 25, 1259–1267. [Google Scholar] [CrossRef] [Green Version]
- Wang, X.; Chen, S.; Tang, X.; Lin, D.; Qiu, P. Ultrasensitive Detection of Uric Acid in Serum of Patients with Gout by a New Assay Based on Pt@Ag Nanoflowers. RSC Adv. 2019, 9, 36578–36585. [Google Scholar] [CrossRef] [Green Version]
- Desideri, G.; Castaldo, G.; Lombardi, A.; Mussap, M.; Testa, A.; Pontremoli, R.; Punzi, L.; Borghi, C. Is It Time to Revise the Normal Range of Serum Uric Acid Levels? Eur. Rev. Med. Pharmacol. Sci. 2014, 18, 1295–1306. [Google Scholar] [PubMed]
- Luciano, R.; Shashaj, B.; Spreghini, M.; Del Fattore, A.; Rustico, C.; Wietrzykowska Sforza, R.; Morino, G.S.; Dallapiccola, B.; Manco, M. Percentiles of Serum Uric Acid and Cardiometabolic Abnormalities in Obese Italian Children and Adolescents. Ital. J. Pediatr. 2017, 43, 3. [Google Scholar] [CrossRef] [PubMed] [Green Version]
- Nehring, S.M.; Goyal, A.; Patel, B.C. C Reactive Protein. In StatPearls; StatPearls Publishing: Treasure Island, FL, USA, 2022. [Google Scholar]
- Jungen, M.J.; Meulen, B.C.T.; Osch, T.V.; Weinstein, H.C.; Ostelo, R.W.J.G. Inflammatory Biomarkers in Patients with Sciatica: A Systematic Review. BMC Musculoskelet. Disord. 2019, 20, 156. [Google Scholar] [CrossRef] [PubMed]
- Kramer, N.E.; Cosgrove, V.E.; Dunlap, K.; Subramaniapillai, M.; McIntyre, R.S.; Suppes, T. A Clinical Model for Identifying an Inflammatory Phenotype in Mood Disorders. J. Psychiatr. Res. 2019, 113, 148–158. [Google Scholar] [CrossRef] [PubMed]
- Parrett, A.L.; Valentine, R.J.; Arngrímsson, S.A.; Castelli, D.M.; Evans, E.M. Adiposity, Activity, Fitness, and C-Reactive Protein in Children. Med. Sci. Sports Exerc. 2010, 42, 1981–1986. [Google Scholar] [CrossRef] [PubMed]
- Gorini, S.; De Angelis, A.; Berrino, L.; Malara, N.; Rosano, G.; Ferraro, E. Chemotherapeutic Drugs and Mitochondrial Dysfunction: Focus on Doxorubicin, Trastuzumab, and Sunitinib. Oxid. Med. Cell. Longev. 2018, 2018, 7582730. [Google Scholar] [CrossRef] [PubMed] [Green Version]
- Muhic, E.; Mathiesen, S.; Nielsen, M.M.; Suominen, A.; Sørensen, K.; Ifversen, M.; Nolsöe, R.L.; Pedersen, K.M.; Lähteenmäki, P.; Nordestgaard, B.G.; et al. Metabolic Syndrome in Male Survivors of Pediatric Allogeneic Hematopoietic Stem Cell Transplantation: Impact of Total Body Irradiation, Low-Grade Inflammation, and Hypogonadism. Transplant. Cell. Ther. 2021, 27, 778.e1–778.e8. [Google Scholar] [CrossRef]
- Turcotte, L.M.; Yingst, A.; Verneris, M.R. Metabolic Syndrome after Hematopoietic Cell Transplantation: At the Intersection of Treatment Toxicity and Immune Dysfunction. Biol. Blood Marrow Transplant. 2016, 22, 1159–1166. [Google Scholar] [CrossRef] [Green Version]
- Cepelova, M.; Kruseova, J.; Luks, A.; Capek, V.; Cepela, P.; Potockova, J.; Kraml, P. Accelerated Atherosclerosis, Hyperlipoproteinemia and Insulin Resistance in Long-Term Survivors of Hodgkin Lymphoma during Childhood and Adolescence. Neoplasma 2019, 66, 978–987. [Google Scholar] [CrossRef]
- Felicetti, F.; Cento, A.S.; Fornengo, P.; Cassader, M.; Mastrocola, R.; D’Ascenzo, F.; Settanni, F.; Benso, A.; Arvat, E.; Collino, M.; et al. Advanced Glycation End Products and Chronic Inflammation in Adult Survivors of Childhood Leukemia Treated with Hematopoietic Stem Cell Transplantation. Pediatr. Blood Cancer 2020, 67, e28106. [Google Scholar] [CrossRef]
- Lee, Y.; McKechnie, T.; Doumouras, A.G.; Handler, C.; Eskicioglu, C.; Gmora, S.; Anvari, M.; Hong, D. Diagnostic Value of C-Reactive Protein Levels in Postoperative Infectious Complications After Bariatric Surgery: A Systematic Review and Meta-Analysis. Obes. Surg. 2019, 29, 2022–2029. [Google Scholar] [CrossRef] [PubMed]
- Johns, I.; Moschonas, K.E.; Medina, J.; Ossei-Gerning, N.; Kassianos, G.; Halcox, J.P. Risk Classification in Primary Prevention of CVD According to QRISK2 and JBS3 ‘Heart Age’, and Prevalence of Elevated High-Sensitivity C Reactive Protein in the UK Cohort of the EURIKA Study. Open Heart 2018, 5, e000849. [Google Scholar] [CrossRef] [PubMed] [Green Version]
- Medler, J.; Wajant, H. Tumor Necrosis Factor Receptor-2 (TNFR2): An Overview of an Emerging Drug Target. Expert Opin. Ther. Targets 2019, 23, 295–307. [Google Scholar] [CrossRef] [PubMed]
- Sethi, J.K.; Hotamisligil, G.S. Metabolic Messengers: Tumour Necrosis Factor. Nat. Metab. 2021, 3, 1302–1312. [Google Scholar] [CrossRef] [PubMed]
- Mathis, D.; Shoelson, S.E. Immunometabolism: An Emerging Frontier. Nat. Rev. Immunol. 2011, 11, 81–83. [Google Scholar] [CrossRef] [PubMed] [Green Version]
- Feingold, K.R.; Soued, M.; Staprans, I.; Gavin, L.A.; Donahue, M.E.; Huang, B.J.; Moser, A.H.; Gulli, R.; Grunfeld, C. Effect of Tumor Necrosis Factor (TNF) on Lipid Metabolism in the Diabetic Rat. Evidence That Inhibition of Adipose Tissue Lipoprotein Lipase Activity Is Not Required for TNF-Induced Hyperlipidemia. J. Clin. Investig. 1989, 83, 1116–1121. [Google Scholar] [CrossRef] [PubMed]
- Yanai, H.; Tomono, Y.; Ito, K.; Furutani, N.; Yoshida, H.; Tada, N. The Underlying Mechanisms for Development of Hypertension in the Metabolic Syndrome. Nutr. J. 2008, 7, 10. [Google Scholar] [CrossRef] [PubMed] [Green Version]
- Decker, M.-L.; Grobusch, M.P.; Ritz, N. Influence of Age and Other Factors on Cytokine Expression Profiles in Healthy Children—A Systematic Review. Front. Pediatr. 2017, 5, 255. [Google Scholar] [CrossRef]
- Kaneko, N.; Kurata, M.; Yamamoto, T.; Morikawa, S.; Masumoto, J. The Role of Interleukin-1 in General Pathology. Inflamm. Regen. 2019, 39, 12. [Google Scholar] [CrossRef] [Green Version]
- Gery, I.; Gershon, R.K.; Waksman, B.H. Potentiation of the T-Lymphocyte Response to Mitogens. I. The Responding Cell. J. Exp. Med. 1972, 136, 128–142. [Google Scholar] [CrossRef] [Green Version]
- Rosenstreich, D.L.; Vogel, S.N.; Jacques, A.R.; Wahl, L.M.; Oppenheim, J.J. Macrophage Sensitivity to Endotoxin: Genetic Control by a Single Codominant Gene. J. Immunol. 1978, 121, 1664–1670. [Google Scholar] [PubMed]
- Lachman, L.B.; Hacker, M.P.; Handschumacher, R.E. Partial Purification of Human Lymphocyte-Activating Factor (LAF) by Ultrafiltration and Electrophoretic Techniques. J. Immunol. 1977, 119, 2019–2023. [Google Scholar] [PubMed]
- Takács, L.; Kovacs, E.J.; Smith, M.R.; Young, H.A.; Durum, S.K. Detection of IL-1 Alpha and IL-1 Beta Gene Expression by in Situ Hybridization. Tissue Localization of IL-1 MRNA in the Normal C57BL/6 Mouse. J. Immunol. 1988, 141, 3081–3095. [Google Scholar]
- Dinarello, C.A. The Interleukin-1 Family: 10 Years of Discovery. FASEB J. 1994, 8, 1314–1325. [Google Scholar] [CrossRef] [Green Version]
- Maedler, K.; Sergeev, P.; Ris, F.; Oberholzer, J.; Joller-Jemelka, H.I.; Spinas, G.A.; Kaiser, N.; Halban, P.A.; Donath, M.Y. Glucose-Induced Beta Cell Production of IL-1beta Contributes to Glucotoxicity in Human Pancreatic Islets. J. Clin. Investig. 2002, 110, 851–860. [Google Scholar] [CrossRef] [PubMed]
- Böni-Schnetzler, M.; Boller, S.; Debray, S.; Bouzakri, K.; Meier, D.T.; Prazak, R.; Kerr-Conte, J.; Pattou, F.; Ehses, J.A.; Schuit, F.C.; et al. Free Fatty Acids Induce a Proinflammatory Response in Islets via the Abundantly Expressed Interleukin-1 Receptor I. Endocrinol. 2009, 150, 5218–5229. [Google Scholar] [CrossRef]
- Carter, K.W.; Hung, J.; Powell, B.L.; Wiltshire, S.; Foo, B.T.X.; Leow, Y.C.; McQuillan, B.M.; Jennens, M.; McCaskie, P.A.; Thompson, P.L.; et al. Association of Interleukin-1 Gene Polymorphisms with Central Obesity and Metabolic Syndrome in a Coronary Heart Disease Population. Hum. Genet. 2008, 124, 199–206. [Google Scholar] [CrossRef]
- Spranger, J.; Kroke, A.; Möhlig, M.; Hoffmann, K.; Bergmann, M.M.; Ristow, M.; Boeing, H.; Pfeiffer, A.F.H. Inflammatory Cytokines and the Risk to Develop Type 2 Diabetes: Results of the Prospective Population-Based European Prospective Investigation into Cancer and Nutrition (EPIC)-Potsdam Study. Diabetes 2003, 52, 812–817. [Google Scholar] [CrossRef] [Green Version]
- Ballak, D.B.; Stienstra, R.; Tack, C.J.; Dinarello, C.A.; van Diepen, J.A. IL-1 Family Members in the Pathogenesis and Treatment of Metabolic Disease: Focus on Adipose Tissue Inflammation and Insulin Resistance. Cytokine 2015, 75, 280–290. [Google Scholar] [CrossRef] [Green Version]
- Cinti, S.; Mitchell, G.; Barbatelli, G.; Murano, I.; Ceresi, E.; Faloia, E.; Wang, S.; Fortier, M.; Greenberg, A.S.; Obin, M.S. Adipocyte Death Defines Macrophage Localization and Function in Adipose Tissue of Obese Mice and Humans. J. Lipid Res. 2005, 46, 2347–2355. [Google Scholar] [CrossRef] [Green Version]
- Bent, R.; Moll, L.; Grabbe, S.; Bros, M. Interleukin-1 Beta—A Friend or Foe in Malignancies? Int. J. Mol. Sci. 2018, 19, 2155. [Google Scholar] [CrossRef] [PubMed] [Green Version]
- Chybicka, A.; Bogusławska-Jaworska, J. Interleukin-1 Production in Childhood Acute Lymphoblastic Leukemia during Chemo- and Radiotherapy According to BFM (Berlin-Frankfurt-Münster) Protocol. Haematol. Blood Transfus. 1990, 33, 72–75. [Google Scholar] [CrossRef] [PubMed]
- Bomfim, E.D.O.; Anatriello, E.; Nunes, M.D.R.; Moraes, J.C.; Cintra, M.M.; Lopes-Junior, L.C.; Miyauti, M.; Nascimento, L.C.; de Lima, R.A.G.; Floria-Santos, M. Correlations between Functional Interleukin-1 and Changes in Fatigue and Quality of Life in Children and Adolescents with Cancer. J. Clin. Oncol. 2015, 33. [Google Scholar] [CrossRef]
- Berdat, P.A.; Wehrle, T.J.; Küng, A.; Achermann, F.; Sutter, M.; Carrel, T.P.; Nydegger, U.E. Age-Specific Analysis of Normal Cytokine Levels in Healthy Infants. Clin. Chem. Lab. Med. 2003, 41, 1335–1339. [Google Scholar] [CrossRef] [PubMed]
- Hirano, T. IL-6 in Inflammation, Autoimmunity and Cancer. Int. Immunol. 2021, 33, 127–148. [Google Scholar] [CrossRef] [PubMed]
- Tanaka, T.; Narazaki, M.; Kishimoto, T. IL-6 in Inflammation, Immunity, and Disease. Cold Spring Harb. Perspect. Biol. 2014, 6, a016295. [Google Scholar] [CrossRef] [PubMed]
- Harmer, D.; Falank, C.; Reagan, M.R. Interleukin-6 Interweaves the Bone Marrow Microenvironment, Bone Loss, and Multiple Myeloma. Front. Endocrinol. 2018, 9, 788. [Google Scholar] [CrossRef] [Green Version]
- Testa, R.; Olivieri, F.; Bonfigli, A.R.; Sirolla, C.; Boemi, M.; Marchegiani, F.; Marra, M.; Cenerelli, S.; Antonicelli, R.; Dolci, A.; et al. Interleukin-6-174 G > C Polymorphism Affects the Association between IL-6 Plasma Levels and Insulin Resistance in Type 2 Diabetic Patients. Diabetes Res. Clin. Pract. 2006, 71, 299–305. [Google Scholar] [CrossRef]
- Eckel, R.H.; Grundy, S.M.; Zimmet, P.Z. The Metabolic Syndrome. Lancet 2005, 365, 1415–1428. [Google Scholar] [CrossRef]
- Obesity-Induced TNFα and IL-6 Signaling: The Missing Link between Obesity and Inflammation-Driven Liver and Colorectal Cancers—PubMed. Available online: https://pubmed.ncbi.nlm.nih.gov/30591653/ (accessed on 6 April 2022).
- Tian, G.; Mi, J.; Wei, X.; Zhao, D.; Qiao, L.; Yang, C.; Li, X.; Zhang, S.; Li, X.; Wang, B. Circulating Interleukin-6 and Cancer: A Meta-Analysis Using Mendelian Randomization. Sci. Rep. 2015, 5, 11394. [Google Scholar] [CrossRef] [Green Version]
- Egler, R.A.; Burlingame, S.M.; Nuchtern, J.G.; Russell, H.V. Interleukin-6 and Soluble Interleukin-6 Receptor Levels as Markers of Disease Extent and Prognosis in Neuroblastoma. Clin. Cancer Res. 2008, 14, 7028–7034. [Google Scholar] [CrossRef] [PubMed] [Green Version]
- Stevens, A.M.; Miller, J.M.; Munoz, J.O.; Gaikwad, A.S.; Redell, M.S. Interleukin-6 Levels Predict Event-Free Survival in Pediatric AML and Suggest a Mechanism of Chemotherapy Resistance. Blood Adv. 2017, 1, 1387–1397. [Google Scholar] [CrossRef] [PubMed] [Green Version]
- Jialal, I.; Barton Duell, P. Diagnosis of Familial Hypercholesterolemia. Am. J. Clin. Pathol. 2016, 145, 437–439. [Google Scholar] [CrossRef] [PubMed] [Green Version]
- Devaraj, S.; Semaan, J.R.; Jialal, I. Biochemistry, Apolipoprotein B. In StatPearls; StatPearls Publishing: Treasure Island, FL, USA, 2022. [Google Scholar]
- Nakajima, K.; Nakano, T.; Tokita, Y.; Nagamine, T.; Inazu, A.; Kobayashi, J.; Mabuchi, H.; Stanhope, K.L.; Havel, P.J.; Okazaki, M.; et al. Postprandial Lipoprotein Metabolism: VLDL vs Chylomicrons. Clin. Chim. Acta 2011, 412, 1306–1318. [Google Scholar] [CrossRef] [Green Version]
- Behbodikhah, J.; Ahmed, S.; Elyasi, A.; Kasselman, L.J.; De Leon, J.; Glass, A.D.; Reiss, A.B. Apolipoprotein B and Cardiovascular Disease: Biomarker and Potential Therapeutic Target. Metabolites 2021, 11, 690. [Google Scholar] [CrossRef]
- Walldius, G.; Jungner, I.; Holme, I.; Aastveit, A.H.; Kolar, W.; Steiner, E. High Apolipoprotein B, Low Apolipoprotein A-I, and Improvement in the Prediction of Fatal Myocardial Infarction (AMORIS Study): A Prospective Study. Lancet 2001, 358, 2026–2033. [Google Scholar] [CrossRef]
- Williams, K.; Sniderman, A.D.; Sattar, N.; D’Agostino, R., Jr.; Wagenknecht, L.E.; Haffner, S.M. Comparison of the Associations of Apolipoprotein B and Low-Density Lipoprotein Cholesterol with Other Cardiovascular Risk Factors in the Insulin Resistance Atherosclerosis Study (IRAS). Circulation 2003, 108, 2312–2316. [Google Scholar] [CrossRef] [Green Version]
- Salomaa, V.; Havulinna, A.; Saarela, O.; Zeller, T.; Jousilahti, P.; Jula, A.; Muenzel, T.; Aromaa, A.; Evans, A.; Kuulasmaa, K.; et al. Thirty-One Novel Biomarkers as Predictors for Clinically Incident Diabetes. PLoS ONE 2010, 5, e10100. [Google Scholar] [CrossRef] [Green Version]
- Broberg, O.; Øra, I.; Wiebe, T.; Weismann, C.G.; Liuba, P. Characterization of Cardiac, Vascular, and Metabolic Changes in Young Childhood Cancer Survivors. Front. Pediatr. 2021, 9, 764679. [Google Scholar] [CrossRef]
- Morel, S.; Leahy, J.; Fournier, M.; Lamarche, B.; Garofalo, C.; Grimard, G.; Poulain, F.; Delvin, E.; Laverdière, C.; Krajinovic, M.; et al. Lipid and Lipoprotein Abnormalities in Acute Lymphoblastic Leukemia Survivors. J. Lipid Res. 2017, 58, 982–993. [Google Scholar] [CrossRef] [Green Version]
- Cao, J.; Steffen, B.T.; Guan, W.; Remaley, A.T.; McConnell, J.P.; Palamalai, V.; Tsai, M.Y. A Comparison of Three Apolipoprotein B Methods and Their Associations with Incident Coronary Heart Disease Risk over a 12-Year Follow-up Period: The Multi-Ethnic Study of Atherosclerosis. J. Clin. Lipidol. 2018, 12, 300–304. [Google Scholar] [CrossRef] [PubMed]
- Hermans, M.P.; Sacks, F.M.; Ahn, S.A.; Rousseau, M.F. Non-HDL-Cholesterol as Valid Surrogate to Apolipoprotein B100 Measurement in Diabetes: Discriminant Ratio and Unbiased Equivalence. Cardiovasc. Diabetol. 2011, 10, 20. [Google Scholar] [CrossRef] [PubMed] [Green Version]
- Hwang, Y.-C.; Ahn, H.-Y.; Lee, W.J.; Park, C.-Y.; Park, S.-W. An Equation to Estimate the Concentration of Serum Apolipoprotein B. PLoS ONE 2012, 7, e51607. [Google Scholar] [CrossRef]
- Yip, P.M.; Chan, M.K.; Nelken, J.; Lepage, N.; Brotea, G.; Adeli, K. Pediatric Reference Intervals for Lipids and Apolipoproteins on the VITROS 5,1 FS Chemistry System. Clin. Biochem. 2006, 39, 978–983. [Google Scholar] [CrossRef] [PubMed]
- Albers, J.J.; Kennedy, H.; Marcovina, S.M. Evidence That Lp[a] Contains One Molecule of Apo[a] and One Molecule of ApoB: Evaluation of Amino Acid Analysis Data. J. Lipid Res. 1996, 37, 192–196. [Google Scholar] [CrossRef]
- Brown, M.S.; Goldstein, J.L. Plasma Lipoproteins: Teaching Old Dogmas New Tricks. Nature 1987, 330, 113–114. [Google Scholar] [CrossRef]
- Saeed, A.; Virani, S.S. Lipoprotein(a) and Cardiovascular Disease: Current State and Future Directions for an Enigmatic Lipoprotein. Front. Biosci. Landmark Ed. 2018, 23, 1099–1112. [Google Scholar] [CrossRef] [Green Version]
- Waldeyer, C.; Makarova, N.; Zeller, T.; Schnabel, R.B.; Brunner, F.J.; Jørgensen, T.; Linneberg, A.; Niiranen, T.; Salomaa, V.; Jousilahti, P.; et al. Lipoprotein(a) and the Risk of Cardiovascular Disease in the European Population: Results from the BiomarCaRE Consortium. Eur. Heart J. 2017, 38, 2490–2498. [Google Scholar] [CrossRef] [Green Version]
- Bermúdez, V.; Rojas, J.; Salazar, J.; Bello, L.; Añez, R.; Toledo, A.; Chacín, M.; Aguirre, M.; Villalobos, M.; Chávez, M.; et al. Variations of Lipoprotein(a) Levels in the Metabolic Syndrome: A Report from the Maracaibo City Metabolic Syndrome Prevalence Study. J. Diabetes Res. 2013, 2013, 416451. [Google Scholar] [CrossRef] [Green Version]
- Paredes, S.; Fonseca, L.; Ribeiro, L.; Ramos, H.; Oliveira, J.C.; Palma, I. Novel and Traditional Lipid Profiles in Metabolic Syndrome Reveal a High Atherogenicity. Sci. Rep. 2019, 9, 11792. [Google Scholar] [CrossRef] [Green Version]
- Cegla, J.; France, M.; Marcovina, S.M.; Neely, R.D.G. Lp(a): When and How to Measure It. Ann. Clin. Biochem. 2021, 58, 16–21. [Google Scholar] [CrossRef] [PubMed]
- Langer, C.; Tambyrayah, B.; Thedieck, S.; Nowak-Göttl, U. Testing for Lipoprotein(a) Concentration and Apolipoprotein(a) Phenotypes: Method Standardization and Pediatric Reference Values. Semin. Thromb. Hemost. 2011, 37, 810–813. [Google Scholar] [CrossRef] [PubMed]
- Temtanakitpaisan, Y.; Saengnipanthkul, S. Monitoring of Metabolic Syndrome and Cardiovascular Disease in Childhood Cancer Survivors. J. Adolesc. Young Adult Oncol. 2022, 11, 17–26. [Google Scholar] [CrossRef] [PubMed]

| Biomarkers | Structure | Production Site | Mechanisms of Involvement in MetS | Changes in MetS |
|---|---|---|---|---|
| Adiponectin | Protein | Adipose tissue Cardiac and skeletal tissue | ↑Insulin sensivity ↑Intracellular glucose transport ↑Oxidation of fatty acids ↓ROS and hs-CRP ↓Gluconeogenesis | Reduced |
| Leptin | Protein | Adipose tissue | ↓Appetite | Increased (Leptin receptor resistance) |
| Uric Acid | Product of purine metabolism | All cells | ↑ROS ↑Inflammatory cytokines ↑Insulin resistance ↑Dyslipidemia | Increased |
| hs-CRP | Protein | Liver cells | ↑Inflammation ↑ROS | Increased |
| TNF-α | Cytokine | Immune and non-immune cells | ↑Hepatic lipid synthesis ↑Adipose lipolisis ↑Cholesterol biosynthesis ↑Inflammation ↑Vascular insulin resistance | Increased |
| IL-1 | Cytokine | Immune and non-immune cells | ↑Inflammation ↑Insulin resistance | Increased |
| IL-6 | Cytokine | Immune cells Osteoblasts Muscle cells | ↑Inflammation ↑Insulin resistance ↑Plasma glucose ↑Free fatty acids | Increased |
| Apo B | Transporter protein | Liver cells | ↑Atherosclerosis | Increased |
| Lp (a) | Transporter protein | Liver cells | ↑Inflammation ↑Atherosclerosis ↑Vascular muscle cells proliferation ↓Fibrinolisis | Increased |
Publisher’s Note: MDPI stays neutral with regard to jurisdictional claims in published maps and institutional affiliations. |
© 2022 by the authors. Licensee MDPI, Basel, Switzerland. This article is an open access article distributed under the terms and conditions of the Creative Commons Attribution (CC BY) license (https://creativecommons.org/licenses/by/4.0/).
Share and Cite
Romano, A.; Del Vescovo, E.; Rivetti, S.; Triarico, S.; Attinà, G.; Mastrangelo, S.; Maurizi, P.; Ruggiero, A. Biomarkers Predictive of Metabolic Syndrome and Cardiovascular Disease in Childhood Cancer Survivors. J. Pers. Med. 2022, 12, 880. https://doi.org/10.3390/jpm12060880
Romano A, Del Vescovo E, Rivetti S, Triarico S, Attinà G, Mastrangelo S, Maurizi P, Ruggiero A. Biomarkers Predictive of Metabolic Syndrome and Cardiovascular Disease in Childhood Cancer Survivors. Journal of Personalized Medicine. 2022; 12(6):880. https://doi.org/10.3390/jpm12060880
Chicago/Turabian StyleRomano, Alberto, Ester Del Vescovo, Serena Rivetti, Silvia Triarico, Giorgio Attinà, Stefano Mastrangelo, Palma Maurizi, and Antonio Ruggiero. 2022. "Biomarkers Predictive of Metabolic Syndrome and Cardiovascular Disease in Childhood Cancer Survivors" Journal of Personalized Medicine 12, no. 6: 880. https://doi.org/10.3390/jpm12060880
APA StyleRomano, A., Del Vescovo, E., Rivetti, S., Triarico, S., Attinà, G., Mastrangelo, S., Maurizi, P., & Ruggiero, A. (2022). Biomarkers Predictive of Metabolic Syndrome and Cardiovascular Disease in Childhood Cancer Survivors. Journal of Personalized Medicine, 12(6), 880. https://doi.org/10.3390/jpm12060880