Abstract
Amyotrophic lateral sclerosis (ALS) is a multi-system neurodegenerative disease that affects both upper and lower motor neurons, resulting from a combination of genetic, environmental, and lifestyle factors. Usually, the association between single-nucleotide polymorphisms (SNPs) and this disease is tested individually, which leads to the testing of multiple hypotheses. In addition, this classical approach does not support the detection of interaction-dependent SNPs. We applied a two-step procedure to select SNPs and pairwise interactions associated with ALS. SNP data from 276 ALS patients and 268 controls were analyzed by a two-step group LASSO in 2000 iterations. In the first step, we fitted a group LASSO model to a bootstrap sample and a random subset of predictors () from the original data set aiming to screen for important SNPs and, in the second step, we fitted a hierarchical group LASSO model to evaluate pairwise interactions. An in silico analysis was performed on a set of variables, which were prioritized according to their bootstrap selection frequency. We identified seven SNPs (rs16984239, rs10459680, rs1436918, rs1037666, rs4552942, rs10773543, and rs2241493) and two pairwise interactions (rs16984239:rs2118657 and rs16984239:rs3172469) potentially involved in nervous system conservation and function. These results may contribute to the understanding of ALS pathogenesis, its diagnosis, and therapeutic strategy improvement.
1. Introduction
Amyotrophic lateral sclerosis (ALS) is a multisystem neurodegenerative disease that affects both upper and lower motor neurons, causing progressive loss of muscle strength and paralysis [1,2]. Its phenotype is heterogeneous, as is the disease progression and median survival time after onset, possibly as a combination of genetic, environmental, and lifestyle risk factors [3,4]. Most ALS cases occur in adult life, near 55 years of age, predominantly among men, and have no relation to familial history. Currently, there are no reliable molecular biomarkers that enable the screening or early diagnosis of ALS, which is dependent on the clinical manifestation of the disease, which takes place when a great number of motor neurons have already been affected [5]. The El Escorial revised criteria [6] are widely used for patient classification according to different levels of diagnostic certainty, namely suspected, possible, probable, and definite ALS, mainly to ensure uniformity in clinical trials. Complementary investigation can be conducted through electrophysiological study and neuroimaging [6]. Regarding pharmacological treatment, available options contribute to increased short-term survival and reduced paralysis rate but are not effective in stopping or reversing the progression of the disease [5].
Studies dedicated to understanding the genetic characteristics of the disease can contribute not only to the comprehension of its etiology but also to the development of diagnostic tests and therapies. Genome-wide association studies (GWAS) are the most common approach to detecting relationships between genetic variants (frequently, a single-nucleotide polymorphism—SNP) and disease occurrence [7]. Since SNP data sets imply high-dimensional scenarios, where the number of variables is much larger than the sample size, a genetic model to identify genotype-phenotype relationships will be over-parameterized. For this reason, the association of each SNP with the disease is tested individually in most cases [8].
Analyses focused on one genetic variant at a time lead to a great number of simultaneous hypothesis tests, requiring control for family-wise error rate or false-discovery rates, such as Bonferroni and Benjamin–Hochberg, respectively, although the former is too conservative and the latter, less stringent [9], both heavily reduce findings with statistical significance. Additionally, the assessment of individual SNP effects does not support the detection of SNPs that are dependent on genetic interactions [7]. The body of evidence on the role of main and interaction effects in ALS genetic architecture is still under development because analyzing multiple variables at once or including genetic interactions in genotype-phenotype association models entails challenges related to the computational complexity and scalability of the methods, as well as with the accuracy and interpretability of the results.
We aim to overcome these issues by iteratively applying a two-step group LASSO procedure to select SNPs and pairwise interactions in a case-control ALS study. This approach has additional benefits for high-dimensional data composed of multi-level factors and a binary response since group LASSO makes it possible to encode each level of a factor or a pairwise interaction using a dummy variable and generating coefficients with direct interpretation [10]. By iteratively incorporating data perturbation into the analysis, using bootstrap samples together with a random subset of the predictors from the original data set, it is possible to deal with highly correlated variables [11] and derive a measure of importance for both individual SNPs and pairwise interactions [10]. Finally, by analyzing many variables simultaneously through regularized models, it is possible to consider potential association structures between variables, such as pairwise interactions between SNPs located in different genome regions.
The manuscript is organized as follows: first, we review the logistic regression models, LASSO and group LASSO methodologies, as well as pairwise interaction models with and without regularization. Then, we describe the implementation of our iterative approach, presenting the main results regarding variables and pairwise interaction selections, as well as their biological implications.
2. Materials and Methods
2.1. Data Set
We analyzed SNP data from ALS patients and controls from the National Institute of Neurological Disorders and Stroke Repository. The data set is available for download from the database of Genotypes and Phenotypes (dbGaP). Its first version includes genotype measurements of 555,352 SNPs from 276 individuals from the United States of America diagnosed with sporadic ALS (Supplementary Table S1) and 268 neurologically healthy controls [12]. Only patients classified as having possible, probable, and clinically probable laboratory-supported or definite ALS, according to El Escorial criteria [6], and those without a reported family history of ALS, were included in the study, as described by Schymick et al. (2007) [12]. Detailed information on data acquisition is available in the declaration section.
In our analysis, the response variable was represented by the presence or absence of ALS, i.e., and each SNP refers to a polymorphic genetic locus characterized by two possible alleles, conventionally referred to as and . An individual’s genotype at a marker, in turn, is denoted by the pair of alleles at a location and is represented as a three-level factor with possible values [13]. We recode SNPs according to the number of minor alleles, i.e , representing those alleles least frequent in the data set analyzed.
2.2. Genetic Model
A logistic regression model can be used to develop a genetic model aiming to understand how a predictor, i.e, an SNP, is associated with a qualitative phenotype on a genome-wide scale. Given a collection of N observations, a response variable, Y, and a set of predictors, …, the general form of this model can be represented by
where is an intercept term, and is the vector of regression coefficients. A transformed version of is given by the following model:
The unknown coefficients and … are then estimated by maximizing the likelihood or, equivalently, by minimizing the negative log-likelihood function. For N observations, the log-likelihood function is given by:
In a high-dimensional scenario, where the number of predictors, p, is much larger than the sample size, N, a relatively small number of predictors is expected to be associated with the response variable. Regularization methods can be used to modify the log-likelihood function in order to shrink to 0 those coefficients related to predictors that do not play an important role in the disease occurrence, resulting in a smaller subset of predictors [14].
2.3. LASSO
The least absolute shrinkage and selection operator (LASSO) is a popular technique for variable selection in high-dimensional scenarios [15]. This approach is applied to fitting models based on minimizing a regularized version of the negative log-likelihood function [13],
where is a positive constant that controls the amount of regularization, and consequently, the number of selected predictors [14].
2.4. Group LASSO
In our application, we have a large number of multi-level factors as predictors, whose contribution to the linear model can be expressed through G groups of dummy variables, , …, where indicates the number of levels for a particular factor g. From this representation, a model for involving G group variables … will take the form
where is an intercept term and is the vector of coefficients for the gth group. In such settings, for N observations, the maximum likelihood estimators of the coefficients and … are obtained by minimizing the negative of the following log-likelihood function
subject to the restriction .
Aiming at selecting variables represented by groups of dummy variables, it is desirable to jointly select or omit all the coefficients within a group. Therefore, instead of using LASSO, which may select individual dummies rather than the entire factor [14], a group LASSO approach [16,17] can be applied to estimate as the solution to the minimization of the negative log-likelihood function over sums of -penalties:
where is the Euclidean norm of the vector , assuming all groups will be equally penalized [17].
The -norm ensures a sum-to-zero constraint in the dummy variable coefficients representing a multi-level factor, and the group variable selection is dictated by the penalty parameter () that regularizes the sum over group coefficients. Since our data set is composed only of multi-level factors, we applied the group LASSO algorithm to select a candidate set of SNPs associated with the ALS phenotype.
2.5. Pairwise Interaction Model
To evaluate not only main effects but also interactions between any two group variables, and , we modified the model presented in by including interaction terms, . In doing so, we have
and the log-likelihood function
subject to the following restrictions for main and pairwise interaction effects, respectively: , and and .
2.6. Hierarchical Group LASSO Regularization
Variable selection using the group LASSO method described previously can be extended to incorporate pairwise interactions. Thus, the model is fitted by minimizing:
In our application, we considered all pairwise interactions within the selected candidate set of SNPs through a logistic regression pairwise interaction model via hierarchical group LASSO regularization [17].
2.7. Implementation
Based on variable selection procedures described in the random LASSO [11], recursive random LASSO [18], and high-dimensional LASSO [19] approaches, we performed 2000 iterations of a two-step analysis to search for SNPs and pairwise interactions associated with the ALS phenotype (Supplementary Figure S1).
As the first step of each iteration, we used a bootstrap sample and a random subset of the predictors () (candidate variables) from the original data set to fit a group LASSO model aiming to screen for important SNPs, thus restricting the pairwise interaction search space. In the second step, we applied the hierarchical group LASSO regularization method in order to consider pairwise interactions between all the selected predictors.
Both group LASSO and hierarchical group LASSO regularization were computed at 50 values. The best value for this parameter was obtained using a 10-fold cross validation process. We chose the largest value of whose cross-validation error was within one standard error of the minimum, which was then used to fit the model for the corresponding iteration [13].
Next, we describe how the threshold for variable selection in the first step was defined. Since we randomly selected of predictors to adjust a group LASSO in each iteration, the probability of a SNP, , …, to be included in the analysis is and the expected number of inclusions of in 2000 iterations is (Supplementary Figure S2). The number of selections for each predictor, in turn, will depend not only on its degree of association with the response variable but also on the other predictors considered in the model fit. Therefore, those SNPs with a selection frequency of or more, i.e., approximately 350 selections in 500 inclusions, were prioritized for the functional analysis.
Regarding pairwise interactions, according to our approach, an interaction will be evaluated only for SNPs that were jointly selected in the first step. The probability of any two SNPs, , … and , to be included in the first step is . Thus, the expected number of inclusions in 2000 iterations is (Supplementary Figure S3). The number of selections of any two SNPs will depend on their effects given the other predictors in the model. Thus, we were more permissive in choosing cut-off points in this context. For any SNPs jointly selected at least of the time in the first step, i.e., approximately 60 selections in 125 inclusions, we evaluated the frequency of pairwise interaction selection in the second step. Pairwise interactions with a selection frequency of at least , that is, 30 selections in 60 inclusions in the interaction search model, were considered for the functional analysis.
2.8. Descriptive and Analytical Statistics
For prioritized SNPs and pairwise interactions, we estimated the crude odds ratio (OR) and the correspondent confidence interval (CI) by adjusting a logistic regression model on the original data. The log-likelihood ratio test (LRT) was used to evaluate the significance of the selected interactions. A p-value was considered statistically significant for the logistic regression model and the LRT. The statistical analysis was repeated for the following ALS disease subgroups, defined according to (1) El Escorial criteria [6]—definite or probable/laboratory probable; (2) site of symptom onset—bulbar or limb; (3) age at symptom onset—less than or equal to 45 years or more than or equal to 65 years. All ALS disease subgroups were compared with the control group (n = 271).
Descriptive results from the iterative process, such as the number of selected SNPs in each iteration and group LASSO estimated coefficients for the prioritized SNPs are presented. Analyses were performed using the R software, and the model fit was determined through group LASSO penalized learning using a unified blockwise-majorization-descent algorithm (gglasso) and learning interactions via hierarchical group LASSO regularization (glinternet) packages.
2.9. In Silico Analysis
We annotated the prioritized SNPs, both on the first and second steps, with UCSC [20] and Ensembl [21] genome browsers. The possible structural and regulatory impacts of these genetic variants and their expression quantitative trait loci (eQTL) effects were identified from HaploReg [22], RegulomeDB [23], LDlink [24], dbSNP [25], GTEx Portal [26], and Protein atlas [27] web tools.
3. Results and Discussion
We performed quality control (QC) on genotype data to include SNPs with complete genotyping call rate, minor allele frequency and Hardy–Weinberg equilibrium p-value < for controls. In addition, we pruned SNP panels based on linkage disequilibrium via sliding windows, according to PLINK software implementation (a window size in variant count equal to 10, step size equal to 10, corresponding to a variant count to shift the window, and threshold based on correlations between genotype allele counts equal to ). After genotype QC, the data set comprised 254,293 SNPs (group variables) for variable selection. From those, 252,252 SNPs were represented by three dummy variables (i.e., those presenting the three genotypes), and 2041 SNPs by two dummies.
3.1. Variable Selection
The distribution of the number of selected variables in 2000 iterations is shown in Supplementary Figure S4. The corresponding minimum, median, and maximum values were 141, 187, and 226 SNPs, respectively. From 254,293 variables, were never selected when included in the group LASSO model, reinforcing its sparseness, and the hypothesis that only a small set of SNPs is important in explaining the outcome of interest [13].
Variable selection reduces the computational burden for pairwise interaction searches. Bootstrap analysis, in turn, can be applied to assess the stability of selected variables, contributing to variable importance evaluation [28]. We prioritized seven variables for the in silico analysis (Figure 1). For these variables, the minimum, median and maximum number of selections in approximately 500 inclusions in model fit were 345, 358, and 412, respectively.
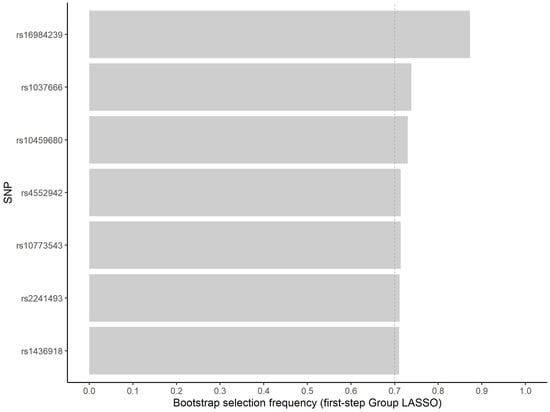
Figure 1.
Frequency of non-zero estimated coefficient for the seven most frequently selected variants in the first step group LASSO regularization.
The distribution of the group LASSO estimated coefficients for the categories of these SNPs is presented in Figure 2. For three of them (rs16984239, rs10459680, and rs1436918), having one copy for the minor allele resulted in a positive coefficient estimate (increased odds of ALS). On the other hand, for the SNPs rs1037666, rs4552942, rs10773543, and rs2241493 having one copy for the minor allele presented a negative coefficient. Additionally, for rs1037666 and rs1436918 SNPs, having two copies for the minor allele also resulted in a negative coefficient. It is important to note that these estimates are adjusted for other SNPs considered together in the model fit in the corresponding iteration.
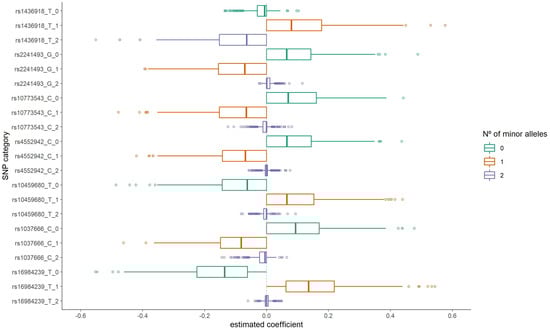
Figure 2.
Distribution of the estimated coefficients for the seven most frequently selected variants in the first step group LASSO regularization.
Table 1 shows the estimated crude odds ratio (OR) for these seven SNPs according to the original data set, revealing results similar to those presented in Figure 2. Briefly, considering the absence of minor allele copies as our reference category, the presence of one copy for the minor alleles rs16984239 A (OR = ; CI: ), rs10459680 T (OR = ; CI: ), and rs1436918 A (OR = ; CI: ) can increase susceptibility to ALS. On the other hand, carrying rs4552942 C (OR = ; CI: ), rs10773543 G (OR = ; CI: ), rs2241493 G (OR = ; CI: ) and rs1037666 C (OR = ; CI: ) single alleles, as well as rs1037666 CC (OR = ; CI: ) and rs1436918 AA (OR = ; CI: ) genotypes, can decrease susceptibility to ALS.

Table 1.
Non-adjusted odds ratio for amyotrophic lateral sclerosis according to the prioritized single-nucleotide polymorphisms in the first step of the group LASSO regularization.
The effect of many genetic variants on the occurrence of the disease in humans is currently unknown. However, any variant can interfere with normal biological function and cause disease at different levels of severity [29]. Thus, we characterized the selected SNPs according to (1) their position in the genome; (2) their genomic context—genes and nature of the region (Table 2), and (3) their potential biological implications. We also searched for previous studies relating the SNP to ALS susceptibility. Below, we detail the main functional characteristics of the regions in which these SNPs are located.
Table 2.
Genome position and genomic context of the selected single-nucleotide polymorphisms.
In a review of the molecular and cellular mechanisms involved in the pathogenesis of ALS, Le Gall et al. (2020) [43] highlighted the following pathways: oxidative stress, mitochondrial dysfunction, axonal transport, glutamate excitotoxicity, endosomal and vesicular secretions, protein homeostasis, and RNA metabolism. The authors emphasized the relationship between defects in these pathways, which are responsible for exacerbating disruption of cellular homeostasis and, consequently, microglial activation, neuroinflammation, astrocytosis, motor neuron death, and muscle denervation.
Our analysis revealed two SNPs related to genes in the biological process of ion transport, rs16984239 and the rs2241493. The former occurs in a genomic region near the potassium voltage-gated channel modifier subfamily S member 3 (KCNS3) gene. This SNP was also highlighted by other authors who analyzed the ALS SNP data set provided by Schymick et al. (2007) [12], as described in Table 2. The latter is a missense polymorphism affecting a protein encoded by the transient receptor potential cation channel subfamily M member 1 (TRPM1) gene. Additionally, this SNP induces a substitution of serine (AGC) amino acid by isoleucine (ATC), threonine (ACC), or asparagine (AAC) according to the dbSNP database [25] (Supplementary Figure S5), which might imply variations in pKa levels, leading to different electrical states depending on the pH of the medium.
The KCNS3 gene has a widespread tissue distribution [44] but is highly expressed in the lungs, according to the GTex Portal [26]. The main functions of voltage-gated potassium channels are the resting membrane potential regulation and the shape and frequency control of action potentials. The KCNS3 protein is not functional by itself but modulates the activation and deactivation rates of other potassium voltage-gated channel proteins [45]. The TRPM1 gene is highly expressed in testicular and skin tissues, according to the GTex Portal [26] and encodes a protein that forms non-selective divalent cation-conducting channels responsible for membrane depolarization [27]. This gene plays a role in visual pathways and is expressed in retina center-ON bipolar neurons and melanocytes [46].
In addition, two SNPs associated with actin cytoskeleton organization were prioritized for the in silico analysis. The rs1037666 is located in the intron 4 of the Formin-2 (FMN2) gene, which has an actin-binding molecular function, and the rs10773543 is located within intron 2 of the transmembrane protein 132C (TMEM132C) gene.
The FMN2 protein plays an important role in the organization of the actin cytoskeleton and in cell polarity [27]. It is highly expressed in the fetal brain and in all tissues of the adult central nervous system, acting on cytoskeletal processes during axonal growth, migration, and synapse formation [47]. As suggested by Law et al. (2014) [48], this protein seems to regulate actin cytoskeleton formation during spinal development, maturation, or remodeling, with implications for neuronal functions that mediate higher cognition in humans. In addition, Mutalik (2018) [49] explored the role of FMN2 in the organization of actin structures in neuronal growth cones, demonstrating its essential function in neuronal regeneration.
Transmembrane proteins are responsible for maintaining cell junctions in the central nervous system. The TMEM132 family of proteins has a cell adhesion function, connecting the extracellular environment with the intracellular actin cytoskeleton, thus playing an important role in the regulation of changes in the morphology, motility, and migration of neuronal cells [50]. However, the specific role of TMEM132C is still poorly understood.
Two other selected SNPs are located in intronic regions. The rs10459680 SNP is located within intron 4 of the LOC101927025 non-coding gene, and is genomically close to the repulsive-guidance molecule (RGM) bone morphogenetic protein (BMP) co-receptor A (RGMA) gene, according to the HaploReg webtool [22]. The RGMA protein is a member of the RGM family that plays several roles in the central nervous system, such as neural tube closure, neurite outgrowth, cortical neuron branching inhibition, and mature synapse formation [27]. In particular, RGMA regulates repulsive axonal guidance and neuronal survival via neogenin-1 binding [51], and alterations in its expression and function have been previously related to central nervous system diseases, such as multiple sclerosis, spinal cord injury, and Parkinson’s disease [52].
The rs4552942 SNP is located within intron 1 of the long intergenic non-protein coding RNA 2055 (LINC02055) gene, according to the Ensembl genome browser [21]. This long non-coding RNA has a diversified distribution, with high expression in testis and frontal cortex tissues, as indicated by the GTEx portal [26]. We could not find any literature regarding the biological implications of the LINC02055 gene. Nonetheless, by analyzing the ALS SNP data set provided by Schymick et al. (2007) [12], Sha et al. (2009) [30] prioritized the rs12680546 SNP as an interaction pair (p-value = ), which in turn is in high linkage disequilibrium with rs4552942 ().
We also prioritized the rs1436918 SNP, which is within a regulatory region genomically close to the golgin A8 family member B (GOLGA8B) gene, according to the HaploReg webtool [22]. The GOLGA8B gene is a member of the Golgin family and is part of the Golgin matrix [53]. It is highly expressed in thyroid and brain tissues, mainly in the cerebellum and the cerebellar hemisphere tissue. Interestingly, the rs1436918 GG genotype was associated with increased GOLGA8B expression in skeletal muscle, according to eQTL expression level analysis [26]. Despite the known histological evidence of Golgi apparatus fragmentation in motor neurons of ALS patients [54,55], the GOLGA8B protein has not yet been described as related to ALS pathogenesis.
3.2. Pairwise Interaction Selection
A genetic interaction refers to any type of interaction between segments of the genome, which can occur at different levels of the biological system, from the direct relation of genes to the physical interaction of proteins and the physiological interaction of different metabolic pathways, all of which can have beneficial or harmful implications for the overall expression of a phenotype [56].
The distribution of the number of selected pairwise interactions in 2000 iterations is presented in Supplementary Figure S6. The corresponding minimum, median, and maximum values were 141, 187, and 226 pairwise interactions, respectively. The rs16984239:rs2118657 and rs16984239:rs3172469 interactions were both selected 37 times from 58 and 69 s step model fits, respectively, and were considered for the in silico analysis. Figure 3 shows the distribution of the estimated coefficient for each category of these pairwise interactions. They have a similar pattern, with negative coefficients for the absence of the minor allele on both SNPs and coefficients of approximately zero for two minor alleles on both SNPs.
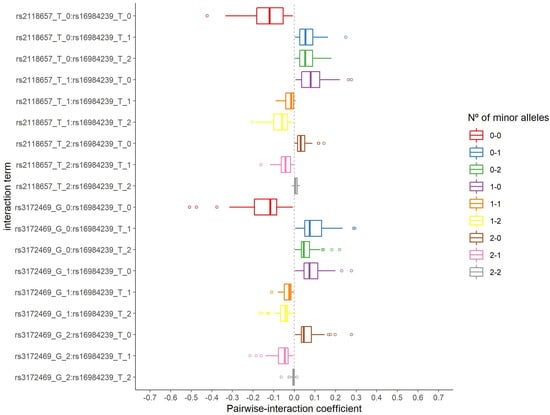
Figure 3.
Distribution of the estimated coefficients for the two pairwise interactions selected in the second step group LASSO regularization.
Table 3 presents the relationship of the rs16984239 with ALS in the strata of its interaction pairs, based on the original data set. Such analysis was performed to describe the effect of each genotype combination on the odds of having ALS. Considering the absence of the minor allele as the reference category, the rs16984239 A allele can increase ALS susceptibility in the following strata: both rs2118657 (OR = ; CI:) and rs3172469 (OR = ; CI:) absence of the minor allele, and rs2118657 T (OR = ; CI:) and rs3172469 G (OR = ; CI:) single alleles.
Table 3.
Non-adjusted odds ratio for amyotrophic lateral sclerosis according to the selected pairwise interactions in the second step group LASSO regularization.
In addition, the rs16984239 AA genotype showed greater odds of ALS in the absence of the minor allele for rs2118657, albeit with a wide confidence interval, due to the small sample size for this combination of genotypes (OR = ; CI:). The result was in the opposite direction for the rs2118657 T single allele stratum, although it was not statistically significant (OR = ; CI:). Finally, as the presence of two minor allele genotypes was a rare event, there were no individuals in the category corresponding to this combination of genotypes for both interactions analyzed.
We applied a likelihood ratio test (LRT) to evaluate these interactions. Only the pairwise interaction rs16984239:rs2118657 was statistically significant (p-value = ). For the pairwise interaction rs16984239:rs3172469, the observed LRT p-value was . It should be emphasized that, although not statistically significant, when the interaction results in markedly different estimates (in both magnitude and direction) for the association between a factor and a response variable in the strata specified by its interaction pair, the possibility of a true interaction effect is reinforced. However, such interactions should be evaluated by a study with sufficient statistical power, including a discussion in regard to their biological plausibility [57].
Both the rs2118657 and rs3172469 SNPs are located in chromosome 3 (linkage disequilibrium ). rs2118657 is intergenic, genomically close to the Butyrylcholinesterase (BCHE) gene, which originated from an ancient duplication of acetylcholinesterase (ACHE) in vertebrate evolution [58]. The cholinesterase enzymes are expressed by astrocytes and play an important role in choline-based neurotransmitter degradation. Thus, by preventing synaptic overstimulation, BCHE may be important for neuroprotection, both in the brain and in the neuromuscular junction [58]. Reduced BCHE function can, therefore, lead to the accumulation of neurotransmitters in the synapses, such as glutamate, implying astrocyte toxicity [59]. The glutamate excitotoxicity pathway is well-established in ALS pathogenesis as a consequence of defects in glutamate transport and uptake [43]. Additionally, previous research explored the association between astrocyte toxicity, motor neuron degeneration, and loss of muscle coordination in ALS patients [60].
The rs16984239:rs2118657 interaction pair could represent a relationship between BCHE-KCNS3 proteins, implying a cholinesterase–potassium balance involved in synapse function. BCHE is an important cholinergic regulator present in neurons and motor endplates, which are also rich in potassium-gate regulators, such as KCNS3. Glial protection against neurotoxicity was previously related to potassium balance control [61]. Thus, intracellular potassium imbalance, caused by improper KCNS3 regulation, might lead to cholinesterase inhibition, astrocyte toxicity, and, ultimately, motor neuron degeneration.
The rs3172469 SNP is located in intron 1 of the B-cell lymphoma 6 (BCL6) gene, and encodes a transcriptional repressor that may be involved in the modulation of several metabolic pathways, the most popular being related to B cell activation implied in lymphoma pathogenesis [62]. The BCL6 gene is highly expressed in whole blood, musculoskeletal, and tibial nerve tissues, according to the GTEx Portal [26], and was previously described as a specific gene to spinal motor neurons [63].
The rs16984239:rs3172469 pair could, therefore, be related to a BCL6-KCNS3 protein-gene association, particularly due to the transcriptional repression capabilities of the BCL6 protein and its known presence in spinal motor neurons [63]. Wang et al. (2006) [64] reported a down-regulated expression of BCL6 in ALS post-mortem tissues. Regulatory processes of the BCL6 protein in the KCNS3 gene might imply over-expression of KCNS3, leading to an overstimulation of neuronal synapses, which may contribute to the general loss of coordination and muscle tremor symptoms in the ALS phenotype [1,65].
To assess whether the variability in clinical findings can modify the odds of ALS observed for the prioritized SNPs and pairwise interactions, we evaluated the association between these variables and the presence of ALS in subgroups defined according to El Escorial criteria, as well as age and site of symptom’s onset. In general, the estimated odds ratios showed the same direction as those observed considering the ALS cases together, but with differences in magnitude and statistical significance, possibly due to the smaller sample size in each ALS disease subgroup (Supplementary Tables S2 and S3).
3.3. LASSO and Related Approaches in Variable Selection
Schymick et al. (2007) [12] were the first to evaluate GWAS in ALS. The authors identified 34 SNPs with an unadjusted p-value for single-marker tests. However, p-value correction for multiple comparisons by the Bonferroni method revealed that no SNP maintained statistical significance at the level. Interestingly, six out of the seven variables we prioritized in the first step of our procedure were in this set of variables (only rs2241493 was not highlighted). On the other hand, neither the rs2118657 nor the rs3172469 variants were pointed out by the authors.
Sha et al. (2009) [30] searched for pairwise interactions in the aforementioned ALS SNP data set [12]. Since an exhaustive search through all combinations of genetic variants in the complete data set would be computationally infeasible, the authors applied a two-step procedure aiming to select a set of important genetic variants associated with the ALS phenotype, thus reducing the variable space for pairwise interaction evaluation. The 1000 genetic variants with the lowest p-values for the single-marker test were selected and two pairwise interaction terms were identified in this set: rs4363506:rs3733242 and rs4363506:rs16984239. We also selected pairwise interactions with SNP rs16984239 on the same data set. However, this pair was not evaluated by our approach, because the rs4363506 SNP was excluded in the quality control step (genotype rate ). Additionally, the rs3733242 SNP presented an estimated coefficient equal to 0 on of the times it was included on the first step group LASSO fit and was rarely evaluated on the second step for pairwise interaction.
In addition to single-marker tests, two-step approaches involving multiple regression with regularization to select main [11,18,19] and pairwise interaction effects [10,66,67,68] on high-dimensional data are extremely attractive as they can accommodate correlated variables into the model fit as well as more variables than the sample size. Additionally, two-step approaches can be applied iteratively by using bootstrap samples together with random variable subsets from the original data to derive importance measures for both individual SNPs and pairwise interactions [10,11,18,19]. Finally, by incorporating the group characteristic of the genetic variants in the selection process, the group LASSO solves some disadvantages of the logistic regression model, such as the increasing number of parameters arising from three-level SNP factors and their pairwise interactions [10]. It also improves upon the conventional LASSO approach, which may select individual SNP levels rather than the entire related SNP factor [14].
Combining these different ideas, we iteratively applied the group LASSO method, both for individual SNP (first step) and pairwise interaction (second step) selection, using a cross-validation process to choose the penalty parameter for each model fit. These procedures are integrated since the variables selected in the first step according to a group LASSO fit were evaluated for all possible interactions by a hierarchical group LASSO model at each iteration. Finally, variable importance measures were calculated from the bootstrap selection frequency in 2000 iterations.
Our proposal has limitations. First, it is not possible to test all pairwise interactions in complete SNP data, and some mechanism to reduce its dimension is necessary. Thus, we randomly and iteratively included subsets of variables to fit a regularized model allowing greater variability in the selection of variables in the first step, and consequently, the evaluation of a greater number of pairwise interactions, in the second step. Nonetheless, as a random subset of variables was included in the regularization model in each iteration, a greater variability for the estimated coefficients is also to be expected, since in a regression model the effect of a variable depends on which other variables are considered together. However, the individual SNPs and the selected pairwise interactions presented consistent results for the estimated coefficients in the bootstrap analyses: even with different effect sizes, their signs were preserved, as evidenced in the distributions of the estimated coefficients shown in Figure 2 and Figure 3. Furthermore, the logistic regression fit results shown in Table 2 and Table 3 revealed patterns similar to those from bootstrap analyses.
Our criterion for establishing a final set of variables for further in silico analysis was based on an ad hoc cut-off point for their bootstrap selection frequency. Importantly, all statistical measures have drawbacks, including p-values from logistic regression fits, leave-one-out indices, as proposed by Wu et al. (2007) [69], and p-values from statistical tests applied to genetic variant selection based on bootstrap results, as proposed by Park et al. (2015) [18] and revised by Kim et al. (2019) [19]. These drawbacks are pointed out by their very proponents and mean that these measures are not ideal for determining the global statistical or biological significance of genetic variants. However, all of them, including our approach, can lead to interesting findings that may be replicated and evaluated in subsequent studies and have their biological implications investigated.
The SNP data set analyzed provides limited data regarding the clinical characteristics of ALS patients. Additionally, environmental and lifestyle factors were not investigated. It is known that ALS is a heterogeneous multi-system neurodegenerative disease [2], and its onset may result from a combination of genetic, environmental, and lifestyle factors. Recently, Hop et al. (2022) [70] reported interesting epigenetic findings regarding DNA methylated positions more expressed in ALS patients than in healthy controls, annotated to genes implicated in metabolic, inflammatory, and cholesterol pathways. Furthermore, these methylated positions overlapped with trait-associated positions related to HDL cholesterol, triglyceride concentration, body mass index, and alcohol consumption. Additionally, regarding environmental factors, an up-to-date meta-analysis confirmed the history of trauma, mainly trunk trauma, as a risk factor for ALS [71]. Future studies that incorporate these predictors may help to elucidate other aspects of the pathogenic mechanisms of ALS as well as its treatment and prevention in clinical practice.
4. Conclusions
We selected seven SNPs and two pairwise interactions associated with the ALS phenotype by applying a two-step group LASSO approach and described their biological consequences through in silico analysis. In summary, the biological implications of the selected genetic variants revealed proteins related to membrane potential regulation, Golgi apparatus fragmentation, actin cytoskeleton and cell polarity organization, axon guidance, and neurotransmitter metabolism. rs2241493 is the only SNP in a coding region and is also a missense polymorphism. Therefore, rs2241493 seems to be the most promising candidate for future functional studies. Two pairwise interactions were prioritized for in silico analyses: rs16984239:rs2118657 and rs16984239:rs3172469. Although rs16984239 has been identified by other studies that explored the same ALS SNP data we analyzed, neither rs2118657 nor rs3172469 was previously described as associated with the ALS phenotype. We believe our results may contribute to a better molecular understanding of the ALS phenotype, with the potential to be tested in diagnosis or in therapeutic strategy improvement.
ALS is known to be clinically and genetically highly variable, and future studies aiming to prioritize genetic variants capable of differentiating ALS subgroups can be explored using the approach proposed in the present study. Additionally, ALS is hypothesized to be related not only to genetics but also to environmental and lifestyle factors. Therefore, considering these characteristics as predictors of ALS in future studies may improve the holistic understanding of the mechanisms involved in disease pathogenesis.
Supplementary Materials
The following supporting information can be downloaded at https://www.mdpi.com/article/10.3390/jpm12081330/s1, Figure S1: Flowchart of the iterative two-step group LASSO procedure. Figure S2: Expected number of inclusions of group variables in the first step group LASSO approach, , …, in 2000 iterations. Figure S3: Expected number of inclusions in the first step group LASSO approach for any two group variables, , … and in 2000 iterations. Figure S4: Distribution of the number of selected variants in each iteration of first step group LASSO regularization. Results from 2000 iterations, each related to a group LASSO model from bootstrap samples and a of available variants. Figure S5: TRPM1 protein. (A) Tertiary and secondary structure of a TRPM1 protein. Detail for the amino acid serine related to alterations caused by rs2241493. PDB = AF-Q7Z4N2-F1. (B) Comparison of the chemical structure of serine that is replaced by isoleucine, threonine, or asparagine in rs2241493. Figure S6: Distribution of the number of selected pairwise interactions in each iteration of second step group LASSO regularization. Results from 2000 iterations, each related to a group LASSO regularization model from bootstrap samples and first step selected variants. Table S1: Description of the clinical characteristics of ALS patients (n = 276). Table S2: Non-adjusted odds ratio for ALS disease subgroups (El Escorial criteria, site of symptom onset, and age at symptom onset) according to the prioritized single-nucleotide polymorphisms in the first step group LASSO regularization. All comparisons were made with the control group (n = 271). Table S3: Non-adjusted odds ratio for ALS disease subgroups (El Escorial criteria, site of symptom onset, and age at symptom onset) according to the pairwise interactions in the second step group LASSO regularization. All comparisons were made with the control group (n = 271).
Author Contributions
S.G.F., M.L.M.S., R.I. and H.G.d.S. contributed to conceptualization, data curation, methodology design, and formal analysis. S.G.F. and H.G.d.S. writing the original draft. T.D.J.F., F.P., B.D., P.S., M.L.M.S. and R.I. reviewed and edited the original draft. All authors have read and agreed to the published version of the manuscript.
Funding
This research was supported by the Brazilian National Research Council (CNPq), grant number 442381/2019-0. Rafael Izbicki is grateful for the financial support of FAPESP (grant 2019/11321-9) and CNPq (grant 309607/2020-5). Fabio Passetti is grateful for the financial support of CNPq (grant 308697/2019-7).
Institutional Review Board Statement
Not applicable.
Informed Consent Statement
Not applicable.
Data Availability Statement
We analyzed data from a case-control GWAS from the National Institute of Neurological Disorders and Stroke Repository available for download through the database of Genotypes and Phenotype (dbGaP) Authorized Access System (dbGaP study accession phs000101.v3.p1; Data Access Request number 87433-1). We made our R code available on GitHub repository https://github.com/Hellengeremias/two-step_Group_LASSO_analysis.
Acknowledgments
The authors acknowledge the Fiocruz Bioinformatics Facility RPT04A for providing computer servers to carry out the analyzes of this study.
Conflicts of Interest
The authors declare no conflict of interest.
Abbreviations
The following abbreviations are used in this manuscript:
| ALS | Amyotrophic Lateral Sclerosis |
| GWAS | Genome-Wide Association Studies |
| SNP | Single-Nucleotide Polymorphism |
| LASSO | Least Absolute Shrinkage and Selection Operator |
| eQTL | Expression Quantitative Trait Loci |
| QC | Quality Control |
| OR | Odds Ratio |
| CI | Confidence Interval |
| LRT | Likelihood Ratio Test |
| KCNS3 | Potassium Voltage-Gated Channel Subfamily S member 3 |
| FMN2 | Formine-2 |
| RGM | Repulsive Guidance Molecules |
| RGMA | Repulsive Guidance Molecule Co-Receptor A |
| BMP | Bone Morphogenetic Protein |
| LINC02055 | Long Intergenic Non-Protein Coding RNA 2055 |
| RPS6 | Ribosomal Protein S6 |
| TMEM132C | Transmembrane Protein 132C |
| GOLGA8B | Golgin A8 Family Member B |
| TRP | Transient Receptor Potential |
| TRPM | Melastatin Transient Receptor Potential |
| ncRNA | Non-Coding RNA |
| BCHE | Butyrylcholinesterase |
| ACHE | Acetylcholinesterase |
| BCL6 | B-Cell Lymphoma 6 |
References
- Talbot, K. Motor neuron disease: The bare essentials. Pract. Neurol. 2009, 9, 303–309. [Google Scholar] [CrossRef] [PubMed]
- Van Es, M.A.; Hardiman, O.; Chio, A.; Al-Chalabi, A.; Pasterkamp, R.J.; Veldink, J.H.; Van den Berg, L.H. Amyotrophic lateral sclerosis. Lancet 2017, 390, 2084–2098. [Google Scholar] [CrossRef]
- Swinnen, B.; Robberecht, W. The phenotypic variability of amyotrophic lateral sclerosis. Nat. Rev. Neurol. 2014, 10, 661–670. [Google Scholar] [CrossRef] [PubMed]
- Sabatelli, M.; Marangi, G.; Conte, A.; Tasca, G.; Zollino, M.; Lattante, S. New ALS-related genes expand the spectrum paradigm of amyotrophic lateral sclerosis. Brain Pathol. 2016, 26, 266–275. [Google Scholar] [CrossRef] [PubMed]
- Chia, R.; Chiò, A.; Traynor, B.J. Novel genes associated with amyotrophic lateral sclerosis: Diagnostic and clinical implications. Lancet Neurol. 2018, 17, 94–102. [Google Scholar] [CrossRef]
- Brooks, B.R.; Miller, R.G.; Swash, M.; Munsat, T.L. El Escorial revisited: Revised criteria for the diagnosis of amyotrophic lateral sclerosis. Amyotroph. Lateral Scler. Other Mot. Neuron Disord. 2000, 1, 293–299. [Google Scholar] [CrossRef]
- Van Steen, K.; Moore, J. How to increase our belief in discovered statistical interactions via large-scale association studies? Hum. Genet. 2019, 138, 293–305. [Google Scholar] [CrossRef]
- Niel, C.; Sinoquet, C.; Dina, C.; Rocheleau, G. A survey about methods dedicated to epistasis detection. Front. Genet. 2015, 6, 285. [Google Scholar] [CrossRef]
- Efron, B.; Hastie, T. Computer Age Statistical Inference; Cambridge University Press: New York, NY, USA, 2016. [Google Scholar]
- Park, M.Y.; Hastie, T. Penalized logistic regression for detecting gene interactions. Biostatistics 2008, 9, 30–50. [Google Scholar] [CrossRef]
- Wang, S.; Nan, B.; Rosset, S.; Zhu, J. Random lasso. Ann. Appl. Stat. 2011, 5, 468. [Google Scholar] [CrossRef]
- Schymick, J.C.; Scholz, S.W.; Fung, H.C.; Britton, A.; Arepalli, S.; Gibbs, J.R.; Lombardo, F.; Matarin, M.; Kasperaviciute, D.; Hernandez, D.G.; et al. Genome-wide genotyping in amyotrophic lateral sclerosis and neurologically normal controls: First stage analysis and public release of data. Lancet Neurol. 2007, 6, 322–328. [Google Scholar] [CrossRef]
- Hastie, T.; Tibshirani, R.; Wainwright, M. Statistical Learning with Sparsity: The Lasso and Generalizations; Chapman & Hall/CRC: Boca Raton, FL, USA, 2019. [Google Scholar]
- Agresti, A. Foundations of Linear and Generalized Linear Models; John Wiley & Sons: Hoboken, NJ, USA, 2015. [Google Scholar]
- Yang, Y.; Zou, H. A fast unified algorithm for solving group-lasso penalize learning problems. Stat. Comput. 2015, 25, 1129–1141. [Google Scholar] [CrossRef]
- Meier, L.; Van De Geer, S.; Bühlmann, P. The group lasso for logistic regression. J. R. Stat. Soc. Ser. B Stat. Methodol. 2008, 70, 53–71. [Google Scholar] [CrossRef]
- Lim, M.; Hastie, T. Learning interactions via hierarchical group-lasso regularization. J. Comput. Graph. Stat. 2015, 24, 627–654. [Google Scholar] [CrossRef] [PubMed]
- Park, H.; Imoto, S.; Miyano, S. Recursive random lasso (RRLasso) for identifying anti-cancer drug targets. PLoS ONE 2015, 10, e0141869. [Google Scholar] [CrossRef]
- Kim, Y.; Hao, J.; Mallavarapu, T.; Park, J.; Kang, M. Hi-lasso: High-dimensional lasso. IEEE Access 2019, 7, 44562–44573. [Google Scholar] [CrossRef]
- Hinrichs, A.S.; Raney, B.J.; Speir, M.L.; Rhead, B.; Casper, J.; Karolchik, D.; Kuhn, R.M.; Rosenbloom, K.R.; Zweig, A.S.; Haussler, D.; et al. UCSC data integrator and variant annotation integrator. Bioinformatics 2016, 32, 1430–1432. [Google Scholar] [CrossRef]
- McLaren, W.; Gil, L.; Hunt, S.E.; Riat, H.S.; Ritchie, G.R.; Thormann, A.; Flicek, P.; Cunningham, F. The ensembl variant effect predictor. Genome Biol. 2016, 17, 122. [Google Scholar] [CrossRef]
- Ward, L.D.; Kellis, M. HaploReg: A resource for exploring chromatin states, conservation, and regulatory motif alterations within sets of genetically linked variants. Nucleic Acids Res. 2012, 40, D930–D934. [Google Scholar] [CrossRef]
- Boyle, A.P.; Hong, E.L.; Hariharan, M.; Cheng, Y.; Schaub, M.A.; Kasowski, M.; Karczewski, K.J.; Park, J.; Hitz, B.C.; Weng, S.; et al. Annotation of functional variation in personal genomes using RegulomeDB. Genome Res. 2012, 22, 1790–1797. [Google Scholar] [CrossRef]
- Machiela, M.J.; Chanock, S.J. LDlink: A web-based application for exploring population-specific haplotype structure and linking correlated alleles of possible functional variants. Bioinformatics 2015, 31, 3555–3557. [Google Scholar] [CrossRef] [PubMed]
- Sherry, S.T.; Ward, M.; Sirotkin, K. dbSNP—Database for single nucleotide polymorphisms and other classes of minor genetic variation. Genome Res. 1999, 9, 677–679. [Google Scholar] [CrossRef] [PubMed]
- Carithers, L.J.; Ardlie, K.; Barcus, M.; Branton, P.A.; Britton, A.; Buia, S.A.; Compton, C.C.; DeLuca, D.S.; Peter-Demchok, J.; Gelfand, E.T.; et al. A novel approach to high-quality postmortem tissue procurement: The GTEx project. Biopreserv. Biobank. 2015, 13, 311–319. [Google Scholar] [CrossRef]
- Uhlén, M.; Fagerberg, L.; Hallström, B.M.; Lindskog, C.; Oksvold, P.; Mardinoglu, A.; Sivertsson, Å.; Kampf, C.; Sjöstedt, E.; Asplund, A.; et al. Tissue-based map of the human proteome. Science 2015, 347, 1260419. [Google Scholar] [CrossRef]
- Meinshausen, N.; Meier, L.; Bühlmann, P. p-values for high-dimensional regression. J. Am. Stat. Assoc. 2009, 104, 1671–1681. [Google Scholar] [CrossRef]
- Laird, N.M.; Lang, C. The Fundamentals of Modern Statistical Genetics; Springer: New York, NY, USA, 2011. [Google Scholar]
- Sha, Q.; Zhang, Z.; Schymick, J.C.; Traynor, B.J.; Zhang, S. Genome-wide association reveals three SNPs associated with sporadic amyotrophic lateral sclerosis through a two-locus analysis. BMC Med. Genet. 2009, 10, 86. [Google Scholar] [CrossRef]
- Pan, W. Statistical tests of genetic association in the presence of gene-gene and gene-environment interactions. Hum. Hered. 2010, 69, 131–142. [Google Scholar] [CrossRef][Green Version]
- Macintyre, G.; Bailey, J.; Haviv, I.; Kowalczyk, A. is-rSNP: A novel technique for in silico regulatory SNP detection. Bioinformatics 2010, 26, i524–i530. [Google Scholar] [CrossRef]
- Han, F.; Pan, W. A composite likelihood approach to latent multivariate gaussian modeling of snp data with application to genetic association testing. Biometrics 2012, 68, 307–315. [Google Scholar] [CrossRef]
- Han, F.; Pan, W. Powerful multi-marker association tests: Unifying genomic distance-based regression and logistic regression. Genet. Epidemiol. 2010, 34, 680–688. [Google Scholar] [CrossRef]
- Audo, I.; Kohl, S.; Leroy, B.P.; Munier, F.L.; Guillonneau, X.; Mohand-Saïd, S.; Bujakowska, K.; Nandrot, E.F.; Lorenz, B.; Preising, M.; et al. TRPM1 is mutated in patients with autosomal-recessive complete congenital stationary night blindness. Am. J. Hum. Genet. 2009, 85, 720–729. [Google Scholar] [CrossRef] [PubMed]
- Li, Z.; Sergouniotis, P.I.; Michaelides, M.; Mackay, D.S.; Wright, G.A.; Devery, S.; Moore, A.T.; Holder, G.E.; Robson, A.G.; Webster, A.R. Recessive mutations of the gene TRPM1 abrogate ON bipolar cell function and cause complete congenital stationary night blindness in humans. Am. J. Hum. Genet. 2009, 85, 711–719. [Google Scholar] [CrossRef] [PubMed]
- Thameem, F.; Puppala, S.; Arar, N.H.; Blangero, J.; Duggirala, R.; Abboud, H.E. Genetic variants in Transient Receptor Potential cation channel, subfamily M 1 (TRPM1) and their risk of albuminuria-related traits in Mexican Americans. Clin. Chim. Acta 2011, 412, 2058–2062. [Google Scholar] [CrossRef] [PubMed]
- Okumus, S.; Demiryürek, S.; Gürler, B.; Coskun, E.; Bozgeyik, İ.; Oztuzcu, S.; Kaydu, E.; Celik, O.; Erbagcı, İ.; Demiryürek, A.T. Association transient receptor potential melastatin channel gene polymorphism with primary open angle glaucoma. Mol. Vis. 2013, 19, 1852. [Google Scholar] [PubMed]
- Yamada, Y.; Yasukochi, Y.; Kato, K.; Oguri, M.; Horibe, H.; Fujimaki, T.; Takeuchi, I.; Sakuma, J. Identification of 26 novel loci that confer susceptibility to early-onset coronary artery disease in a Japanese population. Biomed. Rep. 2018, 9, 383–404. [Google Scholar] [CrossRef]
- Lv, H.; Zhang, M.; Shang, Z.; Li, J.; Zhang, S.; Lian, D.; Zhang, R. Genome-wide haplotype association study identify the FGFR2 gene as a risk gene for acute myeloid leukemia. Oncotarget 2017, 8, 7891. [Google Scholar] [CrossRef]
- Van Ness, B.; Ramos, C.; Haznadar, M.; Hoering, A.; Haessler, J.; Crowley, J.; Jacobus, S.; Oken, M.; Rajkumar, V.; Greipp, P.; et al. Genomic variation in myeloma: Design, content, and initial application of the Bank on a Cure SNP Panel to detect associations with progression-free survival. BMC Med. 2008, 6, 26. [Google Scholar] [CrossRef]
- Morton, L.M.; Purdue, M.P.; Zheng, T.; Wang, S.S.; Armstrong, B.; Zhang, Y.; Menashe, I.; Chatterjee, N.; Davis, S.; Lan, Q.; et al. Risk of Non–Hodgkin Lymphoma Associated with Germline Variation in Genes that Regulate the Cell Cycle, Apoptosis, and Lymphocyte Development. Cancer Epidemiol. Biomark. Prev. 2009, 18, 1259–1270. [Google Scholar] [CrossRef]
- Le Gall, L.; Anakor, E.; Connolly, O.; Vijayakumar, U.G.; Duddy, W.J.; Duguez, S. Molecular and cellular mechanisms affected in ALS. J. Pers. Med. 2020, 10, 101. [Google Scholar] [CrossRef]
- Stocker, M.; Kerschensteiner, D. Cloning and tissue distribution of two new potassium channel α-subunits from rat brain. Biochem. Biophys. Res. Commun. 1998, 248, 927–934. [Google Scholar] [CrossRef]
- Shepard, A.R.; Rae, J.L. Electrically silent potassium channel subunits from human lens epithelium. Am. J. Physiol.-Cell Physiol. 1999, 277, C412–C424. [Google Scholar] [CrossRef] [PubMed]
- Jimenez, I.; Prado, Y.; Marchant, F.; Otero, C.; Eltit, F.; Cabello-Verrugio, C.; Cerda, O.; Simon, F. TRPM channels in human diseases. Cells 2020, 9, 2604. [Google Scholar] [CrossRef] [PubMed]
- Leader, B.; Leder, P. Formin-2, a novel formin homology protein of the cappuccino subfamily, is highly expressed in the developing and adult central nervous system. Mech. Dev. 2000, 93, 221–231. [Google Scholar] [CrossRef]
- Law, R.; Dixon-Salazar, T.; Jerber, J.; Cai, N.; Abbasi, A.A.; Zaki, M.S.; Mittal, K.; Gabriel, S.B.; Rafiq, M.A.; Khan, V.; et al. Biallelic truncating mutations in FMN2, encoding the actin-regulatory protein Formin 2, cause nonsyndromic autosomal-recessive intellectual disability. Am. J. Hum. Genet. 2014, 95, 721–728. [Google Scholar] [CrossRef] [PubMed]
- Mutalik, S.P. Role of the Cytoskeleton in Regulating Axonal Tension and Growth Cone Traction Dynamics. Ph.D. Thesis, Indian Institute of Science Education and Research, Pune, India, 2018. [Google Scholar]
- Sanchez-Pulido, L.; Ponting, C.P. TMEM132: An ancient architecture of cohesin and immunoglobulin domains define a new family of neural adhesion molecules. Bioinformatics 2018, 34, 721–724. [Google Scholar] [CrossRef] [PubMed]
- Severyn, C.J.; Shinde, U.; Rotwein, P. Molecular biology, genetics and biochemistry of the repulsive guidance molecule family. Biochem. J. 2009, 422, 393–403. [Google Scholar] [CrossRef]
- Tang, J.; Zeng, X.; Li, H.; Ju, L.; Feng, J.; Yang, J. Repulsive guidance molecule-a and central nervous system diseases. BioMed Res. Int. 2021, 2021, 5532116. [Google Scholar] [CrossRef]
- Munro, S. The golgin coiled-coil proteins of the Golgi apparatus. Cold Spring Harb. Perspect. Biol. 2011, 3, a005256. [Google Scholar] [CrossRef]
- Sundaramoorthy, V.; Walker, A.K.; Yerbury, J.; Soo, K.Y.; Farg, M.A.; Hoang, V.; Zeineddine, R.; Spencer, D.; Atkin, J.D. Extracellular wildtype and mutant SOD1 induces ER–Golgi pathology characteristic of amyotrophic lateral sclerosis in neuronal cells. Cell. Mol. Life Sci. 2013, 70, 4181–4195. [Google Scholar] [CrossRef]
- Gonatas, N.; Stieber, A.; Mourelatos, Z.; Chen, Y.; Gonatas, J.; Appel, S.H.; Hays, A.; Hickey, W.; Hauw, J. Fragmentation of the Golgi apparatus of motor neurons in amyotrophic lateral sclerosis. Am. J. Pathol. 1992, 140, 731. [Google Scholar]
- Boucher, B.; Jenna, S. Genetic interaction networks: Better understand to better predict. Front. Genet. 2013, 4, 290. [Google Scholar] [CrossRef] [PubMed]
- Szklo, M.; Nieto, J. Epidemiology: Beyond the Basics; Jones & Bartlett Publishers: Burlington, MA, USA, 2014. [Google Scholar]
- Johnson, G.; Moore, S.W. Why has butyrylcholinesterase been retained? Structural and functional diversification in a duplicated gene. Neurochem. Int. 2012, 61, 783–797. [Google Scholar] [CrossRef] [PubMed]
- Kozhemyakin, M.; Rajasekaran, K.; Kapur, J. Central cholinesterase inhibition enhances glutamatergic synaptic transmission. J. Neurophysiol. 2010, 103, 1748–1757. [Google Scholar] [CrossRef]
- Haidet-Phillips, A.M.; Hester, M.E.; Miranda, C.J.; Meyer, K.; Braun, L.; Frakes, A.; Song, S.; Likhite, S.; Murtha, M.J.; Foust, K.D.; et al. Astrocytes from familial and sporadic ALS patients are toxic to motor neurons. Nat. Biotechnol. 2011, 29, 824–828. [Google Scholar] [CrossRef] [PubMed]
- Barbour, B.; Brew, H.; Attwell, D. Electrogenic glutamate uptake in glial cells is activated by intracellular potassium. Nature 1988, 335, 433–435. [Google Scholar] [CrossRef]
- Allman, D.; Jain, A.; Dent, A.; Maile, R.R.; Selvaggi, T.; Kehry, M.R.; Staudt, L.M. BCL-6 expression during B-cell activation. Blood 1996, 87, 5257–5268. [Google Scholar] [CrossRef]
- Arlotta, P.; Molyneaux, B.J.; Chen, J.; Inoue, J.; Kominami, R.; Macklis, J.D. Neuronal subtype-specific genes that control corticospinal motor neuron development in vivo. Neuron 2005, 45, 207–221. [Google Scholar] [CrossRef]
- Wang, X.S.; Simmons, Z.; Liu, W.; Boyer, P.J.; Connor, J.R. Differential expression of genes in amyotrophic lateral sclerosis revealed by profiling the post mortem cortex. Amyotroph. Lateral Scler. 2006, 7, 201–216. [Google Scholar] [CrossRef]
- Zhou, L.; Zhang, C.L.; Messing, A.; Chiu, S.Y. Temperature-sensitive neuromuscular transmission in Kv1. 1 null mice: Role of potassium channels under the myelin sheath in young nerves. J. Neurosci. 1998, 18, 7200–7215. [Google Scholar] [CrossRef]
- Wu, T.T.; Chen, Y.F.; Hastie, T.; Sobel, E.; Lange, K. Genome-wide association analysis by lasso penalized logistic regression. Bioinformatics 2009, 25, 714–721. [Google Scholar] [CrossRef]
- Yang, C.; Wan, X.; Yang, Q.; Xue, H.; Yu, W. Identifying main effects and epistatic interactions from large-scale SNP data via adaptive group Lasso. BMC Bioinform. 2010, 11, S18. [Google Scholar] [CrossRef]
- Shi, W.; Lee, K.E.; Wahba, G. Detecting disease-causing genes by LASSO-Patternsearch algorithm. BMC Proc. 2007, 1, S60. [Google Scholar] [CrossRef]
- Wu, C.H.; Fallini, C.; Ticozzi, N.; Keagle, P.J.; Sapp, P.C.; Piotrowska, K.; Lowe, P.; Koppers, M.; McKenna-Yasek, D.; Baron, D.M.; et al. Mutations in the profilin 1 gene cause familial amyotrophic lateral sclerosis. Nature 2012, 488, 499–503. [Google Scholar] [CrossRef] [PubMed]
- Hop, P.J.; Zwamborn, R.A.; Hannon, E.; Shireby, G.L.; Nabais, M.F.; Walker, E.M.; van Rheenen, W.; van Vugt, J.J.; Dekker, A.M.; Westeneng, H.J.; et al. Genome-wide study of DNA methylation shows alterations in metabolic, inflammatory, and cholesterol pathways in ALS. Sci. Transl. Med. 2022, 14, eabj0264. [Google Scholar] [CrossRef] [PubMed]
- Gu, D.; Ou, S.; Tang, M.; Yin, Z.; Wang, Z.; Liu, G. Trauma and amyotrophic lateral sclerosis: A systematic review and meta-analysis. Amyotroph. Lateral Scler. Front. Degener. 2021, 22, 170–185. [Google Scholar] [CrossRef] [PubMed]


Publisher’s Note: MDPI stays neutral with regard to jurisdictional claims in published maps and institutional affiliations. |
© 2022 by the authors. Licensee MDPI, Basel, Switzerland. This article is an open access article distributed under the terms and conditions of the Creative Commons Attribution (CC BY) license (https://creativecommons.org/licenses/by/4.0/).