
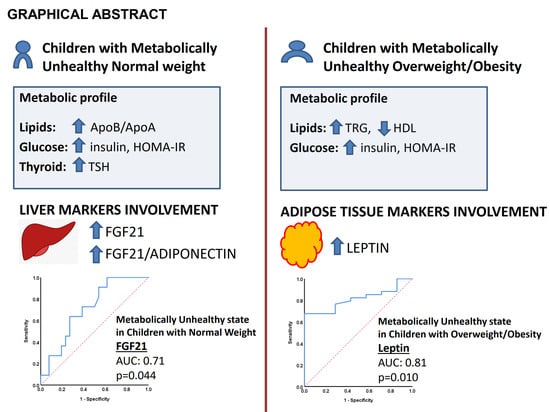
Role of FGF21 and Leptin for the Diagnosis of Metabolic Health in Children with and without Obesity

 ,
,  ,
, 
Abstract
:
1. Introduction
2. Materials and Methods
2.1. Participants and Study Protocol
2.2. Serum and Imaging Analyses
2.2.1. Serum Analysis
2.2.2. Ultrasound Studies
2.3. Statistics
3. Results
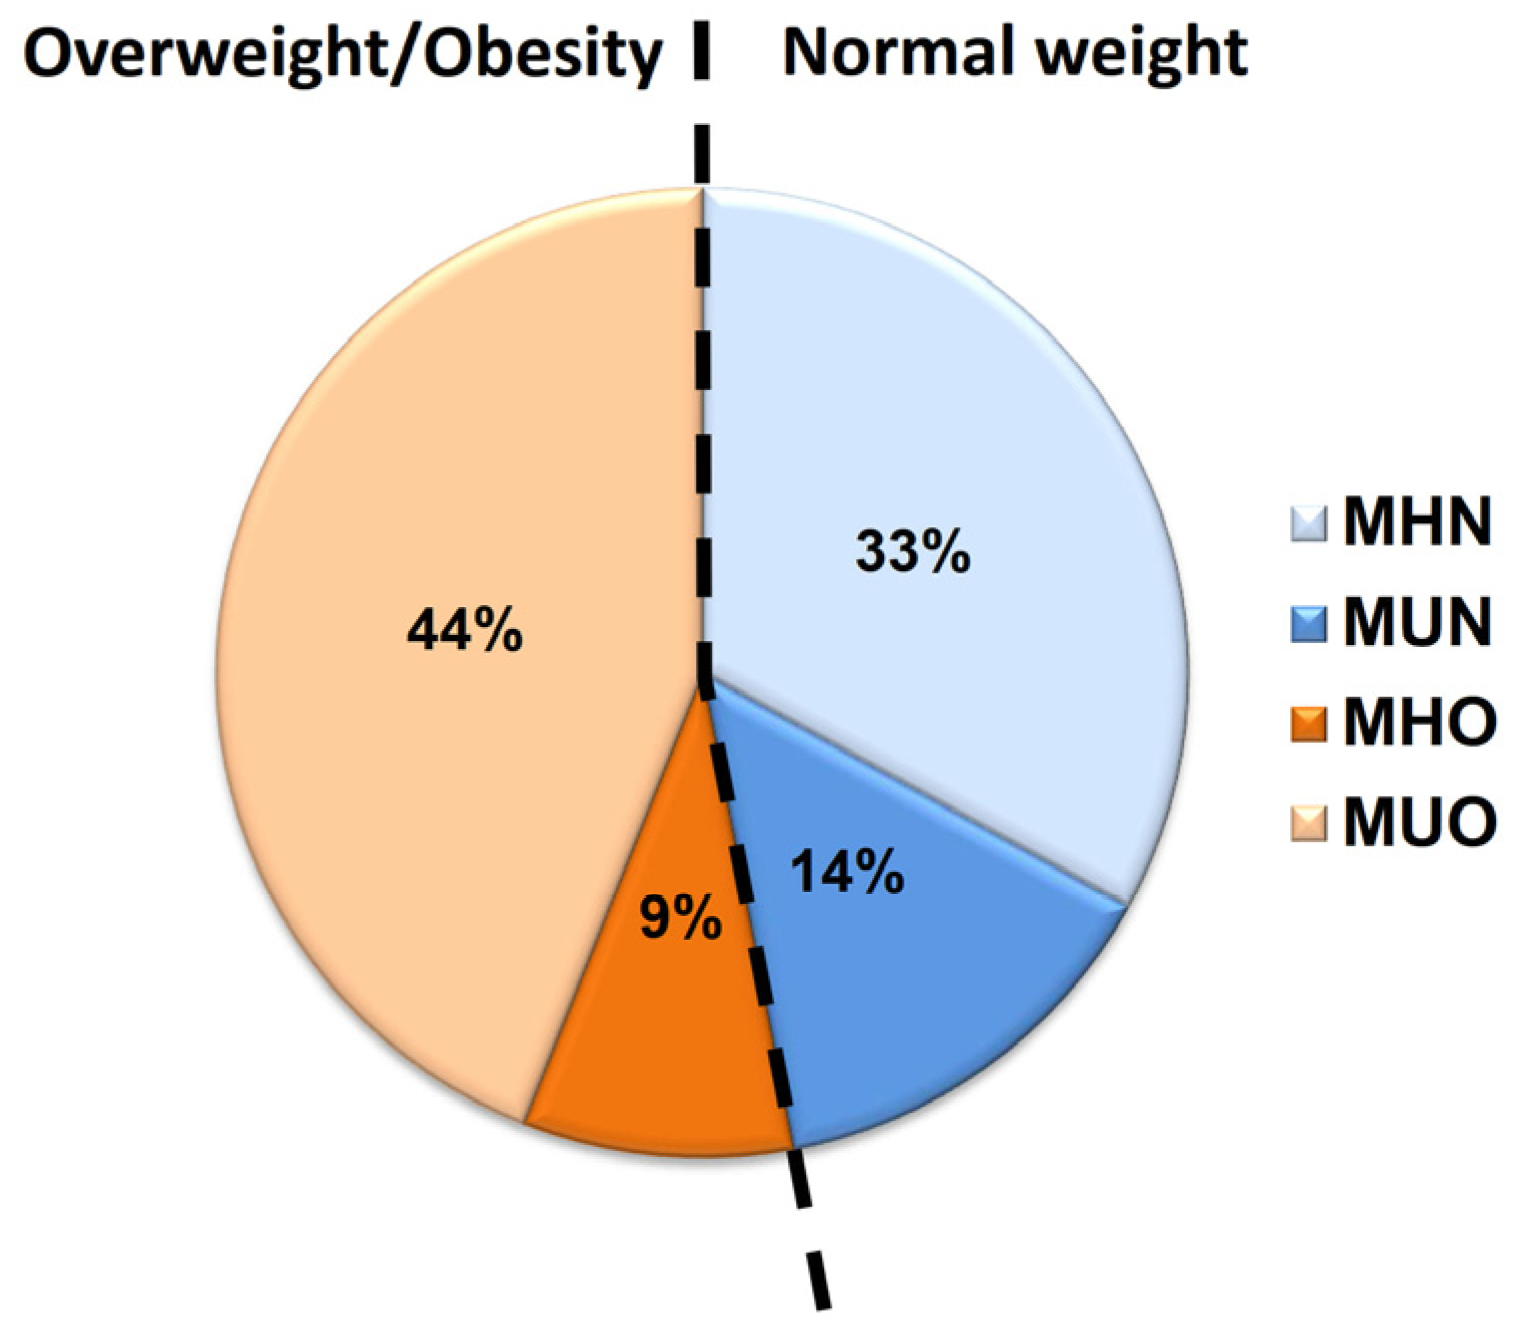
3.1. Metabolic Health State in Children with Normal Weight and Children with Obesity
3.2. Biomolecules as Markers of Metabolic Health State
3.3. Vascular Indices in the Different Metabolic States
4. Discussion
5. Conclusions
Author Contributions
Funding
Institutional Review Board Statement
Informed Consent Statement
Data Availability Statement
Acknowledgments
Conflicts of Interest
References
- Zhao, M.; Lopez-Bermejo, A.; Caserta, C.A.; Medeiros, C.C.M.; Kollias, A.; Bassols, J.; Romeo, E.L.; Ramos, T.D.A.; Stergiou, G.S.; Yang, L.; et al. Metabolically healthy obesity and high carotid intima-media thickness in children and adolescents: International childhood vascular structure evaluation consortium. Diabetes Care 2019, 42, 119–125. [Google Scholar] [CrossRef]
- Morales Camacho, W.J.; Molina Diaz, J.M.; Plata Ortiz, S.; Plata Ortiz, J.E.; Morales Camacho, M.A.; Calderon, B.P. Childhood obesity: Aetiology, comorbidities, and treatment. Diabetes/Metab. Res. Rev. 2019, 35, e3203. [Google Scholar] [CrossRef]
- Ruderman, N.; Chisholm, D.; Pi-Sunyer, X.; Schneider, S. The metabolically obese, normal-weight individual revisited. Diabetes 1998, 47, 699–713. [Google Scholar] [CrossRef]
- Powell-Wiley, T.M.; Poirier, P.; Burke, L.E.; Despres, J.P.; Gordon-Larsen, P.; Lavie, C.J.; Lear, S.A.; Ndumele, C.E.; Neeland, I.J.; Sanders, P.; et al. Obesity and cardiovascular disease: A scientific statement from the American heart association. Circulation 2021, 143, e984–e1010. [Google Scholar] [CrossRef]
- Stefan, N.; Kantartzis, K.; Machann, J.; Schick, F.; Thamer, C.; Rittig, K.; Balletshofer, B.; Machicao, F.; Fritsche, A.; Haring, H.U. Identification and characterization of metabolically benign obesity in humans. Arch. Intern. Med. 2008, 168, 1609–1616. [Google Scholar] [CrossRef] [PubMed]
- van Vliet-Ostaptchouk, J.V.; Nuotio, M.L.; Slagter, S.N.; Doiron, D.; Fischer, K.; Foco, L.; Gaye, A.; Gogele, M.; Heier, M.; Hiekkalinna, T.; et al. The prevalence of metabolic syndrome and metabolically healthy obesity in Europe: A collaborative analysis of ten large cohort studies. BMC Endocr. Disord. 2014, 14, 9. [Google Scholar] [CrossRef] [PubMed]
- Yang, Q.; Wang, K.; Tian, Q.; Zhang, J.; Qi, L.; Chen, T. Effect of diet and exercise-induced weight loss among metabolically healthy and metabolically unhealthy obese children and adolescents. Int. J. Environ. Res. Public Health 2022, 19, 6120. [Google Scholar] [CrossRef] [PubMed]
- Shi, Y.; Wang, Q.; Sun, Y.; Zhao, X.; Kong, Y.; Ou, X.; Jia, J.; Wu, S.; You, H. The prevalence of lean/nonobese nonalcoholic fatty liver disease: A systematic review and meta-analysis. J. Clin. Gastroenterol. 2020, 54, 378–387. [Google Scholar] [CrossRef] [PubMed]
- Kim, H.S.; Lee, J.; Cho, Y.K.; Park, J.Y.; Lee, W.J.; Kim, Y.J.; Jung, C.H. Differential effect of metabolic health and obesity on incident heart failure: A nationwide population-based cohort study. Front. Endocrinol. 2021, 12, 625083. [Google Scholar] [CrossRef]
- Margolis-Gil, M.; Yackobovitz-Gavan, M.; Phillip, M.; Shalitin, S. Which predictors differentiate between obese children and adolescents with cardiometabolic complications and those with metabolically healthy obesity? Pediatr. Diabetes 2018, 19, 1147–1155. [Google Scholar] [CrossRef]
- Genovesi, S.; Antolini, L.; Orlando, A.; Gilardini, L.; Bertoli, S.; Giussani, M.; Invitti, C.; Nava, E.; Battaglino, M.G.; Leone, A.; et al. Cardiovascular risk factors associated with the metabolically healthy obese (MHO) phenotype compared to the metabolically unhealthy obese (MUO) phenotype in children. Front. Endocrinol. 2020, 11, 27. [Google Scholar] [CrossRef]
- Alberti, K.G.; Zimmet, P.; Shaw, J. Metabolic syndrome—A new world-wide definition. A consensus statement from the international diabetes federation. Diabet. Med. J. Br. Diabet. Assoc. 2006, 23, 469–480. [Google Scholar] [CrossRef] [PubMed]
- Fu, J.; Li, Y.; Esangbedo, I.C.; Li, G.; Feng, D.; Li, L.; Xu, L.; Han, L.; Li, M.; Li, C.; et al. Circulating osteonectin and adipokine profiles in relation to metabolically healthy obesity in Chinese children: Findings from BCAMS. J. Am. Heart Assoc. 2018, 7, e009169. [Google Scholar] [CrossRef] [PubMed]
- Matthews, D.R.; Hosker, J.P.; Rudenski, A.S.; Naylor, B.A.; Treacher, D.F.; Turner, R.C. Homeostasis model assessment: Insulin resistance and beta-cell function from fasting plasma glucose and insulin concentrations in man. Diabetologia 1985, 28, 412–419. [Google Scholar] [CrossRef]
- Urbina, E.M.; Williams, R.V.; Alpert, B.S.; Collins, R.T.; Daniels, S.R.; Hayman, L.; Jacobson, M.; Mahoney, L.; Mietus-Snyder, M.; Rocchini, A.; et al. Noninvasive assessment of subclinical atherosclerosis in children and adolescents: Recommendations for standard assessment for clinical research: A scientific statement from the American heart association. Hypertension 2009, 54, 919–950. [Google Scholar] [CrossRef]
- Vlahos, A.P.; Theocharis, P.; Bechlioulis, A.; Naka, K.K.; Vakalis, K.; Papamichael, N.D.; Alfantaki, S.; Gartzonika, K.; Mavridis, A.; Michalis, L.K.; et al. Changes in vascular function and structure in juvenile idiopathic arthritis. Arthritis Care Res. 2011, 63, 1736–1744. [Google Scholar] [CrossRef] [PubMed]
- Corretti, M.C.; Anderson, T.J.; Benjamin, E.J.; Celermajer, D.; Charbonneau, F.; Creager, M.A.; Deanfield, J.; Drexler, H.; Gerhard-Herman, M.; Herrington, D.; et al. Guidelines for the ultrasound assessment of endothelial-dependent flow-mediated vasodilation of the brachial artery: A report of the international brachial artery reactivity task force. J. Am. Coll. Cardiol. 2002, 39, 257–265. [Google Scholar] [CrossRef]
- Pyke, K.E.; Dwyer, E.M.; Tschakovsky, M.E. Impact of controlling shear rate on flow-mediated dilation responses in the brachial artery of humans. J. Appl. Physiol. 2004, 97, 499–508. [Google Scholar] [CrossRef]
- Pyke, K.E.; Tschakovsky, M.E. Peak vs. Total reactive hyperemia: Which determines the magnitude of flow-mediated dilation? J. Appl. Physiol. 2007, 102, 1510–1519. [Google Scholar] [CrossRef]
- Manjunath, C.N.; Rawal, J.R.; Irani, P.M.; Madhu, K. Atherogenic dyslipidemia. Indian. J. Endocrinol. Metab. 2013, 17, 969–976. [Google Scholar]
- Linton, M.F.; Yancey, P.G.; Davies, S.S.; Jerome, W.G.; Linton, E.F.; Song, W.L.; Doran, A.C.; Vickers, K.C. The role of lipids and lipoproteins in atherosclerosis. In Endotext; Feingold, K.R., Anawalt, B., Blackman, M.R., Boyce, A., Chrousos, G., Corpas, E., de Herder, W.W., Dhatariya, K., Hofland, J., Dungan, K., et al., Eds.; MDText.com, Inc.: South Dartmouth, MA, USA, 2000; PMID: 26844337. [Google Scholar]
- Staiger, H.; Keuper, M.; Berti, L.; Hrabe de Angelis, M.; Haring, H.U. Fibroblast growth factor 21-metabolic role in mice and men. Endocr. Rev. 2017, 38, 468–488. [Google Scholar] [CrossRef]
- Gaich, G.; Chien, J.Y.; Fu, H.; Glass, L.C.; Deeg, M.A.; Holland, W.L.; Kharitonenkov, A.; Bumol, T.; Schilske, H.K.; Moller, D.E. The effects of LY2405319, an FGF21 analog, in obese human subjects with type 2 diabetes. Cell Metab. 2013, 18, 333–340. [Google Scholar] [CrossRef]
- Lin, Z.; Wu, Z.; Yin, X.; Liu, Y.; Yan, X.; Lin, S.; Xiao, J.; Wang, X.; Feng, W.; Li, X. Serum levels of FGF-21 are increased in coronary heart disease patients and are independently associated with adverse lipid profile. PLoS ONE 2010, 5, e15534. [Google Scholar] [CrossRef] [PubMed]
- Lin, X.; Li, G.; He, X.; Ma, X.; Zhang, K.; Zhang, H.; Zeng, G.; Wang, Z. FGF21 inhibits apolipoprotein(a) expression in HepG2 cells via the FGFR1-ERK1/2-Elk-1 pathway. Mol. Cell. Biochem. 2014, 393, 33–42. [Google Scholar] [CrossRef]
- Chan, D.C.; Watts, G.F. Apolipoproteins as markers and managers of coronary risk. QJM Mon. J. Assoc. Physicians 2006, 99, 277–287. [Google Scholar] [CrossRef]
- Tillman, E.J.; Rolph, T. Fgf21: An emerging therapeutic target for non-alcoholic steatohepatitis and related metabolic diseases. Front. Endocrinol. 2020, 11, 601290. [Google Scholar] [CrossRef] [PubMed]
- Domouzoglou, E.M.; Fisher, F.M.; Astapova, I.; Fox, E.C.; Kharitonenkov, A.; Flier, J.S.; Hollenberg, A.N.; Maratos-Flier, E. Fibroblast growth factor 21 and thyroid hormone show mutual regulatory dependency but have independent actions in vivo. Endocrinology 2014, 155, 2031–2040. [Google Scholar] [CrossRef] [PubMed]
- Gijbels, A.; Schutte, S.; Esser, D.; Michielsen, C.; Siebelink, E.; Mars, M.; Mensink, M.; Afman, L.A. Plasma FGF21 levels are not associated with weight loss or improvements in metabolic health markers upon 12 weeks of energy restriction: Secondary analysis of an rct. Nutrients 2022, 14, 5061. [Google Scholar] [CrossRef]
- Friedman, J.M.; Halaas, J.L. Leptin and the regulation of body weight in mammals. Nature 1998, 395, 763–770. [Google Scholar] [CrossRef]
- Bungau, S.; Behl, T.; Tit, D.M.; Banica, F.; Bratu, O.G.; Diaconu, C.C.; Nistor-Cseppento, C.D.; Bustea, C.; Aron, R.A.C.; Vesa, C.M. Interactions between leptin and insulin resistance in patients with prediabetes, with and without NAFLD. Exp. Ther. Med. 2020, 20, 197. [Google Scholar] [CrossRef]
- Damanhoury, S.; Morrison, K.M.; Mian, R.; McPhee, P.G.; Kozyrskyj, A.L.; Newton, A.S.; Buchholz, A.; Chanoine, J.P.; Hamilton, J.; Ho, J.; et al. Metabolically healthy obesity in children enrolled in the Canadian pediatric weight management registry (CANPWR): An exploratory secondary analysis of baseline data. Clin. Obes. 2022, 12, e12490. [Google Scholar] [CrossRef]
- Orsso, C.E.; Colin-Ramirez, E.; Field, C.J.; Madsen, K.L.; Prado, C.M.; Haqq, A.M. Adipose tissue development and expansion from the womb to adolescence: An overview. Nutrients 2020, 12, 2735. [Google Scholar] [CrossRef]
- Sun, K.; Kusminski, C.M.; Scherer, P.E. Adipose tissue remodeling and obesity. J. Clin. Investig. 2011, 121, 2094–2101. [Google Scholar] [CrossRef]
- Knittle, J.L.; Timmers, K.; Ginsberg-Fellner, F.; Brown, R.E.; Katz, D.P. The growth of adipose tissue in children and adolescents. Cross-sectional and longitudinal studies of adipose cell number and size. J. Clin. Investig. 1979, 63, 239–246. [Google Scholar] [CrossRef]
- Neeland, I.J.; Ross, R.; Despres, J.P.; Matsuzawa, Y.; Yamashita, S.; Shai, I.; Seidell, J.; Magni, P.; Santos, R.D.; Arsenault, B.; et al. Visceral and ectopic fat, atherosclerosis, and cardiometabolic disease: A position statement. Lancet. Diabetes Endocrinol. 2019, 7, 715–725. [Google Scholar] [CrossRef] [PubMed]
- Le Garf, S.; Negre, V.; Anty, R.; Gual, P. Metabolic fatty liver disease in children: A growing public health problem. Biomedicines 2021, 9, 1915. [Google Scholar] [CrossRef] [PubMed]
- Ciccone, M.M.; Faienza, M.F.; Altomare, M.; Nacci, C.; Montagnani, M.; Valente, F.; Cortese, F.; Gesualdo, M.; Zito, A.; Mancarella, R.; et al. Endothelial and metabolic function interactions in overweight/obese children. J. Atheroscler. Thromb. 2016, 23, 950–959. [Google Scholar] [CrossRef] [PubMed]
- Ryder, J.R.; Dengel, D.R.; Jacobs, D.R., Jr.; Sinaiko, A.R.; Kelly, A.S.; Steinberger, J. Relations among adiposity and insulin resistance with flow-mediated dilation, carotid intima-media thickness, and arterial stiffness in children. J. Pediatr. 2016, 168, 205–211. [Google Scholar] [CrossRef] [PubMed]
- Wei, D.; Gonzalez-Marrachelli, V.; Melgarejo, J.D.; Liao, C.T.; Hu, A.; Janssens, S.; Verhamme, P.; Van Aelst, L.; Vanassche, T.; Redon, J.; et al. Cardiovascular risk of metabolically healthy obesity in two European populations: Prevention potential from a metabolomic study. Cardiovasc. Diabetol. 2023, 22, 82. [Google Scholar] [CrossRef] [PubMed]
- Camhi, S.M.; Whitney Evans, E.; Hayman, L.L.; Lichtenstein, A.H.; Must, A. Healthy eating index and metabolically healthy obesity in U.S. Adolescents and adults. Prev. Med. 2015, 77, 23–27. [Google Scholar] [CrossRef] [PubMed]

| Variable | MHN | MUN | p Value |
|---|---|---|---|
| Age (years) | 13.1 (10.0–15.3) | 13.1 (10.8–15.1) | 0.62 |
| BMI (kg/m2) | 17.4 (16.5–20.3) | 18.4 (17.1–23.0) | 0.53 |
| Waist circumference (cm) | 65.5 (57.3–72.3) | 70.0 (65.0–73.0) | 0.28 |
| Waist-Hip ratio | 0.81 (0.77–0.86) | 0.83 (0.78–0.86) | 0.79 |
| Glucose Homeostasis | |||
| Glucose (mmol/L) | 4.66 (4.33–5.05) | 4.99 (4.60–5.49) | 0.060 |
| Insulin (μU/mL) | 5.8 (4.3–7.4) | 9.5 (5.6–18.5) | 0.027 |
| HOMA-IR | 1.27 (0.89–1.6) | 2.22 (1.14–4.10) | 0.038 |
| Liver Enzymes | |||
| ALT (IU/L) | 14.0 (10.5–18.5) | 16.0 (12.0–18.0) | 0.44 |
| AST (IU/L) | 21.0 (17.5–28.5) | 22.0 (17.0–29.0) | 0.90 |
| Thyroid Regulation | |||
| TSH (μIU/L) | 1600 (1400–2400) | 2500 (1800–2700) | 0.027 |
| fT4 (pmol/L) | 11.33 (10.42–12.87) | 10.29 (9.65–11.97) | 0.074 |
| Lipid Profile | |||
| TChol (mmol/L) | 4.19 (3.40–5.01) | 4.14 (3.49–4.71) | 1.00 |
| HDL (mmol/L) | 1.37 (1.23–1.49) | 1.16 (1.01–1.48) | 0.077 |
| TRG (mmol/L) | 0.62 (0.45–0.76) | 0.80 (0.49–1.26) | 0.086 |
| LDL (mmol/L) | 2.51 (2.00–3.31) | 2.67 (2.02–3.00) | 0.72 |
| Lp(α) (g/L) | 0.11 (0.05–0.24) | 0.08 (0.05–0.37) | 1.00 |
| ApoA (g/L) | 1.45 (1.37–1.55) | 1.36 (1.18–1.58) | 0.21 |
| ApoB (g/L) | 0.67 (0.52–0.78) | 0.79 (0.58–0.93) | 0.10 |
| ApoB/ApoA | 0.44 (0.35–0.56) | 0.54 (0.46–0.63) | 0.041 |
| Vascular Indices | |||
| Normalized FMD | 0.07 (0.04–0.12) | 0.09 (0.04–0.22) | 0.67 |
| Carotid IMT (mm) | 0.45 (0.43–0.48) | 0.43 (0.38–0.49) | 0.39 |
| Variable | MHO | MUO | p Value |
|---|---|---|---|
| Age (years) | 9.9 (9.5–13.8) | 12.4 (11.4–14.6) | 0.048 |
| BMI (kg/m2) | 25.4 (21.1–29.1) | 27.8 (24.7–30.0) | 0.20 |
| Waist circumference (cm) | 88.0 (68.0–95.0) | 87.8 (78.9–96.9) | 0.37 |
| Waist-Hip ratio | 0.96 (0.79–0.98) | 0.85 (0.82–0.92) | 0.21 |
| Glucose Homeostasis | |||
| Glucose (mmol/L) | 4.49 (4.10–4.88) | 4.82 (4.38–5.13) | 0.25 |
| Insulin (μU/mL) | 5.2 (3.9–9.2) | 17.7 (10.4–28.3) | 0.002 |
| HOMA-IR | 1.1 (0.8–2.0) | 3.7 (2.1–6.5) | 0.002 |
| Liver Enzymes | |||
| ALT (IU/L) | 16.0 (10.0–26.0) | 17.5 (12.8–28.3) | 0.60 |
| AST (IU/L) | 21.0 (17.0–35.0) | 22.0 (18.0–27.3) | 0.78 |
| Thyroid Regulation | |||
| TSH (μIU/L) | 2100 (1300–3000) | 2000 (1500–2600) | 0.70 |
| fT4 (pmol/L) | 11.58 (9.00–12.87) | 10.29 (9.00–11.58) | 0.44 |
| Lipid Profile | |||
| TChol (mmol/L) | 4.84 (3.73–5.96) | 4.22 (3.54–5.02) | 0.43 |
| HDL (mmol/L) | 1.24 (1.09–1.5) | 0.99 (0.89–1.26) | 0.018 |
| TRG (mmol/L) | 0.59 (0.48–1.06) | 1.46 (0.78–1.78) | 0.007 |
| LDL (mmol/L) | 3.05 (2.33–4.17) | 2.51 (1.82–3.25) | 0.28 |
| Lp(α) (g/L) | 0.07 (0.05–0.09) | 0.05 (0.02–0.19) | 0.67 |
| ApoA (g/L) | 1.42 (1.29–1.55) | 1.29 (1.14–1.41) | 0.097 |
| ApoB (g/L) | 0.70 (0.62–0.97) | 0.72 (0.58–0.96) | 0.94 |
| ApoB/ApoA | 0.49 (0.47– 0.73) | 0.66 (0.40–0.75) | 0.49 |
| Vascular Indices | |||
| Normalized FMD | 0.07 (0.05–0.11) | 0.06 (0.04–0.09) | 0.35 |
| Carotid IMT (mm) | 0.49 (0.46–0.49) | 0.46 (0.43–0.49) | 0.24 |
| Serum Biomarker | Children with Normal Weight | Overweight/Obese Children | ||||
|---|---|---|---|---|---|---|
| MHN | MUN | p Value | MHO | MUO | p Value | |
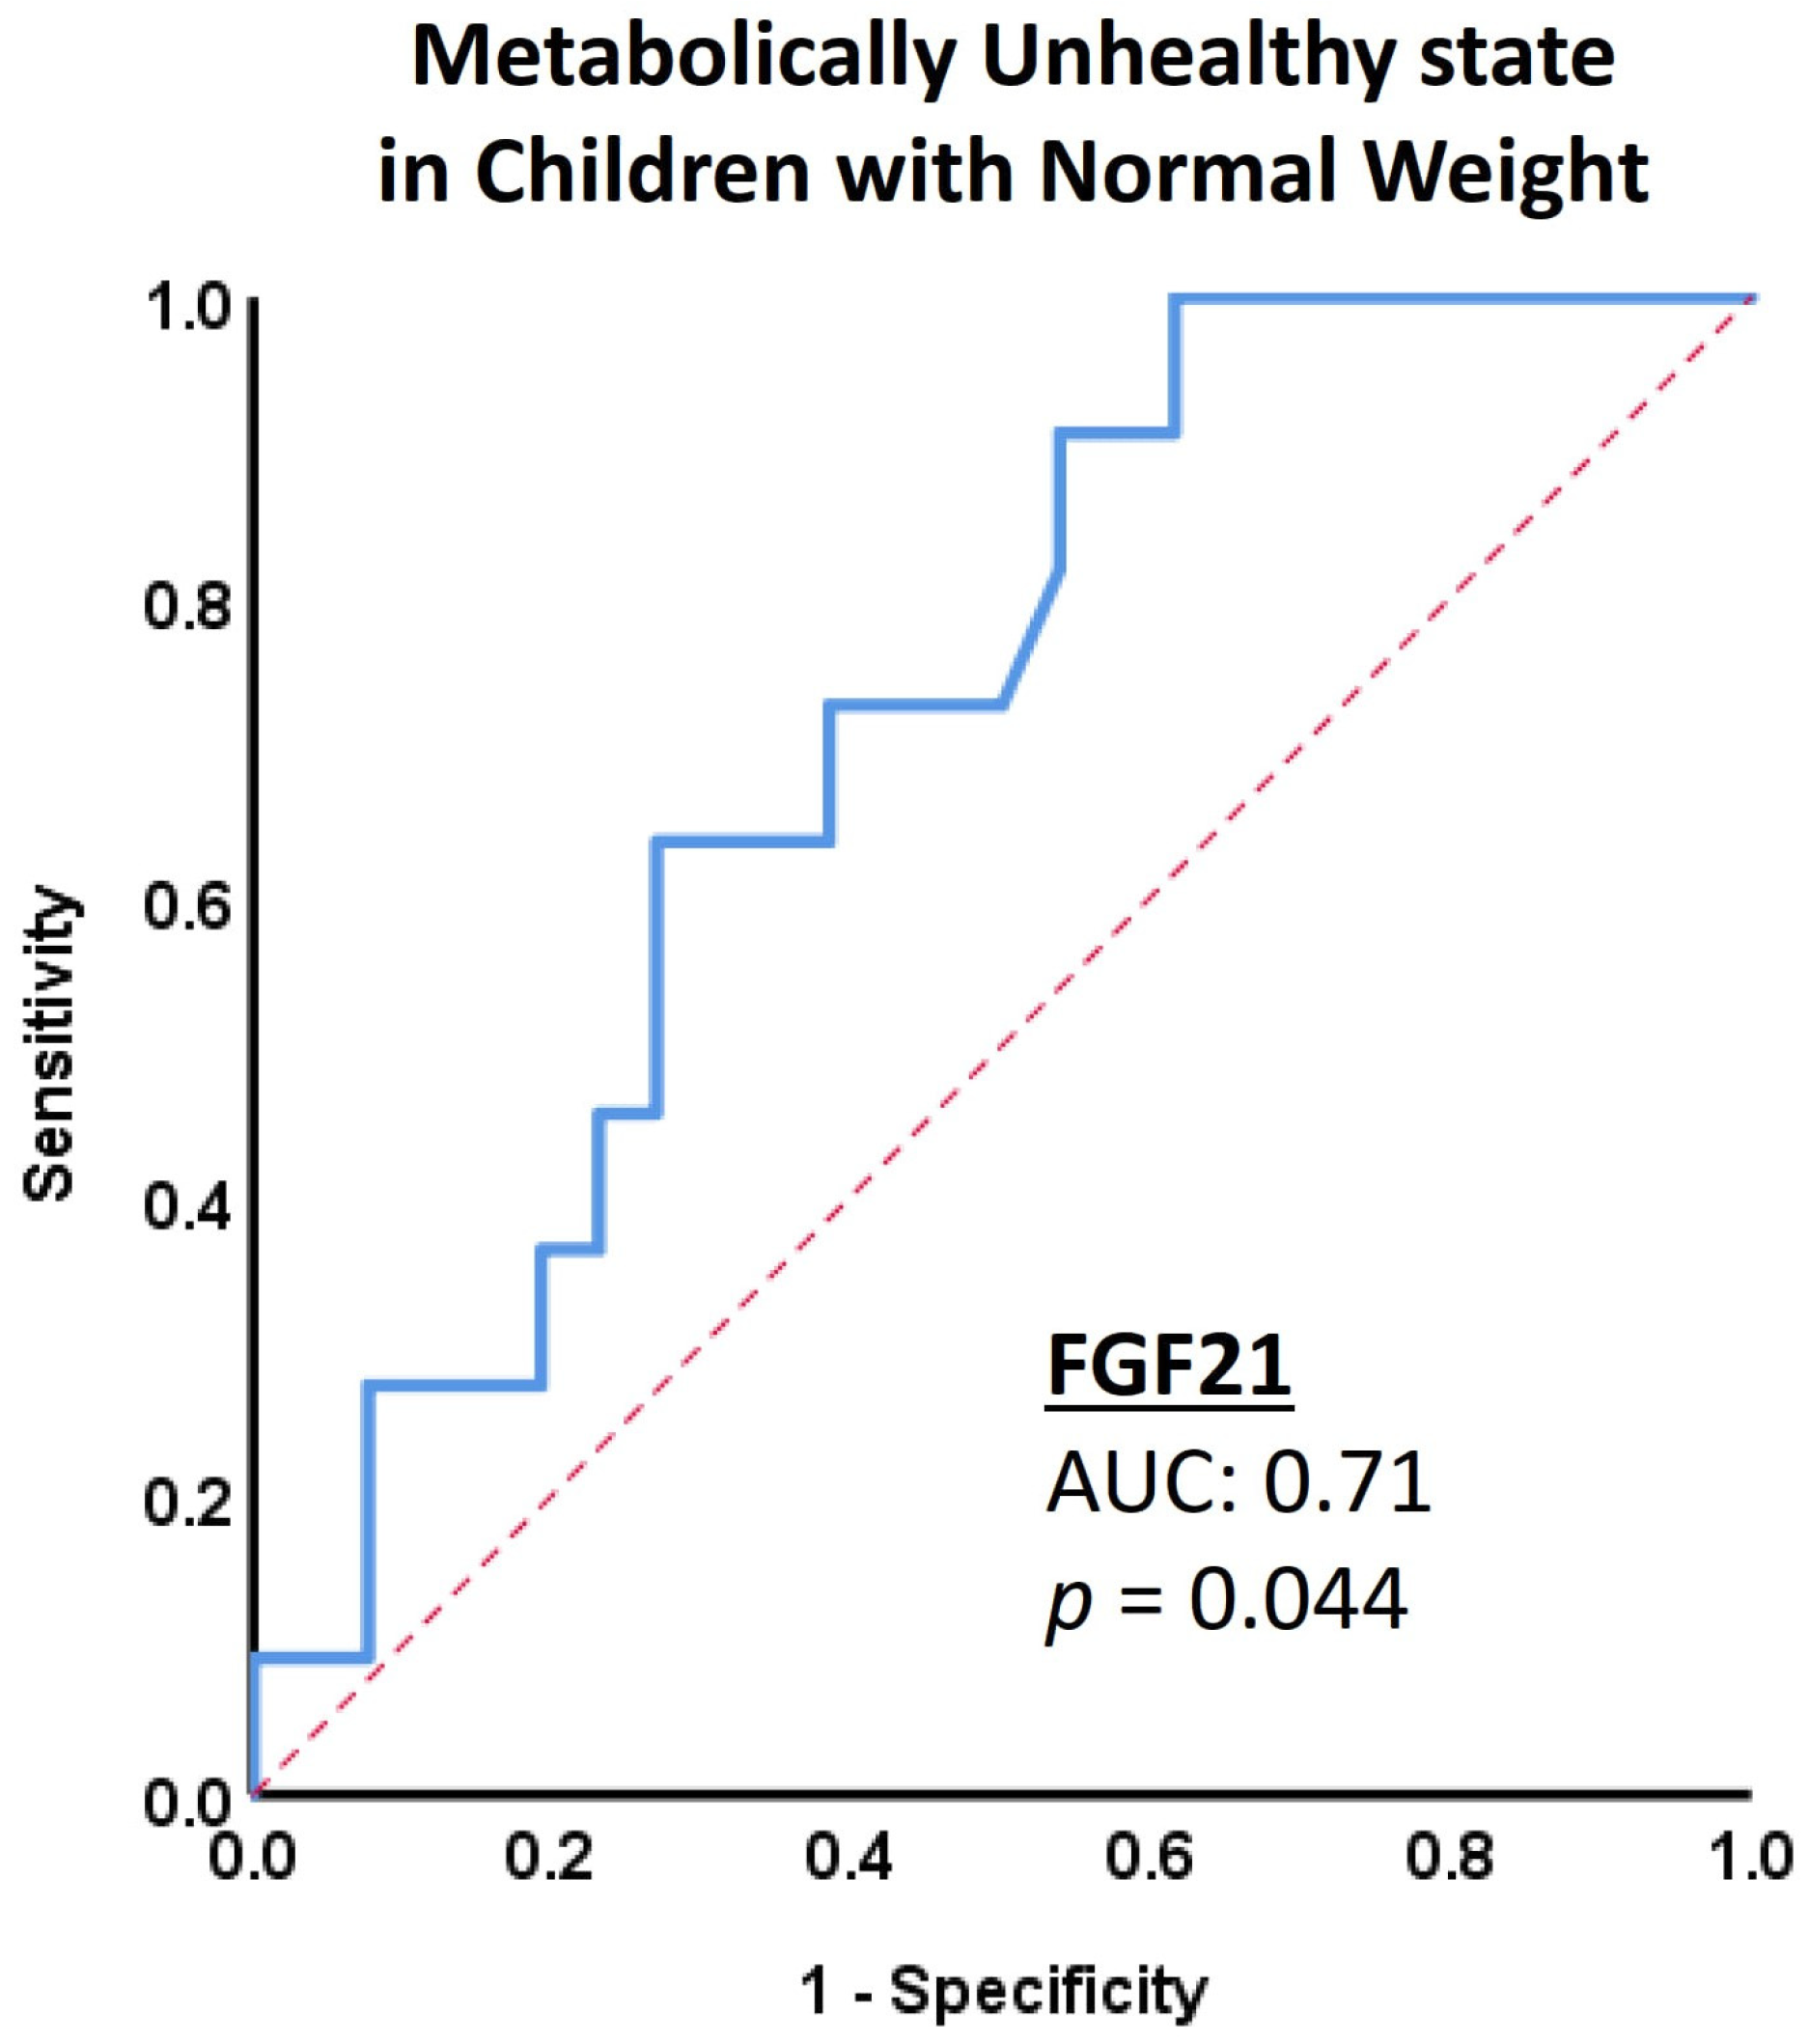
| FGF21 (pg/mL) | 28.7 (11.0–87.3) | 86.2 (28.2–107.9) | 0.044 | 64.1 (8.1–120.4) | 73.6 (48.7–118.2) | 0.386 |
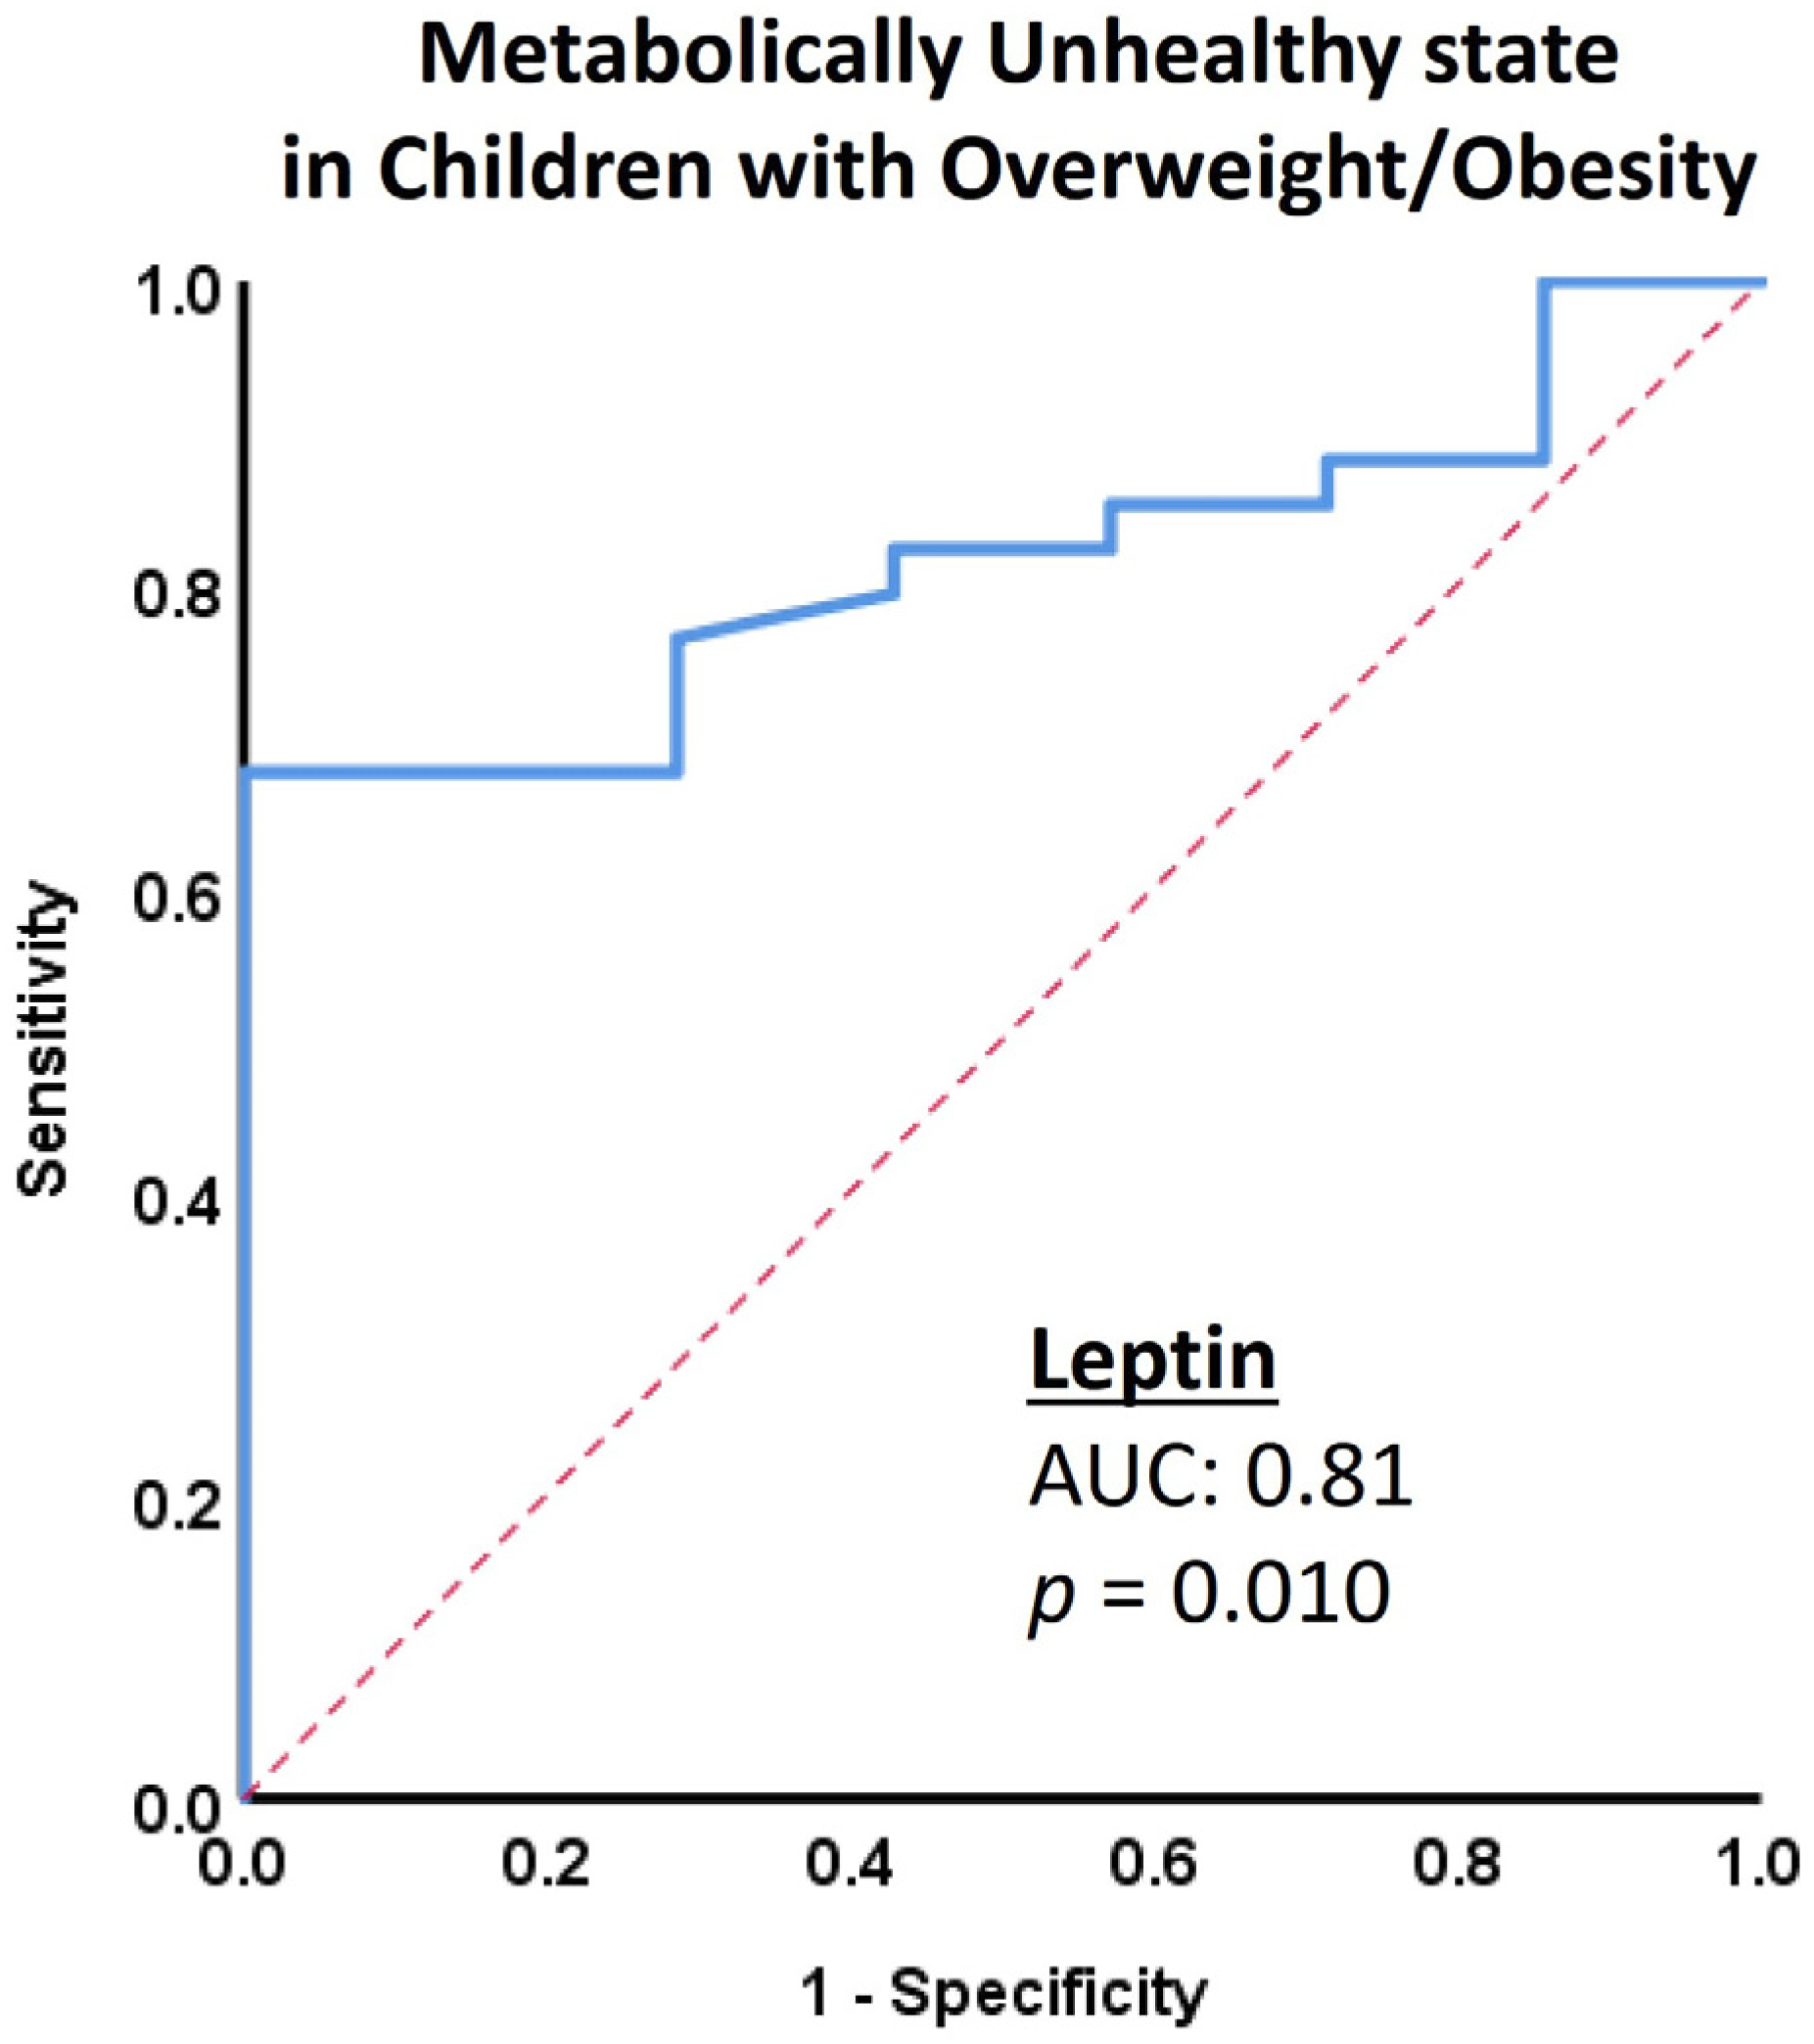
| Leptin (ng/mL) | 2.8 (1.0–10) | 3.9 (2.2–5.8) | 0.95 | 10.3 (5.8–13.8) | 18.1 (10.7–31.5) | 0.01 |
| IGFBP1 (ng/mL) | 3.0 (1.8–7.2) | 2.3 (1.5–9.9) | 0.84 | 2.6 (1.0–5.0) | 1.5 (1.15–2.87) | 0.403 |
| Adiponectin (μg/mL) | 8.6 (7.0–9.6) | 8.0 (5.5–9.8) | 0.64 | 8.5 (3.5–11.0) | 7.3 (6.0–8.9) | 0.68 |
| FGF21/Adiponectin (pg/μg) | 3.1 (1.5–8.7) | 8.3 (3.7–13.3) | 0.033 | 5.8 (0.9–33.7) | 10.4 (5.4–19.5) | 0.58 |
Disclaimer/Publisher’s Note: The statements, opinions and data contained in all publications are solely those of the individual author(s) and contributor(s) and not of MDPI and/or the editor(s). MDPI and/or the editor(s) disclaim responsibility for any injury to people or property resulting from any ideas, methods, instructions or products referred to in the content. |
© 2023 by the authors. Licensee MDPI, Basel, Switzerland. This article is an open access article distributed under the terms and conditions of the Creative Commons Attribution (CC BY) license (https://creativecommons.org/licenses/by/4.0/).
Share and Cite
Domouzoglou, E.M.; Vlahos, A.P.; Papafaklis, M.I.; Cholevas, V.K.; Chaliasos, N.; Siomou, E.; Michalis, L.K.; Tsatsoulis, A.; Naka, K.K. Role of FGF21 and Leptin for the Diagnosis of Metabolic Health in Children with and without Obesity. J. Pers. Med. 2023, 13, 1680. https://doi.org/10.3390/jpm13121680
Domouzoglou EM, Vlahos AP, Papafaklis MI, Cholevas VK, Chaliasos N, Siomou E, Michalis LK, Tsatsoulis A, Naka KK. Role of FGF21 and Leptin for the Diagnosis of Metabolic Health in Children with and without Obesity. Journal of Personalized Medicine. 2023; 13(12):1680. https://doi.org/10.3390/jpm13121680
Chicago/Turabian StyleDomouzoglou, Eleni M., Antonios P. Vlahos, Michail I. Papafaklis, Vasileios K. Cholevas, Nikolaos Chaliasos, Ekaterini Siomou, Lampros K. Michalis, Agathocles Tsatsoulis, and Katerina K. Naka. 2023. "Role of FGF21 and Leptin for the Diagnosis of Metabolic Health in Children with and without Obesity" Journal of Personalized Medicine 13, no. 12: 1680. https://doi.org/10.3390/jpm13121680
APA StyleDomouzoglou, E. M., Vlahos, A. P., Papafaklis, M. I., Cholevas, V. K., Chaliasos, N., Siomou, E., Michalis, L. K., Tsatsoulis, A., & Naka, K. K. (2023). Role of FGF21 and Leptin for the Diagnosis of Metabolic Health in Children with and without Obesity. Journal of Personalized Medicine, 13(12), 1680. https://doi.org/10.3390/jpm13121680