
Cuproptosis Depicts Immunophenotype and Predicts Immunotherapy Response in Lung Adenocarcinoma
 ,
,
Abstract
:1. Background
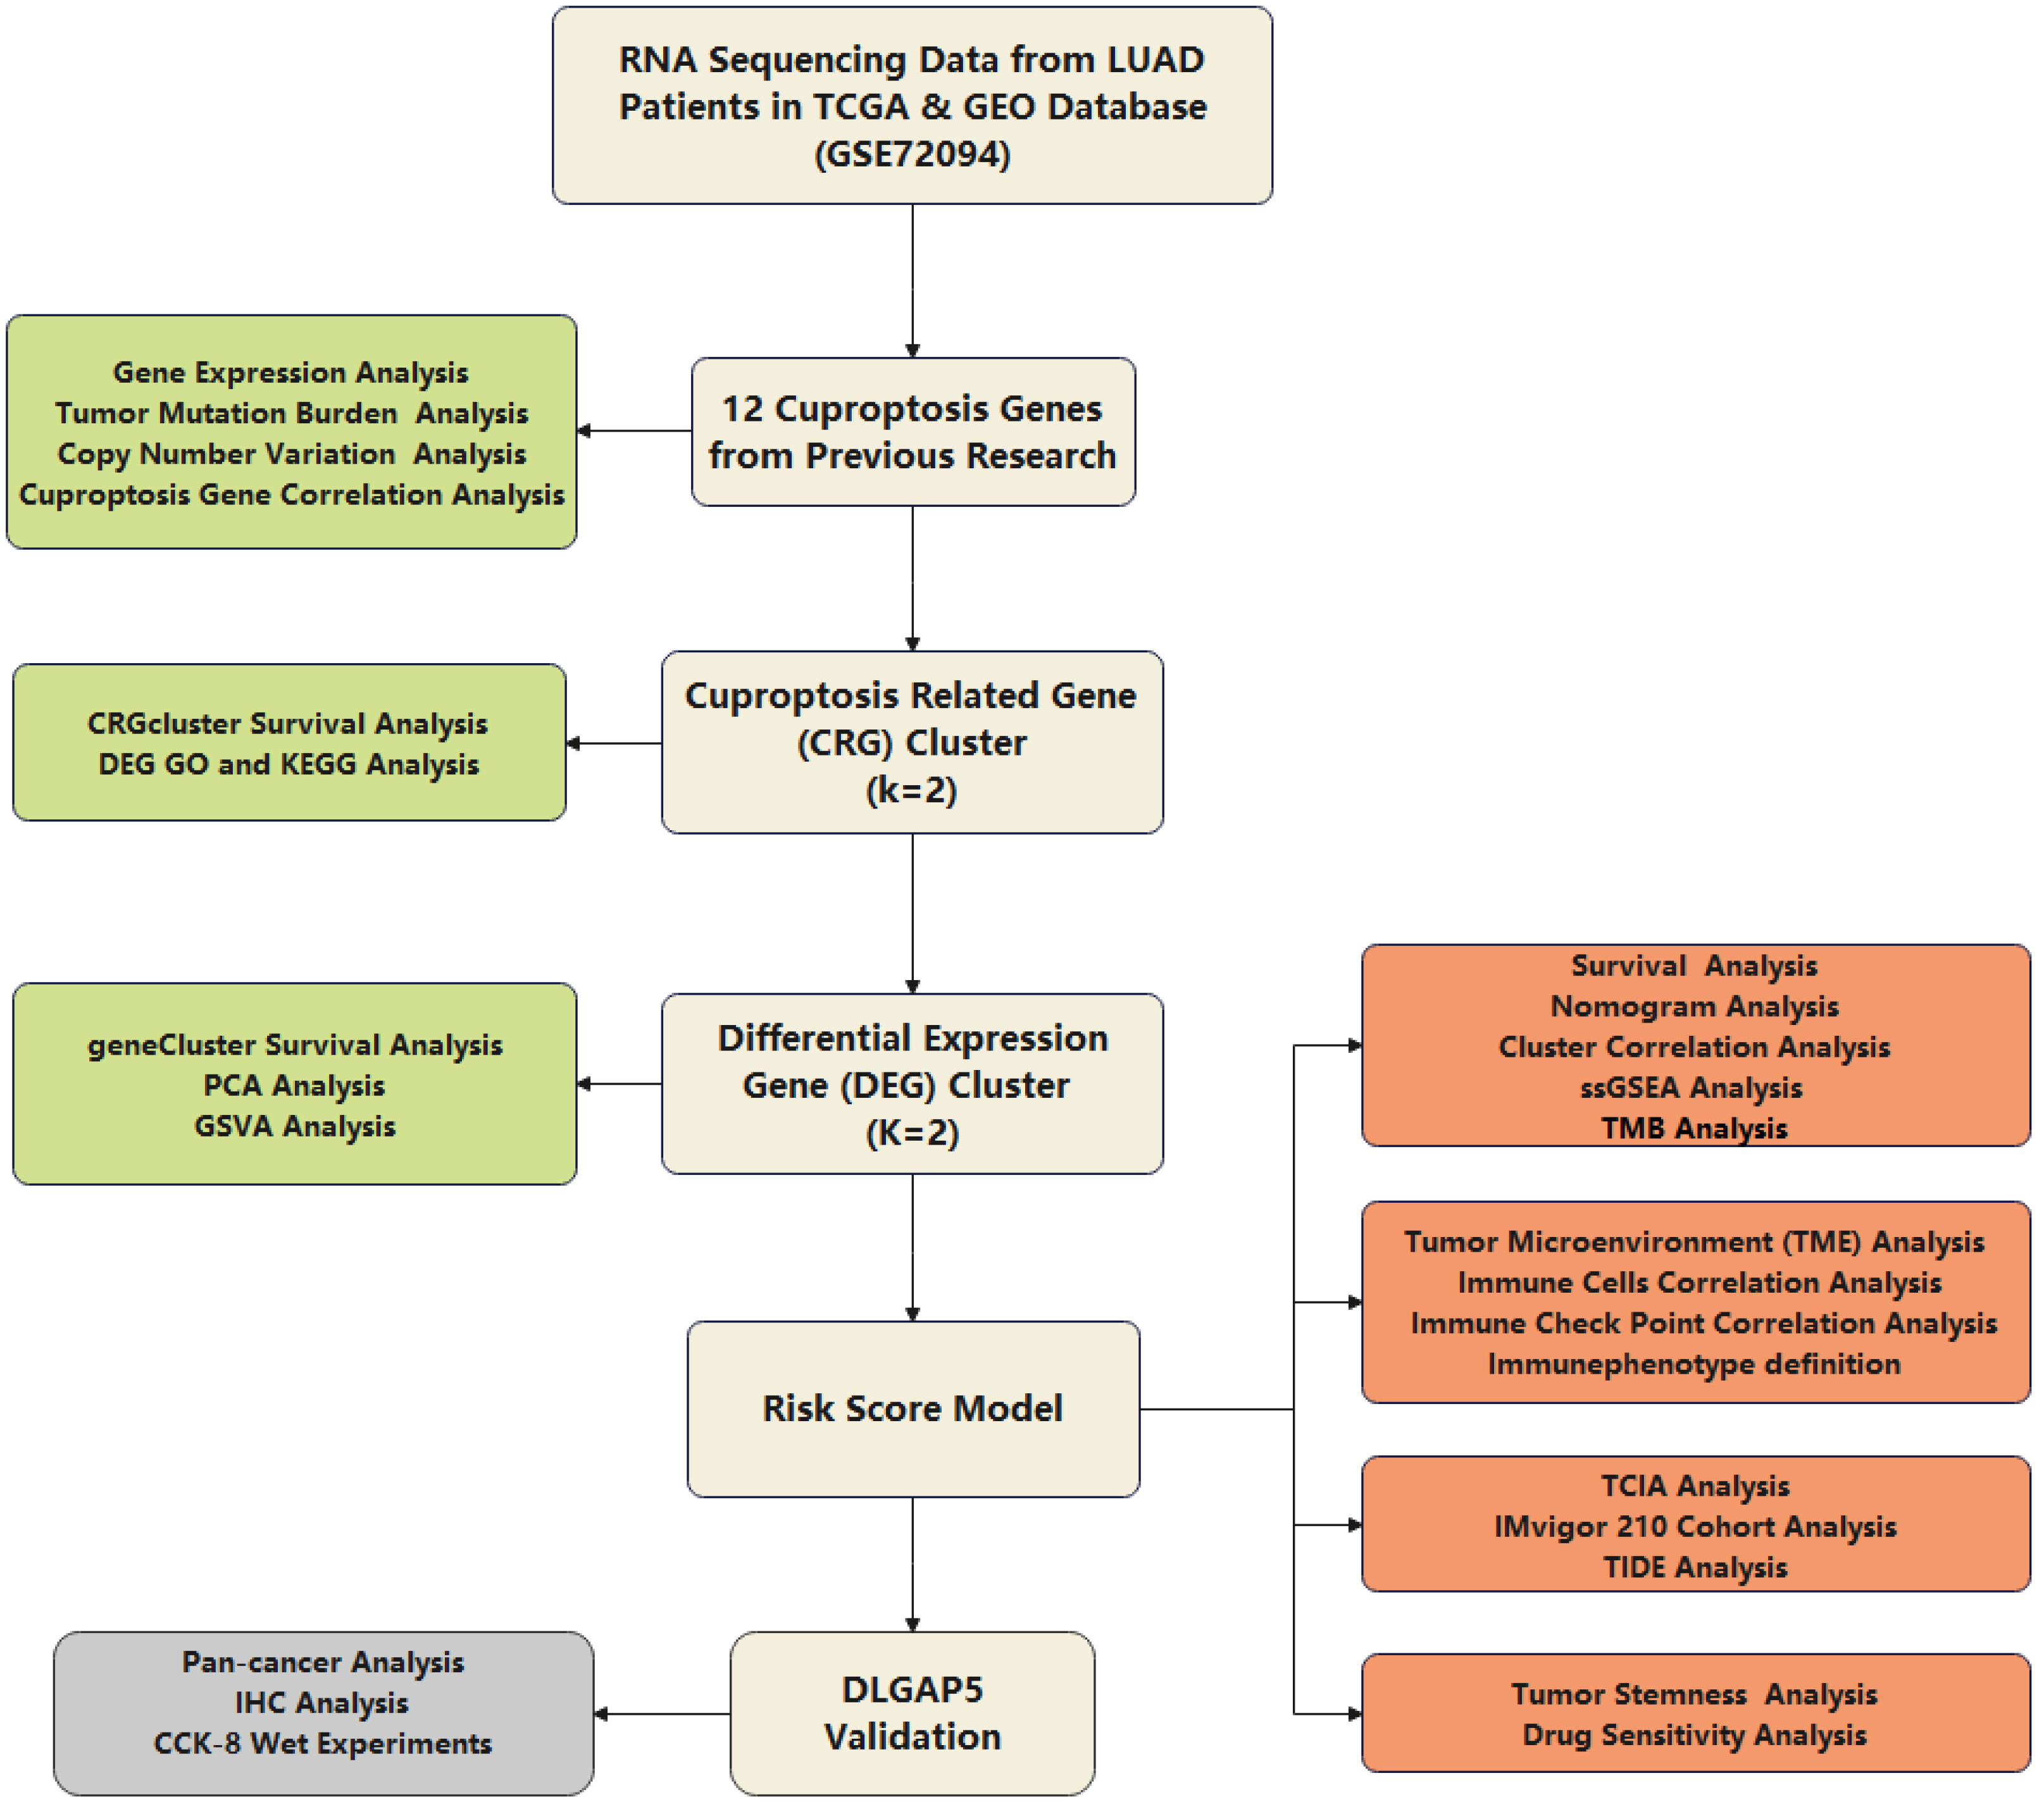
2. Methods
2.1. Multiomics Data Acquisition and Processing
2.2. Consensus Clustering Analysis of CRGs
2.3. Consensus Clustering Analysis of Differentially Expressed Genes (DEG) between the Two CRGclusters
2.4. Establishment of Risk Score Model
2.5. The Association between Risk Score and Tumor Mutation Burden (TMB)
2.6. Analysis of Risk Score in the Role of TME
2.7. Assessment of Immunotherapy Response and Validation of Risk Model
2.8. Stemness Score Analysis (RNAss) and Prediction of Chemotherapy Sensitivity
2.9. Cell Culture
2.10. Cell Counting Kit-8 (CCK-8) Assay
2.11. Statistical Analysis
3. Results
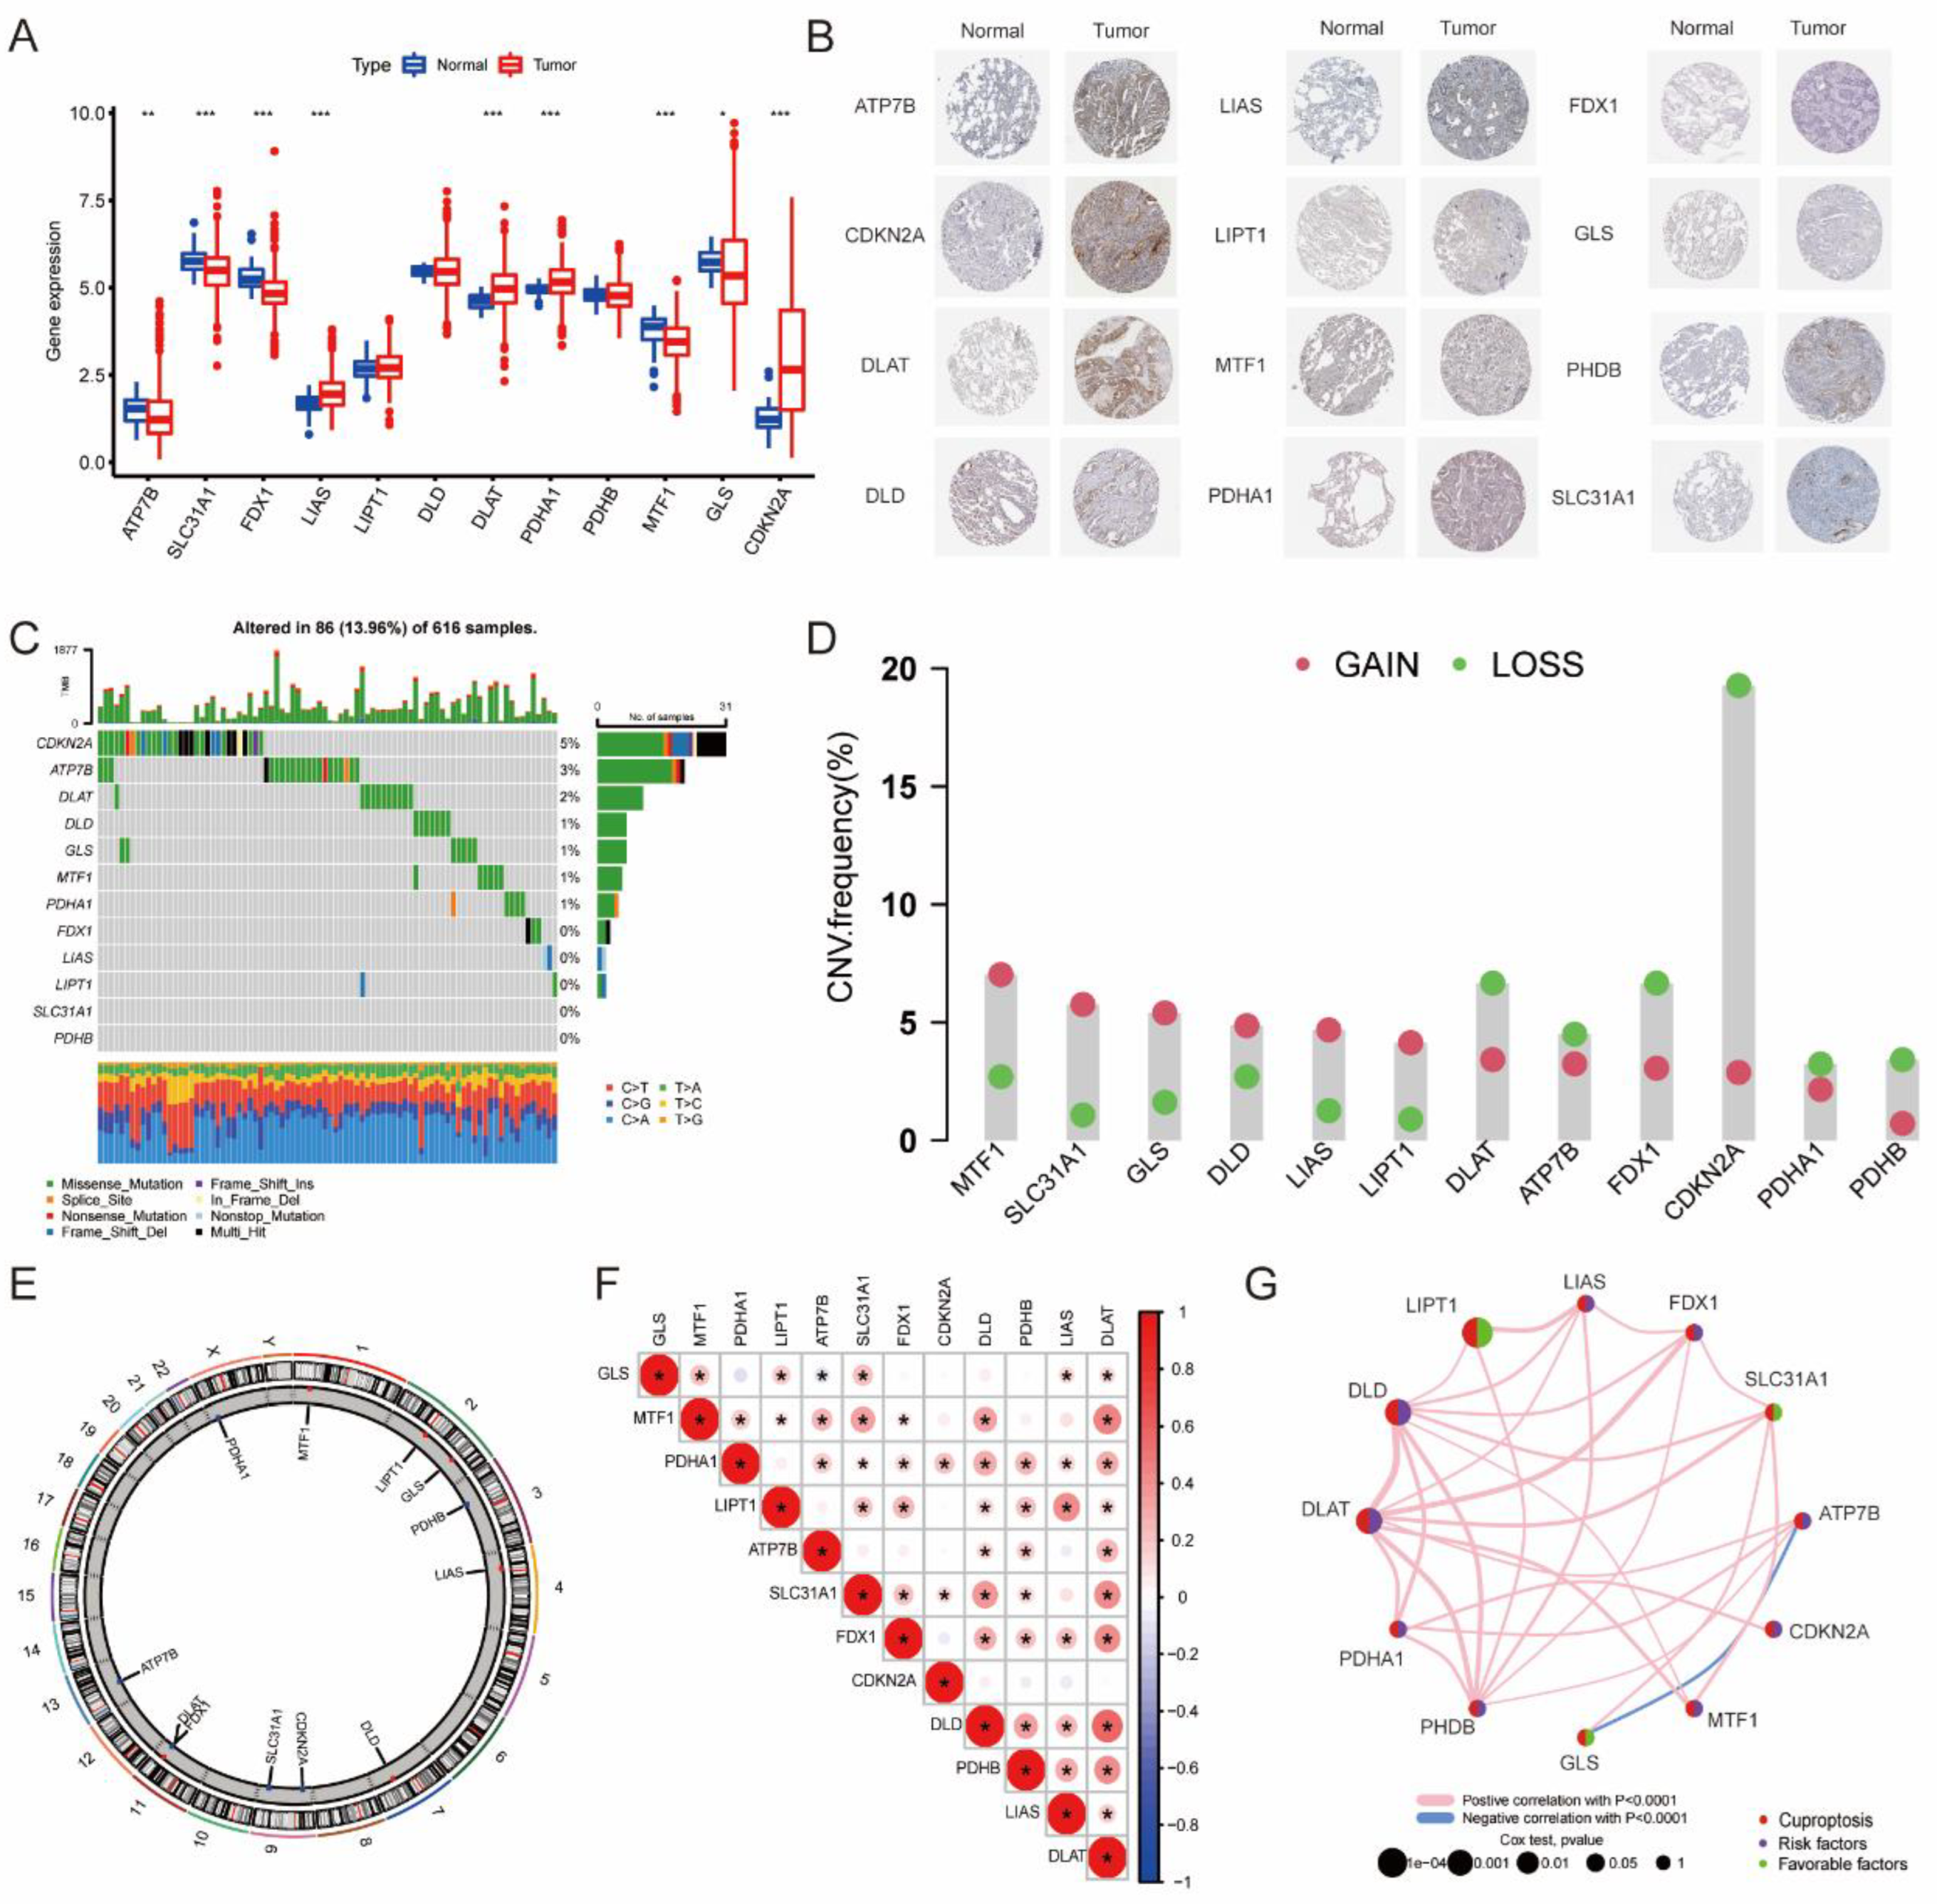
3.1. The Landscape of 12 CRGs in LUAD
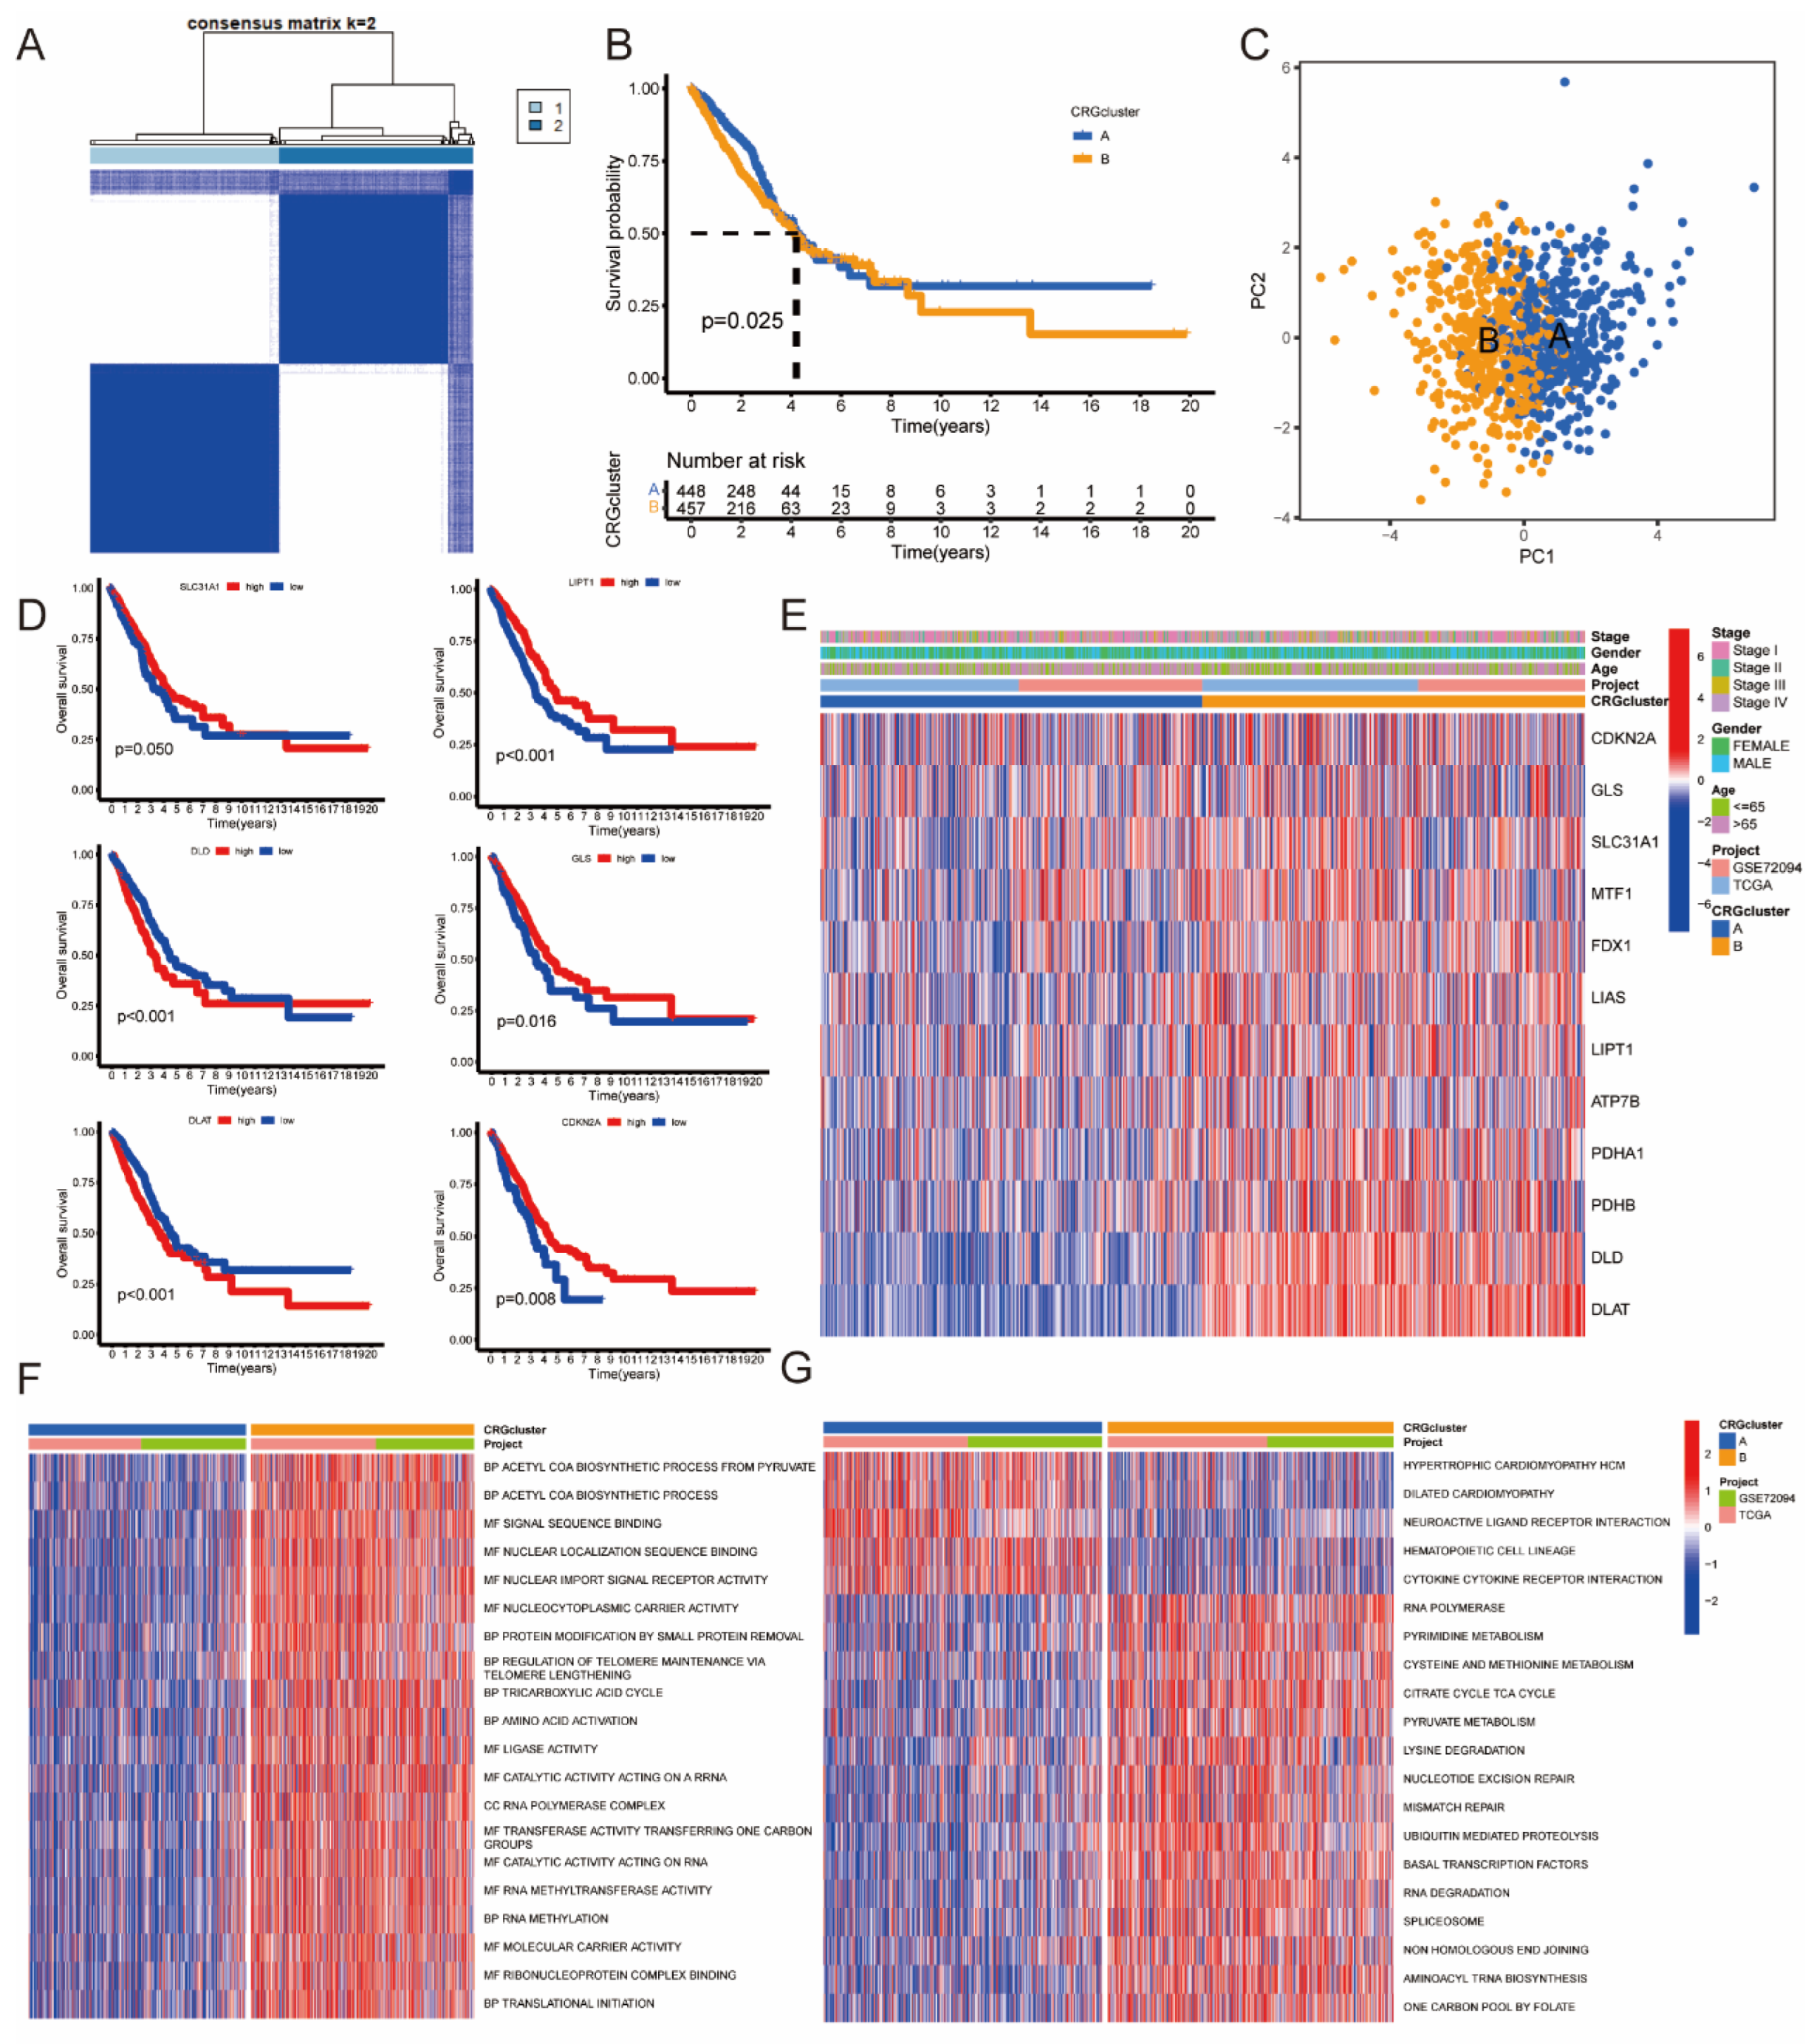
3.2. Identification of CRGcluster in LUAD
3.3. Identification of GeneCluster in LUAD
3.4. Construction of Risk Score Model Based on 91 DEGs
3.5. The Association between Risk Score and Different Clusters
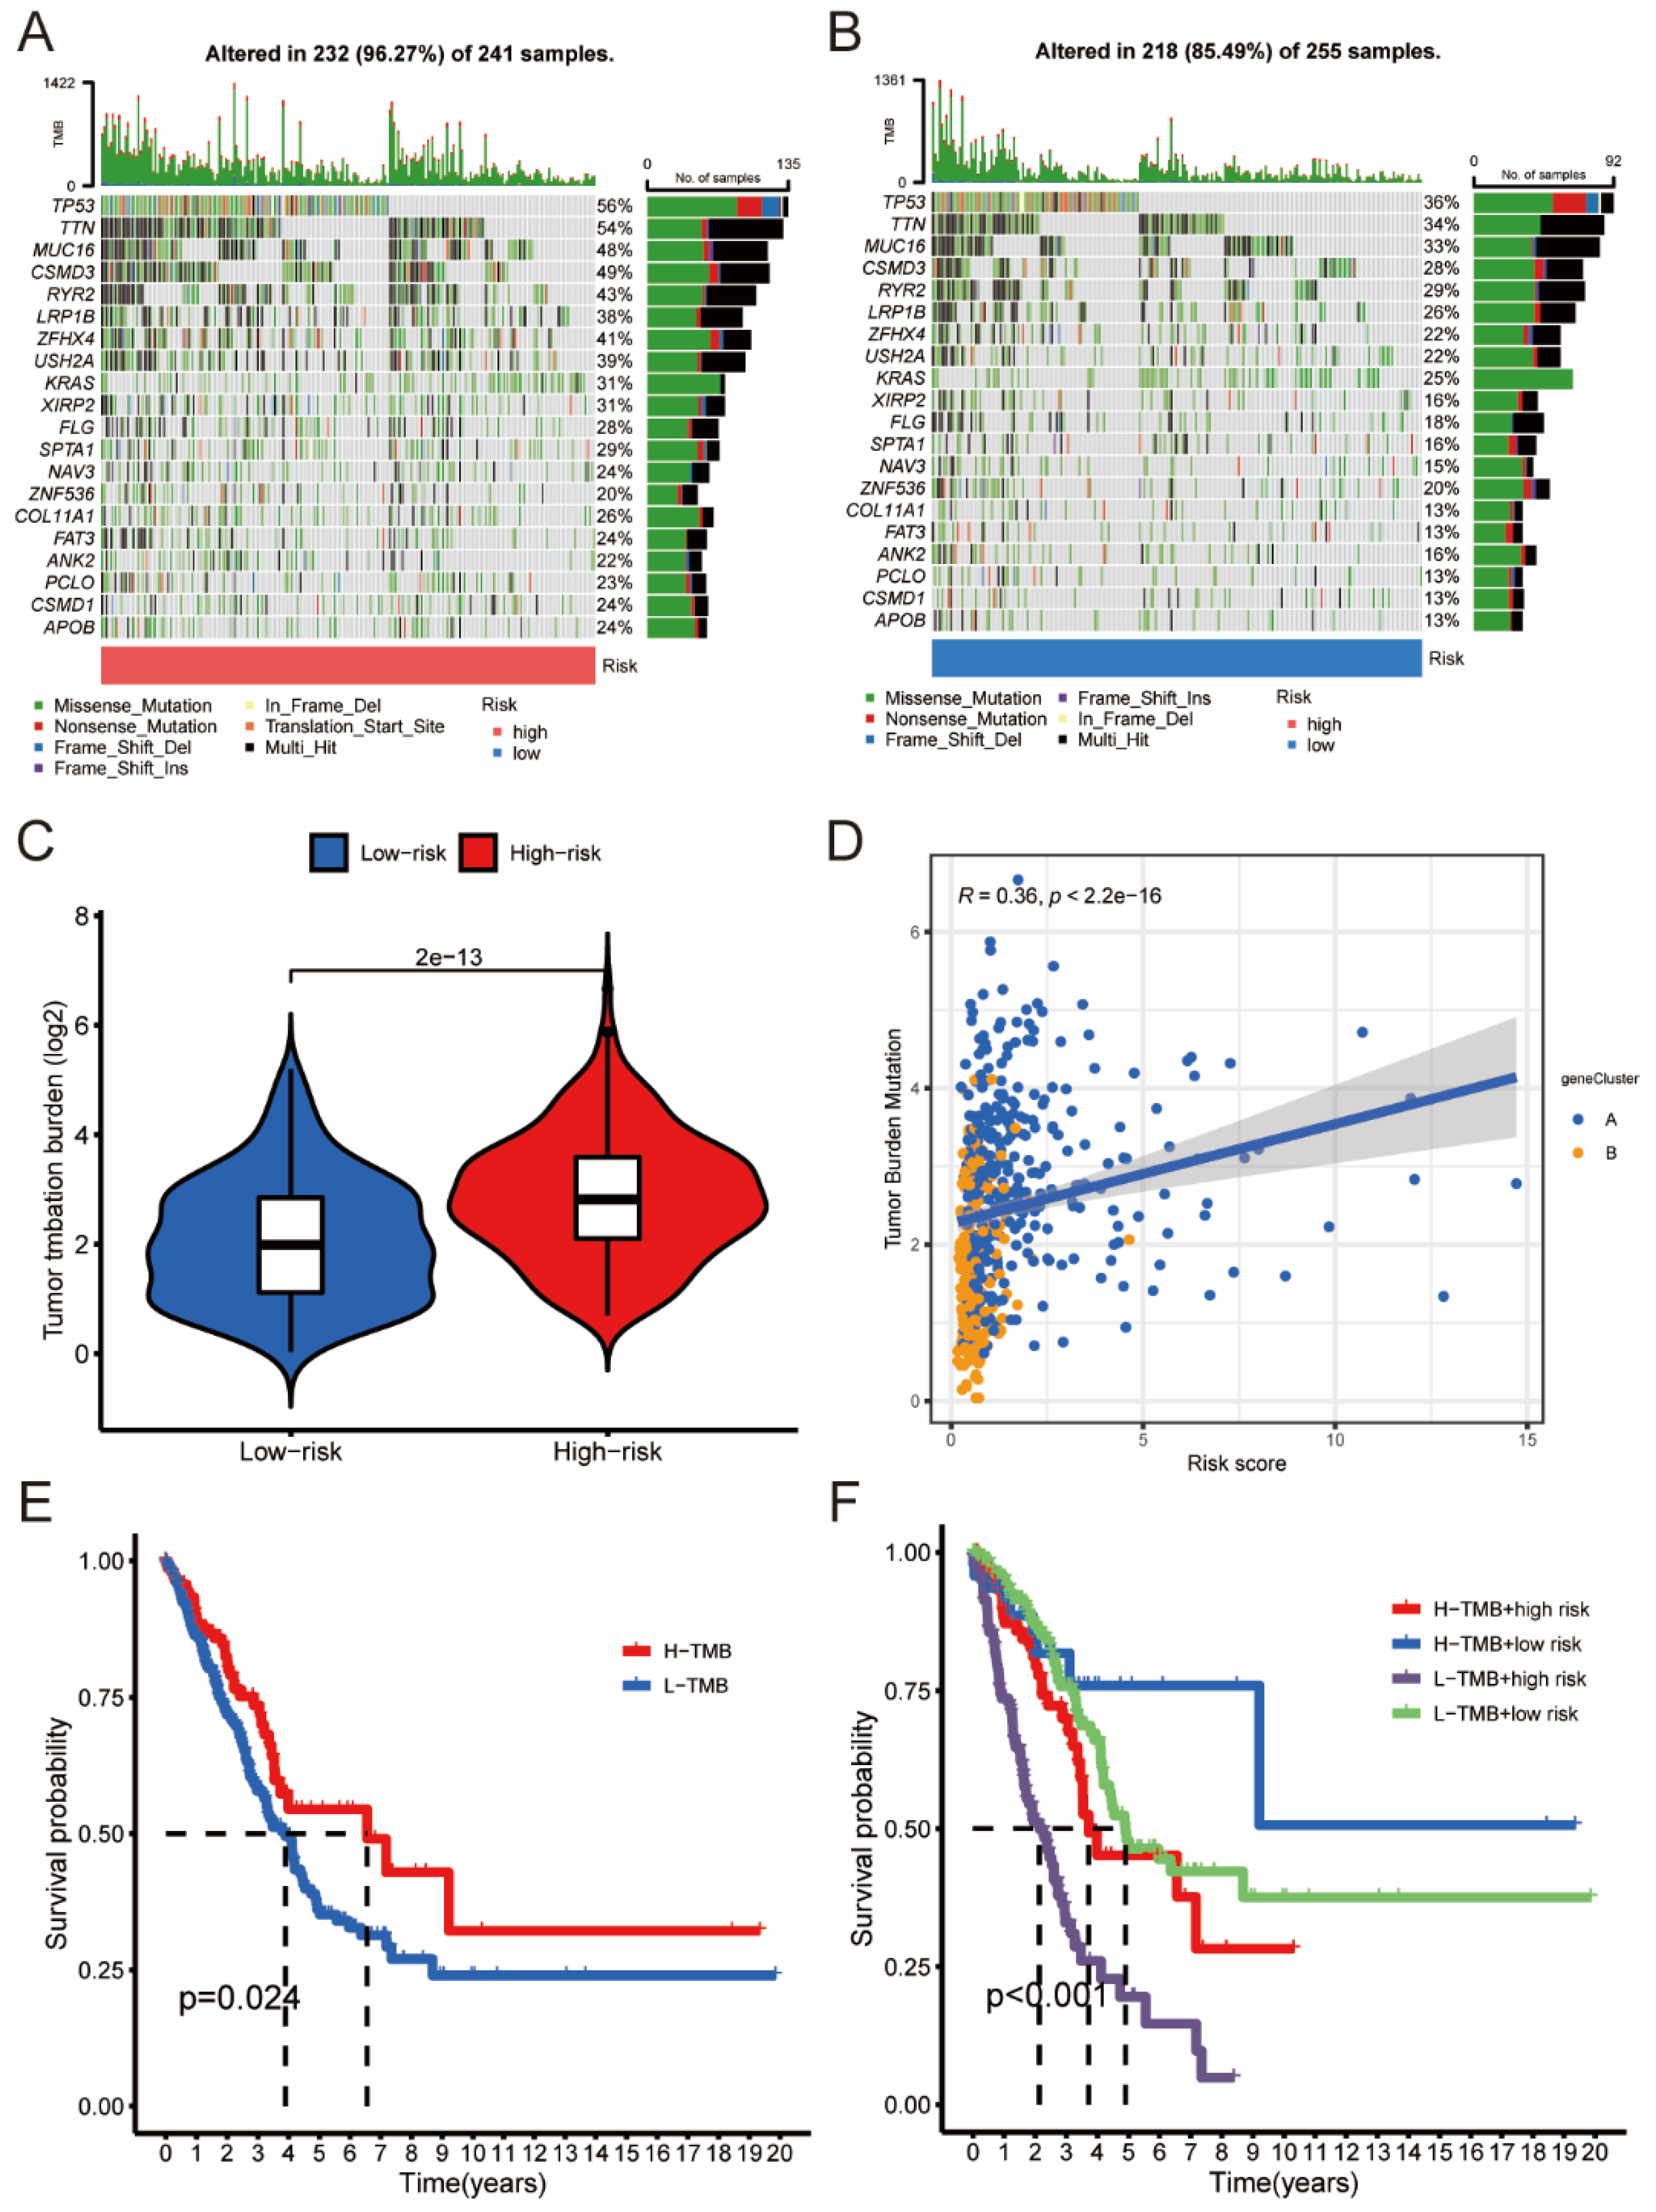
3.6. The Association between Risk Score and TMB
3.7. The Association between Risk Score and TME
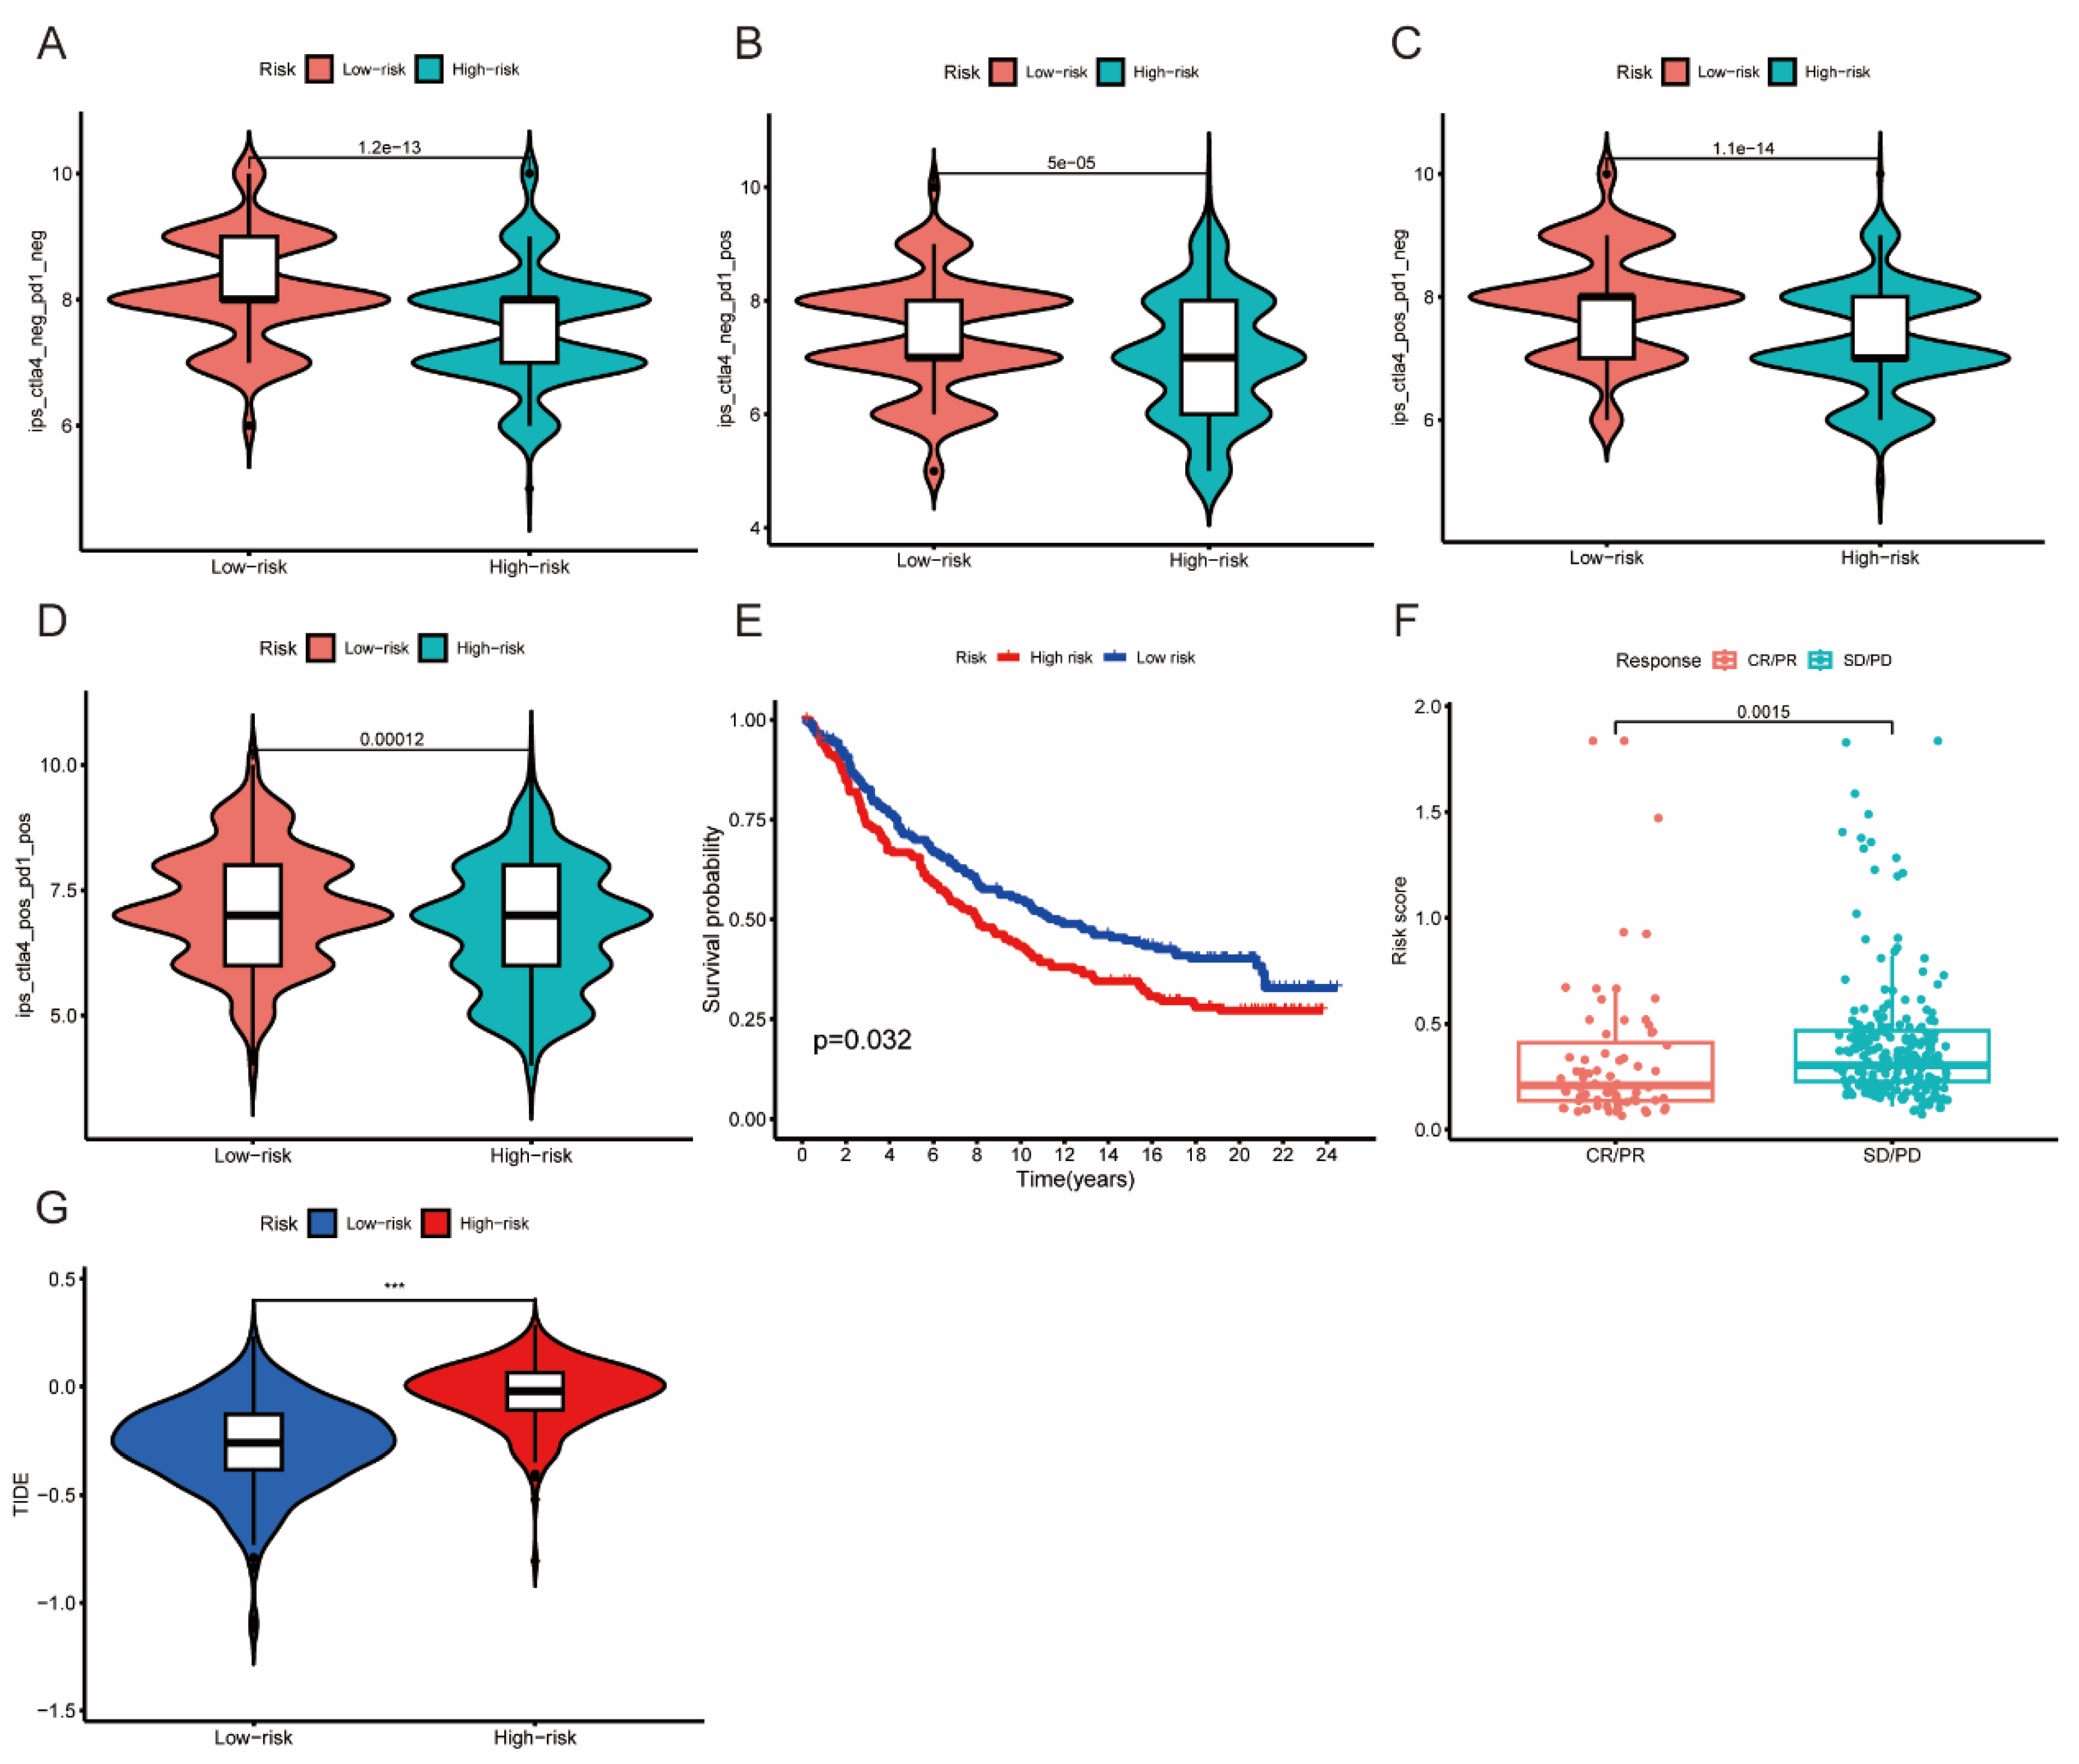
3.8. The Association between Risk Score and Immunotherapy Response
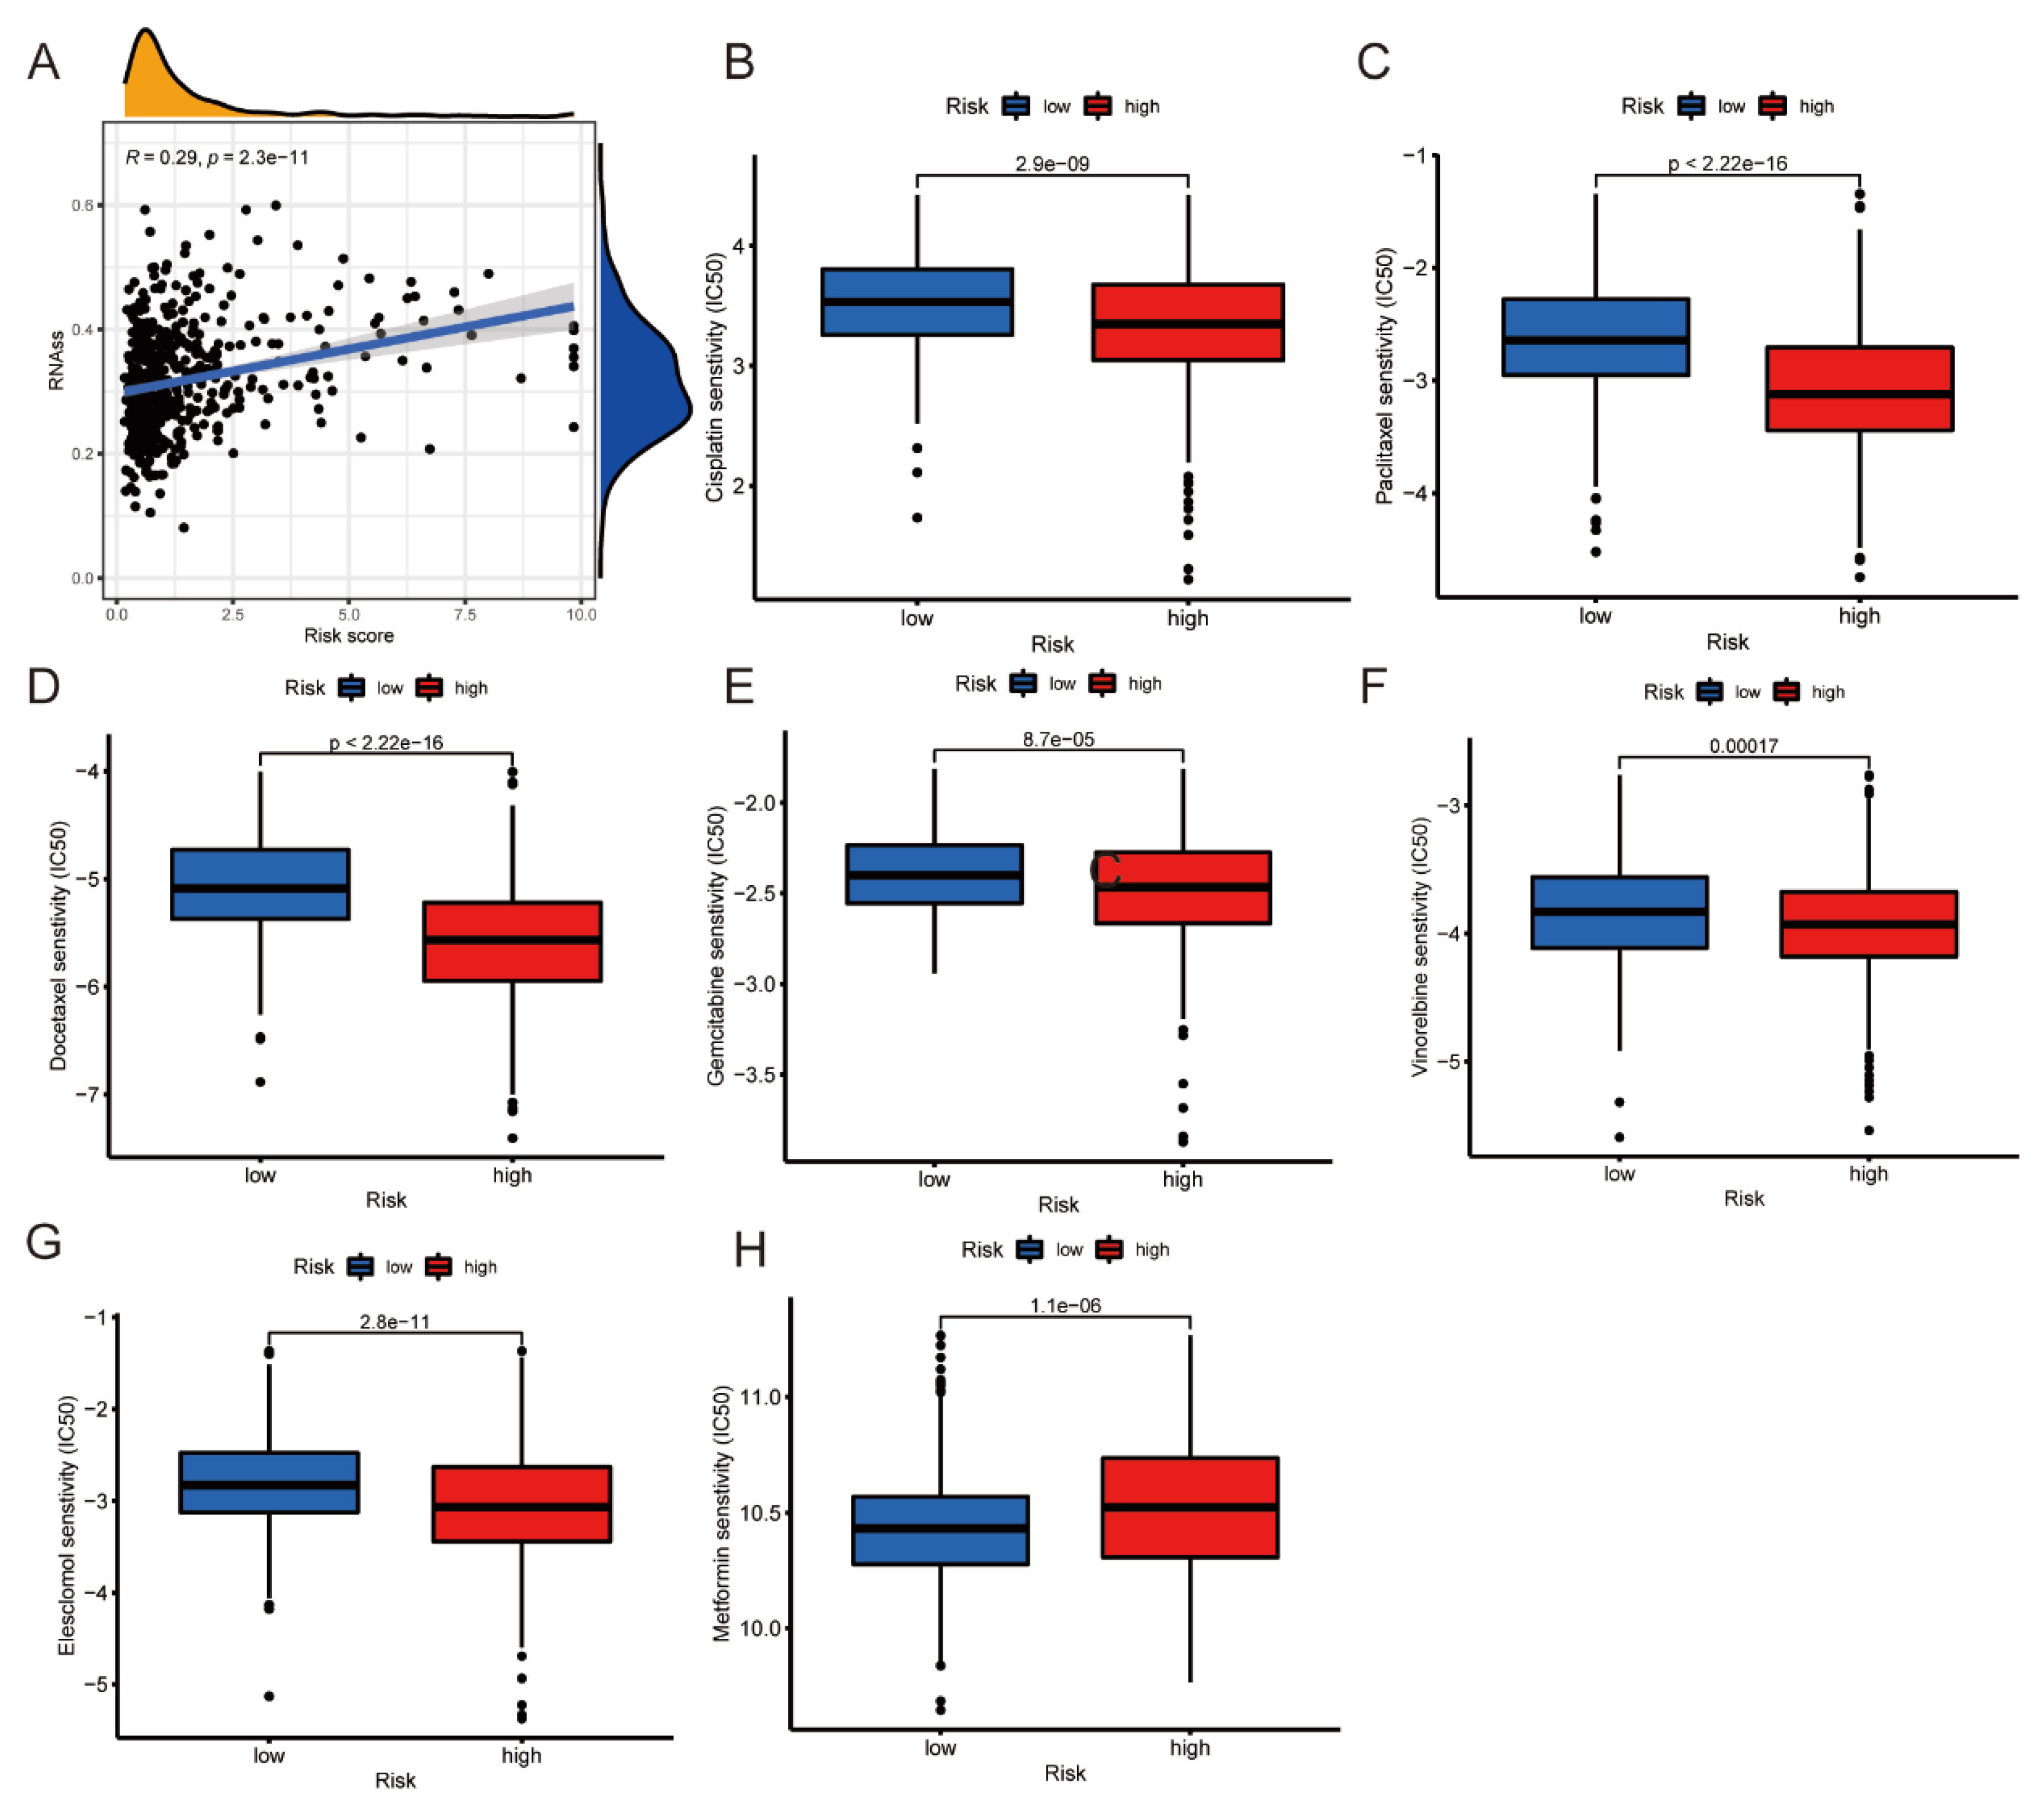
3.9. RNAss Analysis and Prediction of Chemotherapy Sensitivity
3.10. Knockdown of DLGAP5 Inhibits the Proliferation of A549 Cell Line
4. Discussion
5. Conclusions
Supplementary Materials
Author Contributions
Funding
Institutional Review Board Statement
Informed Consent Statement
Data Availability Statement
Acknowledgments
Conflicts of Interest
References
- Siegel, R.; Miller, K.; Fuchs, H.; Jemal, A. Cancer statistics, 2022. CA A Cancer J. Clin. 2022, 72, 7–33. [Google Scholar] [CrossRef] [PubMed]
- Reck, M.; Remon, J.; Hellmann, M. First-Line Immunotherapy for Non-Small-Cell Lung Cancer. J. Clin. Oncol. 2022, 40, 586–597. [Google Scholar] [CrossRef]
- Zhou, F.; Qiao, M.; Zhou, C. The cutting-edge progress of immune-checkpoint blockade in lung cancer. Cell. Mol. Immunol. 2021, 18, 279–293. [Google Scholar] [CrossRef] [PubMed]
- Qiu, S.; Wang, Y.; Rao, H.; Que, Q.; Wu, Y.; Zhu, R.; Feng, X.; Chi, J.; Lai, W.; Sun, Y.; et al. Tumor microenvironment-associated lactate metabolism regulates the prognosis and precise checkpoint immunotherapy outcomes of patients with lung adenocarcinoma. Eur. J. Med. Res. 2022, 27, 256. [Google Scholar] [CrossRef]
- Genova, C.; Dellepiane, C.; Carrega, P.; Sommariva, S.; Ferlazzo, G.; Pronzato, P.; Gangemi, R.; Filaci, G.; Coco, S.; Croce, M. Therapeutic Implications of Tumor Microenvironment in Lung Cancer: Focus on Immune Checkpoint Blockade. Front. Immunol. 2022, 12, 799455. [Google Scholar] [CrossRef] [PubMed]
- Altorki, N.K.; Markowitz, G.J.; Gao, D.; Port, J.L.; Saxena, A.; Stiles, B.; McGraw, T.; Mittal, V. The lung microenvironment: An important regulator of tumour growth and metastasis. Nat. Rev. Cancer 2019, 19, 9–31. [Google Scholar] [CrossRef] [Green Version]
- Tsvetkov, P.; Coy, S.; Petrova, B.; Dreishpoon, M.; Verma, A.; Abdusamad, M.; Rossen, J.; Joesch-Cohen, L.; Humeidi, R.; Spangler, R.D.; et al. Copper induces cell death by targeting lipoylated TCA cycle proteins. Science 2022, 375, 1254–1261. [Google Scholar] [CrossRef]
- Weinstein, J.N.; Collisson, E.A.; Mills, G.B.; Shaw, K.R.M.; Ozenberger, B.A.; Ellrott, K.; Shmulevich, I.; Sander, C.; Stuart, J.M. The Cancer Genome Atlas Pan-Cancer analysis project. Nat. Genet. 2013, 45, 1113–1120. [Google Scholar] [CrossRef]
- Schabath, M.B.; Welsh, E.A.; Fulp, W.J.; Chen, L.; Teer, J.K.; Thompson, Z.J.; Engel, B.; Xie, M.; Berglund, A.E.; Creelan, B.C.; et al. Differential association of STK11 and TP53 with KRAS mutation-associated gene expression, proliferation and immune surveillance in lung adenocarcinoma. Oncogene 2016, 35, 3209–3216. [Google Scholar] [CrossRef] [Green Version]
- Goldman, M.J.; Craft, B.; Hastie, M.; Repečka, K.; McDade, F.; Kamath, A.; Banerjee, A.; Luo, Y.; Rogers, D.; Brooks, A.N.; et al. Visualizing and interpreting cancer genomics data via the Xena platform. Nat. Biotechnol. 2020, 38, 675–678. [Google Scholar] [CrossRef]
- Pontén, F.; Jirström, K.; Uhlen, M. The Human Protein Atlas—A tool for pathology. J. Pathol. 2008, 216, 387–393. [Google Scholar] [CrossRef] [PubMed]
- Wilkerson, M.D.; Hayes, D.N. ConsensusClusterPlus: A class discovery tool with confidence assessments and item tracking. Bioinformatics 2010, 26, 1572–1573. [Google Scholar] [CrossRef] [Green Version]
- Hänzelmann, S.; Castelo, R.; Guinney, J. GSVA: Gene set variation analysis for microarray and RNA-Seq data. BMC Bioinform. 2013, 14, 7. [Google Scholar] [CrossRef] [PubMed] [Green Version]
- Yoshihara, K.; Shahmoradgoli, M.; Martínez, E.; Vegesna, R.; Kim, H.; Torres-Garcia, W.; Treviño, V.; Shen, H.; Laird, P.W.; Levine, D.A.; et al. Inferring tumour purity and stromal and immune cell admixture from expression data. Nat. Commun. 2013, 4, 2612. [Google Scholar] [CrossRef] [Green Version]
- Chen, B.; Khodadoust, M.S.; Liu, C.L.; Newman, A.M.; Alizadeh, A.A. Profiling Tumor Infiltrating Immune Cells with CIBERSORT. Methods Mol. Biol. 2018, 1711, 243–259. [Google Scholar]
- Charoentong, P.; Finotello, F.; Angelova, M.; Mayer, C.; Efremova, M.; Rieder, D.; Hackl, H.; Trajanoski, Z. Pan-cancer Immunogenomic Analyses Reveal Genotype-Immunophenotype Relationships and Predictors of Response to Checkpoint Blockade. Cell Rep. 2017, 18, 248–262. [Google Scholar] [CrossRef] [Green Version]
- Mariathasan, S.; Turley, S.J.; Nickles, D.; Castiglioni, A.; Yuen, K.; Wang, Y.; Kadel, E.E., III; Koeppen, H.; Astarita, J.L.; Cubas, R.; et al. TGFβ attenuates tumour response to PD-L1 blockade by contributing to exclusion of T cells. Nature 2018, 554, 544–548. [Google Scholar] [CrossRef] [PubMed]
- Jiang, P.; Gu, S.; Pan, D.; Fu, J.; Sahu, A.; Hu, X.; Li, Z.; Traugh, N.; Bu, X.; Li, B.; et al. Signatures of T cell dysfunction and exclusion predict cancer immunotherapy response. Nat. Med. 2018, 24, 1550–1558. [Google Scholar] [CrossRef]
- Li, Y.; Xu, Y.; Ye, K.; Wu, N.; Li, J.; Liu, N.; He, M.; Lu, B.; Zhou, W.; Hu, R. Knockdown of Tubulin Polymerization Promoting Protein Family Member 3 Suppresses Proliferation and Induces Apoptosis in Non-Small-Cell Lung Cancer. J. Cancer 2016, 7, 1189–1196. [Google Scholar] [CrossRef] [Green Version]
- Liu, X.; Fu, M.; Xia, D.; Ji, Z.; Hu, N.; Leng, Z.; Xie, W.; Fang, Y.; Zhang, J. Overexpression of FAM83A Is Associated with Poor Prognosis of Lung Adenocarcinoma. J. Oncol. 2022, 2022, 8767333. [Google Scholar] [CrossRef]
- Kim, J.; Hu, Z.; Cai, L.; Li, K.; Choi, E.; Faubert, B.; Bezwada, D.; Rodriguez-Canales, J.; Villalobos, P.; Lin, Y.-F.; et al. CPS1 maintains pyrimidine pools and DNA synthesis in KRAS/LKB1-mutant lung cancer cells. Nature 2017, 546, 168–172. [Google Scholar] [CrossRef] [PubMed] [Green Version]
- Qu, H.; Jin, Q.; Quan, C. CLDN6: From Traditional Barrier Function to Emerging Roles in Cancers. Int. J. Mol. Sci. 2021, 22, 13416. [Google Scholar] [CrossRef] [PubMed]
- Che, D.; Wang, M.; Sun, J.; Li, B.; Xu, T.; Lu, Y.; Pan, H.; Lu, Z.; Gu, X. KRT6A Promotes Lung Cancer Cell Growth and Invasion Through MYC-Regulated Pentose Phosphate Pathway. Front. Cell Dev. Biol. 2021, 9, 694071. [Google Scholar] [CrossRef]
- Duan, Q.; Zhang, H.; Zheng, J.; Zhang, L. Turning Cold into Hot: Firing up the Tumor Microenvironment. Trends Cancer 2020, 6, 605–618. [Google Scholar] [CrossRef]
- Mei, J.; Jiang, G.; Chen, Y.; Xu, Y.; Wan, Y.; Chen, R.; Liu, F.; Mao, W.; Zheng, M.; Xu, J. HLA class II molecule HLA-DRA identifies immuno-hot tumors and predicts the therapeutic response to anti-PD-1 immunotherapy in NSCLC. BMC Cancer 2022, 22, 738. [Google Scholar] [CrossRef] [PubMed]
- Liu, Y.; Zugazagoitia, J.; Ahmed, F.; Henick, B.; Gettinger, S.; Herbst, R.; Schalper, K.A.; Rimm, D.L. Immune Cell PD-L1 Colocalizes with Macrophages and Is Associated with Outcome in PD-1 Pathway Blockade Therapy. Clin. Cancer Res. 2020, 26, 970–977. [Google Scholar] [CrossRef] [Green Version]
- Sahu, A.; Kose, K.; Kraehenbuehl, L.; Byers, C.; Holland, A.; Tembo, T.; Santella, A.; Alfonso, A.; Li, M.; Cordova, M.; et al. In vivo tumor immune microenvironment phenotypes correlate with inflammation and vasculature to predict immunotherapy response. Nat. Commun. 2022, 13, 5312. [Google Scholar] [CrossRef]
- Jayaprakash, P.; Ai, M.; Liu, A.; Budhani, P.; Bartkowiak, T.; Sheng, J.; Ager, C.; Nicholas, C.; Jaiswal, A.R.; Sun, Y.; et al. Targeted hypoxia reduction restores T cell infiltration and sensitizes prostate cancer to immunotherapy. J. Clin. Investig. 2018, 128, 5137–5149. [Google Scholar] [CrossRef]
- Majidpoor, J.; Mortezaee, K. The efficacy of PD-1/PD-L1 blockade in cold cancers and future perspectives. Clin. Immunol. 2021, 226, 108707. [Google Scholar] [CrossRef]
- Zhao, P.; Li, L.; Jiang, X.; Li, Q. Mismatch repair deficiency/microsatellite instability-high as a predictor for anti-PD-1/PD-L1 immunotherapy efficacy. J. Hematol. Oncol. 2019, 12, 54. [Google Scholar] [CrossRef]
- Gadgeel, S.; Rodríguez-Abreu, D.; Speranza, G.; Esteban, E.; Felip, E.; Dómine, M.; Hui, R.; Hochmair, M.J.; Clingan, P.; Powell, S.F.; et al. Updated Analysis From KEYNOTE-189: Pembrolizumab or Placebo Plus Pemetrexed and Platinum for Previously Untreated Metastatic Nonsquamous Non-Small-Cell Lung Cancer. J. Clin. Oncol. 2020, 38, 1505–1517. [Google Scholar] [CrossRef]
- O’Brien, M.; Paz-Ares, L.; Marreaud, S.; Dafni, U.; Oselin, K.; Havel, L.; Esteban, E.; Isla, D.; Martinez-Marti, A.; Faehling, M.; et al. Pembrolizumab versus placebo as adjuvant therapy for completely resected stage IB-IIIA non-small-cell lung cancer (PEARLS/KEYNOTE-091): An interim analysis of a randomised, triple-blind, phase 3 trial. Lancet Oncol. 2022, 23, 1274–1286. [Google Scholar] [CrossRef]
- Newman, A.M.; Liu, C.L.; Green, M.R.; Gentles, A.J.; Feng, W.; Xu, Y.; Hoang, C.D.; Diehn, M.; Alizadeh, A.A. Robust enumeration of cell subsets from tissue expression profiles. Nat. Methods 2015, 12, 453–457. [Google Scholar] [CrossRef] [PubMed] [Green Version]
- Pan, S.; Song, C.; Meng, H.; Li, N.; Li, D.; Hao, B.; Lu, Z.; Geng, Q. Identification of cuproptosis-related subtypes in lung adenocarcinoma and its potential significance. Front. Pharmacol. 2022, 13, 934722. [Google Scholar] [CrossRef] [PubMed]
- Ma, S.; Zhu, J.; Wang, M.; Zhu, J.; Wang, W.; Xiong, Y.; Jiang, R.; Seetharamu, N.; Abrão, F.C.; Puthamohan, V.M.; et al. A cuproptosis-related long non-coding RNA signature to predict the prognosis and immune microenvironment characterization for lung adenocarcinoma. Transl. Lung Cancer Res. 2022, 11, 2079–2093. [Google Scholar] [CrossRef]
- Saghafi, T.; Taheri, R.A.; Parkkila, S.; Emameh, R.Z. Phytochemicals as Modulators of Long Non-Coding RNAs and Inhibitors of Cancer-Related Carbonic Anhydrases. Int. J. Mol. Sci. 2019, 20, 2939. [Google Scholar] [CrossRef] [Green Version]
- Hajipour, H.; Nouri, M.; Ghorbani, M.; Bahramifar, A.; Emameh, R.Z.; Taheri, R.A. Targeted nanostructured lipid carrier containing galangin as a promising adjuvant for improving cytotoxic effects of chemotherapeutic agents. Naunyn Schmiedebergs Arch. Pharmacol. 2021, 394, 2353–2362. [Google Scholar] [CrossRef]
- Soheilifar, M.H.; Taheri, R.A.; Zolfaghari Emameh, R.; Moshtaghian, A.; Kooshki, H.; Motie, M.R. Molecular Landscape in Alveolar Soft Part Sarcoma: Implications for Molecular Targeted Therapy. Biomed. Pharmacother. 2018, 103, 889–896. [Google Scholar] [CrossRef]
- Wang, Y.; Zhang, X.; Dai, X.; He, D. Applying immune-related lncRNA pairs to construct a prognostic signature and predict the immune landscape of stomach adenocarcinoma. Expert Rev. Anticancer. Ther. 2021, 21, 1161–1170. [Google Scholar] [CrossRef] [PubMed]
- Li, L.; Cai, Q.; Wu, Z.; Li, X.; Zhou, W.; Lu, L.; Yi, B.; Chang, R.; Zhang, H.; Cheng, Y.; et al. Bioinformatics construction and experimental validation of a cuproptosis-related lncRNA prognostic model in lung adenocarcinoma for immunotherapy response prediction. Sci. Rep. 2023, 13, 2455. [Google Scholar] [CrossRef]


| Characteristics | Training Cohort | Testing Cohort | Total | p-Value |
|---|---|---|---|---|
| Age | ||||
| ≤65 | 172 | 180 | 352 | 0.6698 |
| >65 | 268 | 262 | 530 | |
| Gender | ||||
| Female | 247 | 237 | 484 | 0.4944 |
| Male | 193 | 205 | 398 | |
| Stage | ||||
| Stage I | 250 | 269 | 519 | 0.6263 |
| Stage II | 96 | 89 | 185 | |
| Stage III | 71 | 66 | 137 | |
| Stage IV | 23 | 18 | 41 |
| Model Gene ID | Coefficient | HR | HR.95 L | HR.95H | p |
|---|---|---|---|---|---|
| LTB | −0.137957879670175 | 0.417 | 0.233 | 0.748 | 0.003 |
| DLGAP5 | 0.130544222141117 | 3.967 | 2.172 | 7.245 | 0.001 |
| TPPP3 | 0.228761500541897 | 0.474 | 0.263 | 0.854 | 0.013 |
| FAM83A | 0.153655354188085 | 2.444 | 1.429 | 4.181 | 0.001 |
| ABCC2 | 0.150266269384804 | 1.989 | 1.487 | 2.659 | 0.001 |
| VSIG2 | −0.0991593804465051 | 0.447 | 0.295 | 0.676 | 0.001 |
| CPS1 | 0.0859641132043299 | 1.413 | 1.114 | 1.791 | 0.004 |
| CYP4B1 | −0.0839532602813634 | 0.616 | 0.464 | 0.818 | 0.001 |
| CLDN6 | 0.0476999799180695 | 1.320 | 1.052 | 1.656 | 0.016 |
| FGB | −0.0873497912904369 | 1.323 | 1.094 | 1.560 | 0.003 |
| KRT6A | 0.0866237588843813 | 1.567 | 1.254 | 1.958 | 0.001 |
Disclaimer/Publisher’s Note: The statements, opinions and data contained in all publications are solely those of the individual author(s) and contributor(s) and not of MDPI and/or the editor(s). MDPI and/or the editor(s) disclaim responsibility for any injury to people or property resulting from any ideas, methods, instructions or products referred to in the content. |
© 2023 by the authors. Licensee MDPI, Basel, Switzerland. This article is an open access article distributed under the terms and conditions of the Creative Commons Attribution (CC BY) license (https://creativecommons.org/licenses/by/4.0/).
Share and Cite
Zhou, W.; Cheng, Y.; Li, L.; Zhang, H.; Li, X.; Chang, R.; Xiao, X.; Lu, L.; Yi, B.; Gao, Y.; et al. Cuproptosis Depicts Immunophenotype and Predicts Immunotherapy Response in Lung Adenocarcinoma. J. Pers. Med. 2023, 13, 482. https://doi.org/10.3390/jpm13030482
Zhou W, Cheng Y, Li L, Zhang H, Li X, Chang R, Xiao X, Lu L, Yi B, Gao Y, et al. Cuproptosis Depicts Immunophenotype and Predicts Immunotherapy Response in Lung Adenocarcinoma. Journal of Personalized Medicine. 2023; 13(3):482. https://doi.org/10.3390/jpm13030482
Chicago/Turabian StyleZhou, Wolong, Yuanda Cheng, Linfeng Li, Heng Zhang, Xizhe Li, Ruimin Chang, Xiaoxiong Xiao, Liqing Lu, Bin Yi, Yang Gao, and et al. 2023. "Cuproptosis Depicts Immunophenotype and Predicts Immunotherapy Response in Lung Adenocarcinoma" Journal of Personalized Medicine 13, no. 3: 482. https://doi.org/10.3390/jpm13030482