
Epigenetic Signatures in Hypertension


Abstract
:1. Introduction
2. Materials and Methods
2.1. Data
2.2. Preliminary Filtering
2.3. Secondary Filtering
2.4. Optimization
3. Results
3.1. Base Line
3.2. Filtering
3.3. Optimization
4. Discussion
Author Contributions
Funding
Institutional Review Board Statement
Informed Consent Statement
Data Availability Statement
Conflicts of Interest
Appendix A

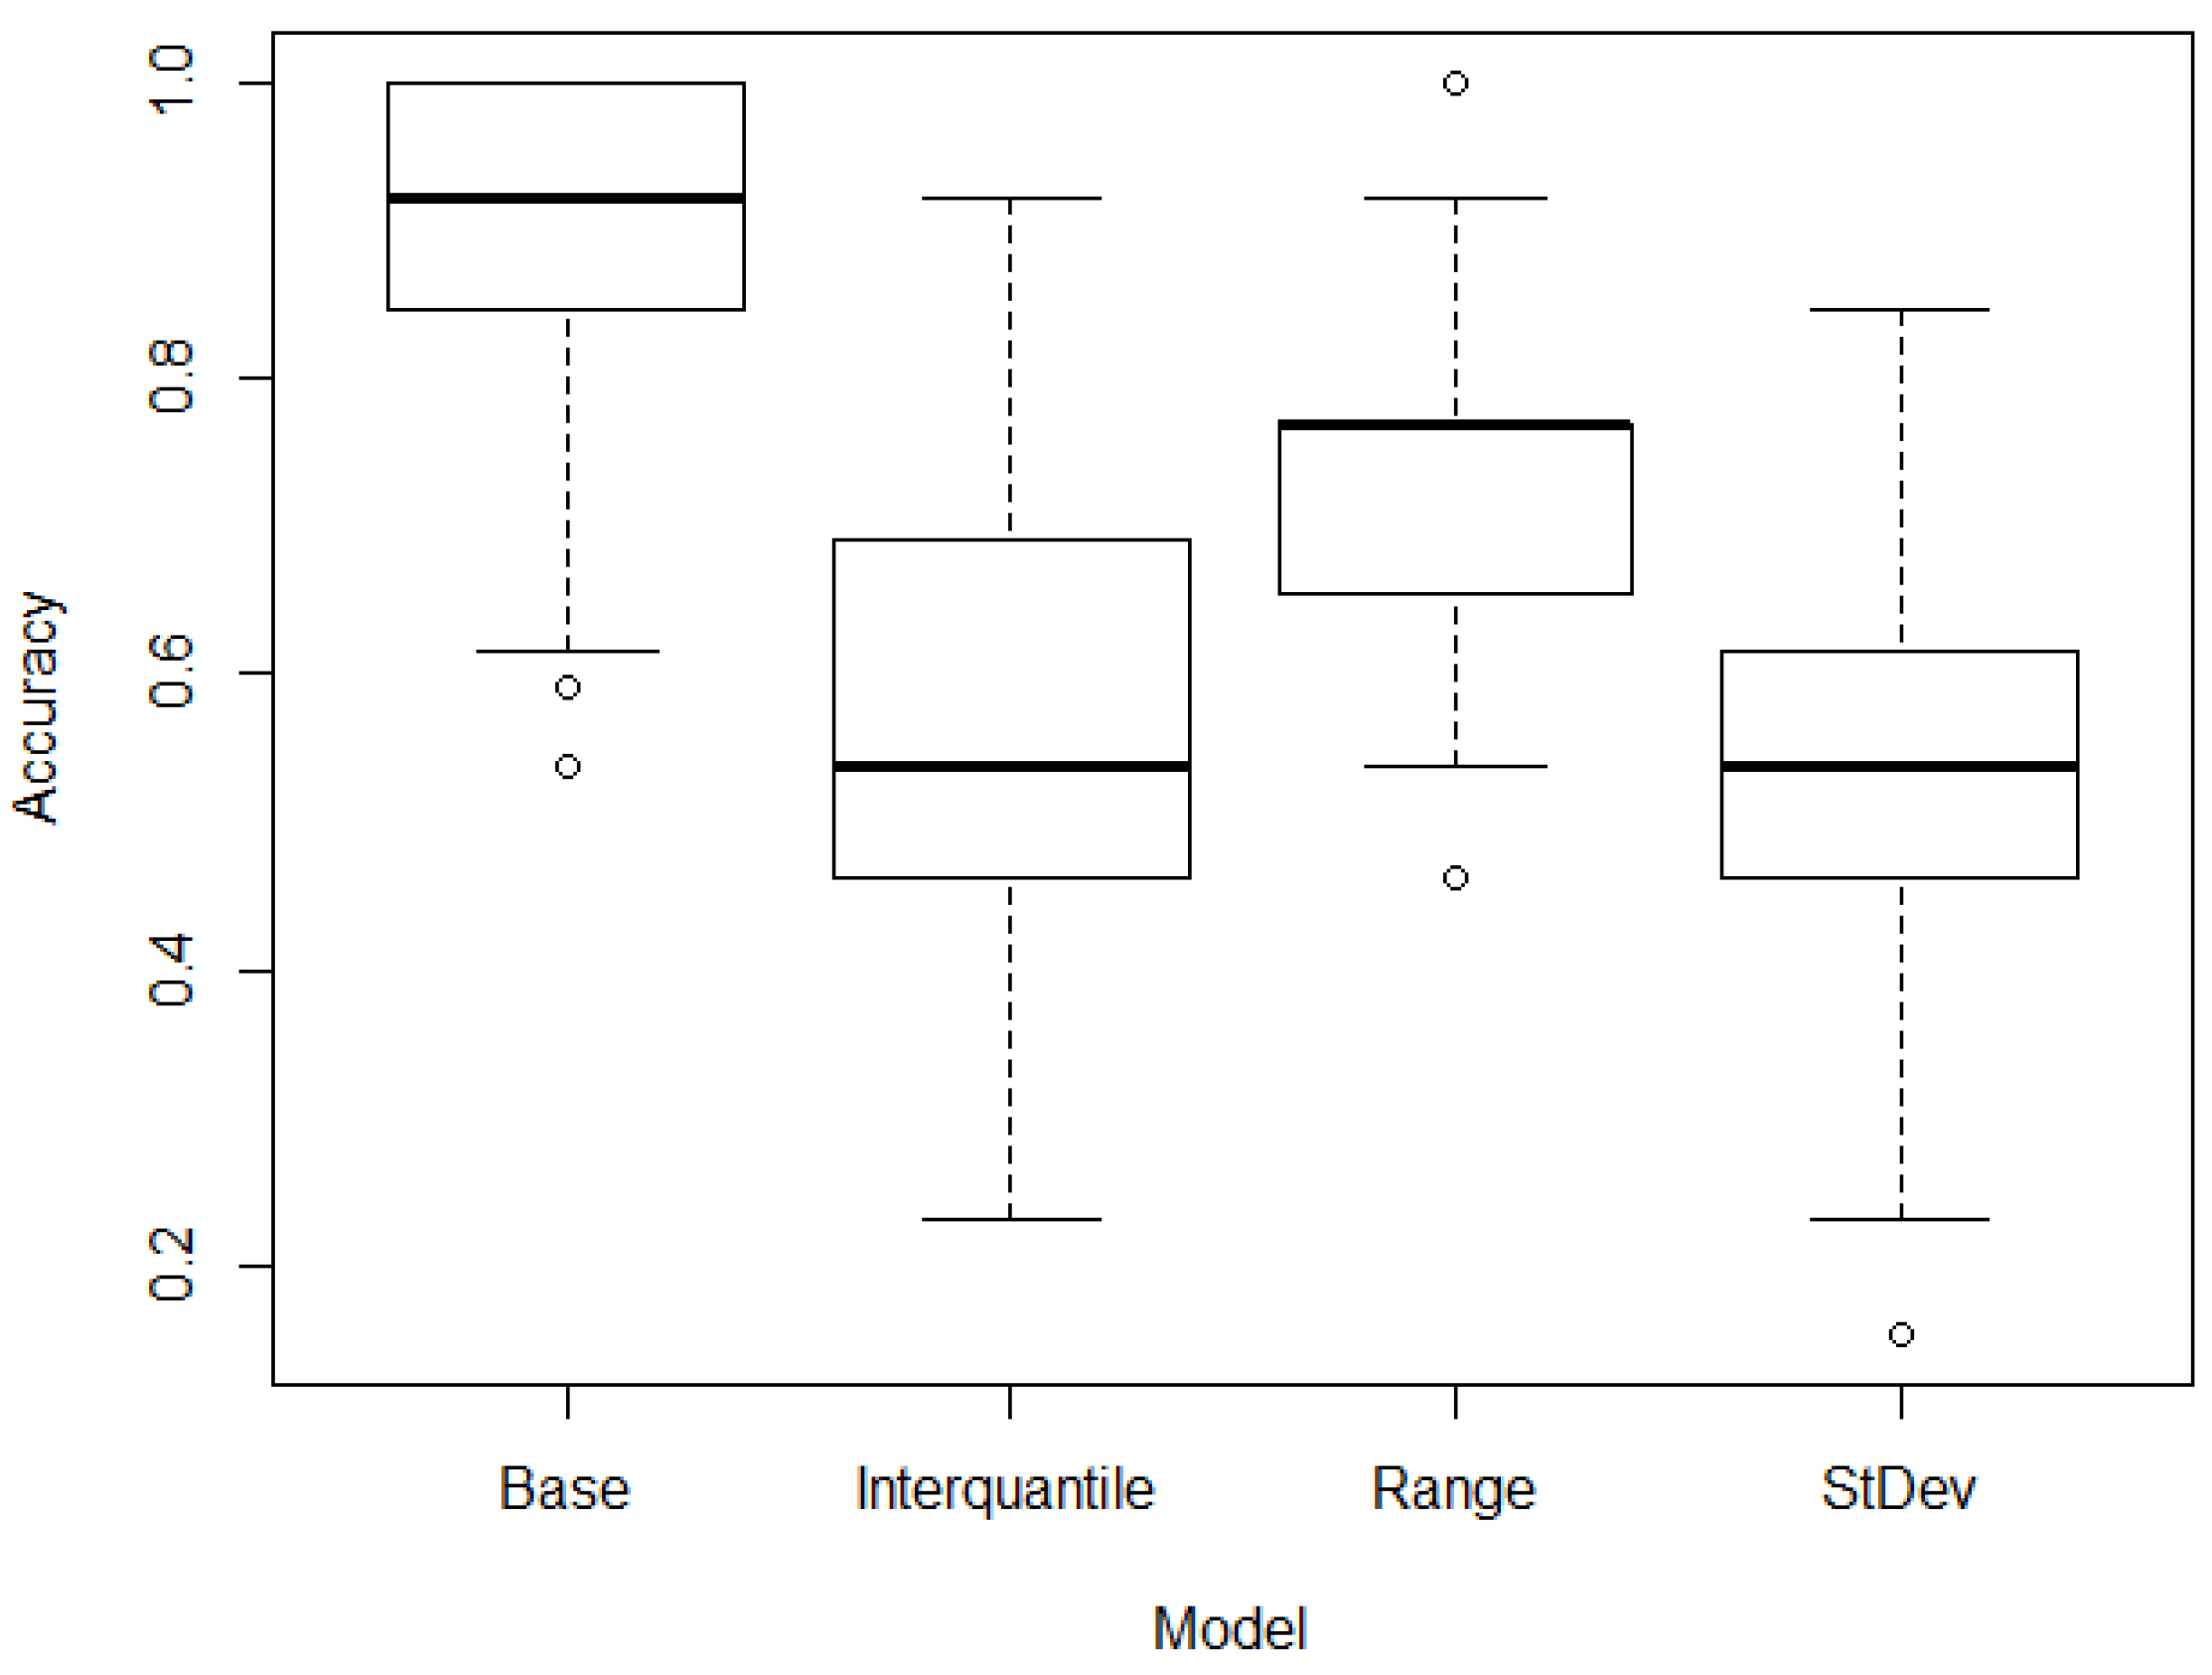
| Model | Mean | CI [95.0%] |
|---|---|---|
| Base model | 0.863 | [0.837 0.889] |
| Standard deviation model | 0.833 | [0.816 0.849] |
| Interquartile model | 0.800 | [0.779 0.820] |
| Range model | 0.784 | [0.764 0.804] |
References
- Chaudhary, M. Novel methylation mark and essential hypertension. J. Genet. Eng. Biotechnol. 2022, 20, 11. [Google Scholar] [CrossRef] [PubMed]
- Sowers, J.R.; Epstein, M.; Frohlich, E.D. Diabetes, hypertension, and cardiovascular disease: An update. Hypertension 2001, 37, 1053–1059. [Google Scholar] [CrossRef] [PubMed]
- Staessen, J.A.; Wang, J.; Bianchi, G.; Birkenhäger, W.H. Essential hypertension. Lancet 2003, 361, 1629–1641. [Google Scholar] [CrossRef] [PubMed]
- Messerli, F.H.; Williams, B.; Ritz, E. Essential hypertension. Lancet 2007, 370, 591–603. [Google Scholar] [CrossRef] [PubMed]
- Chen, J.; Liu, Y.; Qin, J.; Ruan, C.; Zeng, X.; Xu, A.; Yang, R.; Li, J.; Cai, H.; Zhang, Z. Hypertension as an independent risk factor for severity and mortality in patients with COVID-19: A retrospective study. Postgrad. Med. J. 2022, 98, 515–522. [Google Scholar] [CrossRef] [PubMed]
- Bepouka, B.; Situakibanza, H.; Sangare, M.; Mandina, M.; Mayasi, N.; Longokolo, M.; Odio, O.; Mangala, D.; Isekusu, F.; Kayembe, J.M. Mortality associated with COVID-19 and hypertension in sub-Saharan Africa. A systematic review and meta-analysis. J. Clin. Hypertens. 2022, 24, 99–105. [Google Scholar] [CrossRef]
- Zhao, L.; Li, Y.; Yi, W.; Yan, K.; Yang, C.; Radhakrishnan, S.; Li, R.; Tan, R.; Fan, G.; Dai, M. The clinical and bioinformatics analysis for the role of antihypertension drugs on mortality among patients with hypertension hospitalized with COVID-19. J. Med. Virol. 2022, 94, 4727–4734. [Google Scholar] [CrossRef]
- Canavan, M.; O’Donnell, M.J. Hypertension and cognitive impairment: A review of mechanisms and key concepts. Front. Neurol. 2022, 13, 45. [Google Scholar] [CrossRef]
- Reitz, C.; Tang, M.; Manly, J.; Mayeux, R.; Luchsinger, J. Hypertension and the risk of mild cognitive impairment. Arch. Neurol. 2007, 64, 1734–1740. [Google Scholar] [CrossRef]
- Angeli, F.; Zappa, M.; Oliva, F.M.; Spanevello, A.; Verdecchia, P. Blood pressure increase during hospitalization for COVID-19. Eur. J. Intern. Med. 2022, 104, 110–112. [Google Scholar] [CrossRef]
- Zhao, W.; Gao, F.; Lv, L.; Chen, X. The interaction of hypertension and homocysteine increases the risk of mortality among middle-aged and older population in the United States. J. Hypertens. 2022, 40, 254–263. [Google Scholar] [CrossRef] [PubMed]
- Puddu, P.E.; Menotti, A.; Jacobs, D.R., Jr.; Adachi, H.; Kafatos, A.; Tolonen, H. Cardiovascular risk factors predict age at death in 60-year follow-up of the Seven Countries Study. Aging Clin. Exp. Res. 2023, 35, 193–202. [Google Scholar] [CrossRef] [PubMed]
- Cardoso, C.R.L.; Salles, G.F. Prognostic value of changes in aortic stiffness for cardiovascular outcomes and mortality in resistant hypertension: A cohort study. Hypertension 2022, 79, 447–456. [Google Scholar] [CrossRef]
- Hibino, M.; Otaki, Y.; Kobeissi, E.; Pan, H.; Hibino, H.; Taddese, H.; Majeed, A.; Verma, S.; Konta, T.; Yamagata, K. Blood pressure, hypertension, and the risk of aortic dissection incidence and mortality: Results from the J-SCH study, the UK biobank study, and a meta-analysis of cohort studies. Circulation 2022, 145, 633–644. [Google Scholar] [CrossRef] [PubMed]
- Lindheimer, M.D.; Taler, S.J.; Cunningham, F.G. Hypertension in pregnancy. J. Am. Soc. Hypertens. 2008, 2, 484–494. [Google Scholar] [CrossRef]
- Ott, C.; Schmieder, R.E. Diagnosis and treatment of arterial hypertension 2021. Kidney Int. 2022, 101, 36–46. [Google Scholar] [CrossRef]
- Kannel, W.B. Risk factors in hypertension. J. Cardiovasc. Pharmacol. 1989, 13, 4–10. [Google Scholar] [CrossRef]
- Cuffee, Y.; Ogedegbe, C.; Williams, N.J.; Ogedegbe, G.; Schoenthaler, A. Psychosocial risk factors for hypertension: An update of the literature. Curr. Hypertens. Rep. 2014, 16, 483. [Google Scholar] [CrossRef]
- Shams, E.; Kamalumpundi, V.; Peterson, J.; Gismondi, R.A.; Oigman, W.; Correia, M.L. Highlights of mechanisms and treatment of obesity-related hypertension. J. Hum. Hypertens. 2022, 36, 785–793. [Google Scholar] [CrossRef]
- Ali, N.; Mohanto, N.C.; Nurunnabi, S.M.; Haque, T.; Islam, F. Prevalence and risk factors of general and abdominal obesity and hypertension in rural and urban residents in Bangladesh: A cross-sectional study. BMC Public Health 2022, 22, 1707. [Google Scholar] [CrossRef]
- DiBonito, P.; Licenziati, M.R.; Morandi, A.; Maffeis, C.; Del Giudice, E.M.; Di Sessa, A.; Campana, G.; Wasniewska, M.; Corica, D.; Valerio, G. Screening for hypertension in young people with obesity: Feasibility in the real life. Nutr. Metab. Cardiovasc. Dis. 2022, 32, 1301–1307. [Google Scholar] [CrossRef] [PubMed]
- Caminiti, G.; Iellamo, F.; Mancuso, A.; Cerrito, A.; Montano, M.; Manzi, V.; Volterrani, M. Effects of 12 weeks of aerobic versus combined aerobic plus resistance exercise training on short-term blood pressure variability in patients with hypertension. J. Appl. Physiol. 2021, 130, 1085–1092. [Google Scholar] [CrossRef] [PubMed]
- Hermansen, K. Diet, blood pressure and hypertension. J. Appl. Physiol. 2000, 83, 113–119. [Google Scholar] [CrossRef]
- Ozemek, C.; Laddu, D.R.; Arena, R.; Lavie, C.J. The role of diet for prevention and management of hypertension. Curr. Opin. Cardiol. 2018, 33, 388–393. [Google Scholar] [CrossRef] [PubMed]
- Sacks, F.M.; Campos, H. Dietary therapy in hypertension. N. Engl. J. Med. 2010, 362, 2102–2112. [Google Scholar] [CrossRef]
- Stoll, S.; Wang, C.; Qiu, H. DNA methylation and histone modification in hypertension. Int. J. Mol. Sci. 2018, 19, 1174. [Google Scholar] [CrossRef] [PubMed]
- Wang, J.; Gong, L.; Tan, Y.; Hui, R.; Wang, Y. Hypertensive epigenetics: From DNA methylation to microRNAs. J. Hum. Hypertens. 2015, 29, 575–582. [Google Scholar] [CrossRef] [PubMed]
- Dasinger, J.H.; Alsheikh, A.J.; Abais-Battad, J.M.; Pan, X.; Fehrenbach, D.J.; Lund, H.; Roberts, M.L.; Cowley, A.W., Jr.; Kidambi, S.; Kotchen, T.A. Epigenetic modifications in T cells: The role of DNA methylation in salt-sensitive hypertension. Hypertension 2020, 75, 372–382. [Google Scholar] [CrossRef] [PubMed]
- Millis, R.M. Epigenetics and hypertension. Curr. Hypertens. Rep. 2011, 13, 21–28. [Google Scholar] [CrossRef]
- Demura, M.; Saijoh, K. The role of DNA methylation in hypertension. In Hypertension: From Basic Research to Clinical Practice; Springer: Cham, Switzerland, 2017; pp. 583–598. [Google Scholar]
- Fan, R.; Wang, W.J.; Zhong, Q.L.; Duan, S.W.; Xu, X.T.; Hao, L.M.; Zhao, J.; Zhang, L.N. Aberrant methylation of the GCK gene body is associated with the risk of essential hypertension. Mol. Med. Rep. 2015, 12, 2390–2394. [Google Scholar] [CrossRef]
- Holmes, L., Jr.; Lim, A.; Comeaux, C.R.; Dabney, K.W.; Okundaye, O. DNA methylation of candidate genes (ACE II, IFN-γ, AGTR 1, CKG, ADD1, SCNN1B and TLR2) in essential hypertension: A systematic review and quantitative evidence synthesis. Int. J. Environ. Res. Public Health 2019, 16, 4829. [Google Scholar] [CrossRef] [PubMed]
- Nuotio, M.L.; Sánez, T.; Lahtinen, A.; Donner, K.; Fyhrquist, F.; Perola, M.; Kontula, K.K.; Hiltunen, T.P. Pharmacoepigenetics of hypertension: Genome-wide methylation analysis of responsiveness to four classes of antihypertensive drugs using a double-blind crossover study design. Epigenetics 2022, 17, 1432–1445. [Google Scholar] [CrossRef] [PubMed]
- Hishikawa, A.; Hayashi, K.; Yoshimoto, N.; Nakamichi, R.; Homma, K.; Itoh, H. DNA damage and expression of DNA methylation modulators in urine-derived cells of patients with hypertension and diabetes. Sci. Rep. 2020, 10, 3377. [Google Scholar] [CrossRef] [PubMed]
- Han, L.; Liu, Y.; Duan, S.; Perry, B.; Li, W.; He, Y. DNA methylation and hypertension: Emerging evidence and challenges. Brief. Funct. Genom. 2016, 15, 460–469. [Google Scholar] [CrossRef]
- Moore, L.D.; Le, T.; Fan, G. DNA methylation and its basic function. Neuropsychopharmacology 2013, 38, 23–38. [Google Scholar] [CrossRef] [PubMed]
- Richardson, B. Impact of aging on DNA methylation. Ageing Res. Rev. 2003, 2, 245–261. [Google Scholar] [CrossRef]
- Jones, M.J.; Goodman, S.J.; Kobor, M.S. DNA methylation and healthy human aging. Aging Cell 2015, 14, 924–932. [Google Scholar] [CrossRef]
- Bell, C.G.; Lowe, R.; Adams, P.D.; Baccarelli, A.A.; Beck, S.; Bell, J.T.; Christensen, B.C.; Gladyshev, V.N.; Heijmans, B.T.; Horvath, S. DNA methylation aging clocks: Challenges and recommendations. Genome Biol. 2019, 20, 924–932. [Google Scholar] [CrossRef]
- Das, P.M.; Singal, R. DNA methylation and cancer. Am. Soc. Clin. Oncol. 2004, 22, 4632–4642. [Google Scholar] [CrossRef]
- Kulis, M.; Esteller, M. DNA methylation and cancer. Adv. Genet. 2010, 70, 27–56. [Google Scholar]
- Ehrlich, M. DNA methylation in cancer: Too much, but also too little. Oncogene 2002, 21, 5400–5413. [Google Scholar] [CrossRef] [PubMed]
- Goud, C.; Etain, B.; Bellivier, F.; Marie-Claire, C. DNA methylation as a biomarker of treatment response variability in serious mental illnesses: A systematic review focused on bipolar disorder, schizophrenia, and major depressive disorder. Int. J. Mol. Sci. 2018, 19, 3026. [Google Scholar] [CrossRef] [PubMed]
- Grayson, D.R.; Guidotti, A. The dynamics of DNA methylation in schizophrenia and related psychiatric disorders. Neuropsychopharmacology 2013, 38, 138–166. [Google Scholar] [CrossRef]
- Wockner, L.F.; Noble, E.P.; Lawford, B.R.; Young, R.; Morris, C.P.; Whitehall, V.L.J.; Voisey, J. Genome-wide DNA methylation analysis of human brain tissue from schizophrenia patients. Transl. Psychiatry 2014, 4, 339. [Google Scholar] [CrossRef]
- Alfonso Perez, G.; Caballero Villarraso, J. Neural Network Aided Detection of Huntington Disease. J. Clin. Med. 2022, 11, 2110. [Google Scholar] [CrossRef] [PubMed]
- Binnie, A.; Walsh, C.J.; Hu, P.; Dwivedi, D.J.; Fox-Robichaud, A.; Liaw, P.C.; Tsang, J.L.Y.; Batt, J.; Carrasqueiro, G.; Gupta, S. Epigenetic profiling in severe sepsis: A pilot study of DNA methylation profiles in critical illness. Crit. Care Med. 2020, 48, 142–150. [Google Scholar] [CrossRef]
- Nguyen, T.M.; Le, H.L.; Hwang, K.; Hong, Y.; Kim, J.H. Predicting high blood pressure using DNA methylome-based machine learning models. Biomedicines 2022, 10, 1406. [Google Scholar] [CrossRef]
- Dumitru, C.; Maria, V. Advantages and Disadvantages of Using Neural Networks for Predictions. Ovidius Univ. Ann. Ser. Econ. Sci. 2013, 13, 444–449. [Google Scholar]
- Athanassopoulos, A.D.; Curram, S.P. A comparison of data envelopment analysis and artificial neural networks as tools for assessing the efficiency of decision making units. J. Oper. Res. Soc. 1996, 47, 1000–1016. [Google Scholar] [CrossRef]
- Tran-Ngoc, H.; Khatir, S.; De Roeck, G.; Bui-Tien, T.; Wahab, M.A. An efficient artificial neural network for damage detection in bridges and beam-like structures by improving training parameters using cuckoo search algorithm. Eng. Struct. 2019, 199, 109637. [Google Scholar] [CrossRef]
- Rabault, J.; Kuchta, M.; Jensen, A.; Réglade, U.; Cerardi, N. Artificial neural networks trained through deep reinforcement learning discover control strategies for active flow control. J. Fluid Mech. 2019, 865, 281–302. [Google Scholar] [CrossRef]
- Wu, Y.; Deng, L.; Li, G.; Zhu, J.; Xie, Y.; Shi, L. Direct training for spiking neural networks: Faster, larger, better. Proc. AAAI Conf. Artif. Intell. 2019, 33, 1311–1318. [Google Scholar] [CrossRef]
- Bejani, M.M.; Ghatee, M. A systematic review on overfitting control in shallow and deep neural networks. Artif. Intell. Rev. 2021, 54, 6391–6438. [Google Scholar] [CrossRef]
- Ying, X. An overview of overfitting and its solutions. J. Phys. Conf. Ser. 2019, 1168, 022022. [Google Scholar] [CrossRef]
- Mutasa, S.; Sun, S.; Ha, R. Understanding artificial intelligence based radiology studies: What is overfitting? Clin. Imaging 2020, 65, 96–99. [Google Scholar] [CrossRef]
- Sivanandarajah, P.; Wu, H.; Bajaj, N.; Khan, S.; Ng, F.S. Is machine learning the future for atrial fibrillation screening? Cardiovasc. Digit. Health J. 2022, 3, 136–145. [Google Scholar] [CrossRef]
- Kusunose, K.; Abe, T.; Haga, A.; Fukuda, D.; Yamada, H.; Harada, M.; Sata, M. A deep learning approach for assessment of regional wall motion abnormality from echocardiographic images. Cardiovasc. Imaging 2020, 13, 374–381. [Google Scholar] [CrossRef] [PubMed]
- Hopfield, J.J. Artificial neural networks. IEEE Circuits Devices Mag. 1988, 4, 3–10. [Google Scholar] [CrossRef]
- Abraham, A. Handbook of Measuring System Design; John Wiley & Sons, Ltd.: Chichester, UK, 2005. [Google Scholar]
- Mitchell, T.M. Artificial neural networks. Mach. Learn. 1997, 45, 127. [Google Scholar]
- Bai, C.; Su, M.; Zhang, Y.; Lin, Y.; Sun, Y.; Song, L.; Xiao, N.; Xu, H.; Wen, H.; Zhang, M. Oviductal Glycoprotein 1 Promotes Hypertension by Inducing Vascular Remodeling Through an Interaction With MYH9. Circulation 2022, 146, 1367–1382. [Google Scholar] [CrossRef]


| Model | Mean |
|---|---|
| Accuracy | 0.863 |
| Sensitivity | 0.727 |
| Specificity | 0.924 |
| PPP | 0.842 |
| NPV | 0.891 |
| CpGs | CpGs | CpGs | CpGs |
|---|---|---|---|
| cg11538389 | cg05410283 | cg08937729 | cg09853822 |
| cg07352586 | cg03077492 | cg08213351 | cg09163702 |
| cg05879380 | cg00026803 | cg056612821 | cg11791670 |
| cg04966851 | cg00316875 | cg07400328 | cg05650719 |
| cg03531512 | cg07991241 | cg11175310 | |
| cg02993069 | cg00010992 | cg11186962 |
Disclaimer/Publisher’s Note: The statements, opinions and data contained in all publications are solely those of the individual author(s) and contributor(s) and not of MDPI and/or the editor(s). MDPI and/or the editor(s) disclaim responsibility for any injury to people or property resulting from any ideas, methods, instructions or products referred to in the content. |
© 2023 by the authors. Licensee MDPI, Basel, Switzerland. This article is an open access article distributed under the terms and conditions of the Creative Commons Attribution (CC BY) license (https://creativecommons.org/licenses/by/4.0/).
Share and Cite
Alfonso Perez, G.; Delgado Martinez, V. Epigenetic Signatures in Hypertension. J. Pers. Med. 2023, 13, 787. https://doi.org/10.3390/jpm13050787
Alfonso Perez G, Delgado Martinez V. Epigenetic Signatures in Hypertension. Journal of Personalized Medicine. 2023; 13(5):787. https://doi.org/10.3390/jpm13050787
Chicago/Turabian StyleAlfonso Perez, Gerardo, and Victor Delgado Martinez. 2023. "Epigenetic Signatures in Hypertension" Journal of Personalized Medicine 13, no. 5: 787. https://doi.org/10.3390/jpm13050787
APA StyleAlfonso Perez, G., & Delgado Martinez, V. (2023). Epigenetic Signatures in Hypertension. Journal of Personalized Medicine, 13(5), 787. https://doi.org/10.3390/jpm13050787