
Impact of Obesity and Bariatric Surgery on Metabolic Enzymes and P-Glycoprotein Activity Using the Geneva Cocktail Approach

 , and
, and
Abstract
:1. Introduction
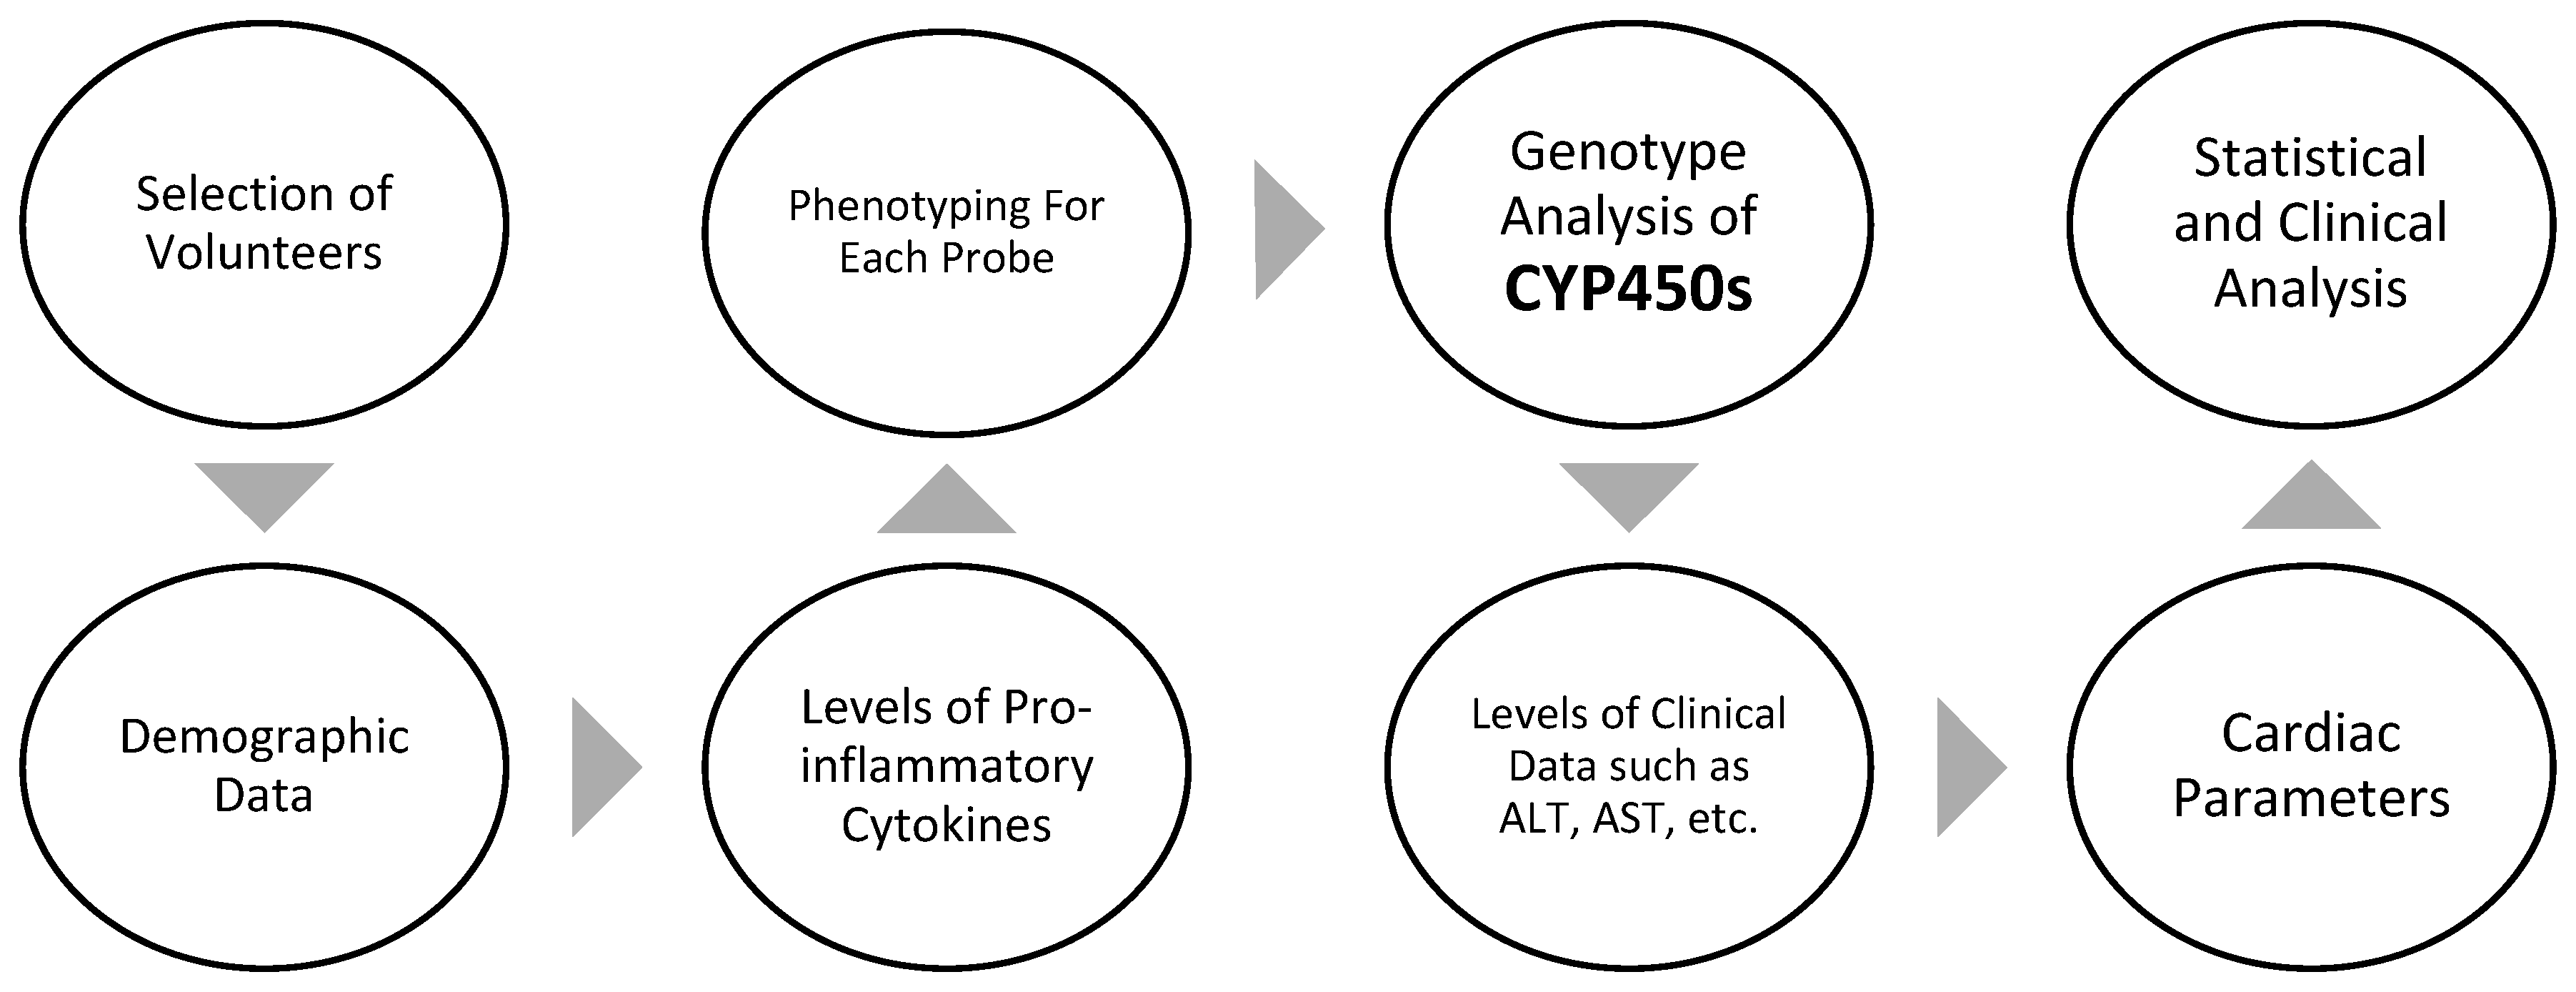
2. Materials and Methods
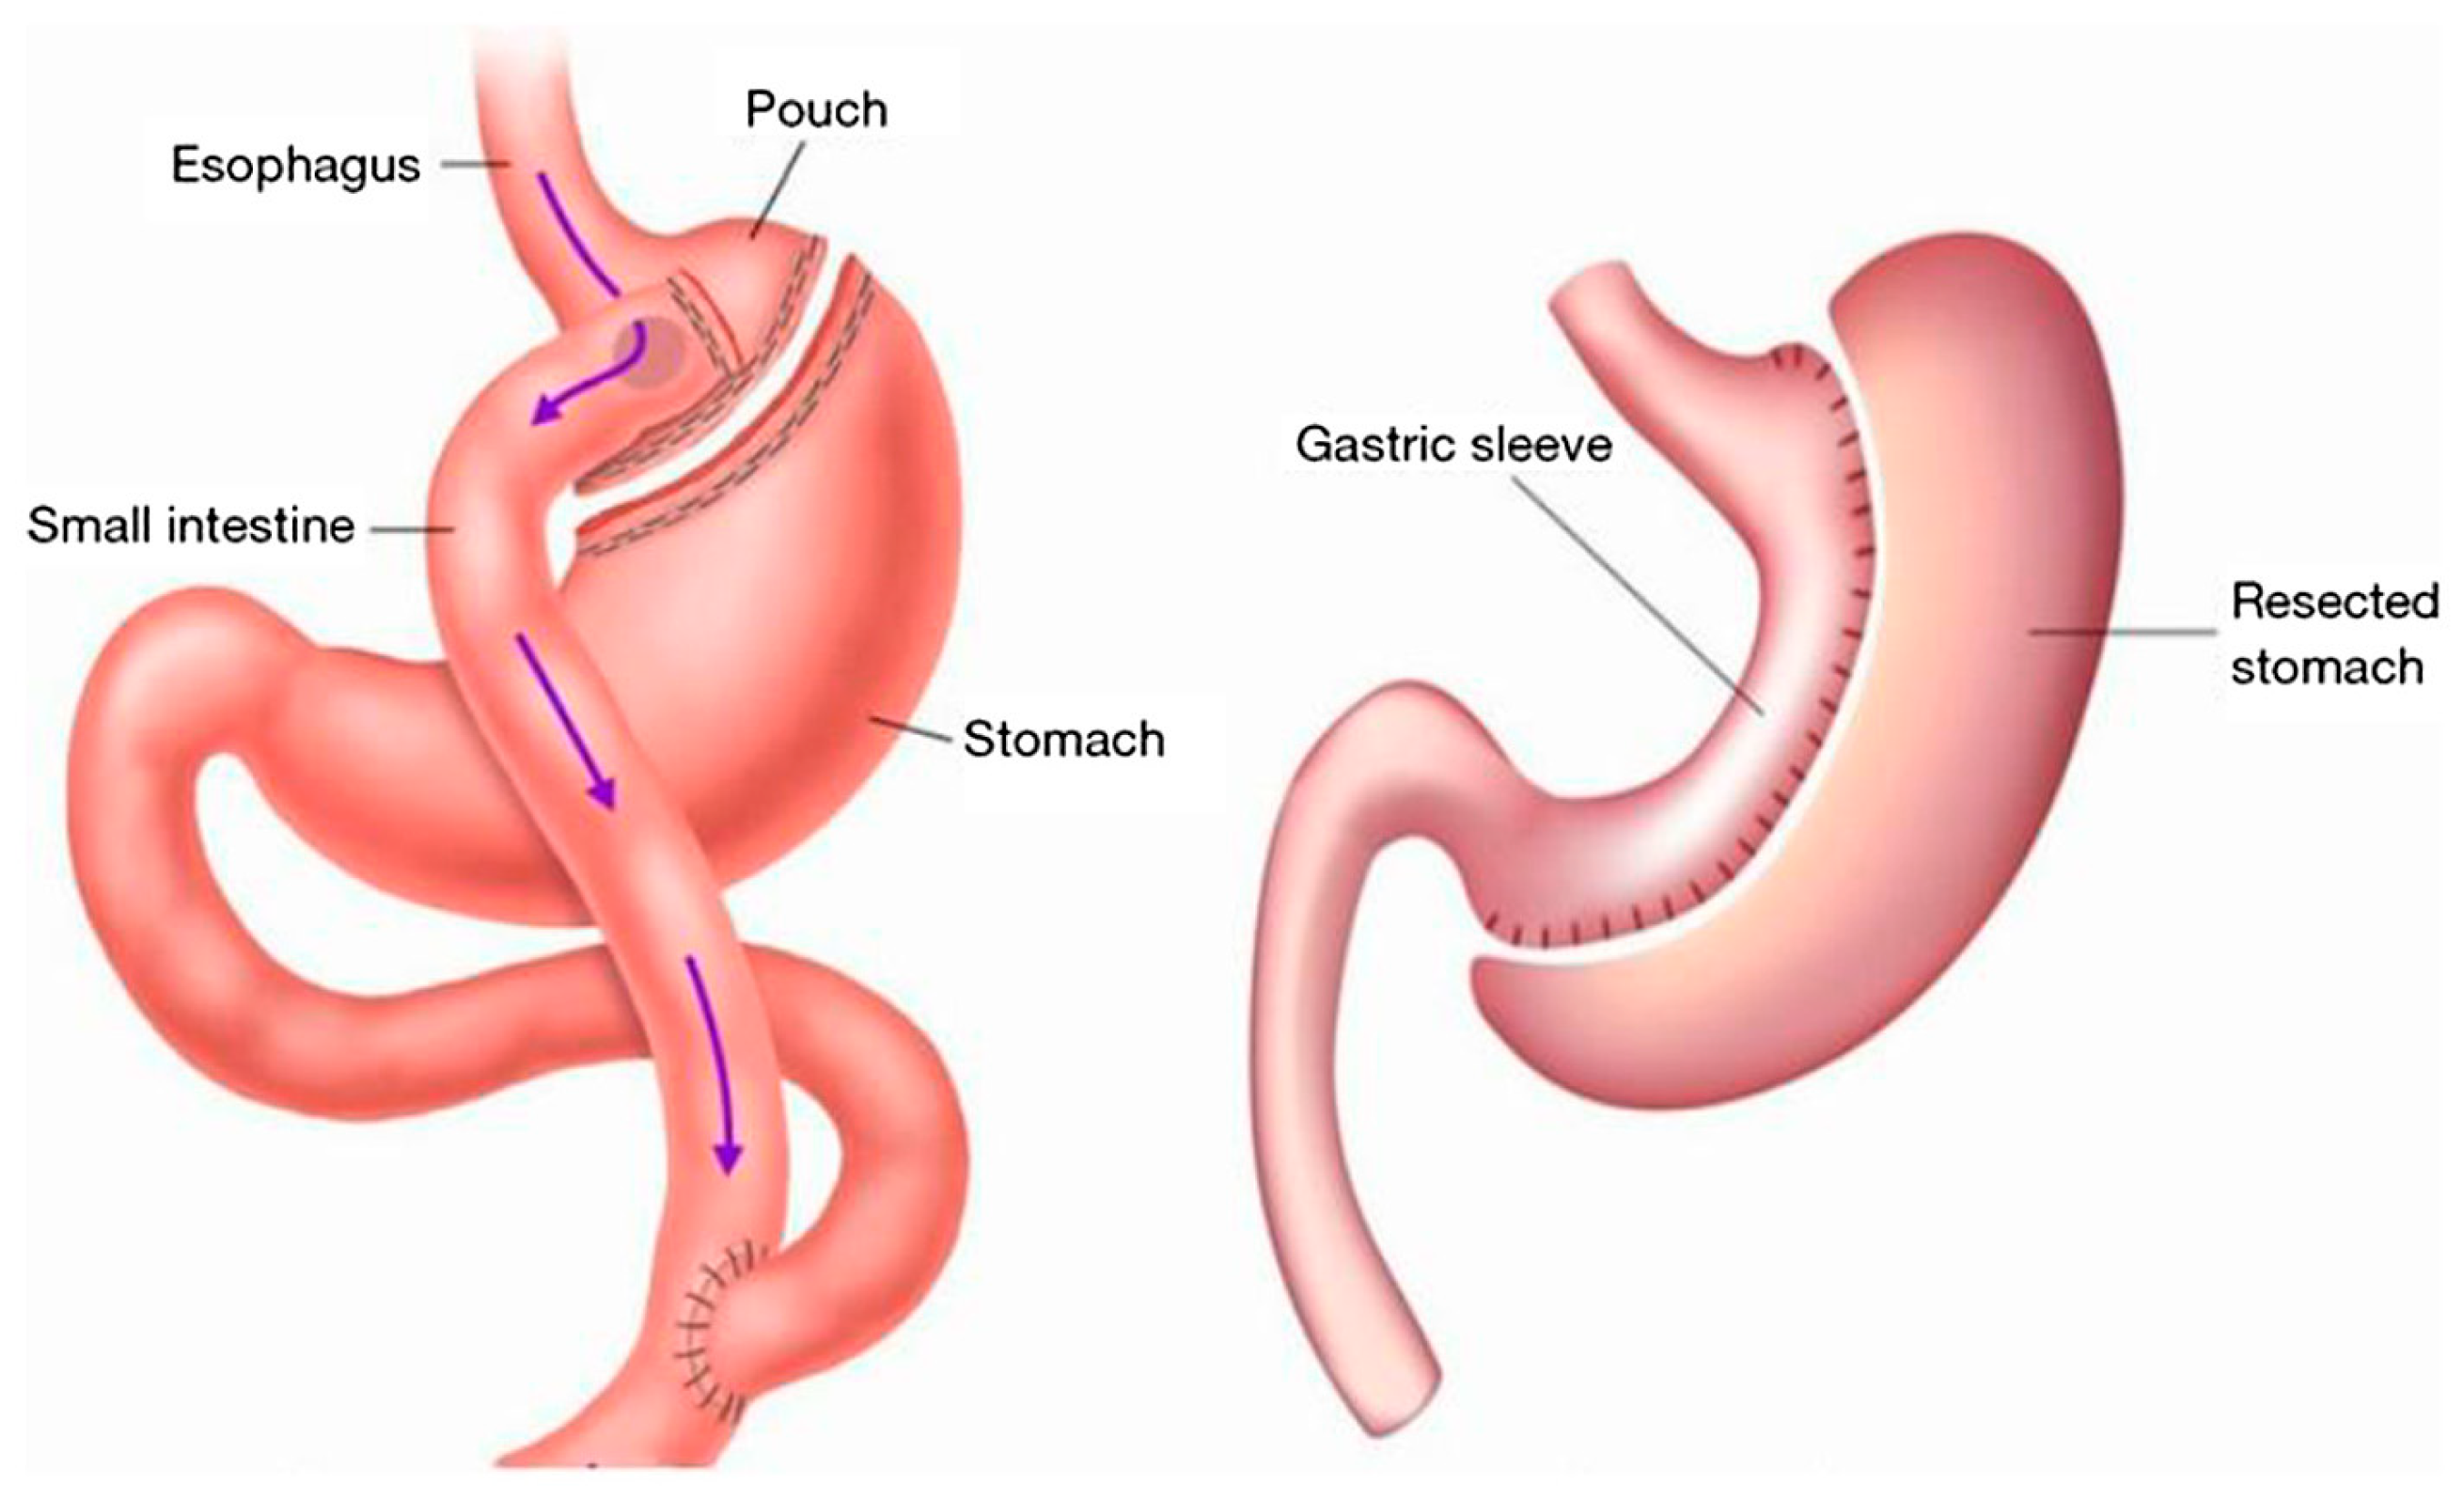
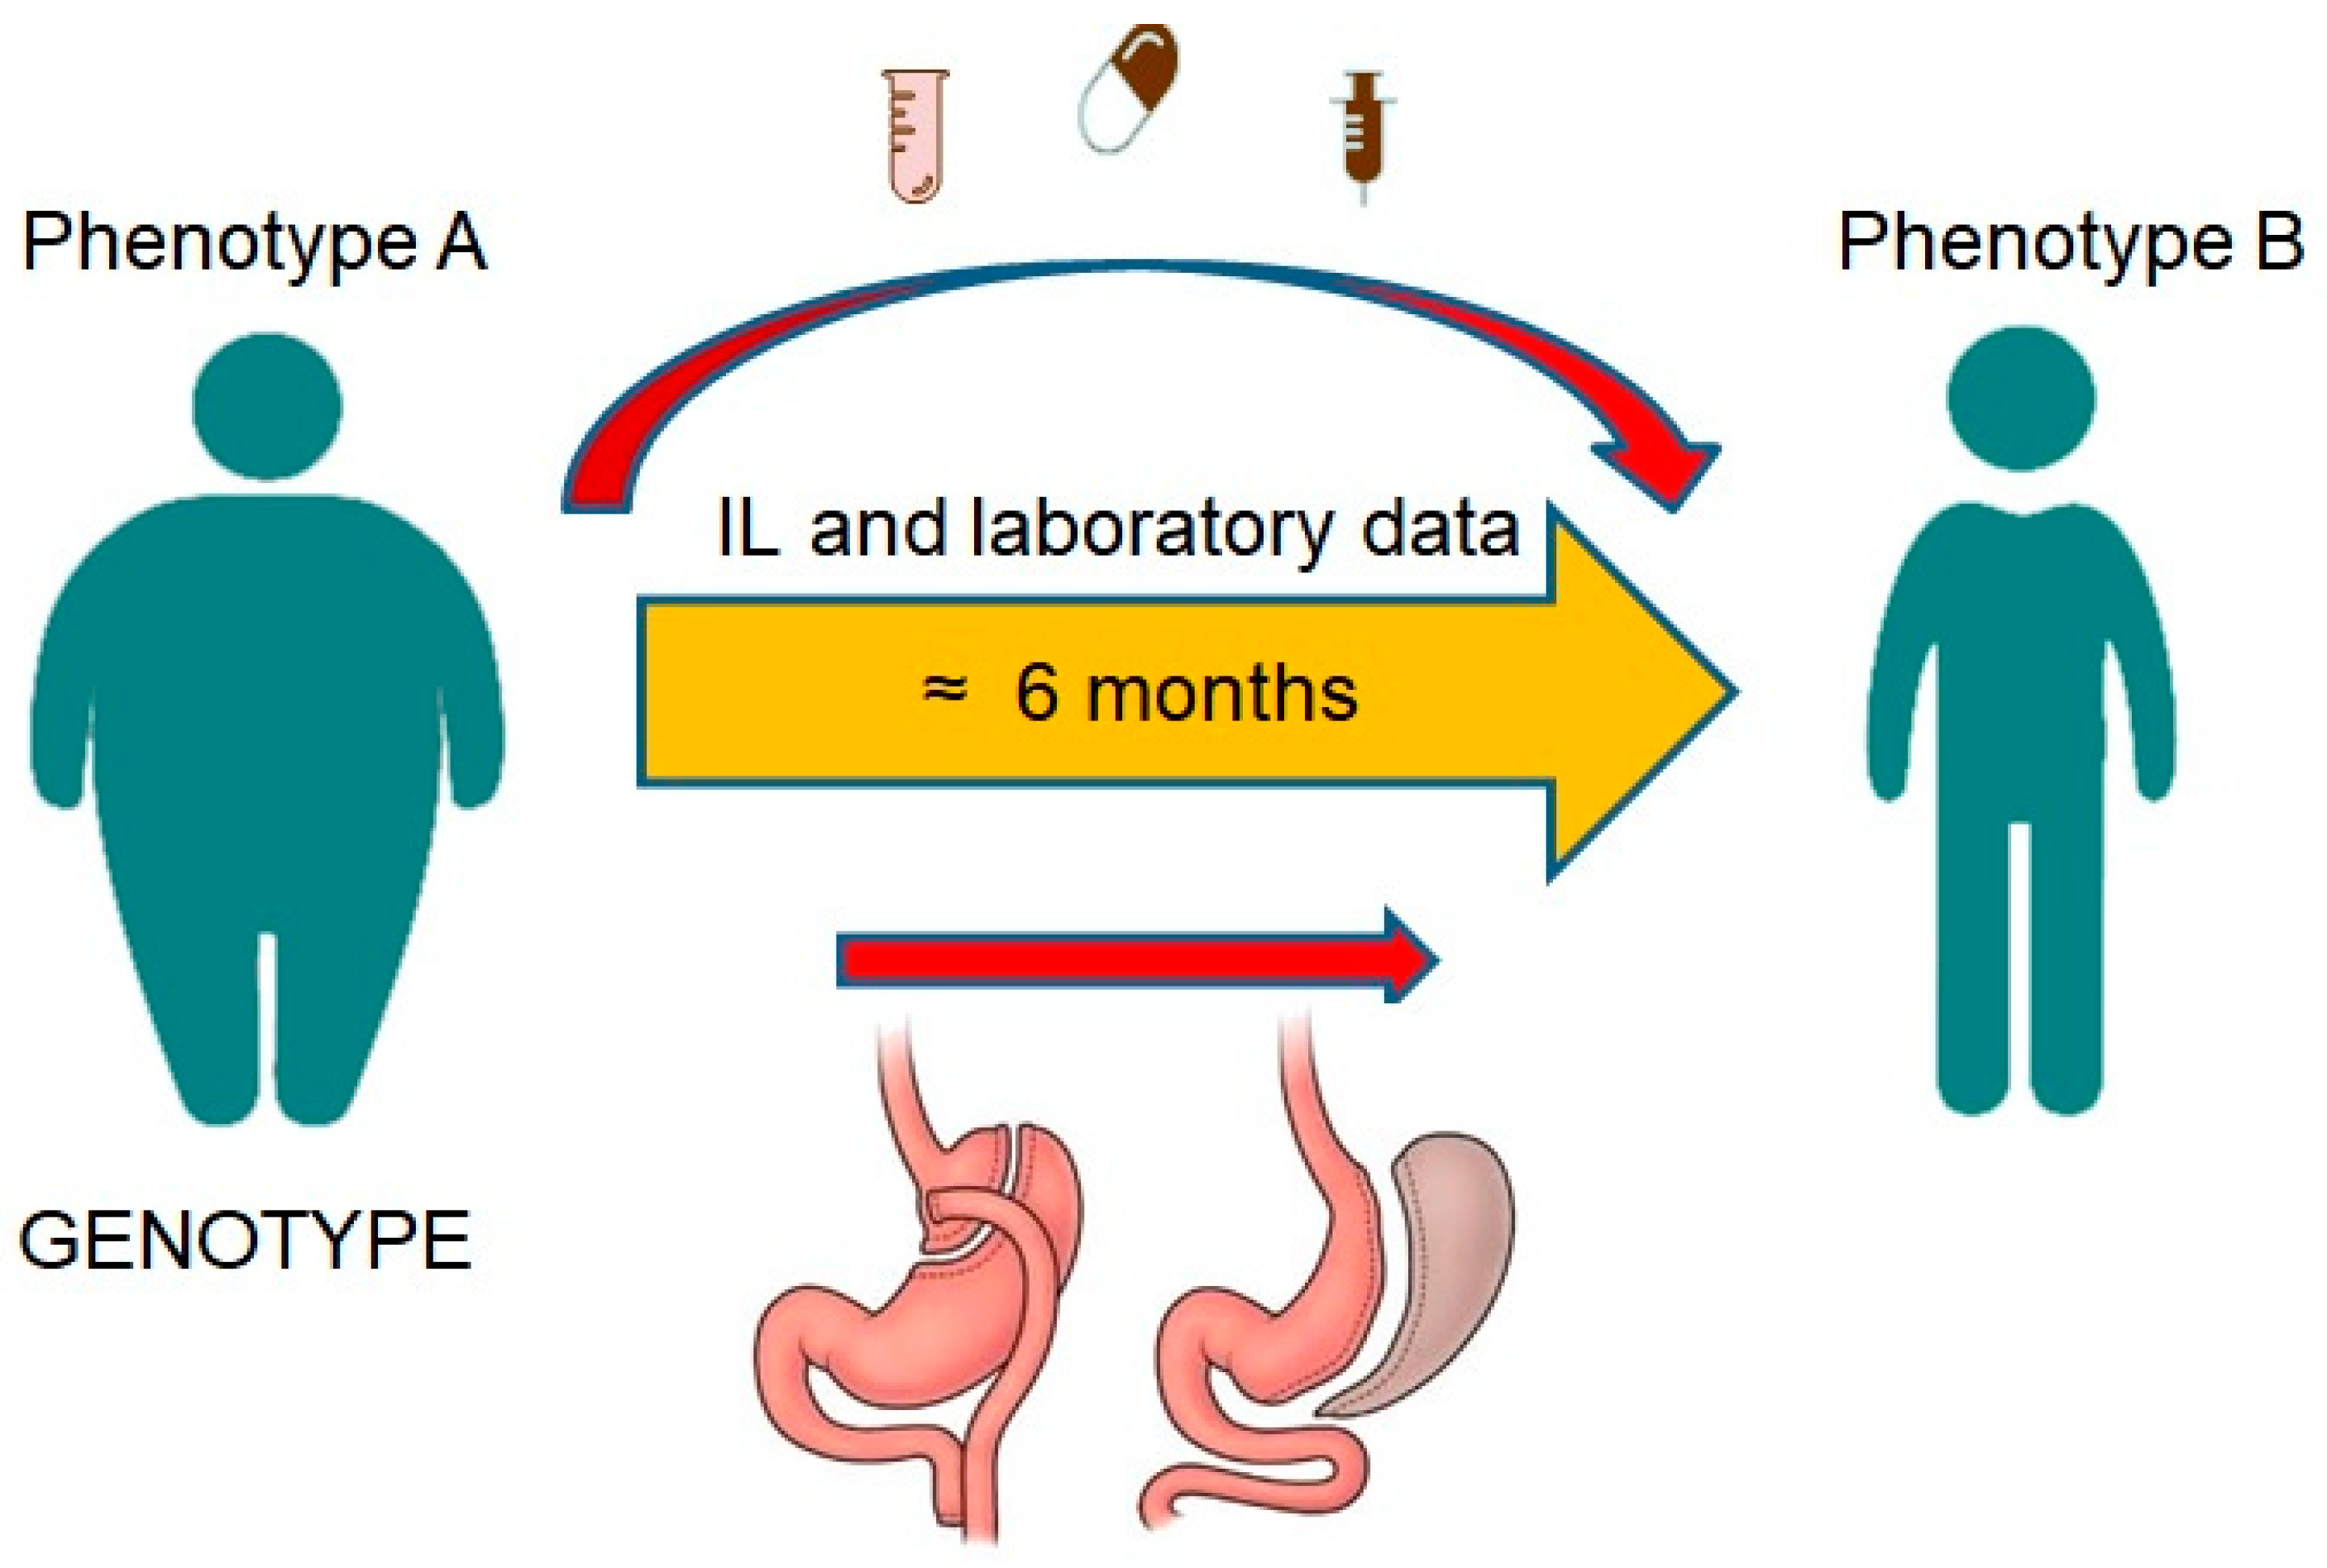
2.1. Study Design and Population
- Adolescent volunteers having a BMI of <25 and severely obese patients with a BMI of ≥40 who are candidates for bariatric surgery;
- Between the ages of 18 and 60;
- HbA1C < 6.5%;
- All healthy and obese individuals alike must not have active cases of thyroid illness, cirrhosis, IBD, Helicobacter pylori infection, or any other infectious disease (now or during the last four weeks).
- Participants taking medications believed to influence metabolic activity, including corticosteroids or NSAIDs used for their anti-inflammatory effects, will not be allowed to participate in this study;
- Females will be questioned regarding having a normal menstrual cycle and will be disqualified if they are pregnant or breastfeeding;
- Individuals who are often treated with drugs that have an inhibitory or stimulating impact on DMEs and whose substrates are implemented in the phenotyping cocktail;
- Patients who have previously had hypersensitivity to any of the drugs included in the combination;
- Patients who had organ transplant surgeries;
- Patients with an active cancer;
- Participants who had been heavy smokers or alcoholics for at least two months before the research.
2.2. Ethical Approval
2.3. Cocktail Administration
2.4. Laboratory Sample Analysis
2.5. Data Management
2.6. Statistical Analysis
2.7. Safety
3. Results
3.1. Demographic and Paraclinical Results
3.2. The Echocardiography Results of the Patients before and after Surgery
3.3. The Pro-Inflammatory Cytokines Level of the Patients before and after Surgery and Healthy Group
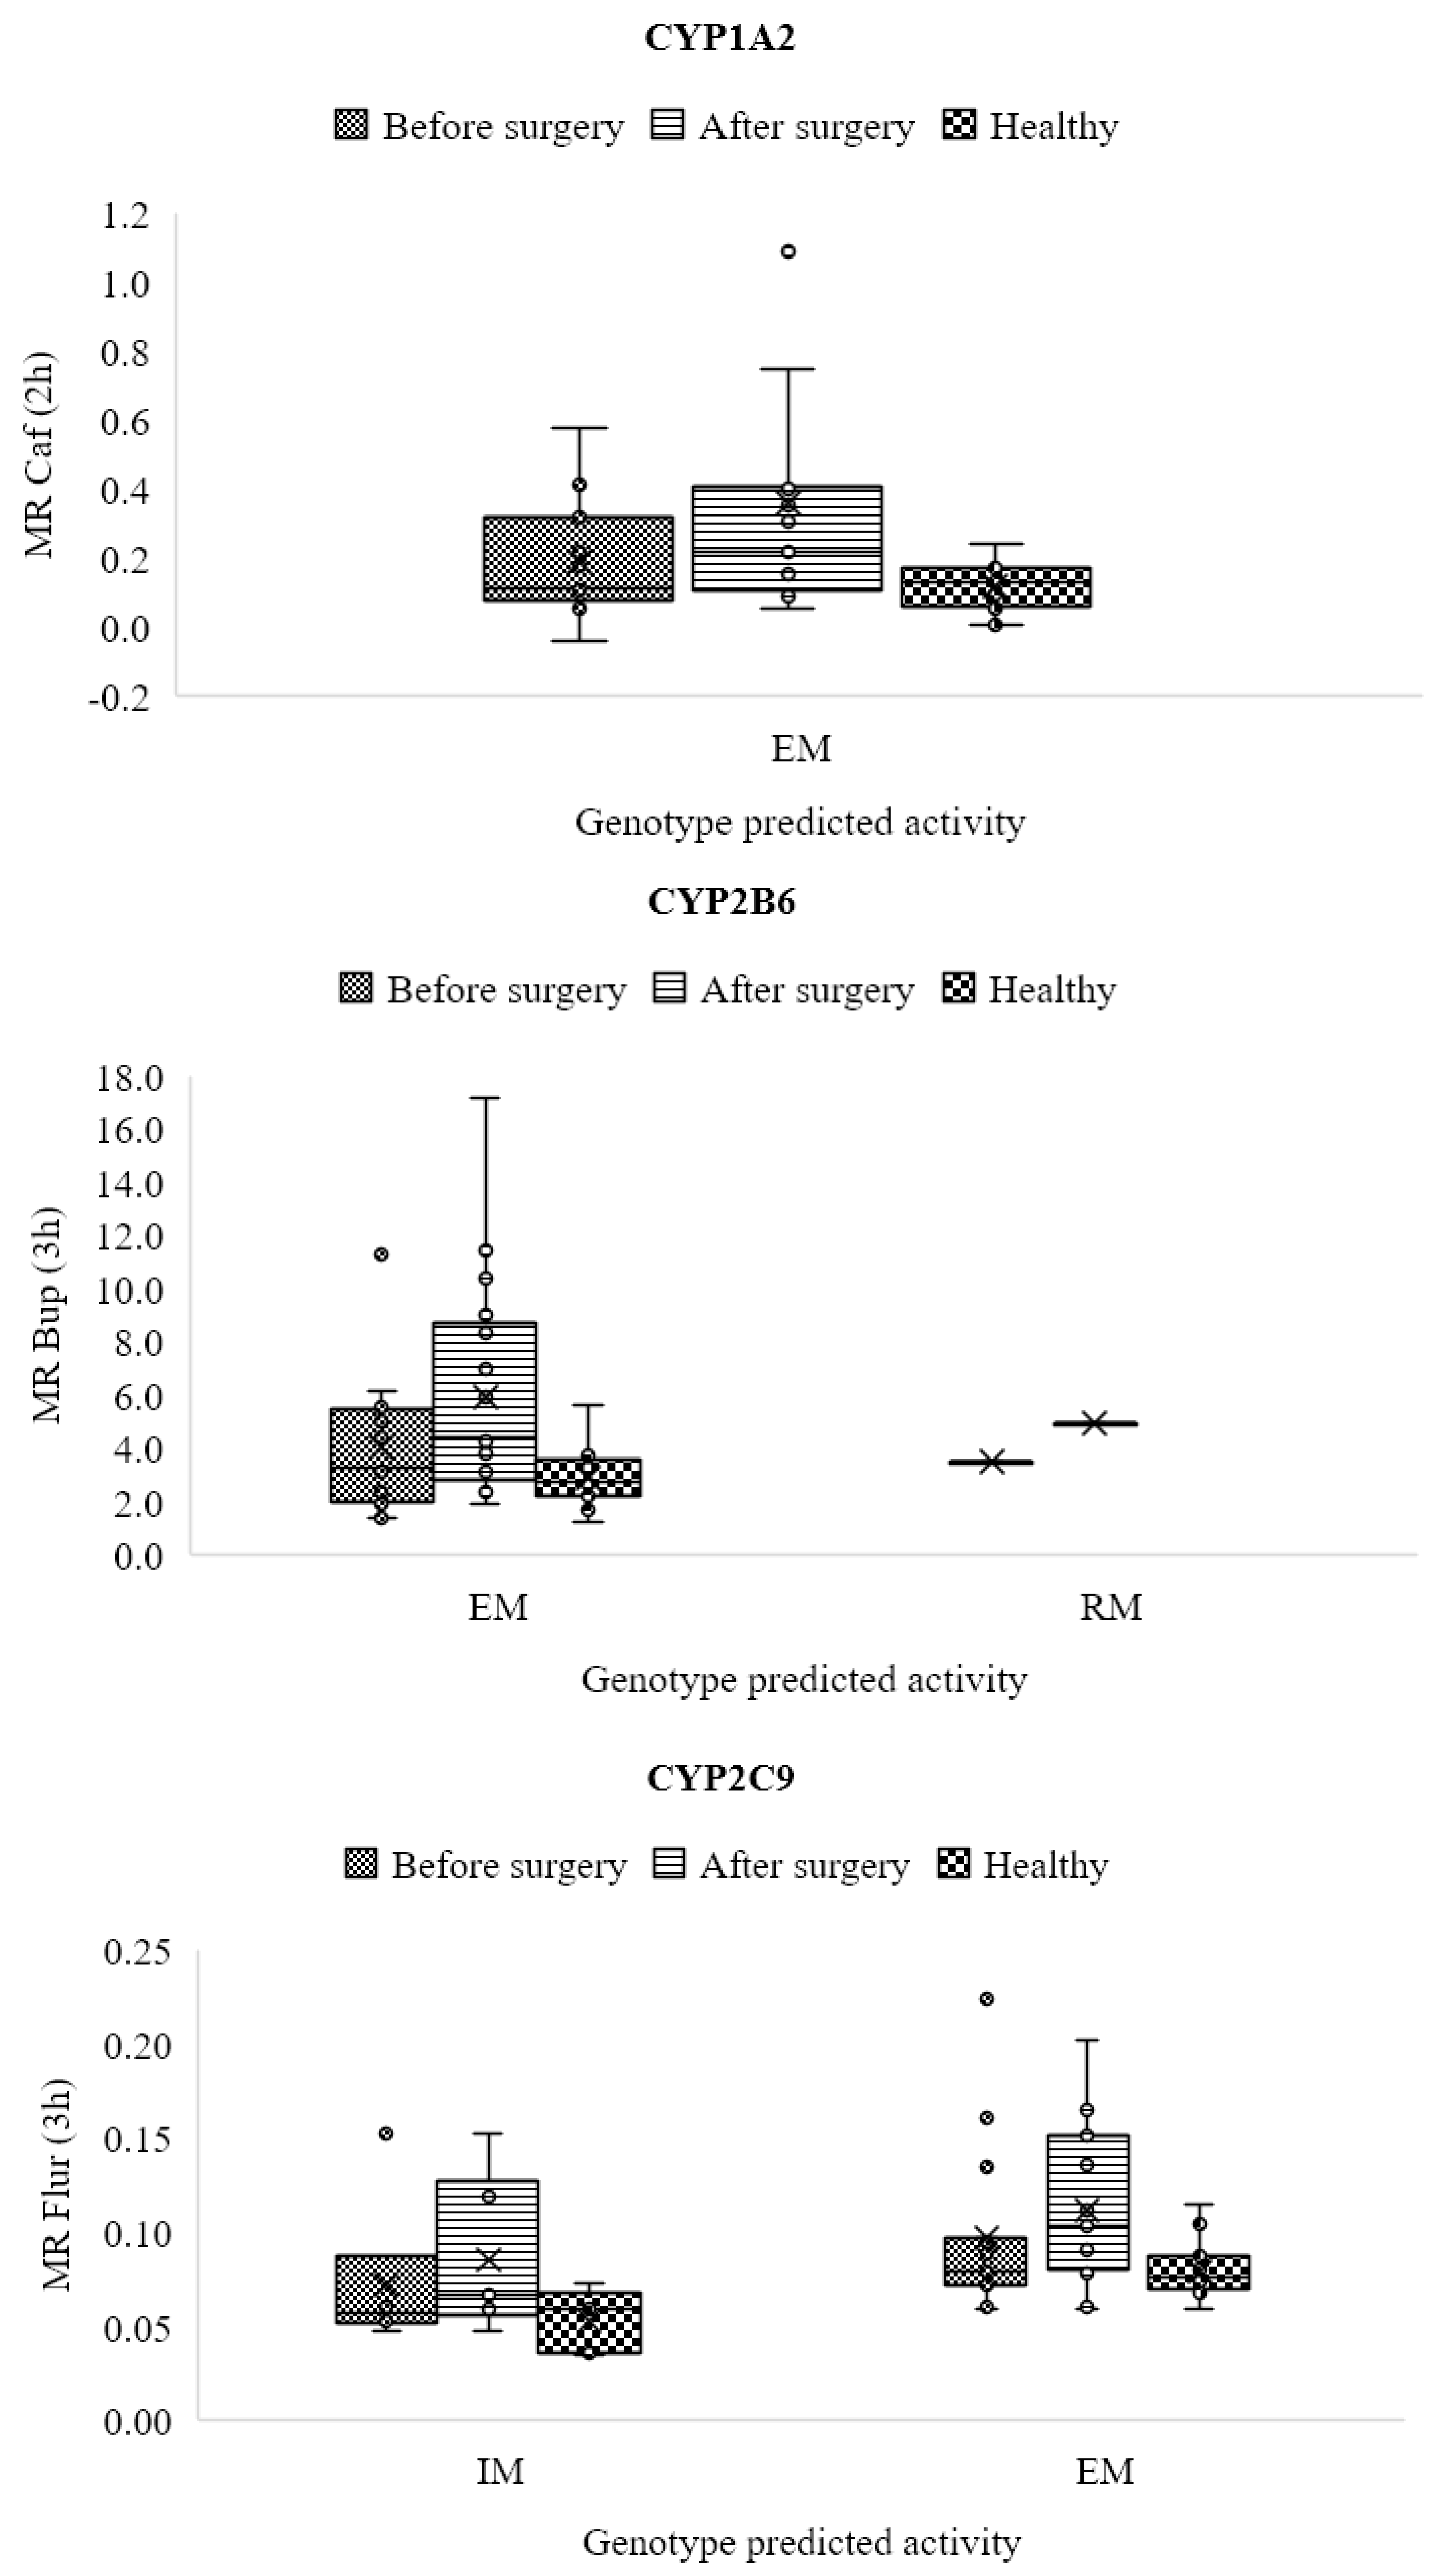
3.4. CYP450 Genotype of the Study Population
3.5. Phenotype Results
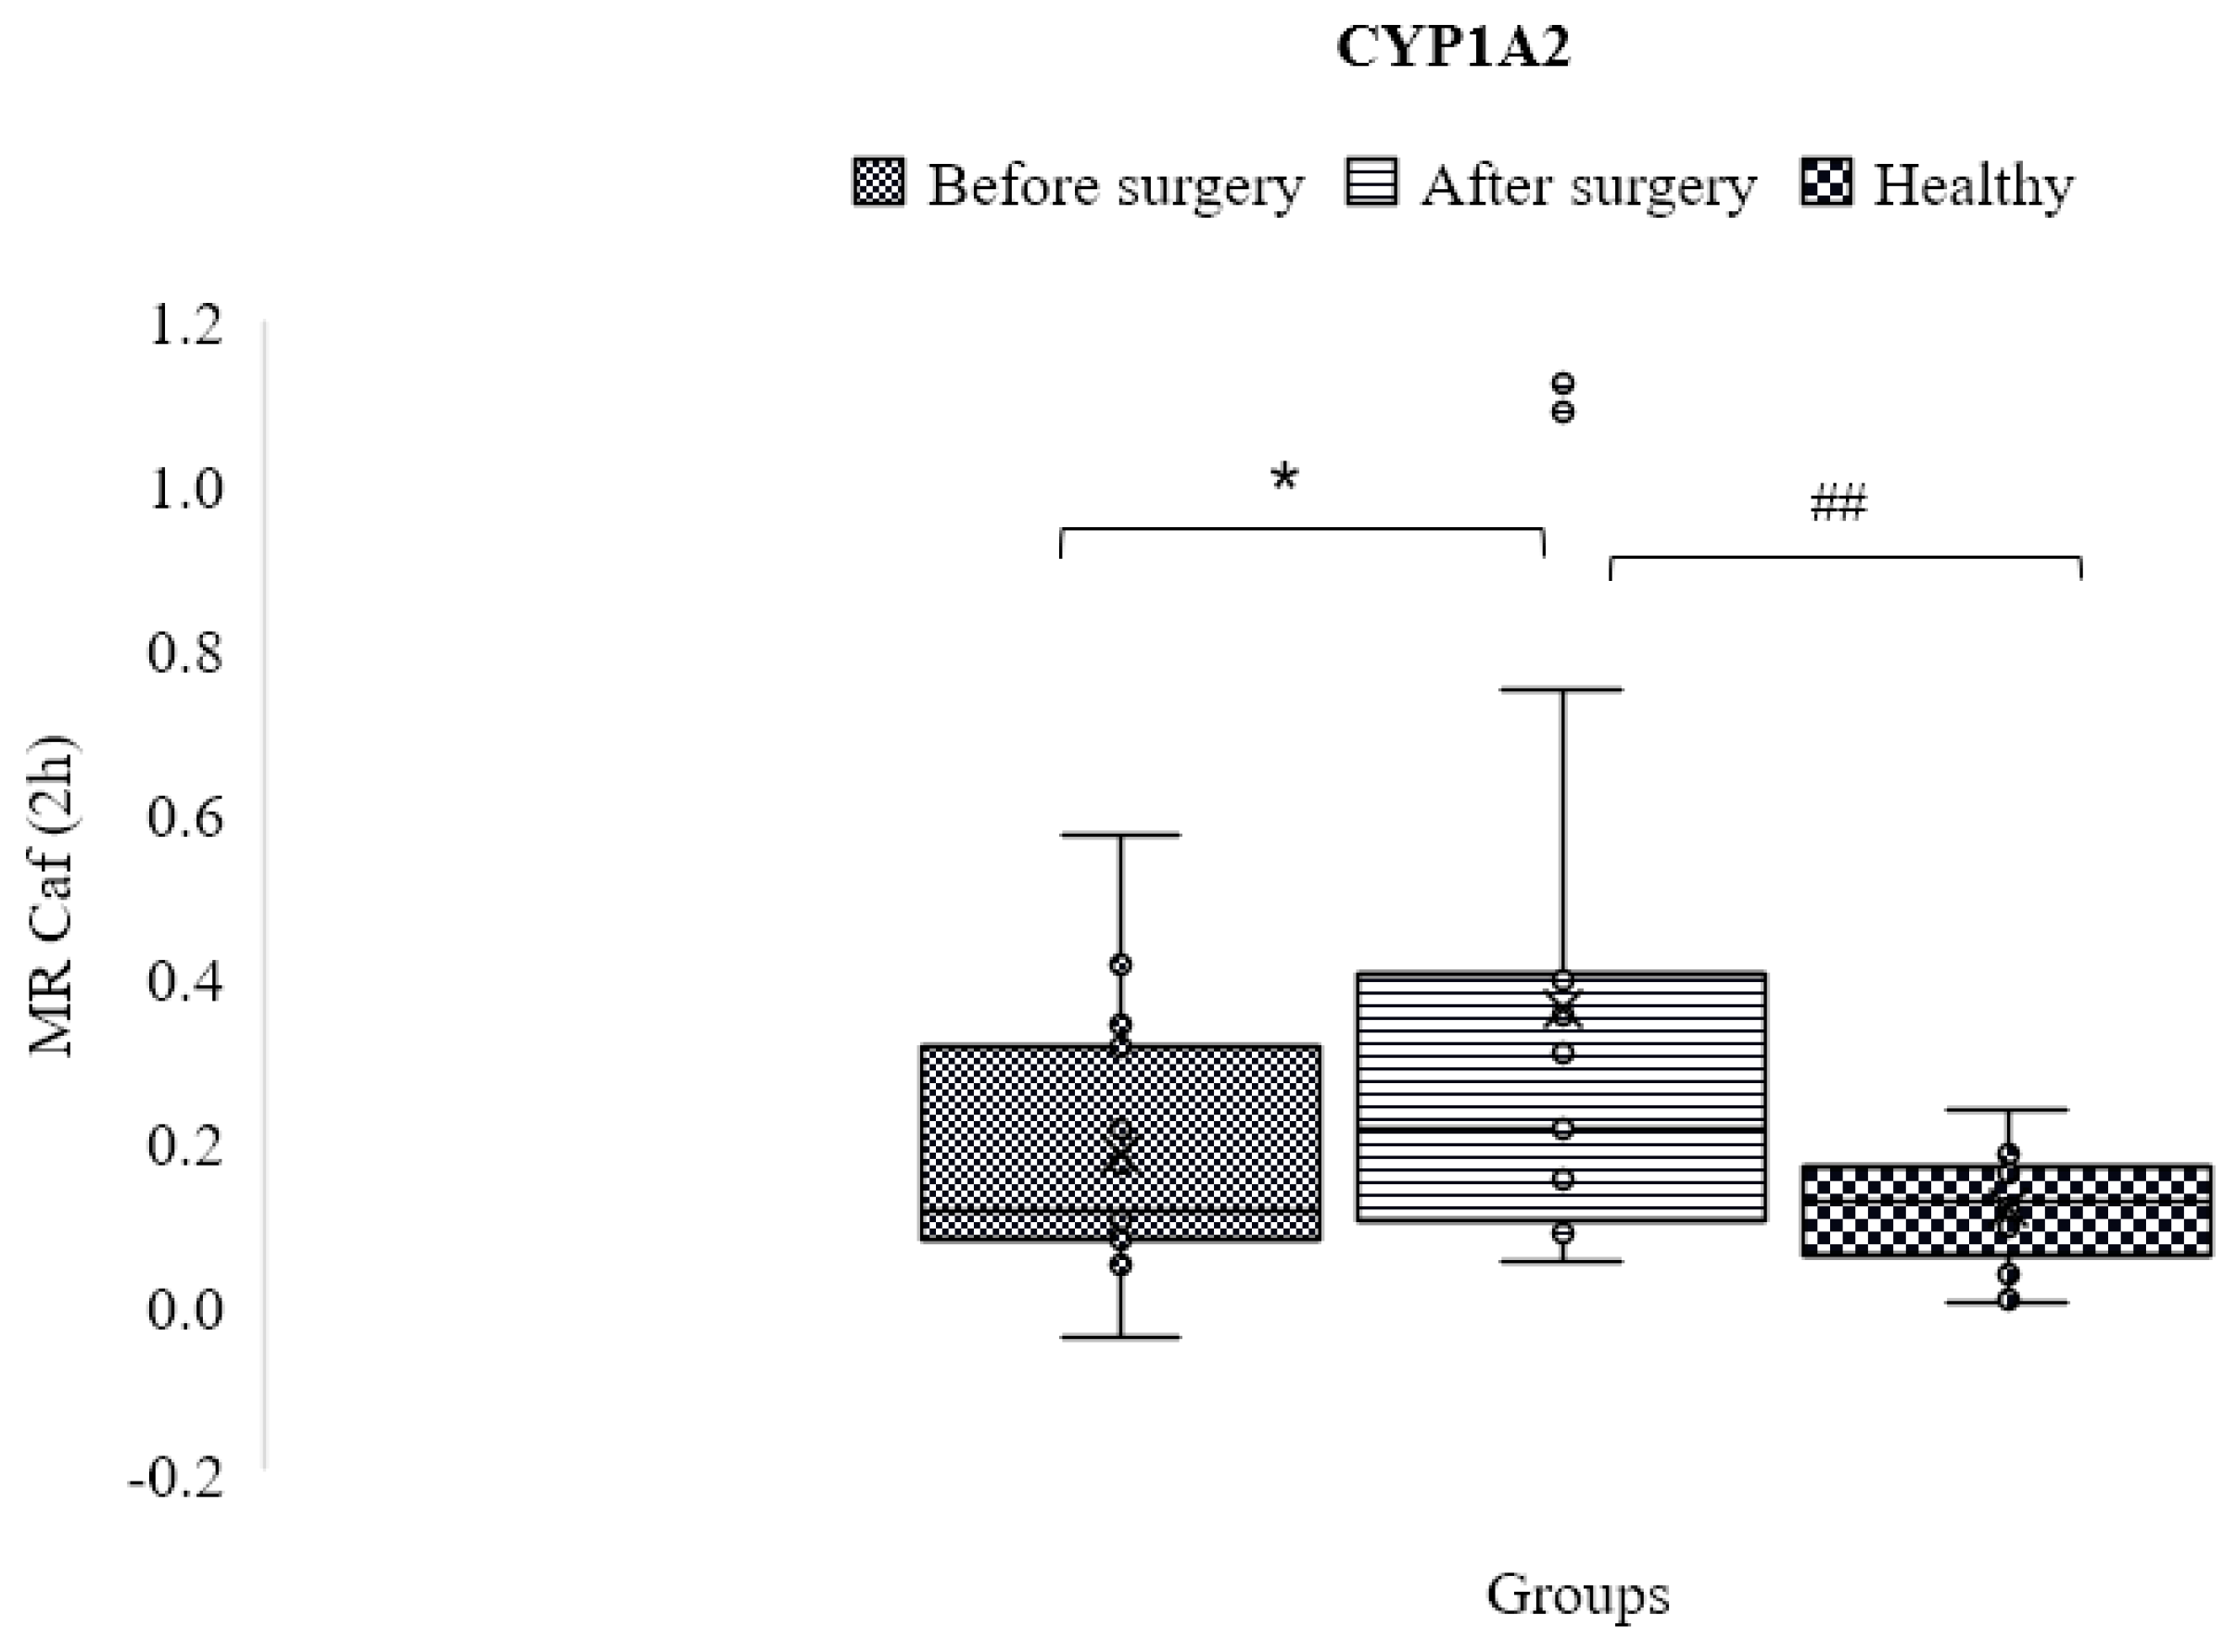
3.6. CYP1A2
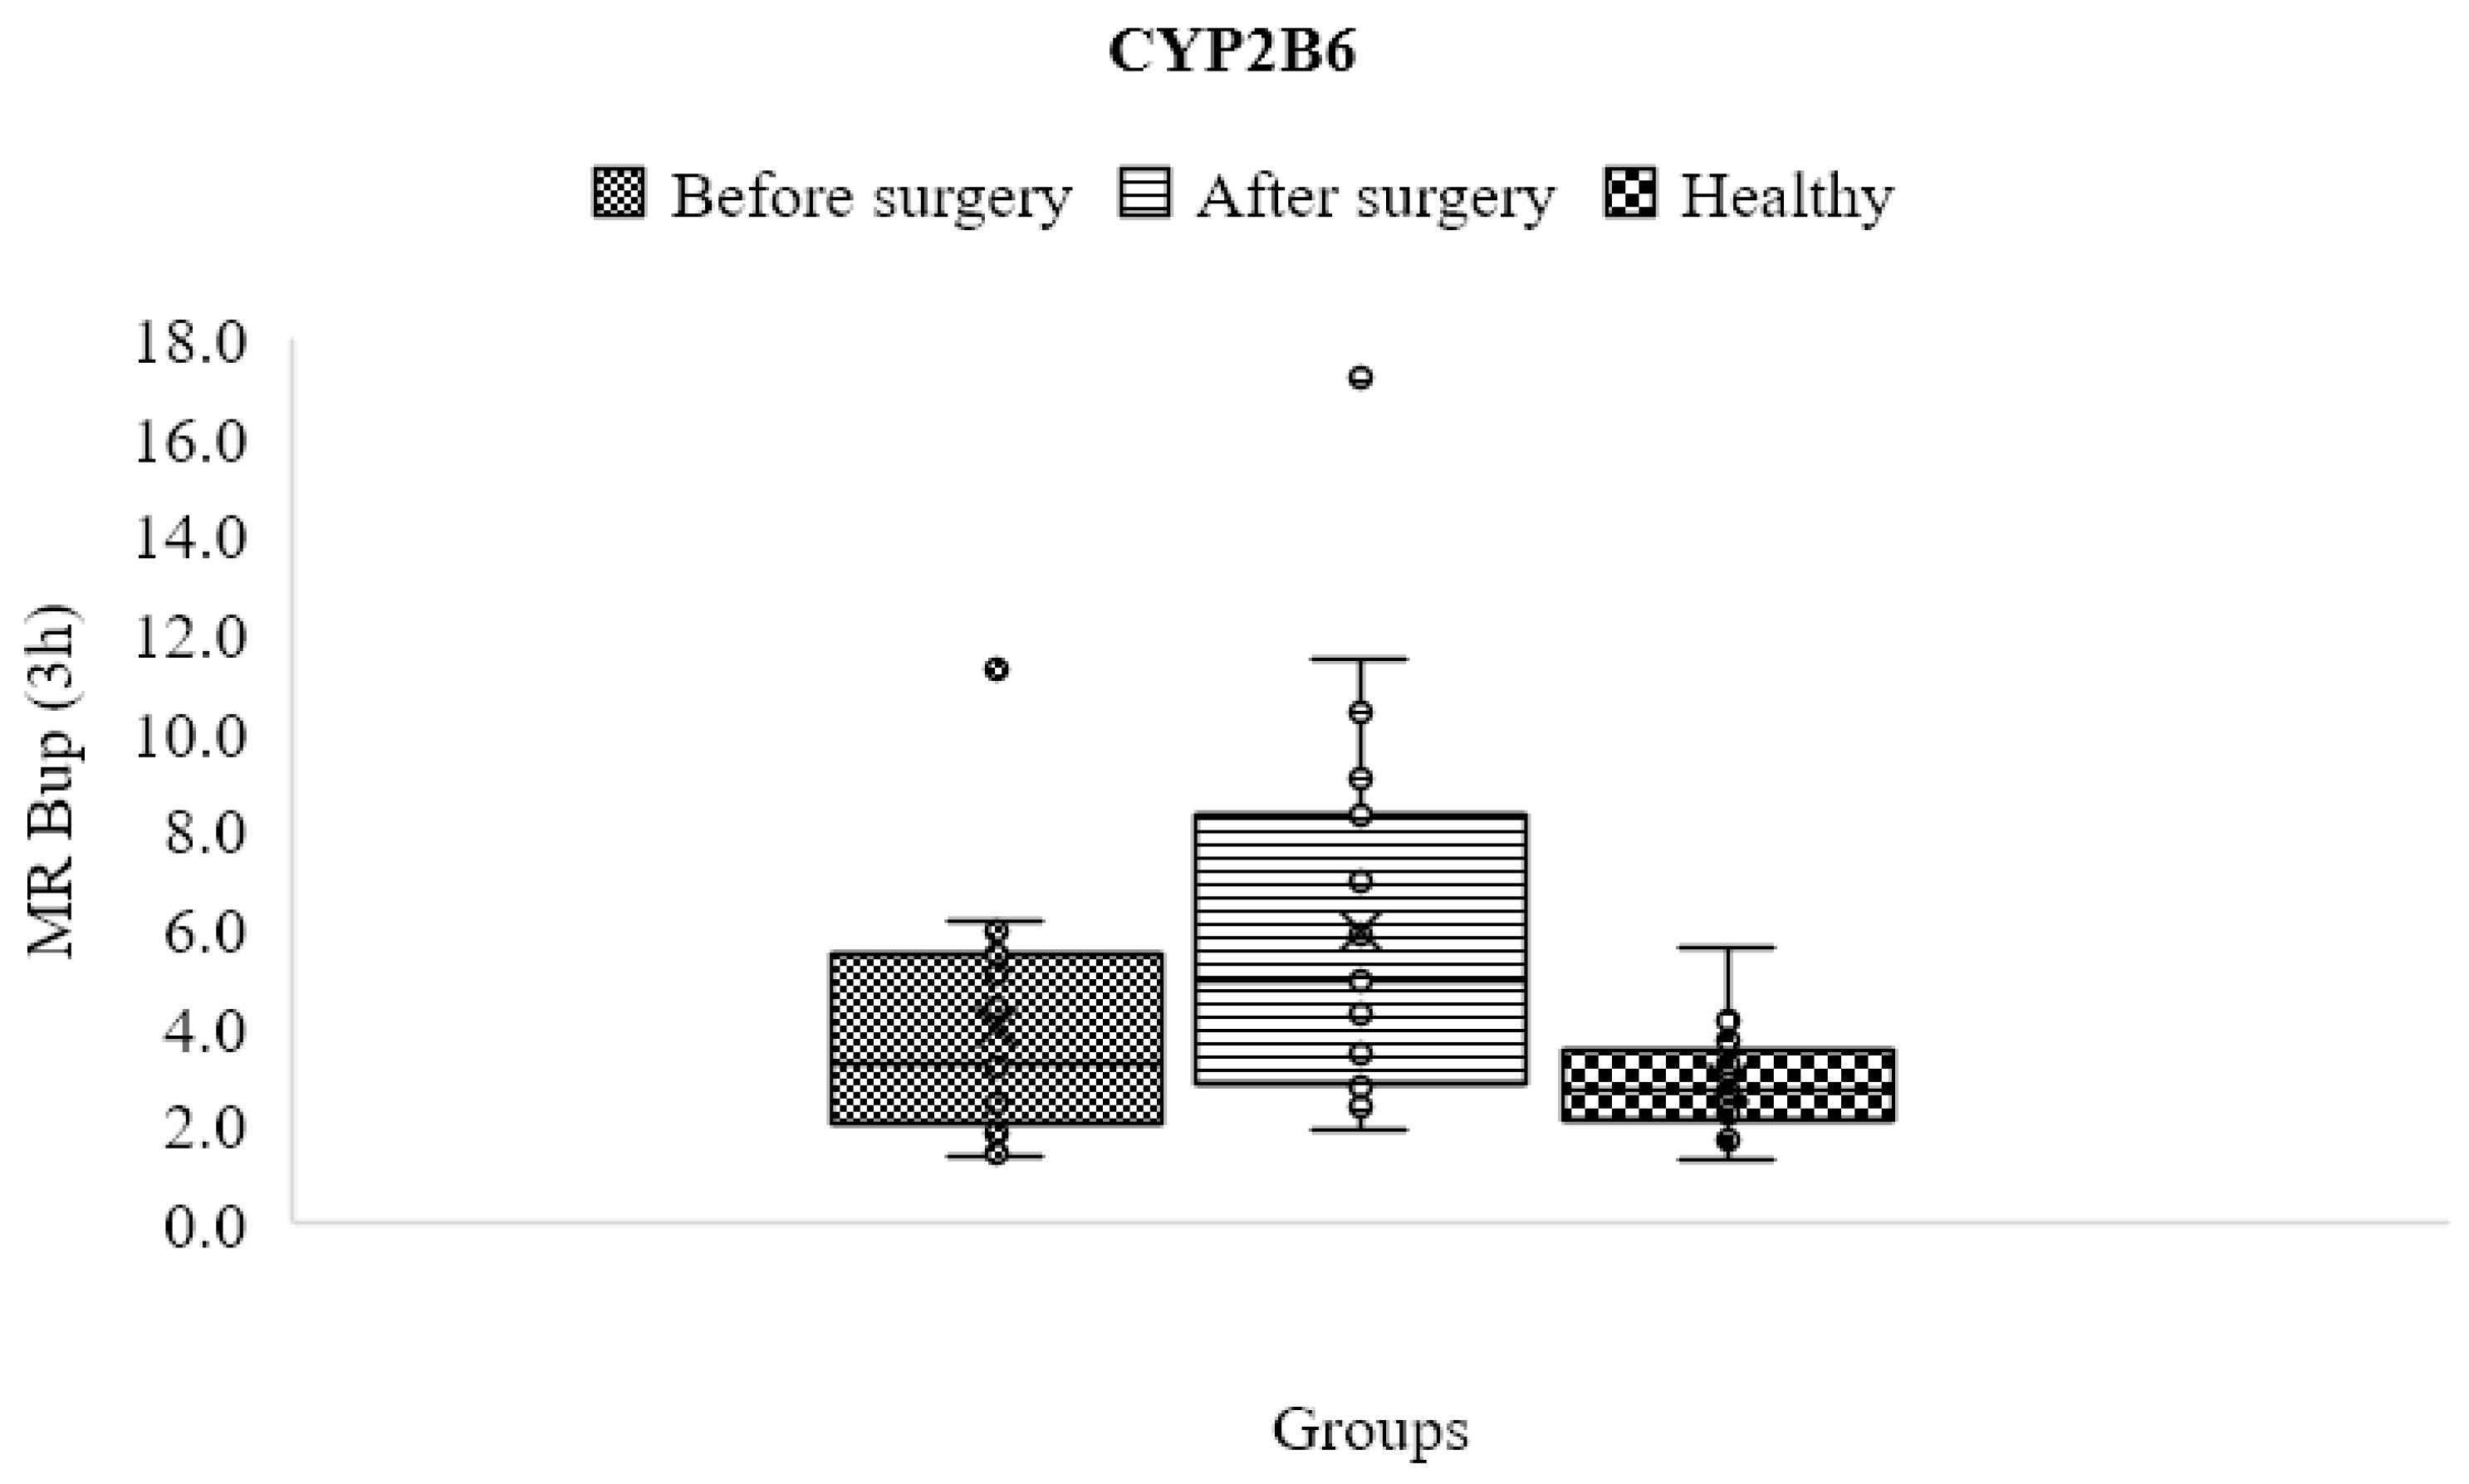
3.7. CYP2B6
3.8. CYP2C9
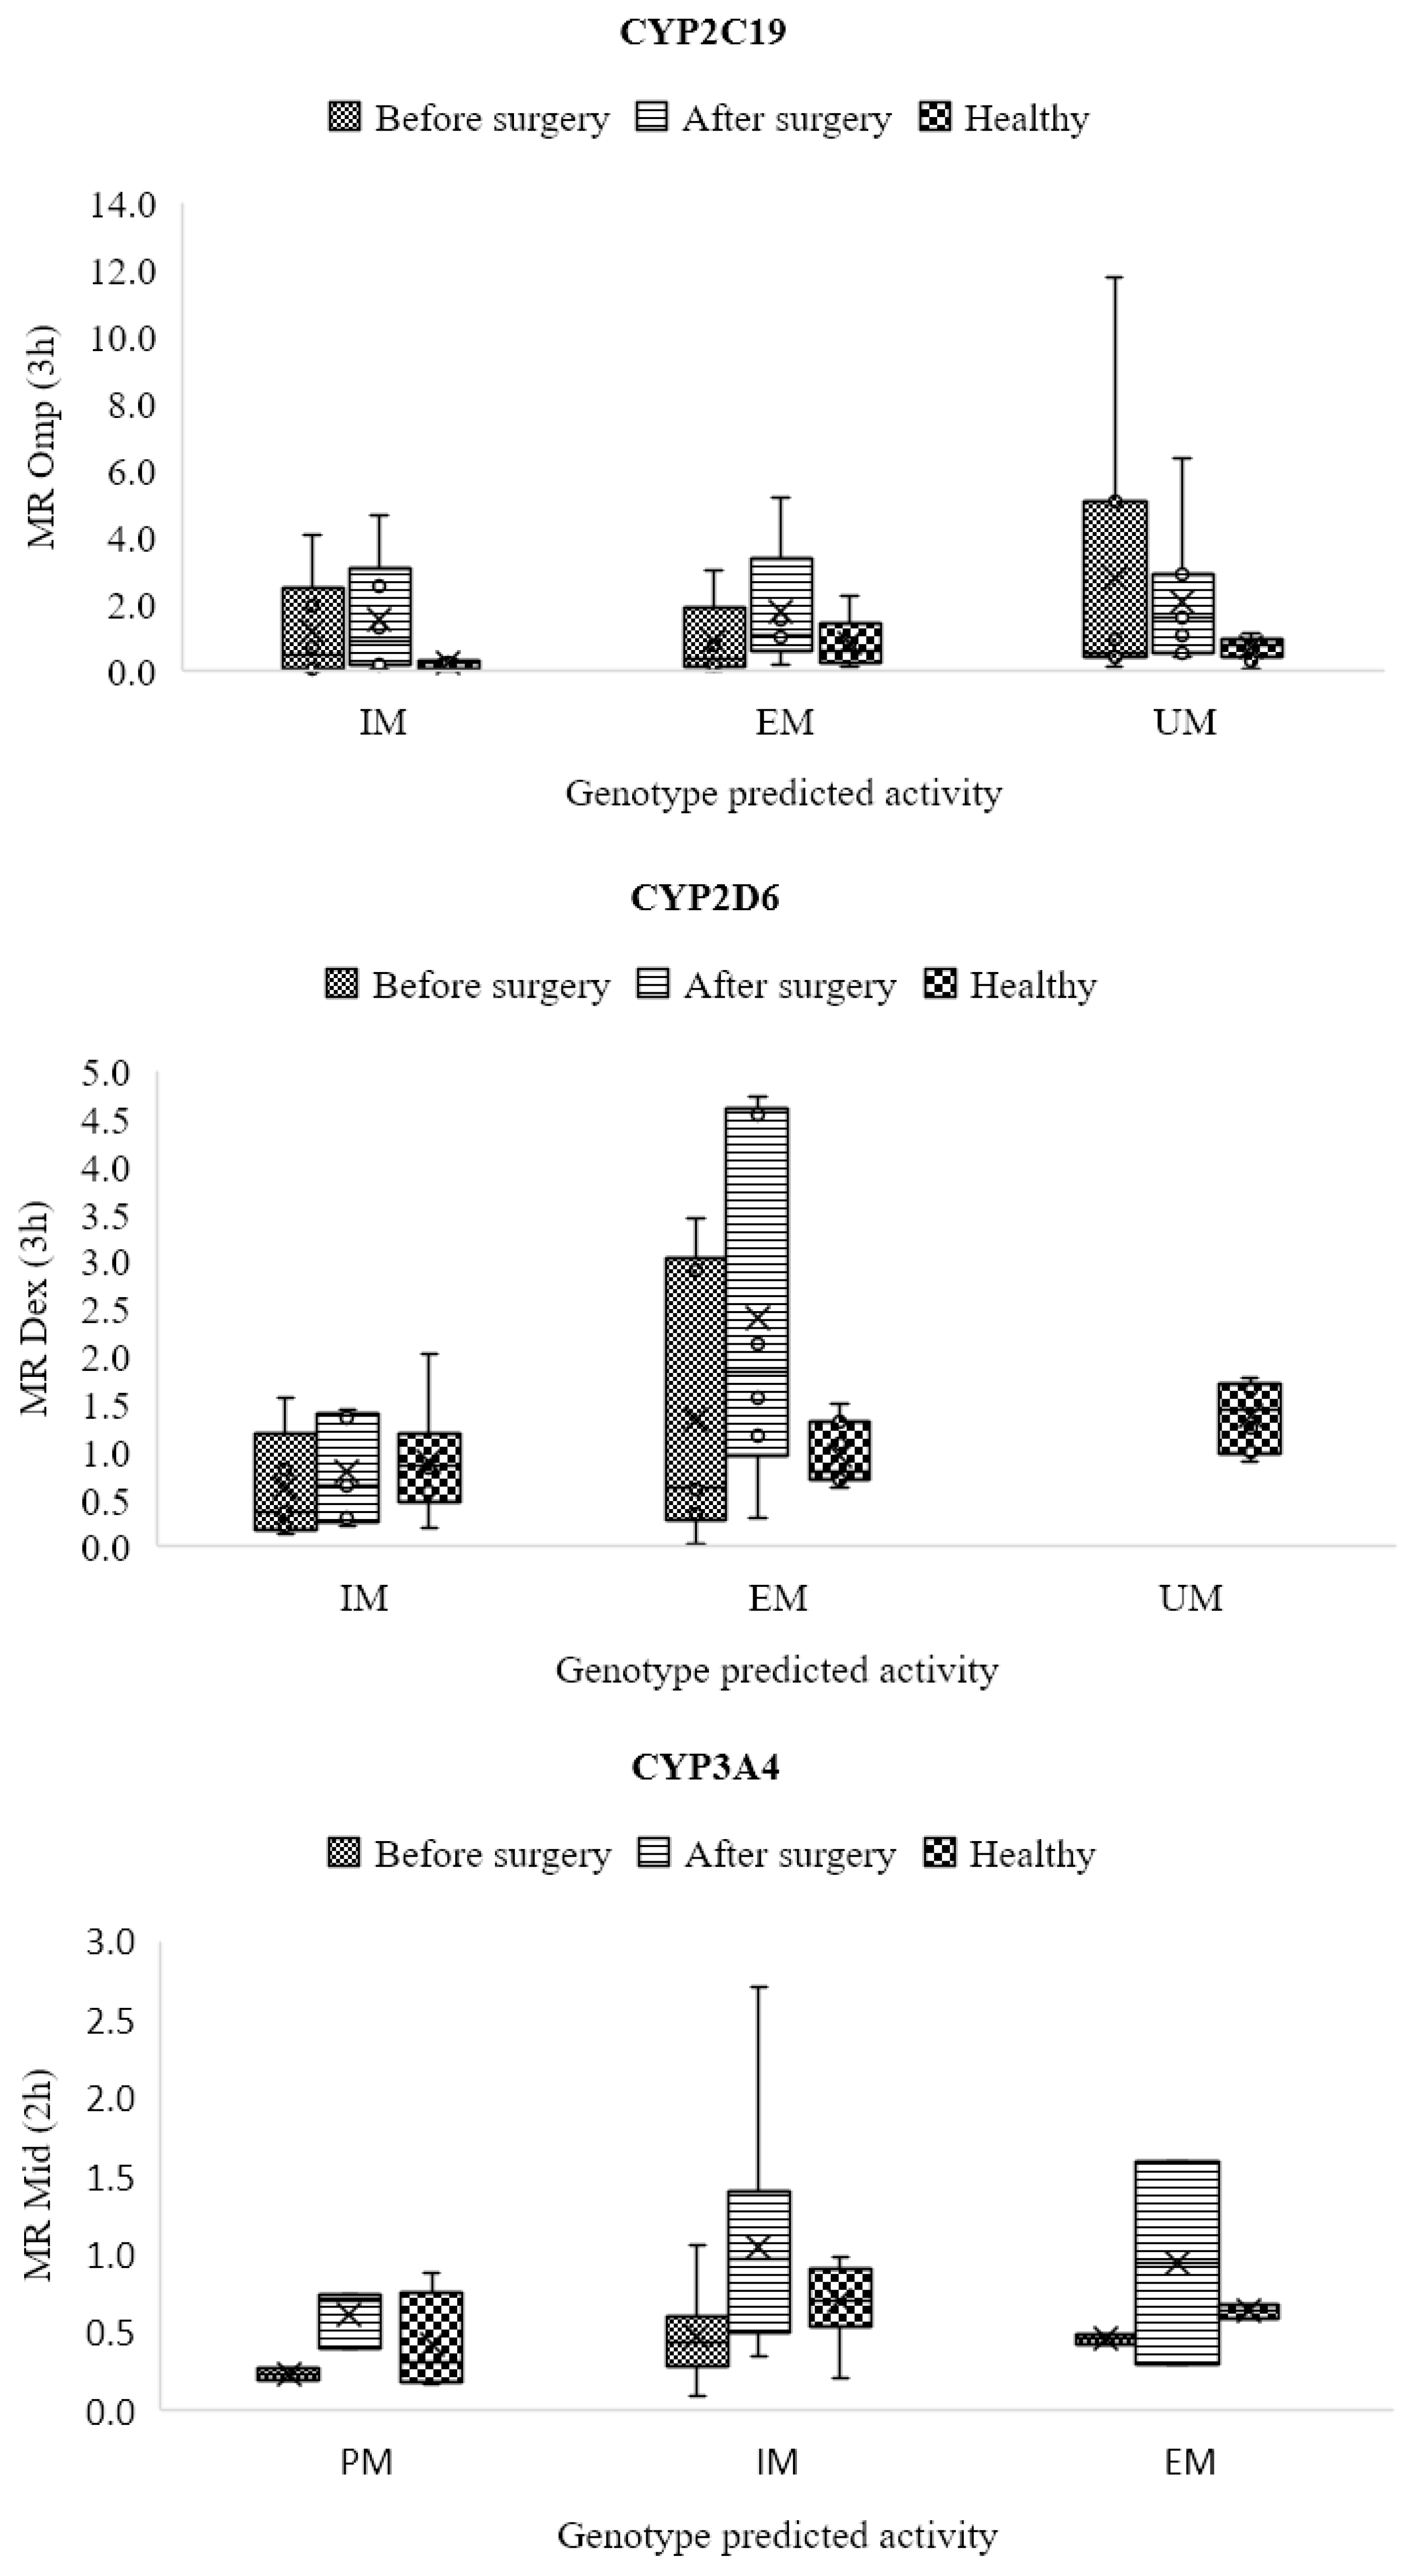
3.9. CYP2C19
3.10. CYP2D6
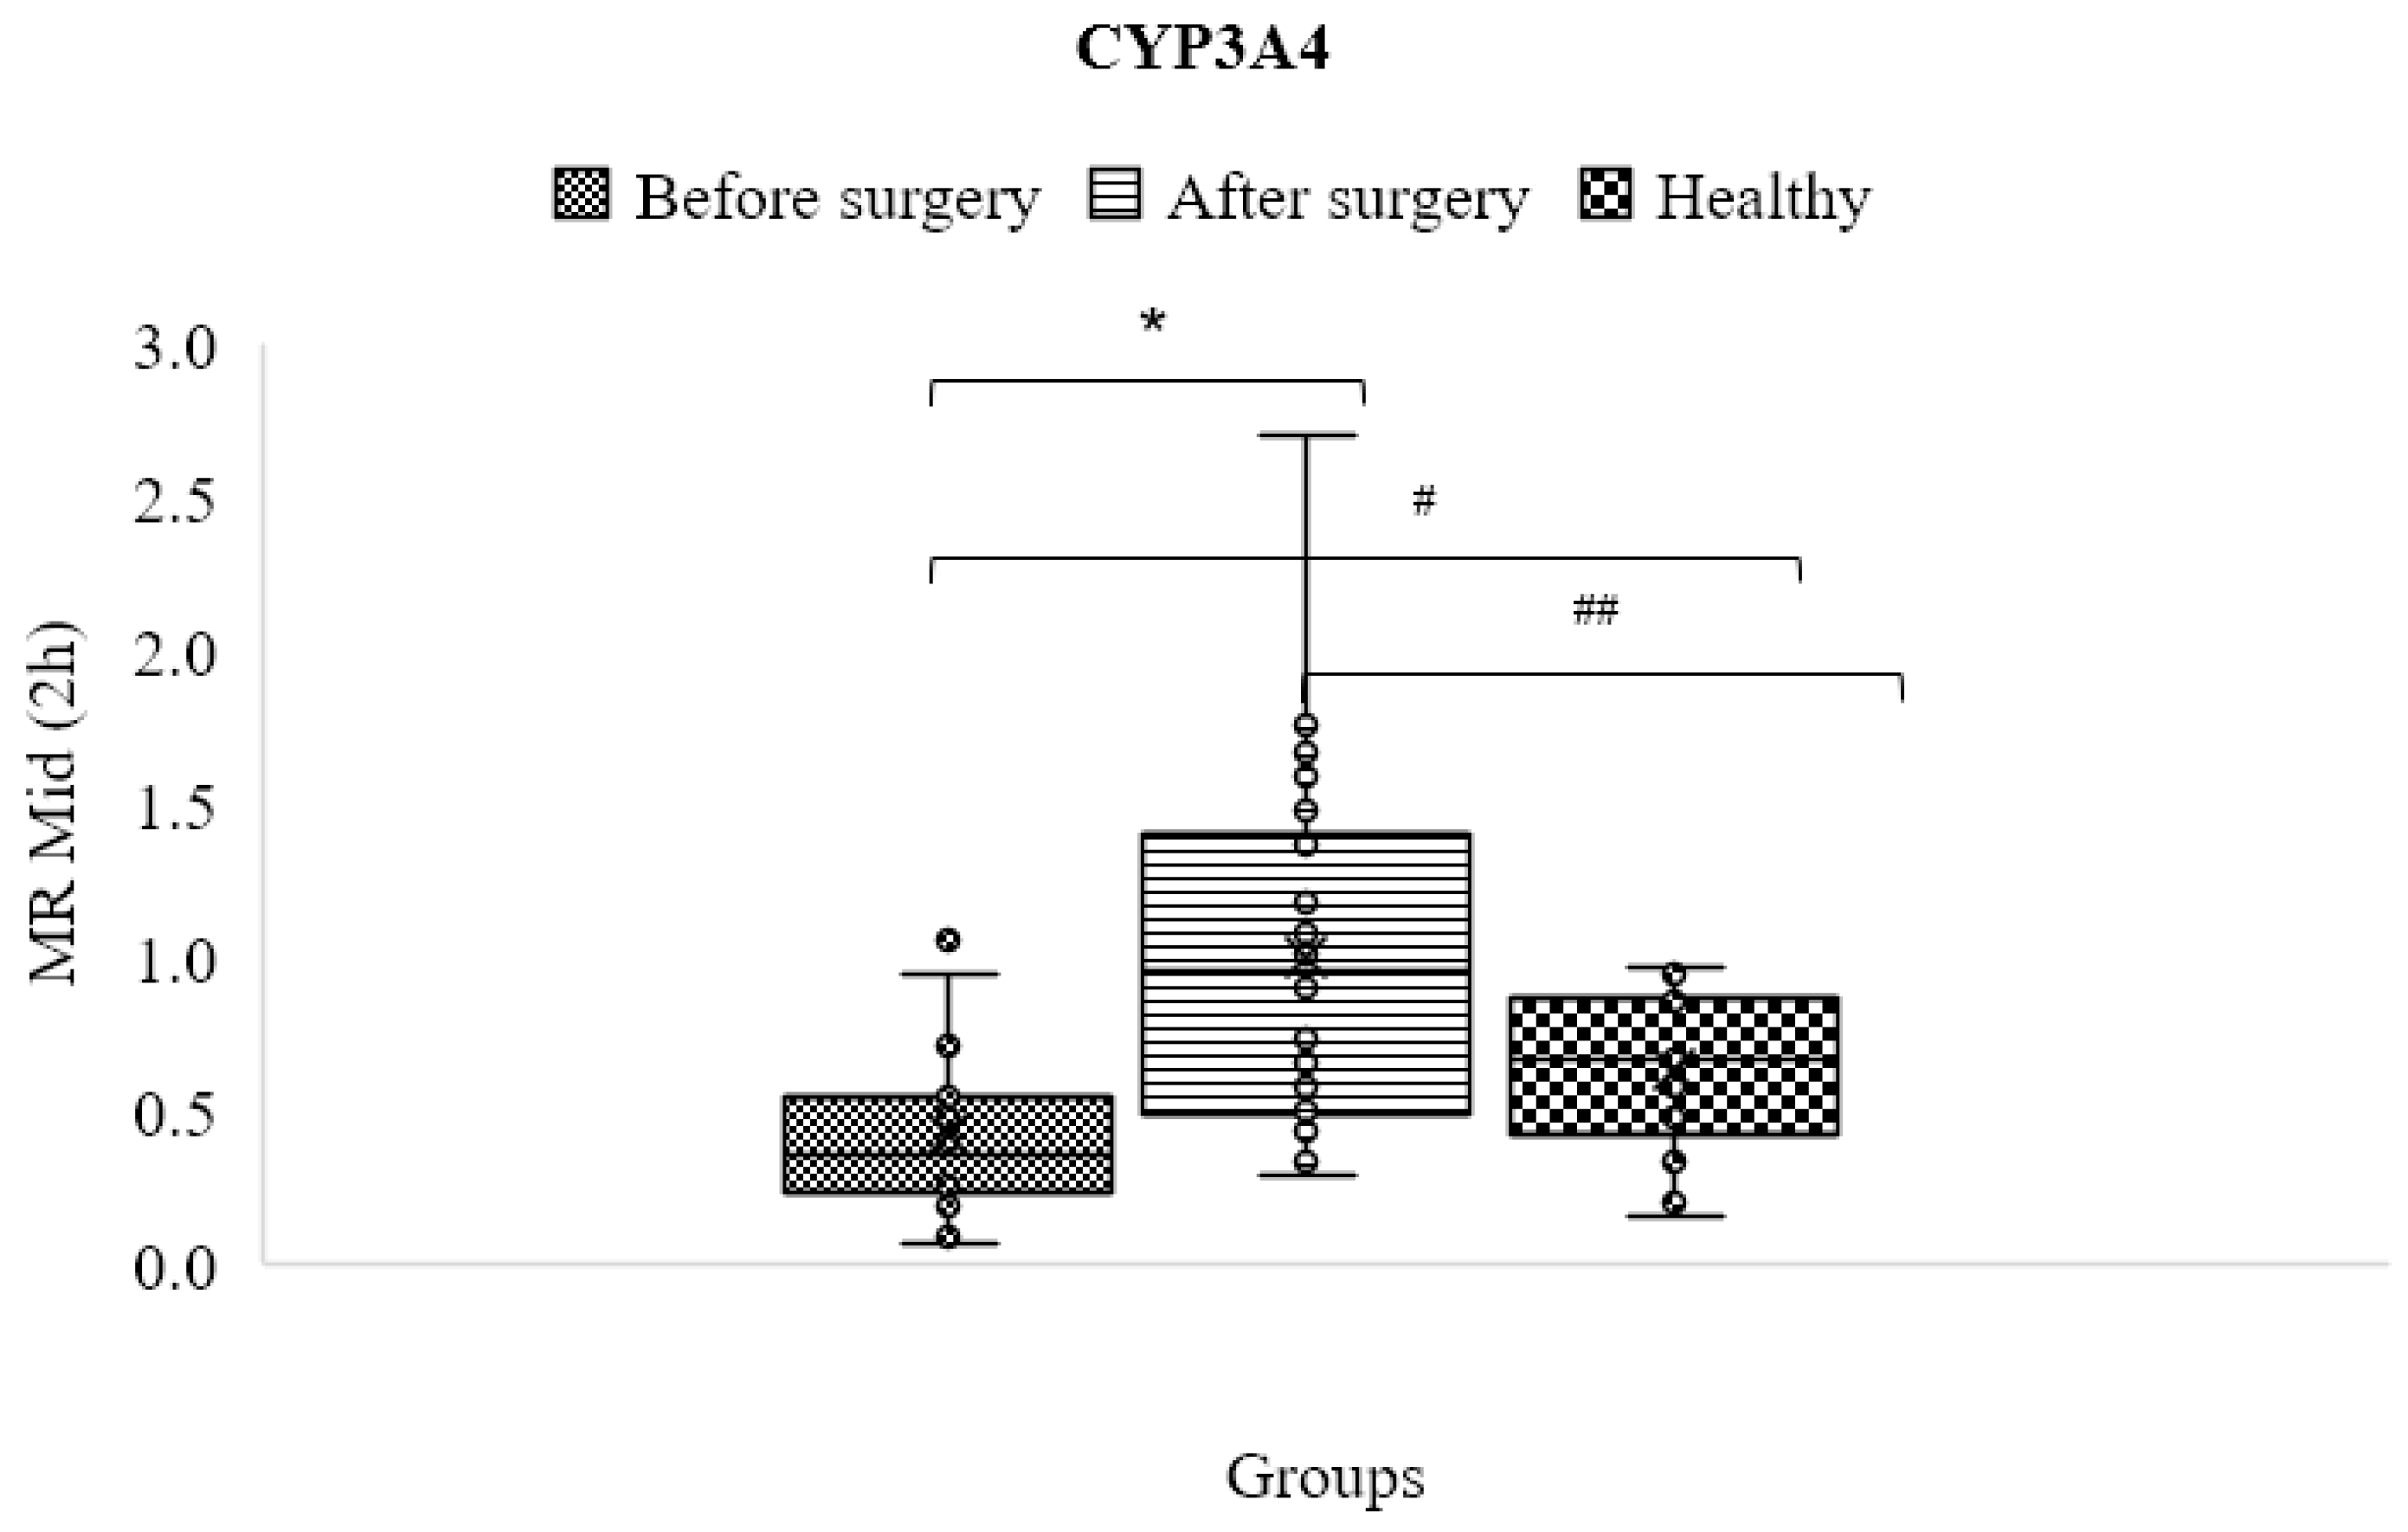
3.11. CYP3A4/5
3.12. P-gp Pump
4. Discussion
5. Strengths and Weaknesses of the Project
Author Contributions
Funding
Institutional Review Board Statement
Informed Consent Statement
Acknowledgments
Conflicts of Interest
References
- Klomp, S.D.; Manson, M.L.; Guchelaar, H.J.; Swen, J.J. Phenoconversion of Cytochrome P450 Metabolism: A Systematic Review. J. Clin. Med. 2020, 9, 2890. [Google Scholar] [CrossRef]
- Lesche, D.; Mostafa, S.; Everall, I.; Pantelis, C.; Bousman, C.A. Impact of CYP1A2, CYP2C19, and CYP2D6 genotype- and phenoconversion-predicted enzyme activity on clozapine exposure and symptom severity. Pharm. J. 2020, 20, 192–201. [Google Scholar] [CrossRef]
- Shah, R.R.; Smith, R.L. Addressing phenoconversion: The Achilles’ heel of personalized medicine. Br. J. Clin. Pharmacol. 2015, 79, 222–240. [Google Scholar] [CrossRef] [Green Version]
- Shah, R.R.; Smith, R.L. Inflammation-induced phenoconversion of polymorphic drug metabolizing enzymes: Hypothesis with implications for personalized medicine. Drug. Metab. Dispos. 2015, 43, 400–410. [Google Scholar] [CrossRef] [Green Version]
- Lenoir, C.; Daali, Y.; Rollason, V.; Curtin, F.; Gloor, Y.; Bosilkovska, M.; Walder, B.; Gabay, C.; Nissen, M.J.; Desmeules, J.A.; et al. Impact of Acute Inflammation on Cytochromes P450 Activity Assessed by the Geneva Cocktail. Clin. Pharmacol. Ther. 2021, 109, 1668–1676. [Google Scholar] [CrossRef]
- Shah, R.R.; Gaedigk, A. Precision medicine: Does ethnicity information complement genotype-based prescribing decisions? Ther. Adv. Drug Saf. 2018, 9, 45–62. [Google Scholar] [CrossRef] [Green Version]
- Puris, E.; Pasanen, M.; Ranta, V.P.; Gynther, M.; Petsalo, A.; Kakela, P.; Mannisto, V.; Pihlajamaki, J. Laparoscopic Roux-en-Y gastric bypass surgery influenced pharmacokinetics of several drugs given as a cocktail with the highest impact observed for CYP1A2, CYP2C8 and CYP2E1 substrates. Basic. Clin. Pharmacol. Toxicol. 2019, 125, 123–132. [Google Scholar] [CrossRef]
- Porazka, J.; Szalek, E.; Polom, W.; Czajkowski, M.; Grabowski, T.; Matuszewski, M.; Grzeskowiak, E. Influence of Obesity and Type 2 Diabetes Mellitus on the Pharmacokinetics of Tramadol After Single Oral Dose Administration. Eur. J. Drug. Metab. Pharmacokinet. 2019, 44, 579–584. [Google Scholar] [CrossRef] [Green Version]
- Salici, A.G.; Sisman, P.; Gul, O.O.; Karayel, T.; Cander, S.; Ersoy, C. The Prevalence of Obesity and Related Factors: An Urban Survey Study. Endocrine Abstracts. 2017. Available online: https://www.endocrine-abstracts.org/ea/0049/ea0049EP679 (accessed on 4 May 2023).
- Jain, R.; Chung, S.M.; Jain, L.; Khurana, M.; Lau, S.W.; Lee, J.E.; Vaidyanathan, J.; Zadezensky, I.; Choe, S.; Sahajwalla, C.G. Implications of obesity for drug therapy: Limitations and challenges. Clin. Pharmacol. Ther. 2011, 90, 77–89. [Google Scholar] [CrossRef]
- Elrazek, A.E.; Elbanna, A.E.; Bilasy, S.E. Medical management of patients after bariatric surgery: Principles and guidelines. World J. Gastrointest. Surg. 2014, 6, 220–228. [Google Scholar] [CrossRef] [Green Version]
- Bland, C.M.; Quidley, A.M.; Love, B.L.; Yeager, C.; McMichael, B.; Bookstaver, P.B. Long-term pharmacotherapy considerations in the bariatric surgery patient. Am. J. Health Syst. Pharm. 2016, 73, 1230–1242. [Google Scholar] [CrossRef] [Green Version]
- Brocks, D.R.; Ben-Eltriki, M.; Gabr, R.Q.; Padwal, R.S. The effects of gastric bypass surgery on drug absorption and pharmacokinetics. Expert. Opin. Drug. Metab. Toxicol. 2012, 8, 1505–1519. [Google Scholar] [CrossRef]
- Zhang, J.M.; An, J. Cytokines, inflammation, and pain. Int. Anesthesiol. Clin. 2007, 45, 27–37. [Google Scholar] [CrossRef] [Green Version]
- de Jong, L.M.; Jiskoot, W.; Swen, J.J.; Manson, M.L. Distinct Effects of Inflammation on Cytochrome P450 Regulation and Drug Metabolism: Lessons from Experimental Models and a Potential Role for Pharmacogenetics. Genes 2020, 11, 1509. [Google Scholar] [CrossRef]
- Bosilkovska, M.; Samer, C.F.; Deglon, J.; Rebsamen, M.; Staub, C.; Dayer, P.; Walder, B.; Desmeules, J.A.; Daali, Y. Geneva cocktail for cytochrome p450 and P-glycoprotein activity assessment using dried blood spots. Clin. Pharmacol. Ther. 2014, 96, 349–359. [Google Scholar] [CrossRef]
- Donzelli, M.; Derungs, A.; Serratore, M.G.; Noppen, C.; Nezic, L.; Krahenbuhl, S.; Haschke, M. The basel cocktail for simultaneous phenotyping of human cytochrome P450 isoforms in plasma, saliva and dried blood spots. Clin. Pharmacokinet. 2014, 53, 271–282. [Google Scholar] [CrossRef]
- Tracy, T.S.; Chaudhry, A.S.; Prasad, B.; Thummel, K.E.; Schuetz, E.G.; Zhong, X.B.; Tien, Y.C.; Jeong, H.; Pan, X.; Shireman, L.M.; et al. Interindividual Variability in Cytochrome P450-Mediated Drug Metabolism. Drug. Metab. Dispos. 2016, 44, 343–351. [Google Scholar] [CrossRef] [Green Version]
- Bosilkovska, M.; Samer, C.; Deglon, J.; Thomas, A.; Walder, B.; Desmeules, J.; Daali, Y. Evaluation of Mutual Drug-Drug Interaction within Geneva Cocktail for Cytochrome P450 Phenotyping using Innovative Dried Blood Sampling Method. Basic. Clin. Pharmacol. Toxicol. 2016, 119, 284–290. [Google Scholar] [CrossRef] [Green Version]
- Ghasim, H.; Rouini, M.; Gholami, K.; Larti, F.; Safari, S.; Ardakani, Y.H. Evaluation of phenoconversion phenomenon in obese patients: The effects of bariatric surgery on the CYP450 activity “a protocol for a case-control pharmacokinetic study”. J. Diabetes Metab. Disord. 2021, 20, 2085–2092. [Google Scholar] [CrossRef]
- Tveden-Nyborg, P.; Bergmann, T.K.; Lykkesfeldt, J. Basic & Clinical Pharmacology & Toxicology Policy for Experimental and Clinical studies. Basic. Clin. Pharmacol. Toxicol. 2018, 123, 233–235. [Google Scholar] [CrossRef] [Green Version]
- Hjelmesaeth, J.; Asberg, A.; Andersson, S.; Sandbu, R.; Robertsen, I.; Johnson, L.K.; Angeles, P.C.; Hertel, J.K.; Skovlund, E.; Heijer, M.; et al. Impact of body weight, low energy diet and gastric bypass on drug bioavailability, cardiovascular risk factors and metabolic biomarkers: Protocol for an open, non-randomised, three-armed single centre study (COCKTAIL). BMJ Open 2018, 8, e021878. [Google Scholar] [CrossRef]
- Farnert, A.; Arez, A.P.; Correia, A.T.; Bjorkman, A.; Snounou, G.; do Rosario, V. Sampling and storage of blood and the detection of malaria parasites by polymerase chain reaction. Trans. R. Soc. Trop. Med. Hyg. 1999, 93, 50–53. [Google Scholar] [CrossRef]
- Puris, E.; Pasanen, M.; Gynther, M.; Hakkinen, M.R.; Pihlajamaki, J.; Keranen, T.; Honkakoski, P.; Raunio, H.; Petsalo, A. A liquid chromatography-tandem mass spectrometry analysis of nine cytochrome P450 probe drugs and their corresponding metabolites in human serum and urine. Anal. Bioanal. Chem. 2017, 409, 251–268. [Google Scholar] [CrossRef]
- Bosilkovska, M.; Déglon, J.; Samer, C.; Walder, B.; Desmeules, J.; Staub, C.; Daali, Y. Simultaneous LC–MS/MS quantification of P-glycoprotein and cytochrome P450 probe substrates and their metabolites in DBS and plasma. Bioanalysis 2014, 6, 151–164. [Google Scholar] [CrossRef] [Green Version]
- Gravel, S.; Chiasson, J.L.; Turgeon, J.; Grangeon, A.; Michaud, V. Modulation of CYP450 Activities in Patients with Type 2 Diabetes. Clin. Pharmacol. Ther. 2019, 106, 1280–1289. [Google Scholar] [CrossRef]
- Chiara Broccanello, L.G.; Stevanato, P. QuantStudio™ 12K Flex OpenArray® System as a Tool for High-Throughput Genotyping and Gene Expression Analysis. In Methods in Molecular Biology; Humana Press: Totowa, NJ, USA, 2019. [Google Scholar]
- Achour, B.; Gosselin, P.; Terrier, J.; Gloor, Y.; Al-Majdoub, Z.M.; Polasek, T.M.; Daali, Y.; Rostami-Hodjegan, A.; Reny, J.L. Liquid Biopsy for Patient Characterization in Cardiovascular Disease: Verification against Markers of Cytochrome P450 and P-Glycoprotein Activities. Clin. Pharmacol. Ther. 2022, 111, 1268–1277. [Google Scholar] [CrossRef]
- Samer, C.F.; Lorenzini, K.I.; Rollason, V.; Daali, Y.; Desmeules, J.A. Applications of CYP450 testing in the clinical setting. Mol. Diagn. Ther. 2013, 17, 165–184. [Google Scholar] [CrossRef] [Green Version]
- Gloor, Y.; Lloret-Linares, C.; Bosilkovska, M.; Perroud, N.; Richard-Lepouriel, H.; Aubry, J.M.; Daali, Y.; Desmeules, J.A.; Besson, M. Drug metabolic enzyme genotype-phenotype discrepancy: High phenoconversion rate in patients treated with antidepressants. Biomed. Pharmacother. 2022, 152, 113202. [Google Scholar] [CrossRef]
- Desta, Z.; Gammal, R.S.; Gong, L.; Whirl-Carrillo, M.; Gaur, A.H.; Sukasem, C.; Hockings, J.; Myers, A.; Swart, M.; Tyndale, R.F.; et al. Clinical Pharmacogenetics Implementation Consortium (CPIC) Guideline forCYP2B6and Efavirenz-Containing Antiretroviral Therapy. Clin. Pharmacol. Ther. 2019, 106, 726–733. [Google Scholar] [CrossRef] [Green Version]
- Theken, K.N.; Lee, C.R.; Gong, L.; Caudle, K.E.; Formea, C.M.; Gaedigk, A.; Klein, T.E.; Agundez, J.A.G.; Grosser, T. Clinical Pharmacogenetics Implementation Consortium Guideline (CPIC) for CYP2C9 and Nonsteroidal Anti-Inflammatory Drugs. Clin. Pharmacol. Ther. 2020, 108, 191–200. [Google Scholar] [CrossRef]
- Crews, K.R.; Monte, A.A.; Huddart, R.; Caudle, K.E.; Kharasch, E.D.; Gaedigk, A.; Dunnenberger, H.M.; Leeder, J.S.; Callaghan, J.T.; Samer, C.F.; et al. Clinical Pharmacogenetics Implementation Consortium Guideline for CYP2D6, OPRM1, and COMT Genotypes and Select Opioid Therapy. Clin. Pharmacol. Ther. 2021, 110, 888–896. [Google Scholar] [CrossRef]
- Scott, S.A.; Sangkuhl, K.; Stein, C.M.; Hulot, J.S.; Mega, J.L.; Roden, D.M.; Klein, T.E.; Sabatine, M.S.; Johnson, J.A.; Shuldiner, A.R.; et al. Clinical Pharmacogenetics Implementation Consortium guidelines for CYP2C19 genotype and clopidogrel therapy: 2013 update. Clin. Pharmacol. Ther. 2013, 94, 317–323. [Google Scholar] [CrossRef]
- Preissner, S.C.; Hoffmann, M.F.; Preissner, R.; Dunkel, M.; Gewiess, A.; Preissner, S. Polymorphic cytochrome P450 enzymes (CYPs) and their role in personalized therapy. PLoS ONE 2013, 8, e82562. [Google Scholar] [CrossRef]
- Tandra, S.; Chalasani, N.; Jones, D.R.; Mattar, S.; Hall, S.D.; Vuppalanchi, R. Pharmacokinetic and pharmacodynamic alterations in the Roux-en-Y gastric bypass recipients. Ann. Surg. 2013, 258, 262–269. [Google Scholar] [CrossRef]
- Lloret-Linares, C.; Daali, Y.; Abbara, C.; Carette, C.; Bouillot, J.-L.; Vicaut, E.; Czernichow, S.; Declèves, X. CYP450 activities before and after Roux-en-Y gastric bypass: Correlation with their intestinal and liver content. Surg. Obes. Relat. Dis. 2019, 15, 1299–1310. [Google Scholar] [CrossRef]
- Neyshaburinezhad, N.; Shirzad, N.; Rouini, M.; Namazi, S.; Khoshayand, M.; Esteghamati, A.; Nakhjavani, M.; Ghasim, H.; Daali, Y.; Ardakani, Y.H. Evaluation of important human CYP450 isoforms and P-glycoprotein phenotype changes and genotype in type 2 diabetic patients, before and after intensifying treatment regimen, by using Geneva cocktail. Basic. Clin. Pharmacol. Toxicol. 2023. [Google Scholar] [CrossRef]
- Lenoir, C.; Terrier, J.; Gloor, Y.; Gosselin, P.; Daali, Y.; Combescure, C.; Desmeules, J.A.; Samer, C.F.; Reny, J.L.; Rollason, V. Impact of the Genotype and Phenotype of CYP3A and P-gp on the Apixaban and Rivaroxaban Exposure in a Real-World Setting. J. Pers. Med. 2022, 12, 526. [Google Scholar] [CrossRef]
- Daniel Porat, O.D.; Vainer, E.; Cvijić, S.; Dahan, A. Antiallergic Treatment of Bariatric Patients: Potentially Hampered Solubility/Dissolution and Bioavailability of Loratadine, but Not Desloratadine, Post-Bariatric Surgery. Mol. Pharm. 2022, 19, 2922–2936. [Google Scholar] [CrossRef]
- Hagman, D.K.; Larson, I.; Kuzma, J.N.; Cromer, G.; Makar, K.; Rubinow, K.B.; Foster-Schubert, K.E.; van Yserloo, B.; Billing, P.S.; Landerholm, R.W.; et al. The short-term and long-term effects of bariatric/metabolic surgery on subcutaneous adipose tissue inflammation in humans. Metabolism 2017, 70, 12–22. [Google Scholar] [CrossRef] [Green Version]


| BMI (kg/m2) | Classification |
|---|---|
| <18.5 | Underweight |
| ≥18.5 and <25.0 | Normal weight |
| ≥25.0 and <30.0 | Overweight |
| ≥30.0 | Obese (in general) |
| ≥30.0 and <35.0 | Obese class I (moderate obesity) |
| ≥35.0 and <40.0 | Obese class II (severe obesity) and Obese class III (morbid obesity) |
| ≥40.0 | Classification Underweight |
| Parameters | Healthy Participants | Obese Patients before Treatment | Obese Patients after Treatment |
|---|---|---|---|
| No (%) of subjects | 21 | 24 | |
| Sex No. (%) M:F | 14:7 (67:33) | 3:21 (13:87) | |
| Age (years) | 30 ± 8.9 | 36.6 ± 8.7 | |
| BMI (Kg/m2) | 24.3 ± 3.0 | 45.1 ± 4.2 * | 32.5 ± 3.6 * |
| High blood pressure No. (%) | 0 | 2 (8.3) | |
| Fatty liver No. (%) | 0 | 3 (12.5) | |
| ESR (mm/Hr) | - | 30.1 ± 15.7 | 20.2 ± 18.1 * |
| AST (U/L) | - | 20.9 ± 7.8 | 16.8 ± 4.6 * |
| ALT (U/L) | - | 26.6 ± 13.9 | 15.7 ± 5.9 * |
| HbA1c (%) | - | 5.3 ± 0.5 | 5.0 ± 0.4 * |
| TSH (micIU/mL) | - | 4.3 ± 4.1 | 2.4 ± 1.3 |
| Cr (mg/dL) | - | 0.9 ± 0.1 | 0.9 ± 0.1 |
| Smokers No. (%) | 0 | 12 (50) | |
| Alcohol cons. No. (%) | 0 | 4 (16.7) | |
| SV-index (cc/m2) | - | 31 ± 5.7 | 40.6 ± 5.7 * |
| CO-index (cc/m2) | - | 2425 ± 475 | 2788 ± 663 * |
| IL-1β (pg/mL) | 0.9 ± 0.6 | 2.1 ± 3.1 | 3.1 ± 5.2 |
| IL-6 (pg/mL) | 2.5 ± 1.5 | 7.3 ± 10.1 | 9.6 ± 11.0 |
| Medication use, No. (%) of subjects | |||
| Metformin | 0 | 4 (16.7) | |
| Statins | 1 (4.7) | 2 (8.3) | |
| ARB | 0 | 4 (16.7) | |
| CCB | 0 | 2 (8.3) | |
| Β-blockers | 0 | 4 (16.7) | |
| Aspirin | 0 | 3 (12.5) | |
| Other NSAIDs | 0 | 4 (16.7) | |
| Antidepressants | 0 | 1 (4.2) | |
| PPI | 1 (4.7) | 4 (16.7) | |
| OCP | 2 (9.5) | 2 (8.3) | |
| CYP450 | Control Group Genotype (%) | Obese Patients’ Genotype (%) |
|---|---|---|
| CYP1A2 | Ex (100) | Ex (100) |
| CYP2B6 | Ex (100) | Ex (95.7)-Ra (4.3) |
| CYP2C9 | IM (26.3)-Ex (73.7) | IM (27.3)-Ex (72.7) |
| CYP2C19 | IM (21.1)-Ex (36.8)- UR (42.1) | IM (27.3)-Ex (31.8)- UR (40.9) |
| CYP2D6 | IM (31.6)-Ex (36.8)-UR (31.6) | IM (40)-Ex (60) |
| CYP3A | PM (21.1)-IM (68.4)-Ex (10.5) | PM (13.6)-IM (72.7)-Ex (13.6) |
| Isoform | Phenotypic Parameter ** | Control Group (C) * | Obese- BS * | Obese- AS * | p-Value C vs. BS | p-Value C vs. AS | p-Value BS vs. AS |
|---|---|---|---|---|---|---|---|
| CYP1A2 | C2h paraxanthine/C2h caffeine | 0.129 ± 0.073 | 0.166 ± 0.145 | 0.341 ± 0.396 | 0.31 | 0.02 | 0.01 |
| CYP2B6 | C3h OH-bupropion/C3h bupropion | 2.855 ± 0.988 | 3.954 ± 2.257 | 5.969 ± 3.703 | 0.05 | 0.001 | 0.01 |
| CYP2C9 | C3h OH-flurbiprofen/C3h flurbiprofen | 0.074 ± 0.019 | 0.092 ± 0.043 | 0.110 ± 0.047 | 0.08 | 0.000001 | 0.01 |
| CYP2C19 | C3h OH-omeprazole/C3h omeprazole | 0.686 ± 0.558 | 1.683 ± 2.767 | 1.887 ± 2.003 | 0.13 | 0.02 | 0.56 |
| CYP2D6 | C3h dextrorphan/C3h dextromethorphan | 1.242 ± 0.835 | 1.091 ± 1.082 | 1.761 ± 1.592 | 0.65 | 0.22 | 0.15 |
| CYP3A4/5 | C2h OH-midazolam/C2h midazolam | 0.633 ± 0.253 | 0.419 ± 0.257 | 1.000 ± 0.590 | 0.01 | 0.01 | 0.00003 |
| Pump | Phenotypic Parameter # | Control Group (C) | Obese-BS * | Obese-AS * | p-Value C vs. BS | p-Value C vs. AS | p-Value BS vs. AS |
|---|---|---|---|---|---|---|---|
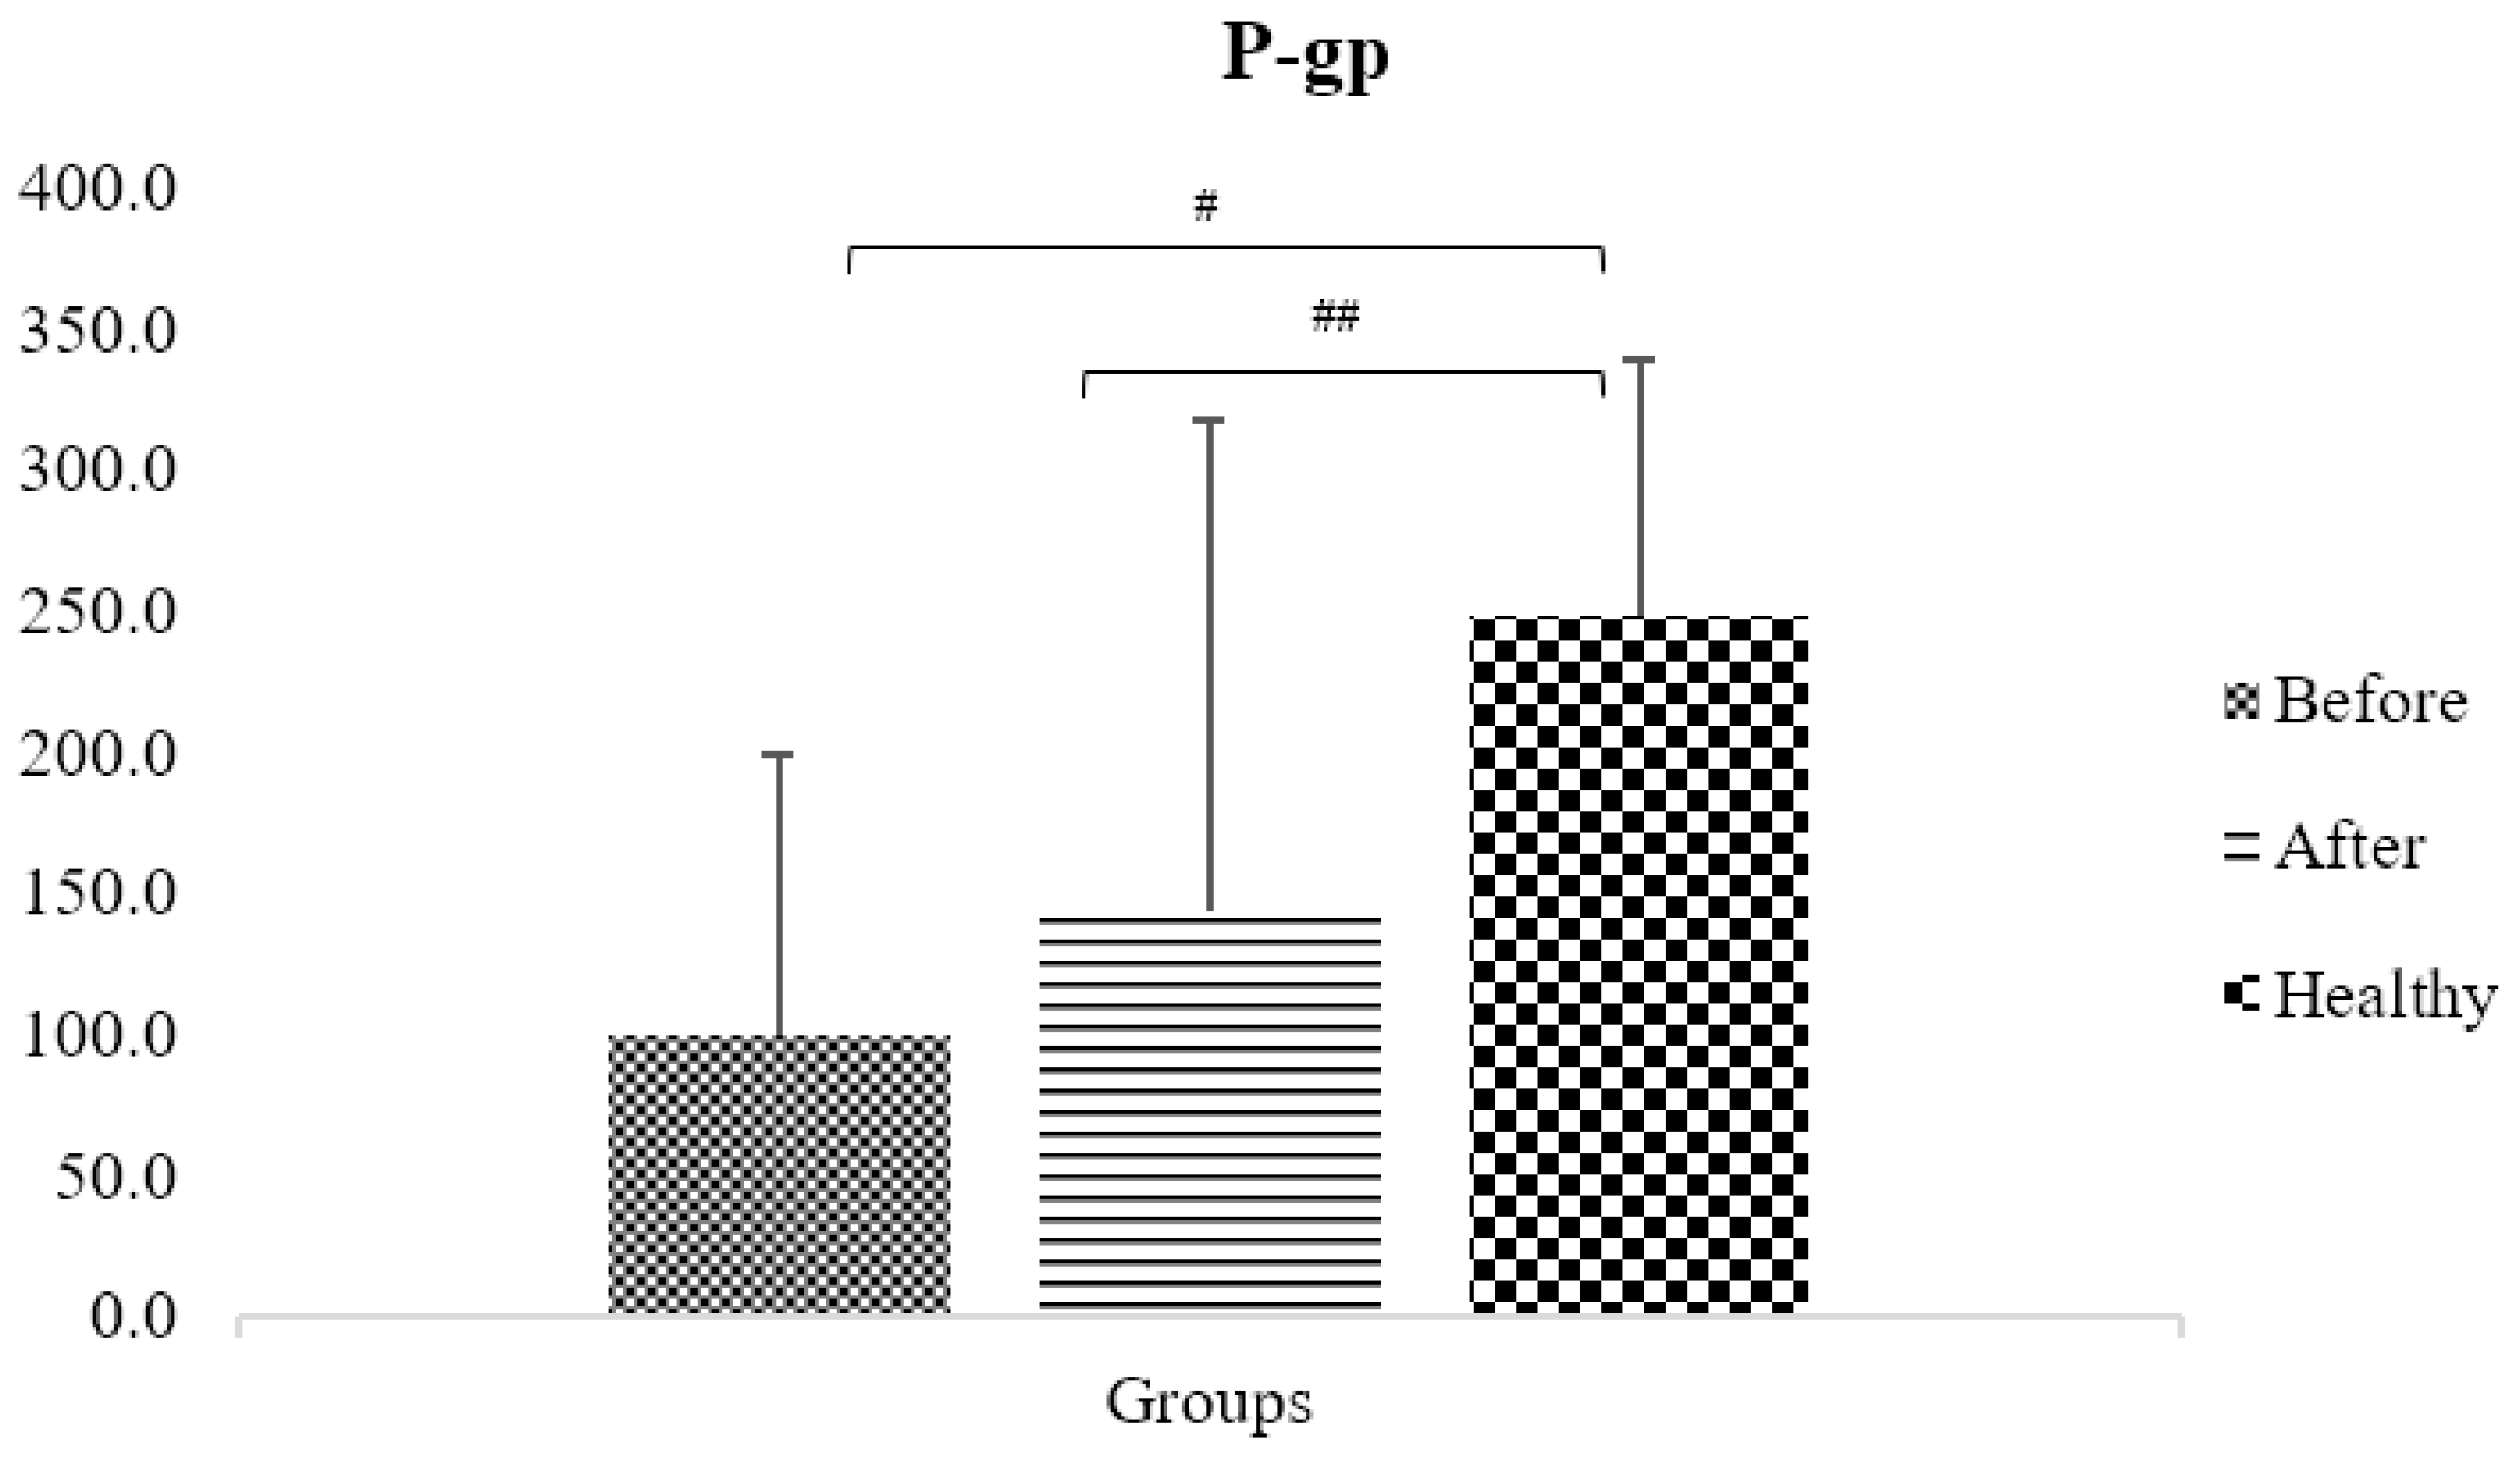
| P-gp | AUC0-3 fexofenadine | 248 ± 91 | 99.9 ± 98.7 | 143.1 ± 174.4 | 5.1 × 10⁻⁶ | 0.02 | 0.18 |
| Significancy | CYP1A2 | CYP2B6 | CYP2C9 | CYP2C19 | CYP2D6 | CYP3A4 | P-gp |
|---|---|---|---|---|---|---|---|
| Before vs. After |  |  |  |  |  |  |  |
| Before vs. Control |  |  |  |  |  |  |  |
| After vs. Control |  |  |  |  |  |  |  |
| Categories | Significant (ρ-value < 0.05) | Non-significant (ρ-value > 0.05) | |||||
| Before vs. After |  |  | |||||
| Before vs. Control |  |  | |||||
| After vs. Control |  |  | |||||
Disclaimer/Publisher’s Note: The statements, opinions and data contained in all publications are solely those of the individual author(s) and contributor(s) and not of MDPI and/or the editor(s). MDPI and/or the editor(s) disclaim responsibility for any injury to people or property resulting from any ideas, methods, instructions or products referred to in the content. |
© 2023 by the authors. Licensee MDPI, Basel, Switzerland. This article is an open access article distributed under the terms and conditions of the Creative Commons Attribution (CC BY) license (https://creativecommons.org/licenses/by/4.0/).
Share and Cite
Ghasim, H.; Rouini, M.; Safari, S.; Larti, F.; Khoshayand, M.; Gholami, K.; Neyshaburinezhad, N.; Gloor, Y.; Daali, Y.; Ardakani, Y.H. Impact of Obesity and Bariatric Surgery on Metabolic Enzymes and P-Glycoprotein Activity Using the Geneva Cocktail Approach. J. Pers. Med. 2023, 13, 1042. https://doi.org/10.3390/jpm13071042
Ghasim H, Rouini M, Safari S, Larti F, Khoshayand M, Gholami K, Neyshaburinezhad N, Gloor Y, Daali Y, Ardakani YH. Impact of Obesity and Bariatric Surgery on Metabolic Enzymes and P-Glycoprotein Activity Using the Geneva Cocktail Approach. Journal of Personalized Medicine. 2023; 13(7):1042. https://doi.org/10.3390/jpm13071042
Chicago/Turabian StyleGhasim, Hengameh, Mohammadreza Rouini, Saeed Safari, Farnoosh Larti, Mohammadreza Khoshayand, Kheirollah Gholami, Navid Neyshaburinezhad, Yvonne Gloor, Youssef Daali, and Yalda H. Ardakani. 2023. "Impact of Obesity and Bariatric Surgery on Metabolic Enzymes and P-Glycoprotein Activity Using the Geneva Cocktail Approach" Journal of Personalized Medicine 13, no. 7: 1042. https://doi.org/10.3390/jpm13071042