Article

Complement System Proteins in the Human Aqueous Humor and Their Association with Primary Open-Angle Glaucoma

1
Morsani College of Medicine, University of South Florida, Tampa, FL 33612, USA
2
Center for Biotechnology and Genomic Medicine, Medical College of Georgia, Augusta University, Augusta, GA 30912, USA
3
Department of Ophthalmology, Medical College of Georgia, Augusta University, Augusta, GA 30912, USA
4
Department of Population Health Sciences, Medical College of Georgia, Augusta University, Augusta, GA 30912, USA
*
Author to whom correspondence should be addressed.
J. Pers. Med. 2023, 13(9), 1400; https://doi.org/10.3390/jpm13091400
Submission received: 6 September 2023 / Revised: 14 September 2023 / Accepted: 15 September 2023 / Published: 19 September 2023
(This article belongs to the Special Issue Recent Advances and Clinical Research in Glaucoma)

Abstract

:
This study discovers the complement protein profile in the aqueous humor (AH) of human subjects and investigates its association with primary open-angle glaucoma (POAG) pathogenesis. Among the 32 complement proteins identified, 22 were highly abundant and detected in more than 50% of AH samples. The most predominant active complement proteins in the AH are C3, C4B, C4A, CFB, CFD, and C9. Additionally, the most prevalent complement regulators and receptors include CLU, SERPING1, F2, CFH, CFI, and VTN. Significant alterations in complement proteins were observed in individuals with POAG compared to those with cataracts. Specifically, complement protein F2 was upregulated, while C8G, C6, and CFH were downregulated in POAG samples. Stratification of the samples by race and sex revealed distinct alterations of complement proteins in patients with POAG. In the African American cohort, five complement proteins (C4A, C4B, F2, C7, and C3) were upregulated in POAG compared to cataract patients. In the Caucasian cohort, eight complement proteins (C3, SERPING1, CFI, CLU, CFHR1, C8G, C6, and CFH) were downregulated in the POAG samples compared to the cataract samples. Within the male cohort, three complement proteins (CLU, C6, and CFH) were downregulated in POAG patients compared to those with cataracts. Whereas, within the female cohort, two complement proteins (C4B and F2) were upregulated and one (C8G) downregulated in the POAG samples when compared to cataracts. Discerning these changes in the AH complement protein profile will assist in the development of tailored therapies to modulate the complement system for managing ocular disorders. These insights may also lead to novel biomarkers for diagnosing and monitoring disease progression.

1. Introduction

The ocular environment exhibits a unique combination of immunosuppressive and anti-inflammatory characteristics referred to as ocular immune privilege [1,2]. Several mechanisms contribute to maintaining this privilege, including mucosal immunity [3,4], blood–ocular barriers [5,6,7,8], ocular parenchymal cells [9], and the secretion of regulatory molecules in the vitreous and aqueous humor [10,11]. However, disruption in any of these pathways can disturb the ocular immune privilege, leading to the development of ocular pathophysiological conditions [12,13,14,15,16].
The aqueous humor (AH) serves various vital functions, including the regulation of intraocular pressure (IOP), the removal of metabolic waste, and the supply of nutrients and oxygen to non-vascular ocular tissues [17]. The AH also contains a significant concentration of immunomodulatory molecules [17], including the prominent complement family [18].
Complement proteins are involved in various host defense and inflammatory responses, playing an essential role in immune modulation within the eye [19,20,21]. Previous studies have shown that alterations in complement proteins within the AH are associated with the pathogenesis of various ocular disorders, including primary open-angle glaucoma (POAG), uveitis, and macular degeneration [22,23,24]. Additionally, inhibiting components of the complement cascade have shown promise in preventing synaptic degeneration in experimental models of glaucoma [25,26].
The objective of this study is to investigate the presence of complement proteins in the AH of human subjects and examine their association with POAG pathogenesis. In this study, we quantified the levels of complement proteins in the AH of 258 subjects who underwent either glaucoma or cataract surgeries. Furthermore, we evaluated the association of these proteins with POAG, considering potential differences based on sex and race.

2. Materials and Methods

2.1. Sample Collection

Ethical approval for this study was obtained from the Institutional Review Board of Augusta University (IRB #611480), and written informed consent was acquired from all participants prior to sample collection. Subjects undergoing cataract or glaucoma surgery were included. During the surgical procedure, after making the initial corneal incision, ~60 μL AH was aspirated from the anterior chamber using a cortical cleaving hydrodissector (Beaver-Visitec International #585157). The samples were carefully collected in sterile tubes and immediately frozen at −80 °C. No additional ocular procedures or modifications were performed during the AH collection process. The study included 196 AH samples from cataract surgery patients and 62 AH samples from POAG patients, as outlined in Table 1. Additional patient information is available in Supplementary File S1.

2.2. Liquid Chromatography–Tandem Mass Spectrometry Analysis

The AH samples (60 μL) were subjected to lyophilization and then reconstituted in 30 μL of 8 M urea in 50 mM Tris-HCl (pH 8). Cysteine residues were reduced using 20 mM dithiothreitol and alkylated with 55 mM iodoacetamide. Subsequently, 240 μL of a 50 mM ammonium bicarbonate buffer was added to reduce the urea concentration to less than 1 mM. The protein concentration was determined using a Bradford assay kit (Pierce, Rockford, IL, USA) following the manufacturer’s instructions. Protein digestion was performed by adding trypsin at a 1:20 ratio (w/w) and incubating overnight at 37 °C.
The digested AH samples were purified using a C18 spin plate (Nest Group, Southborough, MA, USA), and the resulting peptides were separated using an Ultimate 3000 nano-UPLC system (Thermo Fisher Scientific, Waltham, MA, USA) and analyzed using an Orbitrap Fusion Tribrid mass spectrometer (Thermo Fisher Scientific, Waltham, MA, USA). A 6 μL portion of the reconstituted peptide mixture was trapped and washed on a Pepmap100 C18 trap (5 μm, 0.3 × 5 mm) at a flow rate of 20 μL/min using a solution of 2% acetonitrile in water with 0.1% formic acid for 10 min. The peptides were then separated on a Pepman100 RSLC C18 column (2.0 μm, 75 μm × 150 mm) using a gradient of 2% to 40% acetonitrile with 0.1% formic acid over 120 min (flow rate: 300 nL/min; column temperature: 40 °C). Eluted peptides were subjected to data-dependent acquisition in positive mode with the following settings: precursor scan in the Orbitrap MS analyzer at 120,000 FWHM from 300 to 1500 m/z, and MS/MS scans in top speed mode (2-s cycle time) using the ion-trap MS analyzer. Dynamic exclusion settings were applied (repeat count: 1; repeat duration: 15 s; exclusion duration: 30 s). Higher-energy C-trap dissociation (HCD) was employed as the fragmentation method with a normalized collision energy of 30%.

2.3. Protein Identification and Quantification

The raw MS data were processed using Proteome Discoverer software (v1.4; Thermo Fisher Scientific, Waltham, MA, USA) and analyzed with the SequestHT algorithm. The search was performed against the Uniprot-SwissProt human database, which contained 20,385 entries. The search parameters were set as follows: 10 ppm precursor ion tolerance and 0.6 Da product ion tolerance; static carbidomethylation (+57.021 Da) for cysteine; dynamic oxidation (+15.995 Da) for methionine; and dynamic phosphorylation (+79.966 Da) for serine, threonine, and tyrosine.
To validate peptide spectrum matches (PSMs), the Percolator peptide spectrum matching validator within the Proteome Discoverer software was utilized. Proteins with similar peptide compositions that could not be differentiated based on MS/MS analysis alone were grouped using parsimony principles. Spectrum counts (number of PSMs) and identities for each protein were then exported as a semi-quantitative measure of the relative protein levels detected in each AH sample.

2.4. Optical Coherence Tomography (OCT) and Heidelberg Retinal Tomography (HRT) Measurements

Retinal nerve fiber layer (RNFL) thickness was measured using SPECTRALIS Tracking Laser Tomography (Heidelberg Engineering, Heidelberg, Germany). This system captured a 24-line high-resolution radial scan, 3.5 mm in diameter, of the optic nerve head centered on Bruch’s membrane opening (BMO). The region between the BMO and the closest point on the internal limiting membrane was defined as the “neuroretinal rim”. Three circular scans centered on the optic nerve head, as delineated by the BMO, were used to determine RNFL thickness. The results were compared to a reference database of healthy eyes, adjusted for BMO size and age. The findings were presented in the Garway–Heath sector format, facilitating structural and functional correlations. In addition, the ganglion cell layer (GCL) and the macula were evaluated using multi-layer segmentation software, and the results were visualized through a GCL thickness map.
The Heidelberg Retinal Tomograph (Heidelberg Engineering, Heidelberg, Germany) was also employed for imaging the optic nerve head. Multiple 3D images were captured at different depths, providing a comprehensive representation of the optic nerve and surrounding retina. These images were combined to generate a 3D representation of the entire optic nerve, from which various stereometric parameters were calculated. These parameters include the cup shape measure, cup-to-disc area ratio, and rim volume. The cup shape measure quantifies the configuration of the cup, incorporating assessments of cup wall steepness and depth variation. In individuals without glaucomatous damage, this measure is generally negative. Conversely, glaucomatous eyes typically exhibit values that are less negative or positive [27]. The cup-to-disc area ratio assesses the extent of cupping relative to the area of the optic disc. In patients with uncontrolled glaucoma, this ratio tends to increase over time. Lastly, the rim area assesses the neuroretinal rim, which marks the boundary between the cup and the disc. Among patients with glaucoma, this metric is typically lower, indicating the degradation or loss of nerve fibers within the neuroretinal rim.

2.5. Statistical Analyses

Statistical analyses were conducted using the R project for Statistical Computing (version 3.6.3). The chi-square test and two-tailed t-test were used to compare the clinical characteristics of POAG and cataract patients. Prior to analysis, the peptide spectrum matching (PSM) values obtained from the LC-MS/MS analysis were quantile normalized, and the proportion of samples in which each protein was detected was determined. Disease-specific differences in complement protein levels were assessed using a negative binomial regression model. Spearman’s correlation coefficients were employed to evaluate the correlations between complement proteins and clinical parameters, such as OCT and HRT measures. The significance level was set at p < 0.05.

3. Results

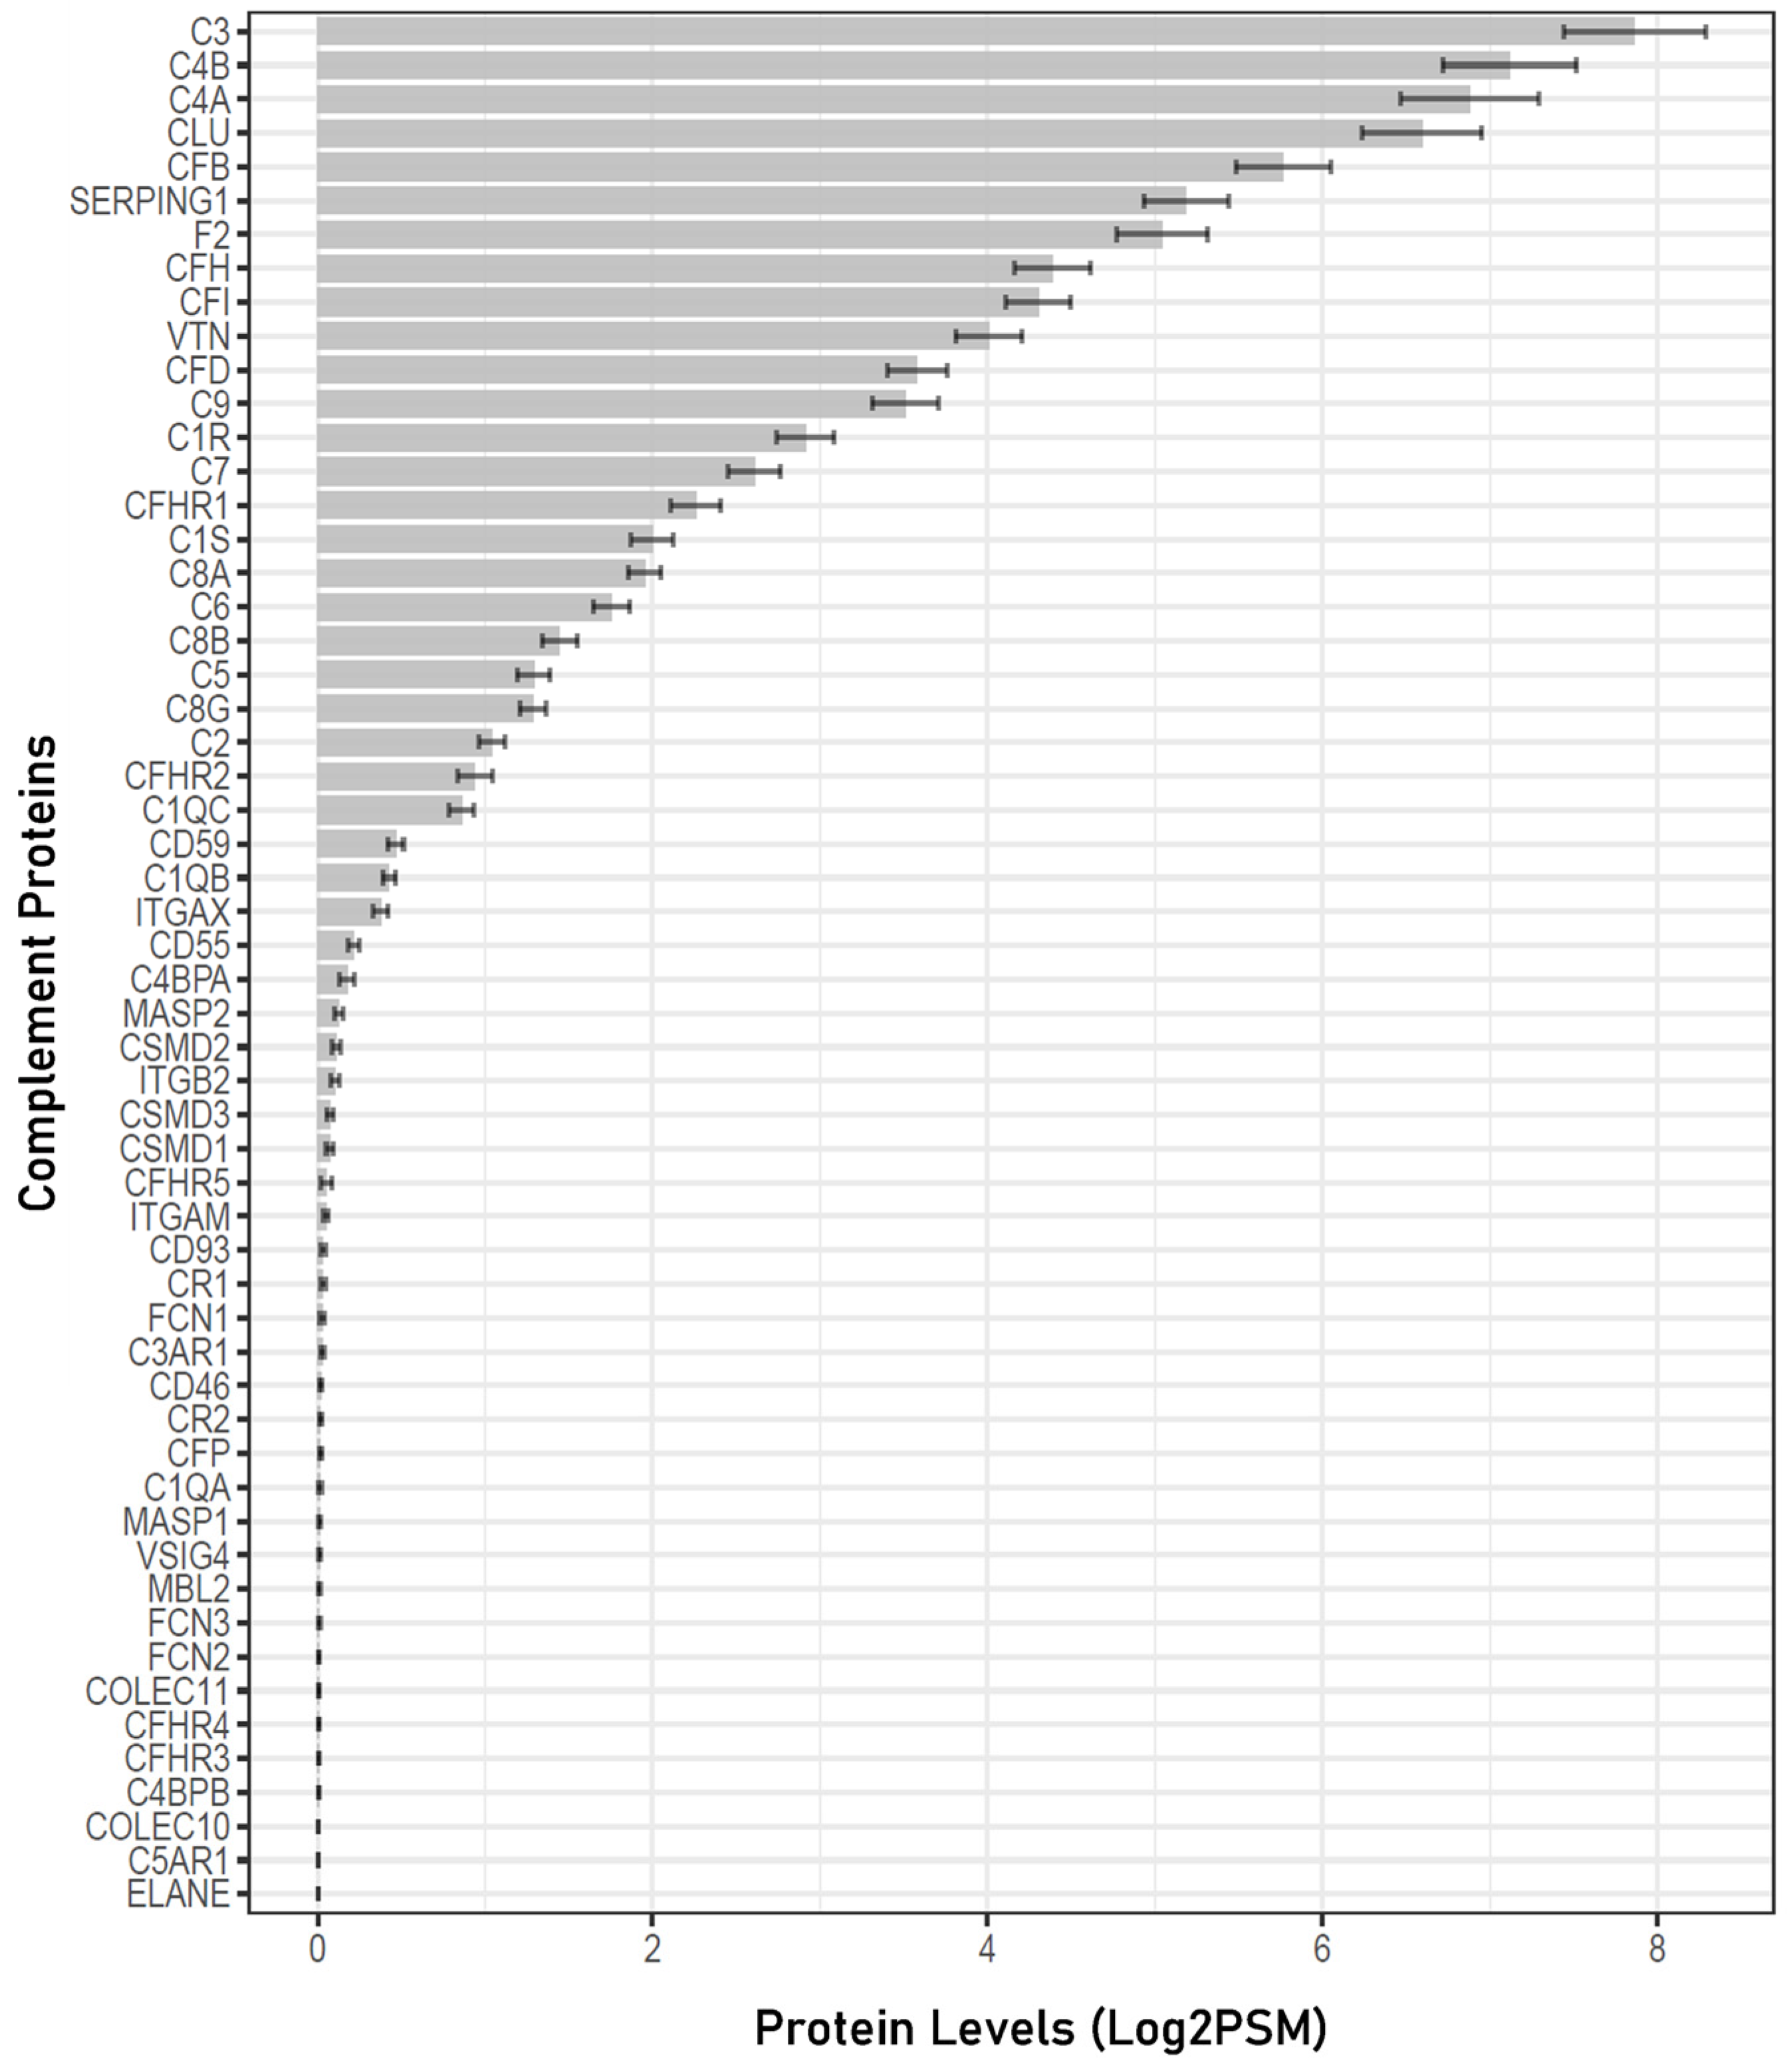
3.1. Complement Proteins Detected in the Human Aqueous Humor

According to the HUGO Gene Nomenclature Committee, there are a total of 56 proteins that belong to the complement system group, including 27 complement system activation components and 29 complement system regulators and receptors (https://www.genenames.org; accessed on 17 July 2023) [28]. In the 258 human aqueous humor samples analyzed, 32 out of the 56 complement proteins known in the human proteome were detected (Figure 1). Complete data files are available in Supplementary File S2.
The mean PSM values and the proportion of samples in which each specific complement protein was detected are provided in Table 2. Among these proteins, 22 were detected in more than 50% of the AH samples, while 6 were detected in all 258 samples. The most abundant complement proteins identified were as follows, listed with their respective mean PSM values ± standard deviation (SD): complement C3 (227.59 ± 68.1), complement C4B (134.07 ± 64.43), complement C4A (112.39 ± 77.95), clusterin (CLU) (95.22 ± 40.97), and complement factor B (CFB) (52.12 ± 13.43) (Table 2).

3.2. Alterations in Aqueous Humor Complement Proteins Associated with POAG

The specific changes in complement proteins within the aqueous humor of POAG patients were examined (Figure 2; Table 3). The fold change (FC) values indicate the alterations in protein levels observed in the POAG group (n = 62) compared to the cataract group (n = 196). The results revealed decreased levels of complement component C8 gamma chain (C8G) (FC = 0.83, p = 0.026), complement C6 (FC = 0.81, p = 0.032), and complement factor H (CFH) (FC = 0.77, p = 0.024) in POAG subjects relative to those with cataracts. Conversely, the expression of prothrombin (F2) (FC = 1.19, p = 0.046) was significantly higher in the POAG group compared to the cataract cohort.

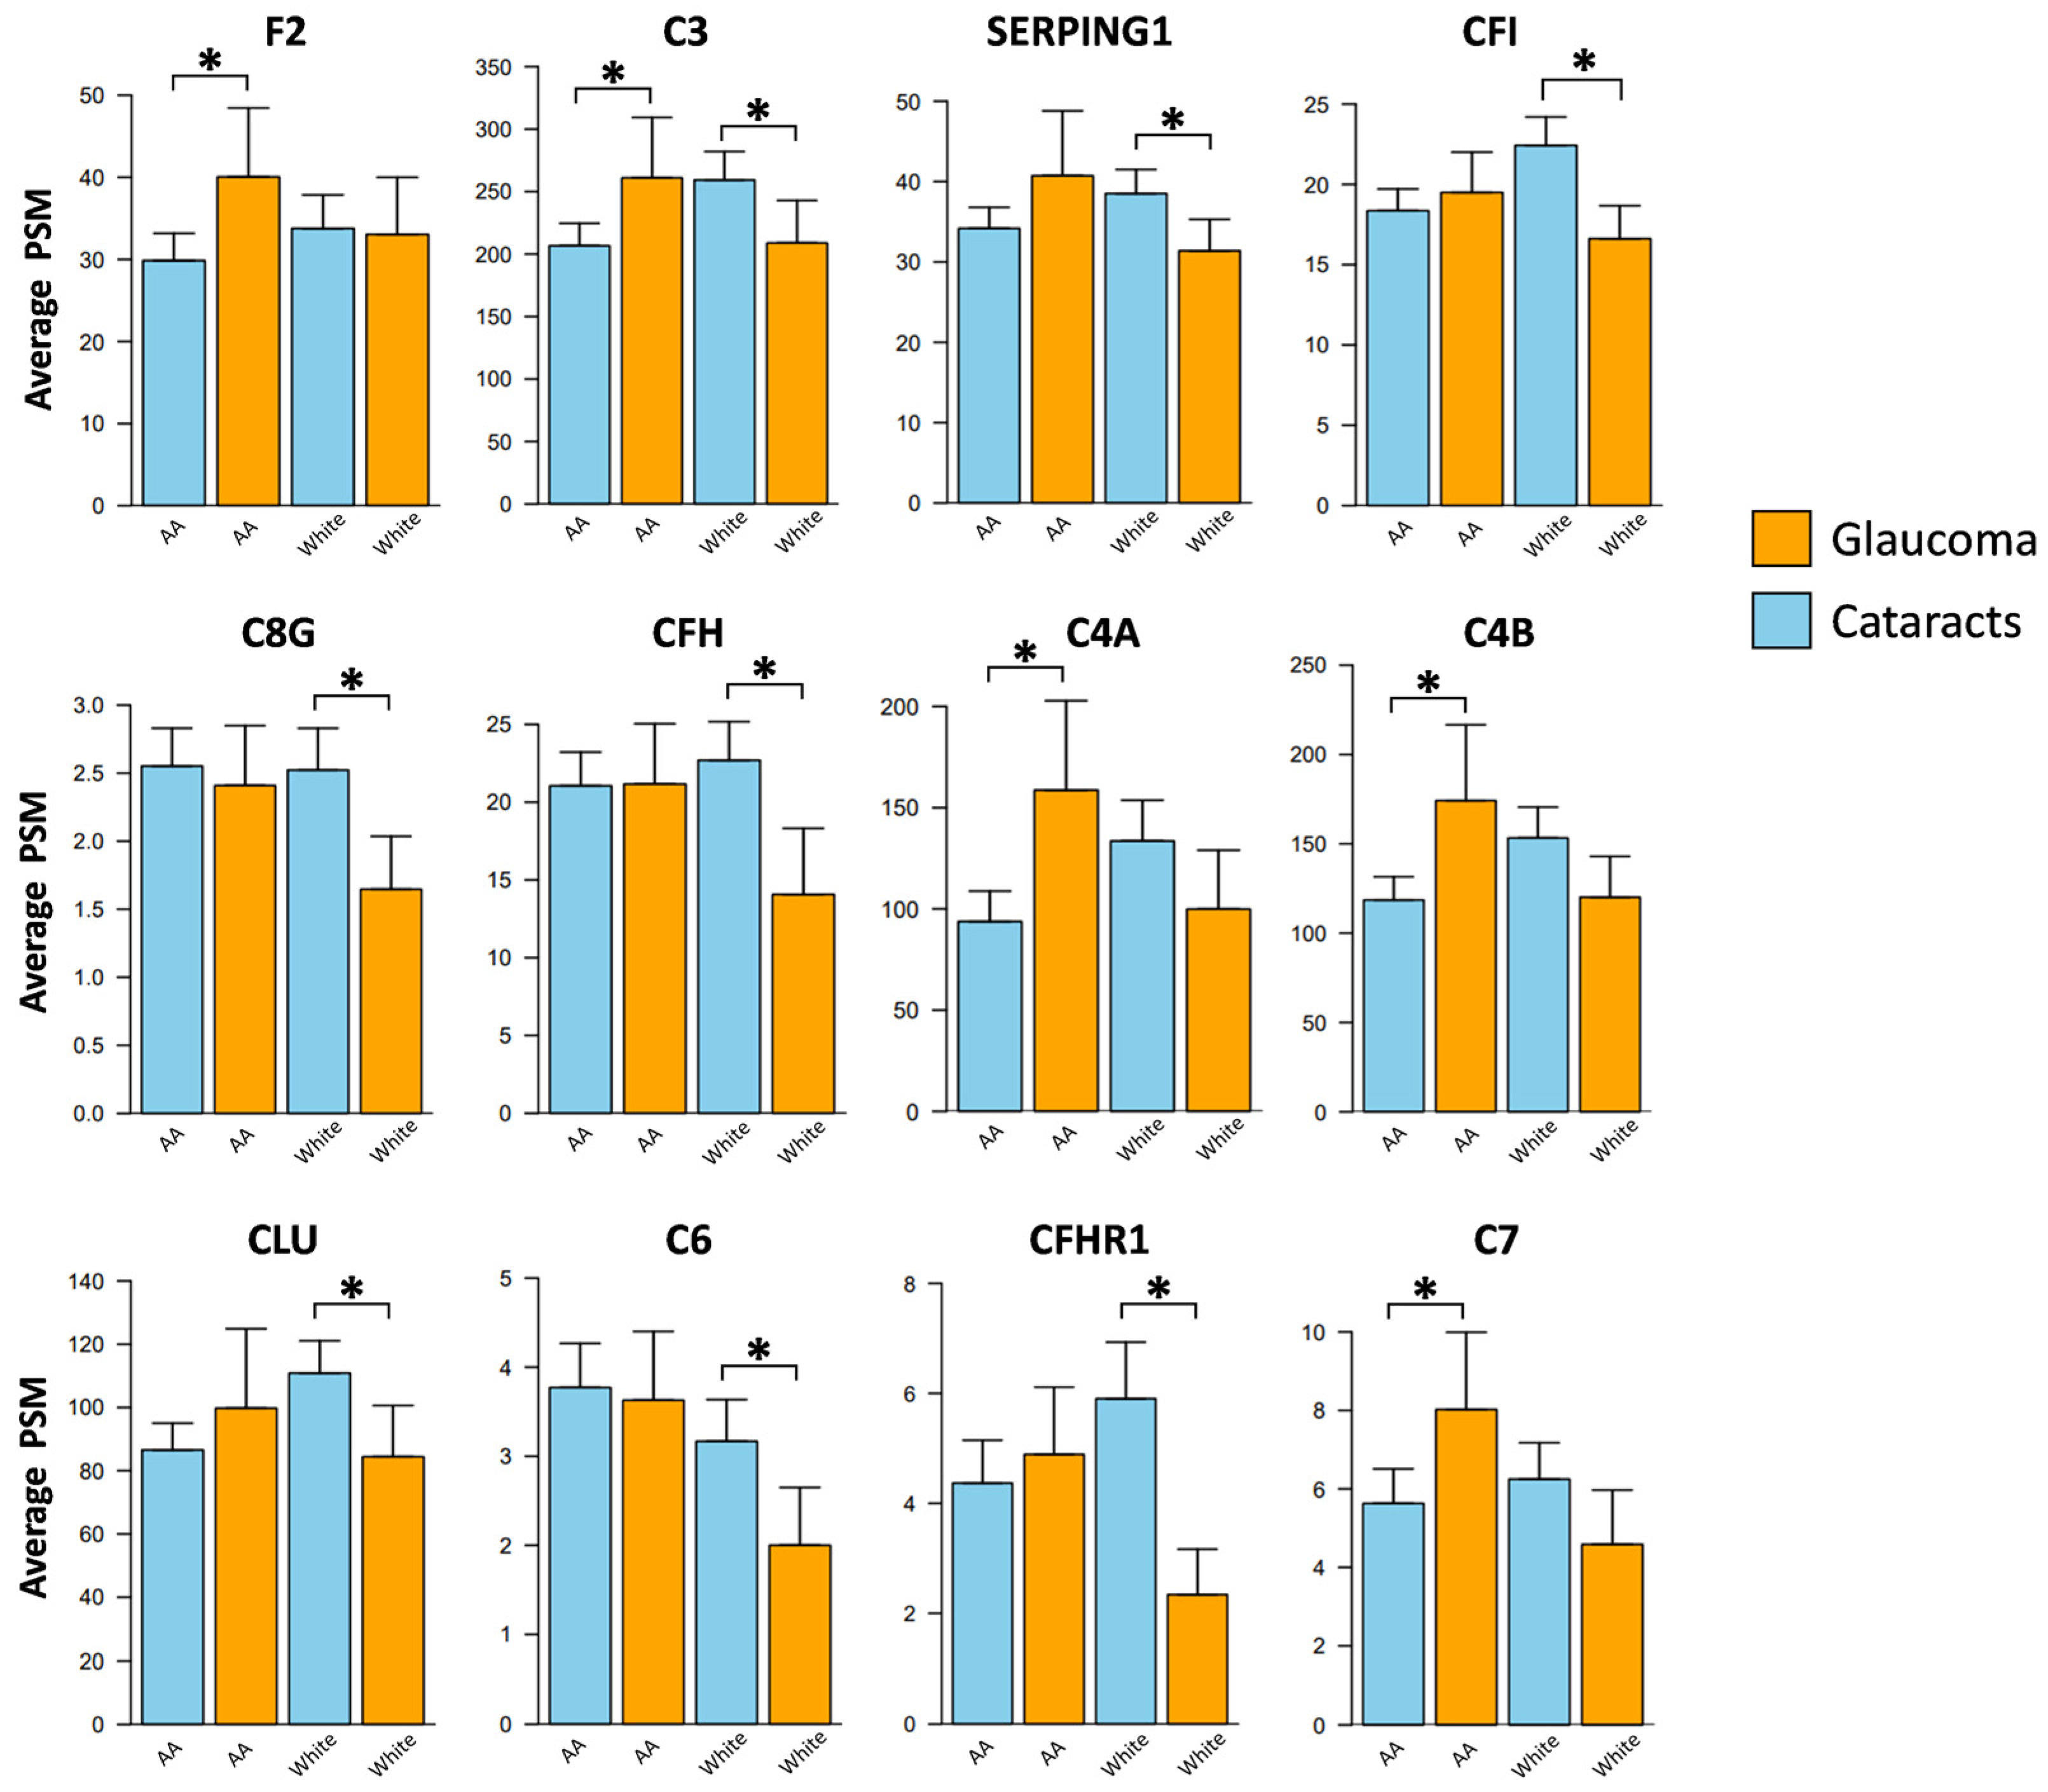
3.3. Race-Specific Alterations in Aqueous Humor Complement Proteins Associated with POAG

After stratifying the samples based on race, eleven complement proteins exhibited significant alterations in POAG patients compared to cataract subjects (Figure 3; Table 3). In African Americans with POAG, five complement proteins were significantly elevated in the AH samples compared to those with cataracts: C4A (FC = 2.33, p = 0.027), C4B (FC = 1.69, p = 0.015), complement component C7 (FC = 1.38, p = 0.025), F2 (FC = 1.31, p = 0.023), and C3 (FC = 1.21, p = 0.027). No proteins were found significantly decreased in African American AH samples with POAG compared to cataracts.
In the Caucasian cohort, eight complement proteins were found to be significantly lower in the POAG group compared to cataract subjects: C3 (FC = 0.82, p = 0.038), plasma protease C1 inhibitor (SERPING1) (FC = 0.83, p = 0.015), complement factor I (CFI) (FC = 0.77, p = 0.007), CLU (FC = 0.77, p = 0.021), complement factor H-related protein 1 (CFHR1) (FC = 0.48, p = 0.002), C8G (FC = 0.67, p = 0.004), C6 (FC = 0.63, p = 0.002), and CFH (FC = 0.57, p = 0.003). Interestingly, within the Caucasian cohort, no complement proteins were found to be elevated in glaucoma samples compared to cataracts. These race-specific differences in complement proteins between POAG and cataracts are shown in Figure 3.

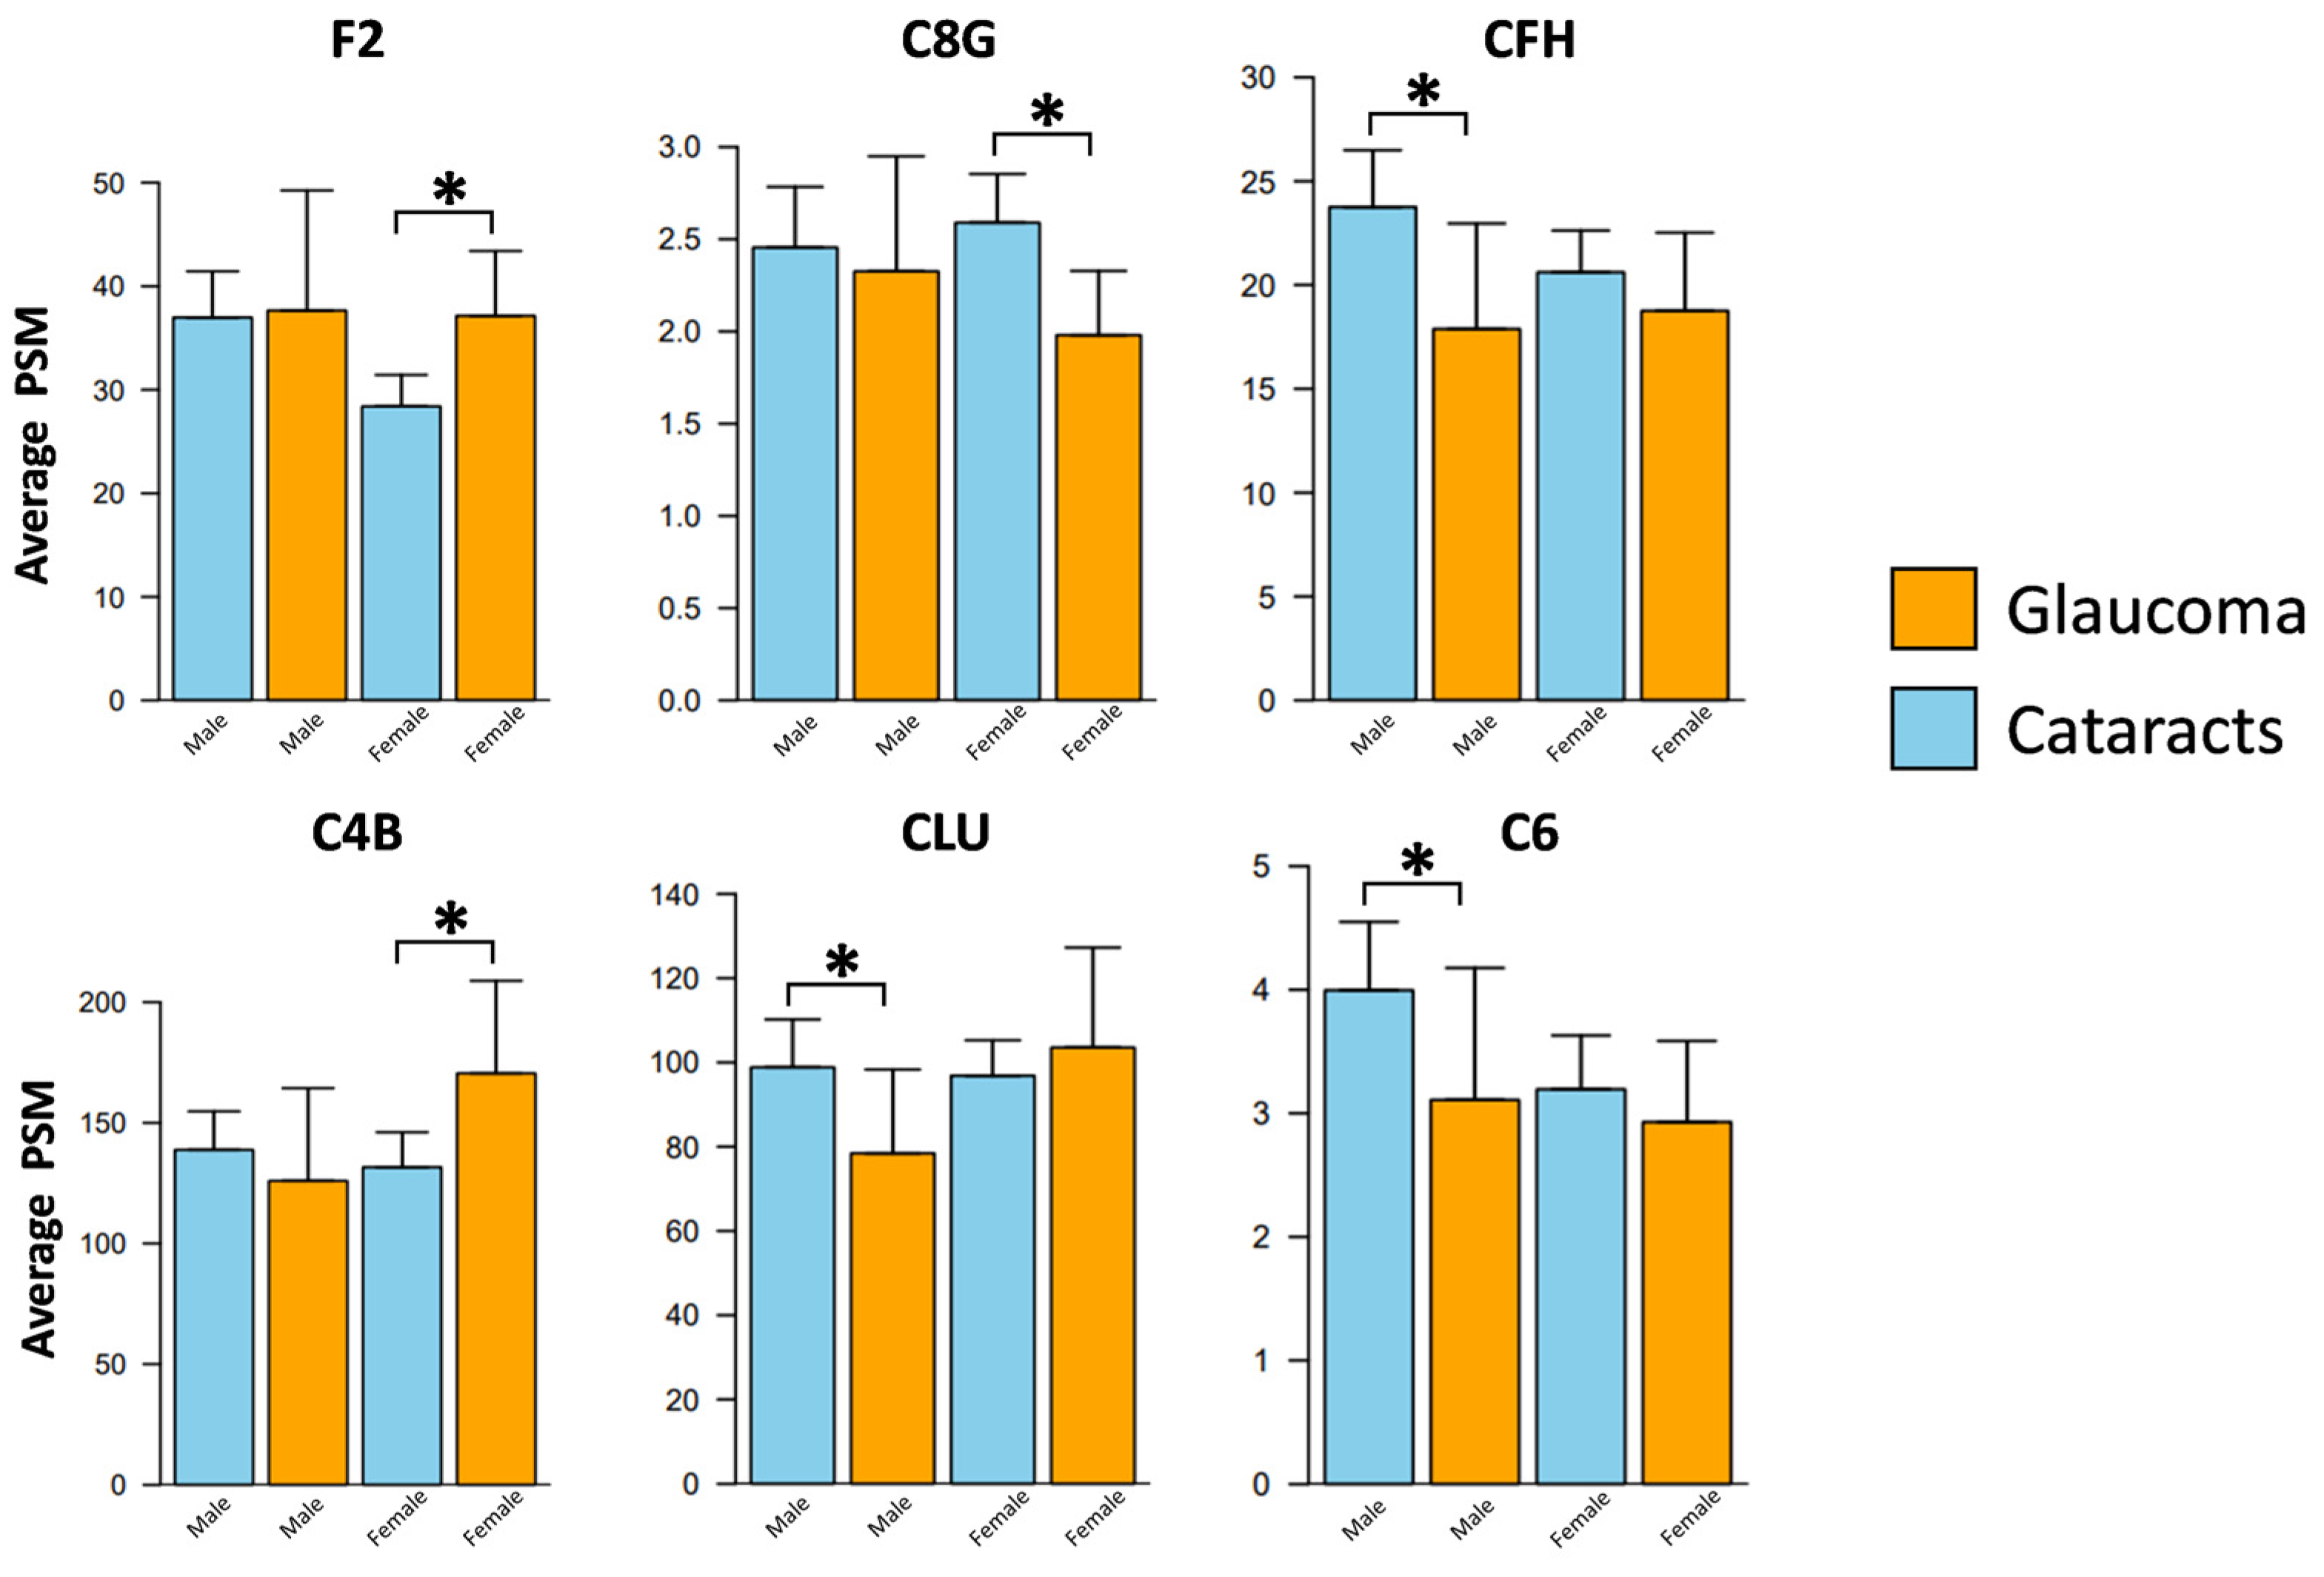
3.4. Sex-Specific Alterations in the Aqueous Humor Complement Proteins Associated with POAG

After stratifying the samples by sex, we identified significant differences in six complement proteins between the two patient groups (Figure 4; Table 4). Among males, the POAG group exhibited significant decreases in three complement proteins compared to the cataract group: CLU (FC = 0.78, p = 0.046), C6 (FC = 0.67, p = 0.009), and CFH (FC = 0.63, p = 0.015). Conversely, no significant increases in complement proteins were observed in the POAG group relative to cataracts within the male cohort. In contrast, within the female samples, two complement proteins showed significant upregulation in the POAG group compared to cataracts: C4B (FC = 1.56, p = 0.030) and F2 (FC = 1.37, p = 0.007). Additionally, C8G (FC = 0.78, p = 0.025) exhibited downregulation in the POAG group compared to cataracts (Figure 4).

3.5. Alterations in Complement Proteins Correlated with Pattern Standard Deviation (PSD) and Visual Field Index (VFI)

Two glaucoma metrics, PSD and VFI, have been correlated with disease severity. To determine if any complement proteins within the AH were associated with these metrics, a correlation analysis was conducted within the POAG cohort (Table 5). The majority of the correlation coefficients (R) did not exceed the absolute value of 0.5, indicating that the correlations, whether positive or negative, were not strong (|R| > 0.5) [29]. Seven complement proteins demonstrated a significant, positive correlation with PSD, with |R| values ranging from 0.33 to 0.47. These proteins include C5 (R = 0.47, p = 0.002), C7 (R = 0.43, p = 0.006), complement C1R (R = 0.39, p = 0.014), C4B (R = 0.38, p = 0.019), complement component C8 alpha chain (C8A) (R = 0.37, p = 0.020), F2 (R = 0.36, p = 0.024), and C4A (R = 0.33, p = 0.038). For the VFI, seven complement proteins including C7 (R = −0.64, p = 0.0006), C8G (R = −0.54, p = 0.006), C1R (R = −0.52, p = 0.008), F2 (R = −0.49, p = 0.014), C4B (R = −0.46, p = 0.020), C4A (R = −0.44, p = 0.027), and C9 (R = −0.44, p = 0.027) demonstrated a significant negative correlation.

3.6. Complement Proteins Correlated with Ocular Stereometric Heidelberg Retinal Tomography (HRT) Parameters

Complement proteins were examined in relation to ocular stereometric HRT parameters. Moderate correlations (0.5 > |R| ≥ 0.3) and weak correlations (0.30 > |R| ≥ 0.20) were observed between several complement proteins and specific stereometric patterns, including cup area, cup volume, cup depth, disc area, and cup-to-disc (CD) ratio (Table 6). Specifically, six complement proteins (CFI, VTN, CLU, C3, CFH, and CFHR1) exhibited negative correlations with cup area. The |R| values for these proteins ranged from 0.17 to 0.33. For cup volume, nine complement proteins (CFI, VTN, C3, CLU, CFH, CFHR1, C4B, C2, and F2) demonstrated negative correlations, with |R| values ranging from 0.16 to 0.33. Regarding maximum cup depth, eight complement proteins (CFI, VTN, C3, CFH, F2, CFHR1, C5, and C8B) were found to be negatively correlated, with |R| values ranging from 0.17 to 0.27. Mean cup depth found four proteins (CFI, CFH, C3, and CFHR1) with significant correction. Of these, all displayed negative R values, with |R| values varying from 0.17 to 0.23. For the disc area, four complement proteins (CFI, VTN, CFHR1, and C3) demonstrated a negative correlation with the metric, and |R| values ranged from 0.17 to 0.19. Furthermore, six complement proteins (CFI, CLU, CFH, VTN, C3, and CFHR1) exhibited a negative correlation with CD area ratio, with |R| values varying from 0.16 to 0.28.

4. Discussion

Complement proteins play a critical role in immune responses and inflammatory processes, with their dysregulation being linked to various ocular disorders, including glaucoma. This study provides a comprehensive analysis of the complement proteins present in the human AH. In addition, we explored the relationship between AH complement protein profiles and primary open-angle glaucoma (POAG). Liquid chromatography–tandem mass spectrometry (LC-MS/MS) was utilized to both identify and quantify complement proteins in the AH samples collected from both POAG and cataract patients.
The findings reveal significant changes in complement proteins among POAG patients compared to those with cataracts. Furthermore, these alterations exhibit variations based on race and sex. Gaining insight into complement protein profiles in the AH will assist us in the development of targeted therapies to effectively modulate the complement system for treating ocular disorders and establish novel biomarkers for diagnosing and monitoring disease progression.
We successfully identified a total of 32 complement proteins within the AH samples collected from 62 POAG and 196 cataract patients. Twenty-two were notably abundant, appearing in more than 50% of the AH samples and corroborating previous findings [30,31]. Proteomic analysis revealed significant downregulation of three complement proteins, including C6, C8G, and CFH, while one protein, F2, was upregulated in POAG subjects compared to cataract controls.
Complement proteins trigger the formation of the terminal membrane attack complex, (MAC), which plays a crucial role in targeting pathogens and regulating immune responses [32,33]. The downregulation of C6 in the AH from POAG subjects is intriguing, as past reports have found upregulated MAC components, such as C6, in human and mouse glaucomatous retinas [34]. Lower C6 levels may be the body’s attempt to regulate or compensate for increased oxidative stress, apoptosis, or dysregulation in immune responses. Moreover, upon binding to the α-chain of C5b, C6 gains the capacity to interact with cell membranes [35]. The greater activation of the complement cascades in POAG patients might lead to the conversation of C6 and subsequent association to target cell membranes, resulting in reduced levels within the measured AH. Alternatively, recent studies highlighting independent complement gene transcription and protein synthesis within retinal cells offer an alternative approach for decreased AH C6 levels [36,37,38]. The elevated cell death in the retinal cells of POAG patients could contribute to a decrease in C6 levels in the surrounding environment. Nevertheless, investigating the origins of complement proteins within the AH and their correlation to retinal protein profiles could provide further insight.
Another component of the MAC, C8G [39], was found significantly downregulated in AH from POAG subjects compared to cataracts. Though the role of C8G outside of MAC formation is limited, one study found C8 subunit deficiency associated with recurrent Neisserial bacterial infections in humans [40]. Also, recent studies have shown the neuroprotective effects of C8G and its anti-inflammatory properties within the brain, where the upregulation of C8G acts as an antagonist of microglial S1PR2, resulting in the attenuation of neuroinflammation in mice models [41,42,43]. A decrease in C8G levels in the AH of POAG subjects could signal impairment in anti-inflammatory pathways and increased risk for infection compared to non-glaucoma individuals.
As an essential regulator, CFH indirectly inhibits complement pathway elements like C3b, C3 convertase, and subsequently, MAC formation [44,45]. Prior studies have reported the downregulation of CFH in retinas from glaucomatous patients and mice exposed to oxidative stress [34,46,47]. The observed reduction in CFH levels in the retina of glaucoma patients aligns with our findings and may suggest a potential AH biomarker for elevated oxidative stress and POAG. However, it is notable that decreased CFH levels in the AH of the POAG patients coincide with a decreased MAC component, C6. As CFH mainly inhibits the alternative pathway [48], a corresponding decrease in C6 may signal downstream pathway dysfunction or other active mechanisms hindering C6 accumulation. This may also suggest a non-MAC-associated role for CFH in POAG. However, further studies on the regulatory influence of CFH on MAC regulation and POAG in the AH are needed.
In our study, we also found elevated prothrombin (F2) in POAG aqueous humor samples. It is primarily recognized for its role in the coagulation cascade [49]. The pathogenesis of glaucoma involves vascular dysregulation and the associated oxidative stress [43,50]. Changes in the coagulation system, including increased F2 levels, could contribute to microvascular abnormalities or blood flow changes in the optic nerve head and retina that may ultimately contribute to retinal cell damage in POAG patients. Consistent with our findings of elevated F2 levels in the AH samples, another study reported an increase in F2 concentrations in the venous blood of POAG patients when compared to the controls and normal pressure glaucoma patients [51], which might suggest a potential involvement of F2 in the pathophysiology of POAG.
Interestingly, complement C3 was the highest detected protein in our AH samples. Furthermore, C3 levels increased 1.21-fold in African American POAG patients compared to those with cataracts, whereas decreased levels were detected in Caucasians with POAG, suggesting that there is perhaps a race-dependent role of the alternative complement pathway in glaucoma. Several studies have consistently reported a higher prevalence of glaucoma within the African American population, although the specific factors contributing to this disparity remain unclear [52]. Upregulated C3 levels in the AH of African Americans could be one of the factors posing higher risks for glaucoma severity, with subsequent complement cascade activation triggering the proteolytic cleavage of C3 into C3a and C4b. C3a and C5a are anaphylatoxins that have been linked to glaucoma pathogenesis [53,54,55] and the progression of other ocular diseases, like AMD [56]. As potential inflammatory mediators, these molecules can target a broad range of immune and non-immune cells, causing an increase in the permeability of small blood vessels, oxidative bursts, and the release of histamine [57]. Controlling the regulation of these molecules offers the potential to reduce the severity of glaucoma, and anti-C3a and anti-C5a drugs are currently in clinical trials as treatment options for late-stage AMD [58].
Furthermore, the findings from our study indicate that four additional complement proteins, C4A, C4B, F2, and C7, were significantly elevated in the African American population with glaucoma compared to those with cataracts. However, eight proteins (C6, C8G, CFH, C3, CFHR1, CFI, CLU, and SERPING1) were significantly downregulated in Caucasian glaucoma subjects. These findings indicate race-specific differences in complement protein profiles associated with glaucoma, suggesting potential variations in the underlying pathogenesis and immune response between the two racial groups. Cleavage of C4 into C4A and C4B is known to generate classical pathway C3 convertase [59,60], an enzyme that cleaves C3 into C3A and C3B, leading to a potential elevation in pro-inflammatory pathways. The increased levels of AH C4A and C4B in African American POAG subjects compared to those with cataracts emphasize the potential involvement of the complement cascade in the accelerated onset and progression of glaucoma within this demographic group.
Within the Caucasian cohort, several regulatory proteins, specifically CFI and CLU, were also downregulated in POAG. CFI is a serine protease that inhibits the complement pathways through the degradation of activated complement proteins C3A and C4B [61]. CLU has been investigated for its potential neuroprotective effects [62] and acts as an extracellular molecular chaperone [63,64], where it can capture and clear soluble precursors to the membrane attack complex. With its involvement in the removal of potentially toxic protein oligomers, downregulation in POAG patients compared to the controls may contribute to the buildup of inflammatory molecules within the ocular environment.
Further, in our study, we found sex-specific differences, with the levels of CLU, C6, and CFH proteins significantly decreased in males with POAG compared to the controls. As an inhibitor of MAC formation, reduced CLU in males could render retinal neurons more vulnerable to complement-mediated inflammation and cell damage. Further, decreased levels of CFH might suggest a compromised regulatory control over the alternative complement pathway. Complement proteins C4B and F2 increased while C8G decreased in the AH of female POAG subjects. Increased C4B levels may signify heightened activation of the classical and lectin pathways of the complement system, while increased F2 in the AH may hint at broader implications in the vasculature of the eye [65]. A previous study has shown that inhibition of the classical pathway of the complement cascade prevents early dendritic and synaptic degeneration in mouse and rat models of glaucoma [66].
While these findings expand our understandings of complement proteins in the AH and their relation to POAG, it should be noted that there were several limitations to our study. We were unable to compare African American males/females to Caucasian males/females with POAG and cataracts due to limited statistical power. Another limitation is the potential influence of anti-glaucoma therapy on the AH complement profile. Given that certain anti-glaucoma treatments have been reported to induce alterations in the dynamics of AH production [67], there is potential for these therapies to influence the abundance and activity of complement proteins within the ocular environment. However, since most patients undergoing glaucoma surgery are already receiving anti-glaucoma therapy, the absence of a substantial treatment-naïve cohort constrained our statistical power. Therefore, a detailed examination focused on the interplay between anti-glaucoma therapies and complement protein expression within the AH is necessary for a more complete understanding. Furthermore, while alterations in the complement composition of the AH may be associated with POAG, more studies of the optical nerve and retinal tissues in relation to the AH are needed to better understand the molecular mechanisms regulating POAG.

5. Conclusions

In summary, this study uses modern LC-MS/MS analyses to advance our current knowledge of aqueous humor-associated complement proteins in relation to POAG. Our results provide insights into the relation between AH’s complement profile and its differential expression within race, sex, and glaucoma subgroups. Further investigations are needed to unveil the precise contribution of the complement system to glaucoma disease pathology and its impact on ocular susceptibility. Future research incorporating complement proteins in ocular diseases will help advance personalized treatment strategies, ultimately improving glaucoma management and therapies.

Supplementary Materials

The following supporting information can be downloaded at https://www.mdpi.com/article/10.3390/jpm13091400/s1, Supplementary File S1: Patient sample information and associated phenotypic data. Supplementary File S2: Normalized protein levels.

Author Contributions

Conceptualization, A.V., S.W.M., A.S. and S.S.; methodology, G.J. and W.Z.; software, T.J.L.; formal analysis, T.J.L.; investigation, J.A., G.J., K.E.B., M.T.-H., L.U. and A.J.E.; resources, K.E.B., L.U., M.T.-H., A.J.E., S.S. and A.S.; data curation, J.A., G.J. and T.J.L.; writing—original draft preparation, A.V. and S.W.M.; writing—review and editing, J.A., G.J., M.T.-H. and S.S.; visualization, A.V., S.W.M. and J.A.; supervision, A.S.; project administration, A.S.; funding acquisition, A.S. All authors have read and agreed to the published version of the manuscript.

Funding

This research was funded by the National Institutes of Health and the National Eye Institute (Bethesda, MD, USA) grant No. R01 EY029728, awarded to Ashok Sharma, and grant No. P30 EY031631, the Center Core Grant for Vision Research.

Institutional Review Board Statement

This study was conducted in accordance with the Declaration of Helsinki and was approved by the Institutional Review Board of Augusta University (IRB Project ID No. 611480; approval date: 19 April 2019).

Informed Consent Statement

Informed consent was obtained from all subjects involved in this study.

Data Availability Statement

All raw data are available in the Supplementary Materials.

Acknowledgments

We would like to express our gratitude to Kapil Bharti, Director of the National Eye Institute (NEI) Intramural Research Program, for his insightful comments and thorough edits.

Conflicts of Interest

The authors declare no conflict of interest.

References

  1. Benhar, I.; London, A.; Schwartz, M. The privileged immunity of immune privileged organs: The case of the eye. Front. Immunol. 2012, 3, 296. [Google Scholar] [CrossRef] [PubMed]
  2. Streilein, J.W. Ocular immune privilege: Therapeutic opportunities from an experiment of nature. Nat. Rev. Immunol. 2003, 3, 879–889. [Google Scholar] [CrossRef] [PubMed]
  3. McDermott, A.M. Antimicrobial compounds in tears. Exp. Eye Res. 2013, 117, 53–61. [Google Scholar] [CrossRef] [PubMed]
  4. de Paiva, C.S.; Leger, A.J.S.; Caspi, R.R. Mucosal immunology of the ocular surface. Mucosal Immunol. 2022, 15, 1143–1157. [Google Scholar] [CrossRef] [PubMed]
  5. Crane, I.J.; Liversidge, J. Mechanisms of leukocyte migration across the blood–retina barrier. In Seminars in Immunopathology; Springer: Berlin/Heidelberg, Germany, 2008; pp. 165–177. [Google Scholar]
  6. Chen, M.; Luo, C.; Zhao, J.; Devarajan, G.; Xu, H. Immune regulation in the aging retina. Prog. Retin. Eye Res. 2019, 69, 159–172. [Google Scholar] [CrossRef]
  7. Freddo, T.F. A contemporary concept of the blood–aqueous barrier. Prog. Retin. Eye Res. 2013, 32, 181–195. [Google Scholar] [CrossRef]
  8. Katamay, R.; Nussenblatt, R.B. Blood–retinal barrier, immune privilege, and autoimmunity. Retina 2013, 579–589. [Google Scholar]
  9. Keino, H.; Horie, S.; Sugita, S. Immune privilege and eye-derived T-regulatory cells. J. Immunol. Res. 2018, 2018, 1679197. [Google Scholar] [CrossRef]
  10. Taylor, A.W. Ocular immunosuppressive microenvironment. Immune Response Eye 2007, 92, 71–85. [Google Scholar]
  11. Sonoda, K.H.; Sakamoto, T.; Qiao, H.; Hisatomi, T.; Oshima, T.; Tsutsumi-Miyahara, C.; Exley, M.; Balk, S.P.; Taniguchi, M.; Ishibashi, T. The analysis of systemic tolerance elicited by antigen inoculation into the vitreous cavity: Vitreous cavity-associated immune deviation. Immunology 2005, 116, 390–399. [Google Scholar] [CrossRef]
  12. Williams, P.A.; Braine, C.E.; Kizhatil, K.; Foxworth, N.E.; Tolman, N.G.; Harder, J.M.; Scott, R.A.; Sousa, G.L.; Panitch, A.; Howell, G.R. Inhibition of monocyte-like cell extravasation protects from neurodegeneration in DBA/2J glaucoma. Mol. Neurodegener. 2019, 14, 6. [Google Scholar] [CrossRef]
  13. Mangan, B.G.; Al-Yahya, K.; Chen, C.T.; Gionfriddo, J.R.; Powell, C.C.; Dubielzig, R.R.; Ehrhart, E.J.; Madl, J.E. Retinal pigment epithelial damage, breakdown of the blood–retinal barrier, and retinal inflammation in dogs with primary glaucoma. Vet. Ophthalmol. 2007, 10, 117–124. [Google Scholar] [CrossRef] [PubMed]
  14. Duh, E.J.; Sun, J.K.; Stitt, A.W. Diabetic retinopathy: Current understanding, mechanisms, and treatment strategies. JCI Insight 2017, 2, e93751. [Google Scholar] [CrossRef] [PubMed]
  15. Wang, W.; Lo, A.C. Diabetic retinopathy: Pathophysiology and treatments. Int. J. Mol. Sci. 2018, 19, 1816. [Google Scholar] [CrossRef] [PubMed]
  16. Klaassen, I.; Van Noorden, C.J.; Schlingemann, R.O. Molecular basis of the inner blood-retinal barrier and its breakdown in diabetic macular edema and other pathological conditions. Prog. Retin. Eye Res. 2013, 34, 19–48. [Google Scholar] [CrossRef] [PubMed]
  17. Kodeboyina, S.K.; Lee, T.J.; Churchwell, L.; Ulrich, L.; Bollinger, K.; Bogorad, D.; Estes, A.; Zhi, W.; Sharma, S.; Sharma, A. The Constitutive Proteome of Human Aqueous Humor and Race Specific Alterations. Proteomes 2020, 8, 34. [Google Scholar] [CrossRef]
  18. Altay, L.; Sitnilska, V.; Schick, T.; Widmer, G.; Duchateau-Nguyen, G.; Piraino, P.; Jayagopal, A.; Drawnel, F.; Fauser, S. Early local activation of complement in aqueous humour of patients with age-related macular degeneration. Eye 2019, 33, 1859–1864. [Google Scholar] [CrossRef] [PubMed]
  19. Janeway, C.A., Jr.; Travers, P.; Walport, M.; Shlomchik, M.J. The complement system and innate immunity. In Immunobiology: The Immune System in Health and Disease, 5th ed.; Garland Science: New York, NY, USA, 2001. [Google Scholar]
  20. Bora, N.S.; Jha, P.; Bora, P.S. The role of complement in ocular pathology. In Seminars in Immunopathology; Springer: Berlin/Heidelberg, Germany, 2008; pp. 85–95. [Google Scholar]
  21. Keir, L.S.; Firth, R.; Aponik, L.; Feitelberg, D.; Sakimoto, S.; Aguilar, E.; Welsh, G.I.; Richards, A.; Usui, Y.; Satchell, S.C.; et al. VEGF regulates local inhibitory complement proteins in the eye and kidney. J. Clin. Investig. 2017, 127, 199–214. [Google Scholar] [CrossRef]
  22. Botling Taube, A.; Konzer, A.; Alm, A.; Bergquist, J. Proteomic analysis of the aqueous humour in eyes with pseudoexfoliation syndrome. Br. J. Ophthalmol. 2019, 103, 1190–1194. [Google Scholar] [CrossRef]
  23. Yu, M.; Xie, F.; Liu, X.; Sun, H.; Guo, Z.; Liu, X.; Li, W.; Sun, W.; Wang, Y.; He, C. Proteomic Study of Aqueous Humor and Its Application in the Treatment of Neovascular Glaucoma. Front. Mol. Biosci. 2020, 7, 587677. [Google Scholar] [CrossRef]
  24. Schick, T.; Steinhauer, M.; Aslanidis, A.; Altay, L.; Karlstetter, M.; Langmann, T.; Kirschfink, M.; Fauser, S. Local complement activation in aqueous humor in patients with age-related macular degeneration. Eye 2017, 31, 810–813. [Google Scholar] [CrossRef] [PubMed]
  25. Howell, G.R.; Macalinao, D.G.; Sousa, G.L.; Walden, M.; Soto, I.; Kneeland, S.C.; Barbay, J.M.; King, B.L.; Marchant, J.K.; Hibbs, M. Molecular clustering identifies complement and endothelin induction as early events in a mouse model of glaucoma. J. Clin. Investig. 2011, 121, 1429–1444. [Google Scholar] [CrossRef] [PubMed]
  26. Gassel, C.J.; Reinehr, S.; Gomes, S.C.; Dick, H.B.; Joachim, S.C. Preservation of optic nerve structure by complement inhibition in experimental glaucoma. Cell Tissue Res. 2020, 382, 293–306. [Google Scholar] [CrossRef] [PubMed]
  27. Salgarello, T.; Colotto, A.; Falsini, B.; Buzzonetti, L.; Cesari, L.; Iarossi, G.; Scullica, L. Correlation of pattern electroretinogram with optic disc cup shape in ocular hypertension. Investig. Ophthalmol. Vis. Sci. 1999, 40, 1989–1997. [Google Scholar]
  28. Eyre, T.A.; Ducluzeau, F.; Sneddon, T.P.; Povey, S.; Bruford, E.A.; Lush, M.J. The HUGO gene nomenclature database, 2006 updates. Nucleic Acids Res. 2006, 34, D319–D321. [Google Scholar] [CrossRef] [PubMed]
  29. Akoglu, H. User’s guide to correlation coefficients. Turk. J. Emerg. Med. 2018, 18, 91–93. [Google Scholar] [CrossRef]
  30. Chowdhury, U.R.; Madden, B.J.; Charlesworth, M.C.; Fautsch, M.P. Proteome analysis of human aqueous humor. Investig. Ophthalmol. Vis. Sci. 2010, 51, 4921–4931. [Google Scholar] [CrossRef]
  31. Adav, S.S.; Wei, J.; Terence, Y.; Ang, B.C.; Yip, L.W.; Sze, S.K. Proteomic analysis of aqueous humor from primary open angle glaucoma patients on drug treatment revealed altered complement activation cascade. J. Proteome Res. 2018, 17, 2499–2510. [Google Scholar] [CrossRef]
  32. Aleshin, A.E.; Schraufstatter, I.U.; Stec, B.; Bankston, L.A.; Liddington, R.C.; DiScipio, R.G. Structure of Complement C6 Suggests a Mechanism for Initiation and Unidirectional, Sequential Assembly of Membrane Attack Complex (MAC)*♦. J. Biol. Chem. 2012, 287, 10210–10222. [Google Scholar] [CrossRef]
  33. Bubeck, D. The making of a macromolecular machine: Assembly of the membrane attack complex. Biochemistry 2014, 53, 1908–1915. [Google Scholar] [CrossRef]
  34. Tezel, G.; Yang, X.; Luo, C.; Kain, A.D.; Powell, D.W.; Kuehn, M.H.; Kaplan, H.J. Oxidative stress and the regulation of complement activation in human glaucoma. Investig. Ophthalmol. Vis. Sci. 2010, 51, 5071–5082. [Google Scholar] [CrossRef] [PubMed]
  35. Tegla, C.A.; Cudrici, C.; Patel, S.; Trippe, R.; Rus, V.; Niculescu, F.; Rus, H. Membrane attack by complement: The assembly and biology of terminal complement complexes. Immunol. Res. 2011, 51, 45–60. [Google Scholar] [CrossRef] [PubMed]
  36. Luo, C.; Zhao, J.; Madden, A.; Chen, M.; Xu, H. Complement expression in retinal pigment epithelial cells is modulated by activated macrophages. Exp. Eye Res. 2013, 112, 93–101. [Google Scholar] [CrossRef] [PubMed]
  37. Pauly, D.; Agarwal, D.; Dana, N.; Schäfer, N.; Biber, J.; Wunderlich, K.A.; Jabri, Y.; Straub, T.; Zhang, N.R.; Gautam, A.K. Cell-type-specific complement expression in the healthy and diseased retina. Cell Rep. 2019, 29, 2835–2848.e2834. [Google Scholar] [CrossRef]
  38. Xu, H.; Chen, M. Targeting the complement system for the management of retinal inflammatory and degenerative diseases. Eur. J. Pharmacol. 2016, 787, 94–104. [Google Scholar] [CrossRef]
  39. Serna, M.; Giles, J.L.; Morgan, B.P.; Bubeck, D. Structural basis of complement membrane attack complex formation. Nat. Commun. 2016, 7, 10587. [Google Scholar] [CrossRef]
  40. Kojima, T.; Horiuchi, T.; Nishizaka, H.; Fukumori, Y.; Amano, T.; Nagasawa, K.; Niho, Y.; Hayashi, K. Genetic basis of human complement C8α-γ deficiency. J. Immunol. 1998, 161, 3762–3766. [Google Scholar] [CrossRef]
  41. Kim, J.-H.; Afridi, R.; Han, J.; Jung, H.-G.; Kim, S.-C.; Hwang, E.M.; Shim, H.S.; Ryu, H.; Choe, Y.; Hoe, H.-S. Gamma subunit of complement component 8 is a neuroinflammation inhibitor. Brain 2021, 144, 528–552. [Google Scholar] [CrossRef]
  42. Kim, J.-H.; Han, J.; Suk, K. Protective effects of complement component 8 gamma against blood-brain barrier breakdown. Front. Physiol. 2021, 12, 671250. [Google Scholar] [CrossRef]
  43. Suk, K. Gamma subunit of complement component 8 is an innate immune suppressor in brain. J. Immunol. 2020, 204, 144-14. [Google Scholar] [CrossRef]
  44. Heinen, S.; Hartmann, A.; Lauer, N.; Wiehl, U.; Dahse, H.M.; Schirmer, S.; Gropp, K.; Enghardt, T.; Wallich, R.; Hälbich, S.; et al. Factor H-related protein 1 (CFHR-1) inhibits complement C5 convertase activity and terminal complex formation. Blood 2009, 114, 2439–2447. [Google Scholar] [CrossRef] [PubMed]
  45. De Córdoba, S.R.; De Jorge, E.G. Translational mini-review series on complement factor H: Genetics and disease associations of human complement factor H. Clin. Exp. Immunol. 2008, 151, 1–13. [Google Scholar] [CrossRef] [PubMed]
  46. Borras, C.; Canonica, J.; Jorieux, S.; Abache, T.; El Sanharawi, M.; Klein, C.; Delaunay, K.; Jonet, L.; Salvodelli, M.; Naud, M.-C. CFH exerts anti-oxidant effects on retinal pigment epithelial cells independently from protecting against membrane attack complex. Sci. Rep. 2019, 9, 13873. [Google Scholar] [CrossRef] [PubMed]
  47. Weismann, D.; Hartvigsen, K.; Lauer, N.; Bennett, K.L.; Scholl, H.P.; Issa, P.C.; Cano, M.; Brandstätter, H.; Tsimikas, S.; Skerka, C. Complement factor H binds malondialdehyde epitopes and protects from oxidative stress. Nature 2011, 478, 76–81. [Google Scholar] [CrossRef]
  48. Kopp, A.; Hebecker, M.; Svobodová, E.; Józsi, M. Factor h: A complement regulator in health and disease, and a mediator of cellular interactions. Biomolecules 2012, 2, 46–75. [Google Scholar] [CrossRef]
  49. Chinnaraj, M.; Planer, W.; Pozzi, N. Structure of coagulation factor II: Molecular mechanism of thrombin generation and development of next-generation anticoagulants. Front. Med. 2018, 5, 281. [Google Scholar] [CrossRef]
  50. Grieshaber, M.C.; Mozaffarieh, M.; Flammer, J. What is the link between vascular dysregulation and glaucoma? Surv. Ophthalmol. 2007, 52, S144–S154. [Google Scholar] [CrossRef]
  51. O’Brien, C.; Butt, Z.; Ludlam, C.; Detkova, P. Activation of the coagulation cascade in untreated primary open-angle glaucoma. Ophthalmology 1997, 104, 725–730. [Google Scholar] [CrossRef]
  52. Siegfried, C.J.; Shui, Y.B. Racial Disparities in Glaucoma: From Epidemiology to Pathophysiology. Mo Med. 2022, 119, 49–54. [Google Scholar]
  53. Harboe, M.; Mollnes, T.E. The alternative complement pathway revisited. J. Cell. Mol. Med. 2008, 12, 1074–1084. [Google Scholar] [CrossRef]
  54. Harder, J.M.; Williams, P.A.; Braine, C.E.; Yang, H.S.; Thomas, J.M.; Foxworth, N.E.; John, S.W.; Howell, G.R. Complement peptide C3a receptor 1 promotes optic nerve degeneration in DBA/2J mice. J. Neuroinflammation 2020, 17, 336. [Google Scholar] [CrossRef] [PubMed]
  55. Howell, G.R.; Soto, I.; Ryan, M.; Graham, L.C.; Smith, R.S.; John, S.W. Deficiency of complement component 5 ameliorates glaucoma in DBA/2J mice. J. Neuroinflammation 2013, 10, 851. [Google Scholar] [CrossRef] [PubMed]
  56. Sharma, R.; George, A.; Nimmagadda, M.; Ortolan, D.; Karla, B.-S.; Qureshy, Z.; Bose, D.; Dejene, R.; Liang, G.; Wan, Q. Epithelial phenotype restoring drugs suppress macular degeneration phenotypes in an iPSC model. Nat. Commun. 2021, 12, 7293. [Google Scholar] [CrossRef]
  57. Klos, A.; Tenner, A.J.; Johswich, K.-O.; Ager, R.R.; Reis, E.S.; Köhl, J. The role of the anaphylatoxins in health and disease. Mol. Immunol. 2009, 46, 2753–2766. [Google Scholar] [CrossRef] [PubMed]
  58. Qin, S.; Dong, N.; Yang, M.; Wang, J.; Feng, X.; Wang, Y. Complement inhibitors in age-related macular degeneration: A potential therapeutic option. J. Immunol. Res. 2021, 2021, 9945725. [Google Scholar] [CrossRef] [PubMed]
  59. Girardi, G.; Lingo, J.J.; Fleming, S.D.; Regal, J.F. Essential role of complement in pregnancy: From implantation to parturition and beyond. Front. Immunol. 2020, 11, 1681. [Google Scholar] [CrossRef]
  60. Wang, H.; Liu, M. Complement C4, infections, and autoimmune diseases. Front. Immunol. 2021, 12, 694928. [Google Scholar] [CrossRef]
  61. Nilsson, S.C.; Sim, R.B.; Lea, S.M.; Fremeaux-Bacchi, V.; Blom, A.M. Complement factor I in health and disease. Mol. Immunol. 2011, 48, 1611–1620. [Google Scholar] [CrossRef]
  62. Giannakopoulos, P.; Kövari, E.; French, L.; Viard, I.; Hof, P.; Bouras, C. Possible neuroprotective role of clusterin in Alzheimer’s disease: A quantitative immunocytochemical study. Acta Neuropathol. 1998, 95, 387–394. [Google Scholar] [CrossRef]
  63. Wilson, M.R.; Easterbrook-Smith, S.B. Clusterin is a secreted mammalian chaperone. Trends Biochem. Sci. 2000, 25, 95–98. [Google Scholar] [CrossRef]
  64. Menny, A.; Lukassen, M.V.; Couves, E.C.; Franc, V.; Heck, A.J.; Bubeck, D. Structural basis of soluble membrane attack complex packaging for clearance. Nat. Commun. 2021, 12, 6086. [Google Scholar] [CrossRef] [PubMed]
  65. Li, S.; Gao, Y.; Shao, M.; Tang, B.; Cao, W.; Sun, X. Association between coagulation function and patients with primary angle closure glaucoma: A 5-year retrospective case-control study. BMJ Open 2017, 7, e016719. [Google Scholar] [CrossRef] [PubMed]
  66. Williams, P.A.; Tribble, J.R.; Pepper, K.W.; Cross, S.D.; Morgan, B.P.; Morgan, J.E.; John, S.W.; Howell, G.R. Inhibition of the classical pathway of the complement cascade prevents early dendritic and synaptic degeneration in glaucoma. Mol. Neurodegener. 2016, 11, 26. [Google Scholar] [CrossRef] [PubMed]
  67. Dikopf, M.S.; Vajaranant, T.S.; Edward, D.P. Topical treatment of glaucoma: Established and emerging pharmacology. Expert Opin. Pharmacother. 2017, 18, 885–898. [Google Scholar] [CrossRef] [PubMed]
Figure 1. Complement proteins detected in the human aqueous humor. A total of 32 complement proteins were detected in the human AH samples analyzed. The mean PSM values were log2 transformed for comparison.
Jpm 13 01400 g001
Figure 2. Alterations in the aqueous humor complement proteins associated with glaucoma. Fold change values were compared across groups (POAG vs. cataracts). A total of four proteins (C6, C8G, CFH, and F2) displayed significant alterations in protein levels. * p < 0.05.
Jpm 13 01400 g002
Figure 3. Race-specific alterations in the aqueous humor complement proteins associated with glaucoma. Patient samples were stratified according to race and compared across the two disease cohorts. Five proteins were found significantly altered within African Americans and eight within white subjects between the POAG and cataract cohorts. AA = Black/African American subjects; * p < 0.05.
Jpm 13 01400 g003
Figure 4. Sex-specific alterations in the aqueous humor complement proteins associated with glaucoma. Patient samples were stratified according to sex and compared across the two disease cohorts. Three proteins were found significantly altered within males and three within females between the POAG and cataract subjects. * p < 0.05.
Jpm 13 01400 g004
Table 1. Demographic information of the subjects.
Demographic CharacteristicCataract (n = 196)POAG (n = 62)p-Value
Age (years, mean ± SD)67.38 ± 9.4867.87 ± 11.230.76 a
Sex (F/M)122/7438/241 b
Race (African Americans/Caucasians)107/8938/240.44 b
a: two-sample t-test b: chi-square test.
Table 2. Complement system proteins detected in the human aqueous humor.
UniProt IDGene SymbolDescriptionMean PSM Value (±SD)Proportion of Samples Detected (%)
Activation Components
P01024C3Complement C3227.59 ± 68.1100.0
P0C0L5C4BComplement C4B134.07 ± 64.4396.5
P0C0L4C4AComplement C4-A112.39 ± 77.9579.8
P00751CFBComplement factor B52.12 ± 13.43100
P00746CFDComplement factor D11.32 ± 6.399.2
P02748C9Complement component C911.03 ± 8.7693.8
P00736C1RComplement C1r subcomponent6.92 ± 5.7685.7
P10643C7Complement component C75.14 ± 4.4991.5
P09871C1SComplement C1s subcomponent3.26 ± 3.3376.4
P07357C8AComplement component C8 alpha chain3.13 ± 2.5990.3
P13671C6Complement component C62.57 ± 2.7274.8
P07358C8BComplement component C8 beta chain1.91 ± 2.6254.7
P07360C8GComplement component C8 gamma chain1.58 ± 1.6365.9
P01031C5Complement C51.55 ± 2.1658.9
P06681C2Complement C21.11 ± 1.4354.7
P02747C1QCComplement C1q subcomponent subunit C0.81 ± 1.243.0
P02746C1QBComplement C1q subcomponent subunit B0.36 ± 0.629.8
O00187MASP2Mannan-binding lectin serine protease 20.09 ± 0.318.1
O00602FCN1Ficolin-1NDND
P48740MASP1Mannan-binding lectin serine protease 1NDND
P02745C1QAComplement C1q subcomponent subunit ANDND
P27918CFPProperdinNDND
O75636FCN3Ficolin-3NDND
P11226MBL2Mannose-binding protein CNDND
Q9BWP8COLEC11Collectin subfamily member 11NDND
Q15485FCN2Ficolin-2NDND
Q9Y6Z7COLEC10Collectin subfamily member 10NDND
Regulators and Receptors
P10909CLUClusterin95.22 ± 40.97100.0
P05155SERPING1Plasma protease C1 inhibitor35.57 ± 12.07100.0
P00734F2Prothrombin31.86 ± 15.52100.0
P08603CFHComplement factor H21.11 ± 12.1498.1
P05156CFIComplement factor I19.12 ± 7.18100.0
P04004VTNVitronectin14.92 ± 6.3998.1
Q03591CFHR1Complement factor H-related protein 13.85 ± 4.2854.7
P36980CFHR2Complement factor H-related protein 20.86 ± 1.9820.9
P13987CD59CD59 glycoprotein0.38 ± 0.729.1
P20702ITGAXIntegrin alpha-X0.31 ± 0.6820.5
P08174CD55Complement decay-accelerating factor0.17 ± 0.4813.6
P04003C4BPAC4b-binding protein alpha chain0.12 ± 0.646.6
Q7Z408CSMD2CUB and sushi domain-containing protein 20.08 ± 0.36.6
P05107ITGB2Integrin beta-20.07 ± 0.36.2
Q7Z407CSMD3CUB and sushi domain-containing protein 3NDND
Q96PZ7CSMD1CUB and sushi domain-containing protein 1NDND
P11215ITGAMIntegrin alpha-MNDND
Q9BXR6CFHR5Complement factor H-related protein 5NDND
P17927CR1Complement receptor type 1NDND
Q9NPY3CD93Complement component C1q receptorNDND
Q16581C3AR1C3a anaphylatoxin chemotactic receptorNDND
P20023CR2Complement receptor type 2NDND
P15529CD46Membrane cofactor proteinNDND
Q9Y279VSIG4V-set and immunoglobulin domain-containing protein 4NDND
P20851C4BPBC4b-binding protein beta chainNDND
Q92496CFHR4Complement factor H-related protein 4NDND
Q02985CFHR3Complement factor H-related protein 3NDND
P08246ELANENeutrophil elastaseNDND
P21730C5AR1Complement C5a receptor 1NDND
ND: not detected; PSM: peptide spectrum match.
Table 3. Race-specific changes in the aqueous humor complement proteins in glaucoma patients.
Gene SymbolDescriptionOverallAfrican AmericanCaucasian
FCp-ValueFCp-ValueFCp-Value
C4AComplement C4-A1.440.2102.330.027 *0.720.452
C4BComplement C4B1.300.0741.690.015 *0.890.517
F2Prothrombin1.190.046 *1.310.023 *1.030.811
C7Complement component C71.060.5761.380.025 *0.720.057
C3Complement C31.030.6071.210.027 *0.820.038 *
SERPING1Plasma protease C1 inhibitor1.000.9461.130.1140.830.015 *
CFIComplement factor I0.930.2611.060.4900.770.007 *
CLUClusterin0.930.3251.050.6260.770.021 *
CFHR1Complement factor H-related protein 10.850.2731.250.2570.480.002 *
C8GComplement component C8 gamma chain0.830.026 *0.940.6000.670.004 *
C6Complement component C60.810.032 *0.950.7160.630.002 *
CFHComplement factor H0.770.024 *0.950.7020.570.003 *
FC: fold change in glaucoma patients compared to cataract patients; * p < 0.05.
Table 4. Sex-specific changes in the aqueous humor complement proteins in glaucoma patients.
Gene SymbolDescriptionOverallMaleFemale
FCp-ValueFCp-ValueFCp-Value
C4BComplement C4B1.300.0740.960.8531.560.030 *
F2Prothrombin1.190.046 *0.940.6301.370.007 *
CLUClusterin0.930.3250.780.046 *1.030.781
C8GComplement component C8 gamma chain0.830.026 *0.880.3880.780.025 *
C6Complement component C60.810.032 *0.670.009 *0.920.519
CFHComplement factor H0.770.024 *0.630.015 *0.870.339
FC: fold change in glaucoma patients compared to cataract patients; * p < 0.05.
Table 5. The complement proteins correlated with PSD and VFI values.
Gene SymbolDescriptionPSD GlaucomaVFI Glaucoma
Correlation Coefficient (R)p-ValueCorrelation Coefficient (R)p-Value
C5Complement C50.470.002 *−0.310.125
C7Complement component C70.430.006 *−0.640.0006 *
C1RComplement C1r subcomponent0.390.014 *−0.520.008 *
C4BComplement C4B0.380.019 *−0.460.020 *
C8AComplement component C8 alpha chain0.370.020 *−0.290.162
F2Prothrombin0.360.024 *−0.490.014 *
C4AComplement C4-A0.330.038 *−0.440.027 *
C9Complement component C90.300.063−0.440.027 *
C8GComplement component C8 gamma chain0.240.143−0.540.006 *
PSD: pattern standard deviation; VFI: visual field index; * p < 0.05.
Table 6. The complement proteins correlated with HRT parameters.
Gene SymbolCup Area (mm2)Cup Volume (mm3)Maximum Cup Depth (mm)Mean Cup Depth (mm)Disc Area (mm2)CD Area Ratio
Corr. Coeff. (R)p-ValueCorr. Coeff. (R)p-ValueCorr. Coeff. (R)p-ValueCorr. Coeff. (R)p-ValueCorr. Coeff. (R)p-ValueCorr. Coeff. (R)p-Value
CFI−0.336 × 10⁻⁵ *−0.335 × 10⁻⁵ *−0.270.001 *−0.230.005 *−0.190.020 *−0.280.0004 *
VTN−0.260.001 *−0.290.0005 *−0.220.009 *−0.150.061−0.190.021 *−0.190.022 *
CLU−0.260.002 *−0.250.002 *−0.150.066−0.130.121−0.090.291−0.210.010 *
C3−0.220.007 *−0.260.002 *−0.220.007 *−0.190.022 *−0.170.045 *−0.190.022 *
CFH−0.200.015 *−0.230.005 *−0.220.008 *−0.200.014 *−0.140.105−0.210.009 *
CFHR1−0.170.036 *−0.200.018 *−0.180.030 *−0.170.032 *−0.180.034 *−0.160.049 *
C4B−0.150.074−0.190.023 *−0.150.074−0.150.062−0.090.307−0.120.143
C2−0.150.065−0.160.049 *−0.130.116−0.130.116−0.110.188−0.120.146
F2−0.140.093−0.180.034 *−0.200.015 *−0.160.054−0.080.358−0.100.213
C5−0.080.358−0.110.194−0.170.038 *−0.130.102−0.140.083−0.050.533
C8B−0.080.360−0.110.171−0.170.044 *−0.130.111−0.070.395−0.050.504
HRT: Heidelberg Retinal Tomography; CD: cup-to-disc; * p < 0.05.
Disclaimer/Publisher’s Note: The statements, opinions and data contained in all publications are solely those of the individual author(s) and contributor(s) and not of MDPI and/or the editor(s). MDPI and/or the editor(s) disclaim responsibility for any injury to people or property resulting from any ideas, methods, instructions or products referred to in the content.

