
Monitoring of Immune Memory by Phenotypical Lymphocyte Subsets Identikit: An Observational Study in a Blood Donors’ Cohort

 , ,
, ,  , , and
Abstract
:1. Introduction
2. Materials and Methods
2.1. Samples Collection
2.2. Inclusion/Exclusion Criteria
2.3. B and T Lymphocyte Subpopulation Panel
2.4. Statistical Analysis
3. Results
3.1. Enrolled Population
3.2. Immuno-Profile Identikit by Blood Type
4. Discussion
5. Conclusions
Author Contributions
Funding
Institutional Review Board Statement
Informed Consent Statement
Data Availability Statement
Conflicts of Interest
Appendix A

| Blood Type | Study Population (N = 72) | |||
|---|---|---|---|---|
| A | B | 0 | ||
| (N = 21) | (N = 22) | (N = 29) | ||
| Rhesus factor | ||||
| − | 3 (14.3%) | 2 (9.1%) | 1 (3.4%) | 6 (8.3%) |
| + | 18 (85.7%) | 20 (90.9%) | 28 (96.6%) | 66 (91.7%) |

References
- Jordan, S.C. Innate and adaptive immune responses to SARS-CoV-2 in humans: Relevance to acquired immunity and vaccine responses. Clin. Exp. Immunol. 2021, 204, 310–320. [Google Scholar] [CrossRef] [PubMed]
- Meijers, M.; Ruchnewitz, D.; Eberhardt, J.; Karmakar, M.; Łuksza, M.; Lässig, M. Concepts and methods for predicting viral evolution. arXiv 2024, arXiv:2403.12684v2. [Google Scholar]
- Farber, D.L.; Netea, M.G.; Radbruch, A.; Rajewsky, K.; Zinkernagel, R.M. Immunological memory: Lessons from the past and a look to the future. Nat. Rev. Immunol. 2016, 16, 124–128. [Google Scholar] [CrossRef] [PubMed]
- Wang, Y.; Liu, J.; Burrows, P.D.; Wang, J.-Y. B Cell Development and Maturation. Adv. Exp. Med. Biol. 2020, 1254, 1–22. [Google Scholar] [CrossRef] [PubMed]
- Gutcher, I.; Becher, B. APC-derived cytokines and T cell polarization in autoimmune inflammation. J. Clin. Investig. 2007, 117, 1119–1127. [Google Scholar] [CrossRef] [PubMed]
- Burren, O.S.; García, A.R.; Javierre, B.-M.; Rainbow, D.B.; Cairns, J.; Cooper, N.J.; Lambourne, J.J.; Schofield, E.; Dopico, X.C.; Ferreira, R.C.; et al. Chromosome contacts in activated T cells identify autoimmune disease candidate genes. Genome Biol. 2017, 18, 165. [Google Scholar] [CrossRef] [PubMed]
- Charitos, I.A.; Ballini, A.; Lovero, R.; Castellaneta, F.; Colella, M.; Scacco, S.; Cantore, S.; Arrigoni, R.; Mastrangelo, F.; Dioguardi, M. Update on COVID-19 and Effectiveness of a Vaccination Campaign in a Global Context. Int. J. Environ. Res. Public Health 2022, 19, 10712. [Google Scholar] [CrossRef]
- Sallusto, F.; Lenig, D.; Förster, R.; Lipp, M.; Lanzavecchia, A. Two subsets of memory T lymphocytes with distinct homing potentials and effector functions. Nature 1999, 401, 708–712. [Google Scholar] [CrossRef]
- Shin, H.; Iwasaki, A. Tissue-resident memory T cells. Immunol. Rev. 2013, 255, 165–181. [Google Scholar] [CrossRef]
- Lee, Y.J.; Jameson, S.C.; Hogquist, K.A. Alternative memory in the CD8 T cell lineage. Trends Immunol. 2011, 32, 50–56. [Google Scholar] [CrossRef]
- Godfrey, D.I.; MacDonald, H.R.; Kronenberg, M.; Smyth, M.J.; Van Kaer, L. NKT cells: What’s in a name? Nat. Rev. Immunol. 2004, 4, 231–237. [Google Scholar] [CrossRef] [PubMed]
- Jameson, J.; Havran, W.L. Skin γδ T-cell functions in homeostasis and wound healing. Immunol. Rev. 2007, 215, 114–122. [Google Scholar] [CrossRef] [PubMed]
- Stemberger, C.; Huster, K.M.; Koffler, M.; Anderl, F.; Schiemann, M.; Wagner, H.; Busch, D.H. A single naive CD8+ T cell precursor can develop into diverse effector and memory subsets. Immunity 2007, 27, 985–997. [Google Scholar] [CrossRef] [PubMed]
- Serretiello, E.; Ballini, A.; Smimmo, A.; Acunzo, M.; Raimo, M.; Cantore, S.; Di Domenico, M. Extracellular Vesicles as a Translational Approach for the Treatment of COVID-19 Disease: An Updated Overview. Viruses 2023, 15, 1976. [Google Scholar] [CrossRef] [PubMed]
- Tomiyama, H.; Matsuda, T.; Takiguchi, M. Differentiation of human CD8(+) T cells from a memory to memory/effector phenotype. J. Immunol. 2002, 168, 5538–5550. [Google Scholar] [CrossRef] [PubMed]
- Bi, J.; Tian, Z. NK Cell Exhaustion. Front. Immunol. 2017, 8, 760. [Google Scholar] [CrossRef] [PubMed]
- Sakuishi, K.; Apetoh, L.; Sullivan, J.M.; Blazar, B.R.; Kuchroo, V.K.; Anderson, A.C. Targeting Tim-3 and PD-1 pathways to reverse T cell exhaustion and restore anti-tumor immunity. J. Exp. Med. 2010, 207, 2187–2194, Erratum: J. Exp. Med. 2011, 208, 1331. [Google Scholar] [CrossRef]
- Cirillo, N.; Bizzoca, M.E.; Muzio, E.L.; Cazzolla, A.P.; Muzio, L.L. Gustatory dysfunction in COVID-19 patients: A rapid systematic review on 27,687 cases. Acta Odontol. Scand. 2021, 79, 418–425. [Google Scholar] [CrossRef]
- Ballini, A.; Cantore, S.; Serretiello, E.; Troiano, G.; Smimmo, A.; Dioguardi, M.; Spirito, F.; Sasso, F.C.; De Vito, D.; Muzio, L.L.; et al. Multiparametric correlation of laboratory biomarkers to multiorgan failure outcome in hospitalized COVID-19 patients: A retrospective observational study. Eur. Rev. Med. Pharmacol. Sci. 2023, 27, 8962–8974. [Google Scholar] [CrossRef]
- Boccellino, M. COVID-19 Pandemic: Therapeutic Strategies and Vaccines. Int. J. Mol. Sci. 2023, 25, 556. [Google Scholar] [CrossRef]
- Peng, Y.; Mentzer, A.J.; Liu, G.; Yao, X.; Yin, Z.; Dong, D.; Dejnirattisai, W.; Rostron, T.; Supasa, P.; Liu, C.; et al. Broad and strong memory CD4+ and CD8+ T cells induced by SARS-CoV-2 in UK convalescent individuals following COVID-19. Nat. Immunol. 2020, 21, 1336–1345. [Google Scholar] [CrossRef] [PubMed]
- Beserra, D.R.; Alberca, R.W.; Branco, A.C.C.C.; Oliveira, L.d.M.; Andrade, M.M.d.S.; Gozzi-Silva, S.C.; Teixeira, F.M.E.; Yendo, T.M.; Duarte, A.J.d.S.; Sato, M.N. Upregulation of PD-1 Expression and High sPD-L1 Levels Associated with COVID-19 Severity. J. Immunol. Res. 2022, 2022, 9764002. [Google Scholar] [CrossRef] [PubMed]
- Srivastava, R.; Dhanushkodi, N.; Prakash, S.; Coulon, P.G.; Vahed, H.; Zayou, L.; Quadiri, A.; BenMohamed, L. High Frequencies of Phenotypically and Functionally Senescent and Exhausted CD56+CD57+PD-1+ Natural Killer Cells, SARS-CoV-2-Specific Memory CD4+ and CD8+ T cells Associated with Severe Disease in Unvaccinated COVID-19 Patients. bioRxiv 2022, 27, 501655. [Google Scholar] [CrossRef]
- Awasthi, N.P.; Singh, S.; Tiwari, V.; Agarwal, J. Sequential Shifting in T-helper and T-cytotoxic Subset Cell Population in Mild and Severe COVID-19 Patients Infected With Variant B.1.61. Cureus 2023, 15, e40556. [Google Scholar] [CrossRef]
- De Biasi, S.; Meschiari, M.; Gibellini, L.; Bellinazzi, C.; Borella, R.; Fidanza, L.; Gozzi, L.; Iannone, A.; Tartaro, D.L.; Mattioli, M.; et al. Marked T cell activation, senescence, exhaustion and skewing towards TH17 in patients with COVID-19 pneumonia. Nat. Commun. 2020, 11, 3434. [Google Scholar] [CrossRef] [PubMed]
- Shuwa, H.A.; Shaw, T.N.; Knight, S.B.; Wemyss, K.; McClure, F.A.; Pearmain, L.; Prise, I.; Jagger, C.; Morgan, D.J.; Khan, S.; et al. Alterations in T and B cell function persist in convalescent COVID-19 patients. Med 2021, 2, 720–735.e4. [Google Scholar] [CrossRef] [PubMed]
- Quinti, I.; Lougaris, V.; Milito, C.; Cinetto, F.; Pecoraro, A.; Mezzaroma, I.; Mastroianni, C.M.; Turriziani, O.; Bondioni, M.P.; Filippini, M.; et al. A possible role for B cells in COVID-19? Lesson from patients with agammaglobulinemia. J. Allergy Clin. Immunol. 2020, 146, 211–213.e4. [Google Scholar] [CrossRef]
- Batool, Z.; Durrani, S.H.; Tariq, S. Association of Abo And Rh Blood Group Types To Hepatitis B, Hepatitis C, Hiv And Syphilis Infection, A Five Year’ Experience in Healthy Blood Donors in A Tertiary Care Hospital. J. Ayub Med. Coll. Abbottabad. 2017, 29, 90–92. [Google Scholar] [PubMed]
- Lindesmith, L.; Moe, C.; Marionneau, S.; Ruvoen, N.; Jiang, X.; Lindblad, L.; Stewart, P.; LePendu, J.; Baric, R. Human susceptibility and resistance to Norwalk virus infection. Nat. Med. 2003, 9, 548–553. [Google Scholar] [CrossRef]
- Zhao, J.; Yang, Y.; Huang, H.; Li, D.; Gu, D.; Lu, X.; Zhang, Z.; Liu, L.; Liu, T.; Liu, Y.; et al. Relationship between the ABO Blood Group and the Coronavirus Disease 2019 (COVID-19) Susceptibility. Clin. Infect. Dis. 2021, 73, 328–331. [Google Scholar] [CrossRef]
- Goel, R.; Bloch, E.M.; Pirenne, F.; Al-Riyami, A.Z.; Crowe, E.; Dau, L.; Land, K.; Townsend, M.; Jecko, T.; Rahimi-Levene, N.; et al. ABO blood group and COVID-19: A review on behalf of the ISBT COVID-19 working group. Vox Sang. 2021, 116, 849–861. [Google Scholar] [CrossRef] [PubMed]
- Severe COVID-19 GWAS Group. Genomewide association study of severe COVID-19 with respiratory failure. N. Engl. J. Med. 2020, 383, 1522–1534. [Google Scholar] [CrossRef] [PubMed]
- Li, J.; Wang, X.; Chen, J.; Cai, Y.; Deng, A.; Yang, M. Association between ABO blood groups and risk of SARS-CoV-2 pneumonia. Br. J. Haematol. 2020, 190, 24–27. [Google Scholar] [CrossRef] [PubMed]
- Wu, Y.; Feng, Z.; Li, P.; Yu, Q. Relationship between ABO blood group distribution and clinical characteristics in patients with COVID-19. Clin. Chim. Acta 2020, 509, 220–223. [Google Scholar] [CrossRef] [PubMed]
- Latz, C.A.; DeCarlo, C.; Boitano, L.; Png, C.Y.M.; Patell, R.; Conrad, M.F.; Eagleton, M.; Dua, A. Blood type and outcomes in patients with COVID-19. Ann. Hematol. 2020, 99, 2113–2118. [Google Scholar] [CrossRef] [PubMed]
- DURAClone IM T Cell Subsets Protocol. Available online: https://www.beckman.it/reagents/coulter-flow-cytometry/antibodies-and-kits/duraclone-panels/duraclone-im-t-cell-subsets/protocol (accessed on 11 May 2023).
- DURAClone IM B Cell Protocol. Available online: https://www.beckman.it/reagents/coulter-flow-cytometry/antibodies-and-kits/duraclone-panels/duraclone-im-b-cell/protocol (accessed on 23 May 2023).
- Navios EX. Available online: https://www.beckman.com/flow-cytometry/clinical-flow-cytometers/navios-ex (accessed on 11 May 2024).
- Software di analisi Kaluza C. Available online: https://www.beckman.it/flow-cytometry/software/kaluza-c (accessed on 11 May 2024).
- Kim, T.K. Understanding one-way ANOVA using conceptual figures. Korean J. Anesthesiol. 2017, 70, 22–26. [Google Scholar] [CrossRef] [PubMed]
- McHugh, M.L. The Chi-square test of independence. Biochem. Med. 2013, 23, 143–149. [Google Scholar] [CrossRef] [PubMed]
- Hthelee, L.H.H.; Sadooghiasl, A.; Kermanshahi, S.M. Moral distress and moral courage among Iraqi nurses during the COVID-19 pandemic: A cross-sectional study. J. Med. Ethic-Hist. Med. 2023, 16, 19. [Google Scholar] [CrossRef]
- Spriestersbach, A.; Röhrig, B.; du Prel, J.B.; Gerhold-Ay, A.; Blettner, M. Descriptive statistics: The specification of statistical measures and their presentation in tables and graphs. Part 7 of a series on evaluation of scientific publications. Dtsch. Arztebl. Int. 2009, 106, 578–583. [Google Scholar] [CrossRef]
- Pitiriga, V.C.; Papamentzelopoulou, M.; Konstantinakou, K.E.; Vasileiou, I.V.; Sakellariou, K.S.; Spyrou, N.I.; Tsakris, A. Persistence of T-Cell Immunity Responses against SARS-CoV-2 for over 12 Months Post COVID-19 Infection in Unvaccinated Individuals with No Detectable IgG Antibodies. Vaccines 2023, 11, 1764. [Google Scholar] [CrossRef]
- Levene, H. Robust Tests for Equality of Variances. In Contributions to Probability and Statistics; Stanford University Press: Palo Alto, CA, USA, 1960; pp. 278–292. [Google Scholar]
- Amoroso, A.; Magistroni, P.; Vespasiano, F.; Bella, A.; Bellino, S.; Puoti, F.; Alizzi, S.; Vaisitti, T.; Boros, S.; Grossi, P.A.; et al. HLA and AB0 Polymorphisms May Influence SARS-CoV-2 Infection and COVID-19 Severity. Transplantation 2021, 105, 193–200. [Google Scholar] [CrossRef] [PubMed]
- Nigro, G.L.; Bizzoca, M.E.; Muzio, L.L.; Campisi, G. The Management of Dental Practices in the Post-COVID 19 Era: An Economic and Operational Perspective. Int. J. Environ. Res. Public Health 2020, 17, 8905. [Google Scholar] [CrossRef] [PubMed]
- Pannone, G.; Caponio, V.C.A.; De Stefano, I.S.; Ramunno, M.A.; Meccariello, M.; Agostinone, A.; Pedicillo, M.C.; Troiano, G.; Zhurakivska, K.; Cassano, T.; et al. Lung histopathological findings in COVID-19 disease—A systematic review. Infect. Agents Cancer 2021, 16, 34. [Google Scholar] [CrossRef] [PubMed]
- Hoseinnezhad, T.; Soltani, N.; Ziarati, S.; Behboudi, E.; Mousavi, M.J. The role of HLA genetic variants in COVID-19 susceptibility, severity, and mortality: A global review. J. Clin. Lab. Anal. 2024, 38. [Google Scholar] [CrossRef] [PubMed]
- Muzio, L.L.; Bizzoca, M.E.; Ravagnan, G. New intriguing possibility for prevention of coronavirus pneumonitis: Natural purified polyphenols. Oral Dis. 2022, 28, 899–903. [Google Scholar] [CrossRef] [PubMed]
- Zhurakivska, K.; Troiano, G.; Pannone, G.; Caponio, V.C.A.; Muzio, L.L. An Overview of the Temporal Shedding of SARS-CoV-2 RNA in Clinical Specimens. Front. Public Health 2020, 8, 00487. [Google Scholar] [CrossRef] [PubMed]
- Di Domenico, M.; De Rosa, A.; Boccellino, M. Detection of SARS-COV-2 Proteins Using an ELISA Test. Diagnostics 2021, 11, 698. [Google Scholar] [CrossRef] [PubMed]
- Vitiello, A.; Ferrara, F.; Auti, A.M.; Di Domenico, M.; Boccellino, M. Advances in the Omicron variant development. J. Intern. Med. 2022, 292, 81–90. [Google Scholar] [CrossRef]
- Di Domenico, M.; De Rosa, A.; Di Gaudio, F.; Internicola, P.; Bettini, C.; Salzano, N.; Castrianni, D.; Marotta, A.; Boccellino, M. Diagnostic Accuracy of a New Antigen Test for SARS-CoV-2 Detection. Int. J. Environ. Res. Public Health 2021, 18, 6310. [Google Scholar] [CrossRef]


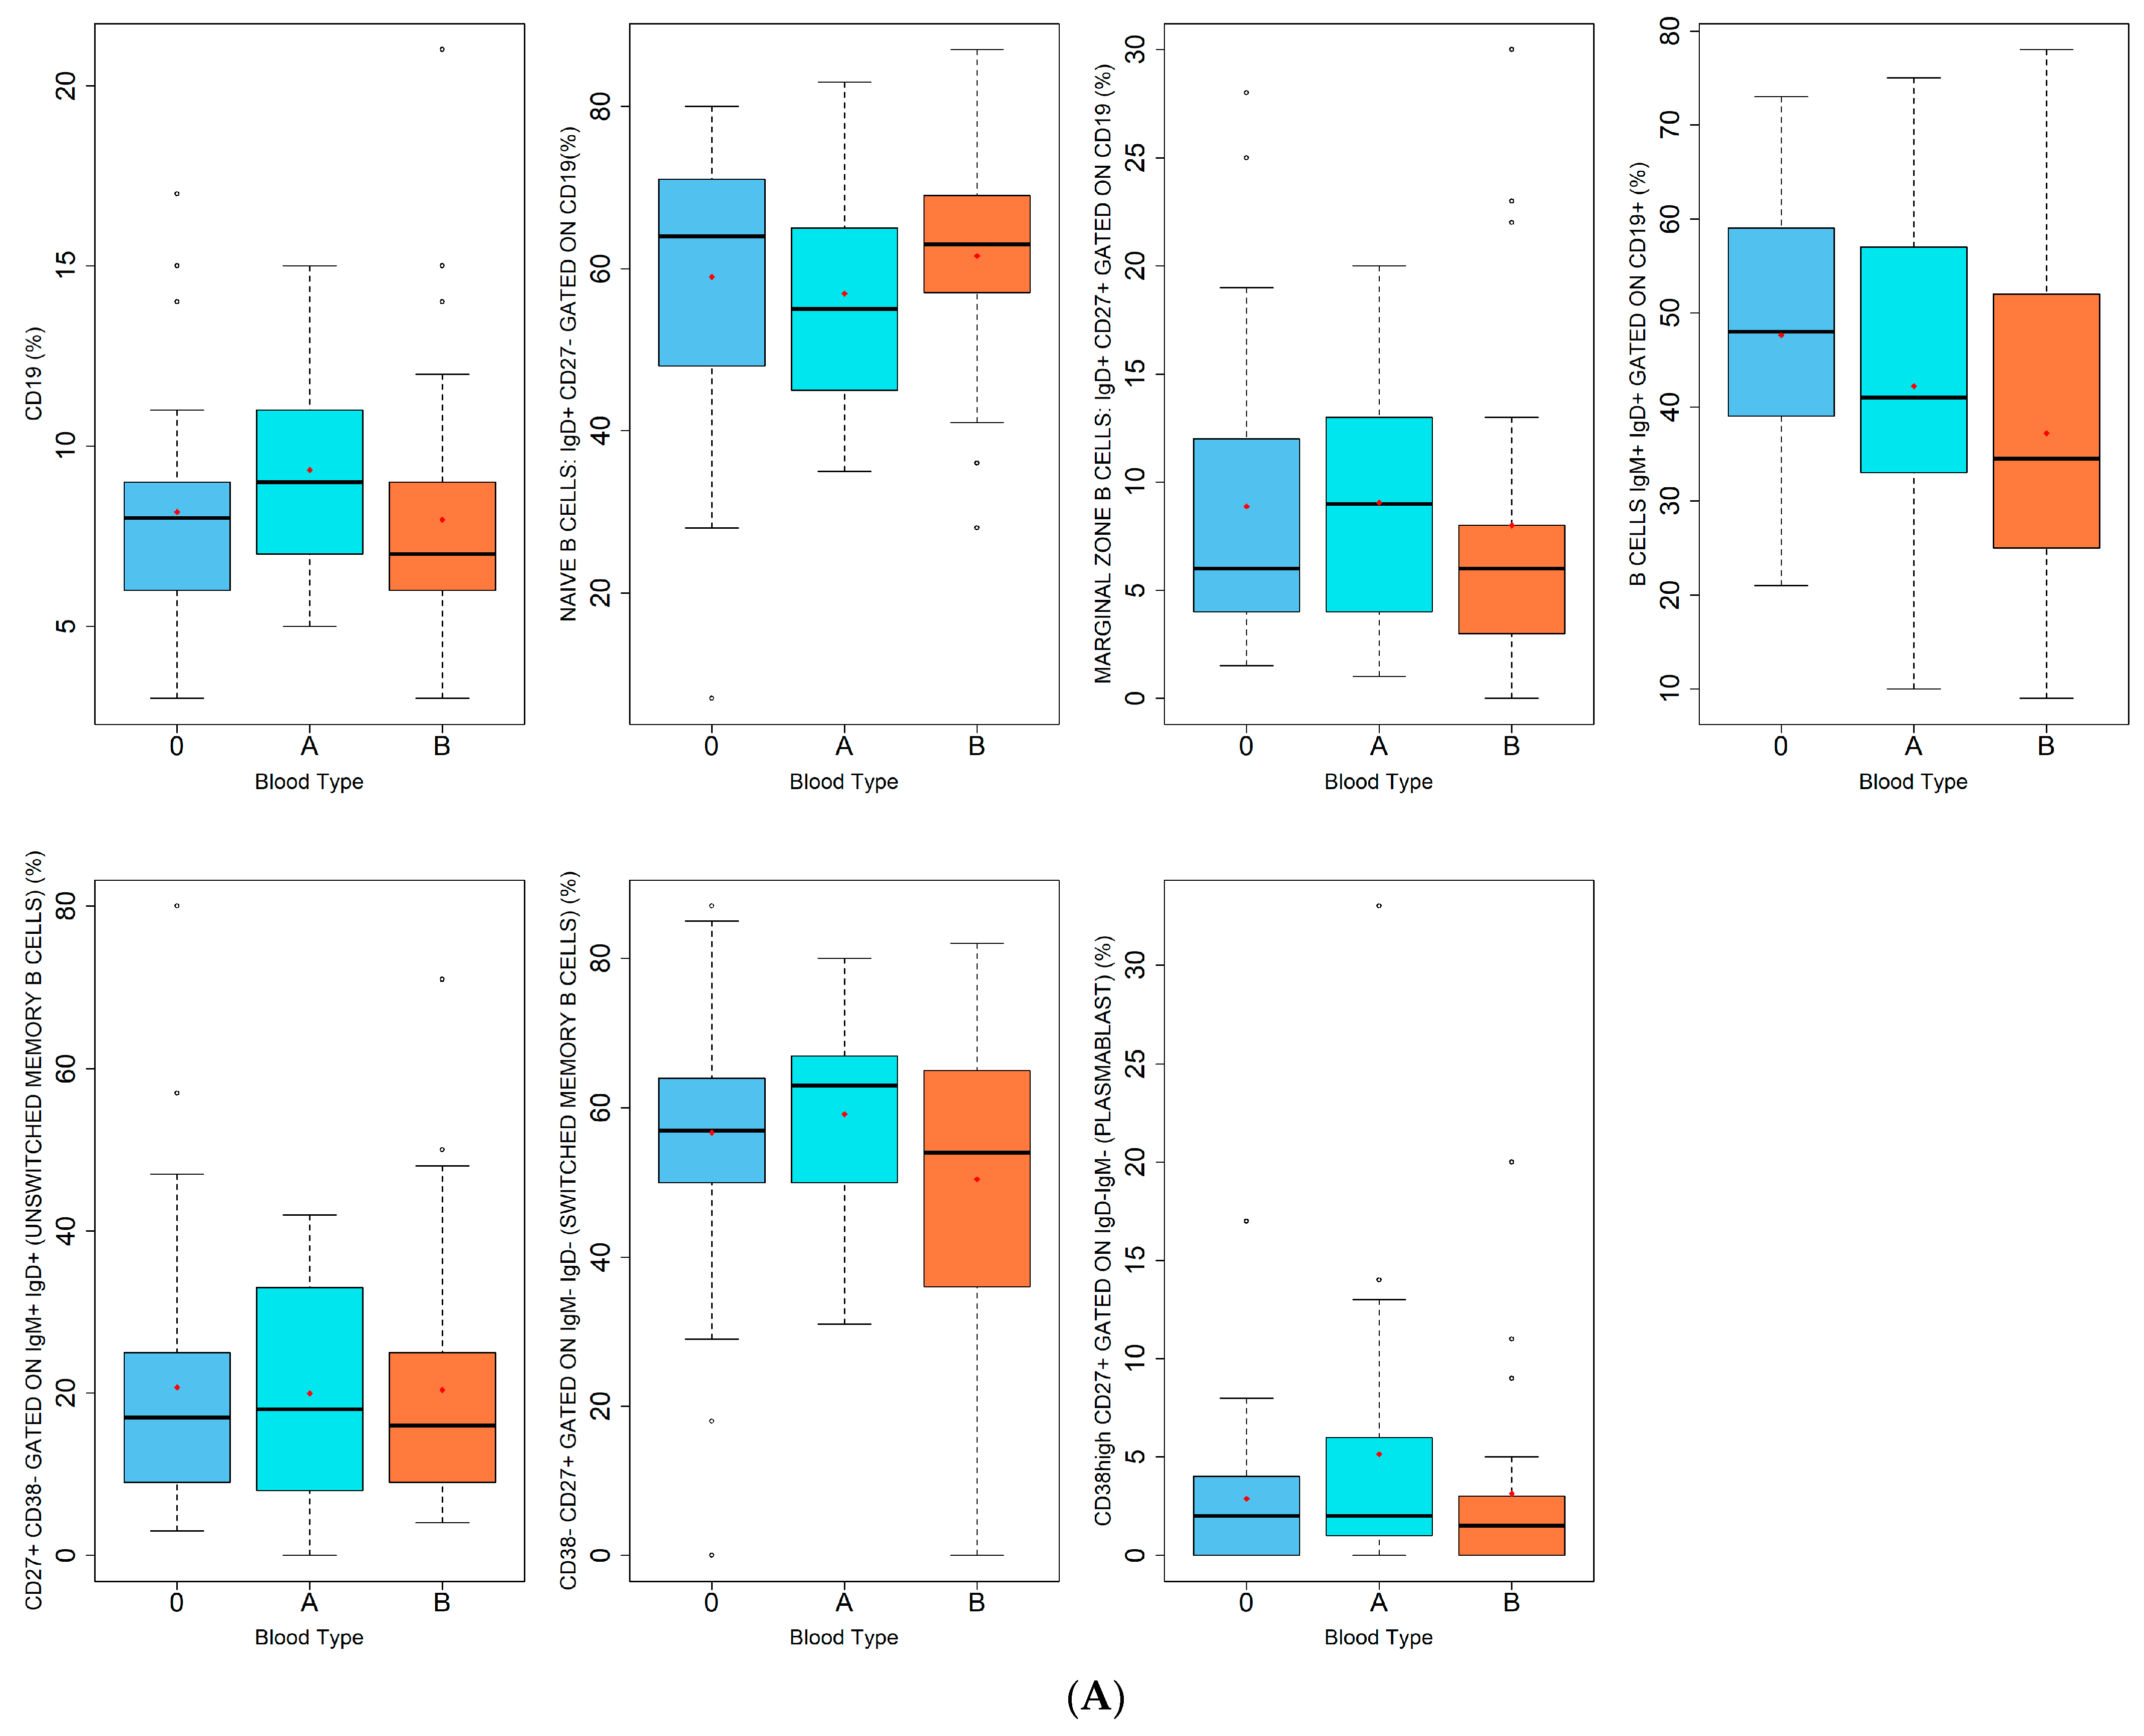
| Lymphocytes B (%) | |
| CD19 | |
| NAIVE B CELLS: IgD+ CD27− GATED ON CD19 | |
| MARGINAL ZONE B CELLS: IgD+ CD27+ GATED ON CD19 | |
| B CELLS IgM+ IgD+ GATED ON CD19+ | |
| CD27+ CD38− GATED ON IgM+ IgD+ (UNSWITCHED MEMORY B CELLS) | |
| CD38- CD27+ GATED ON IgM− IgD− (SWITCHED MEMORY B CELLS) | |
| CD38high CD27+ GATED ON IgD− IgM− (PLASMABLAST) | |
| A | |
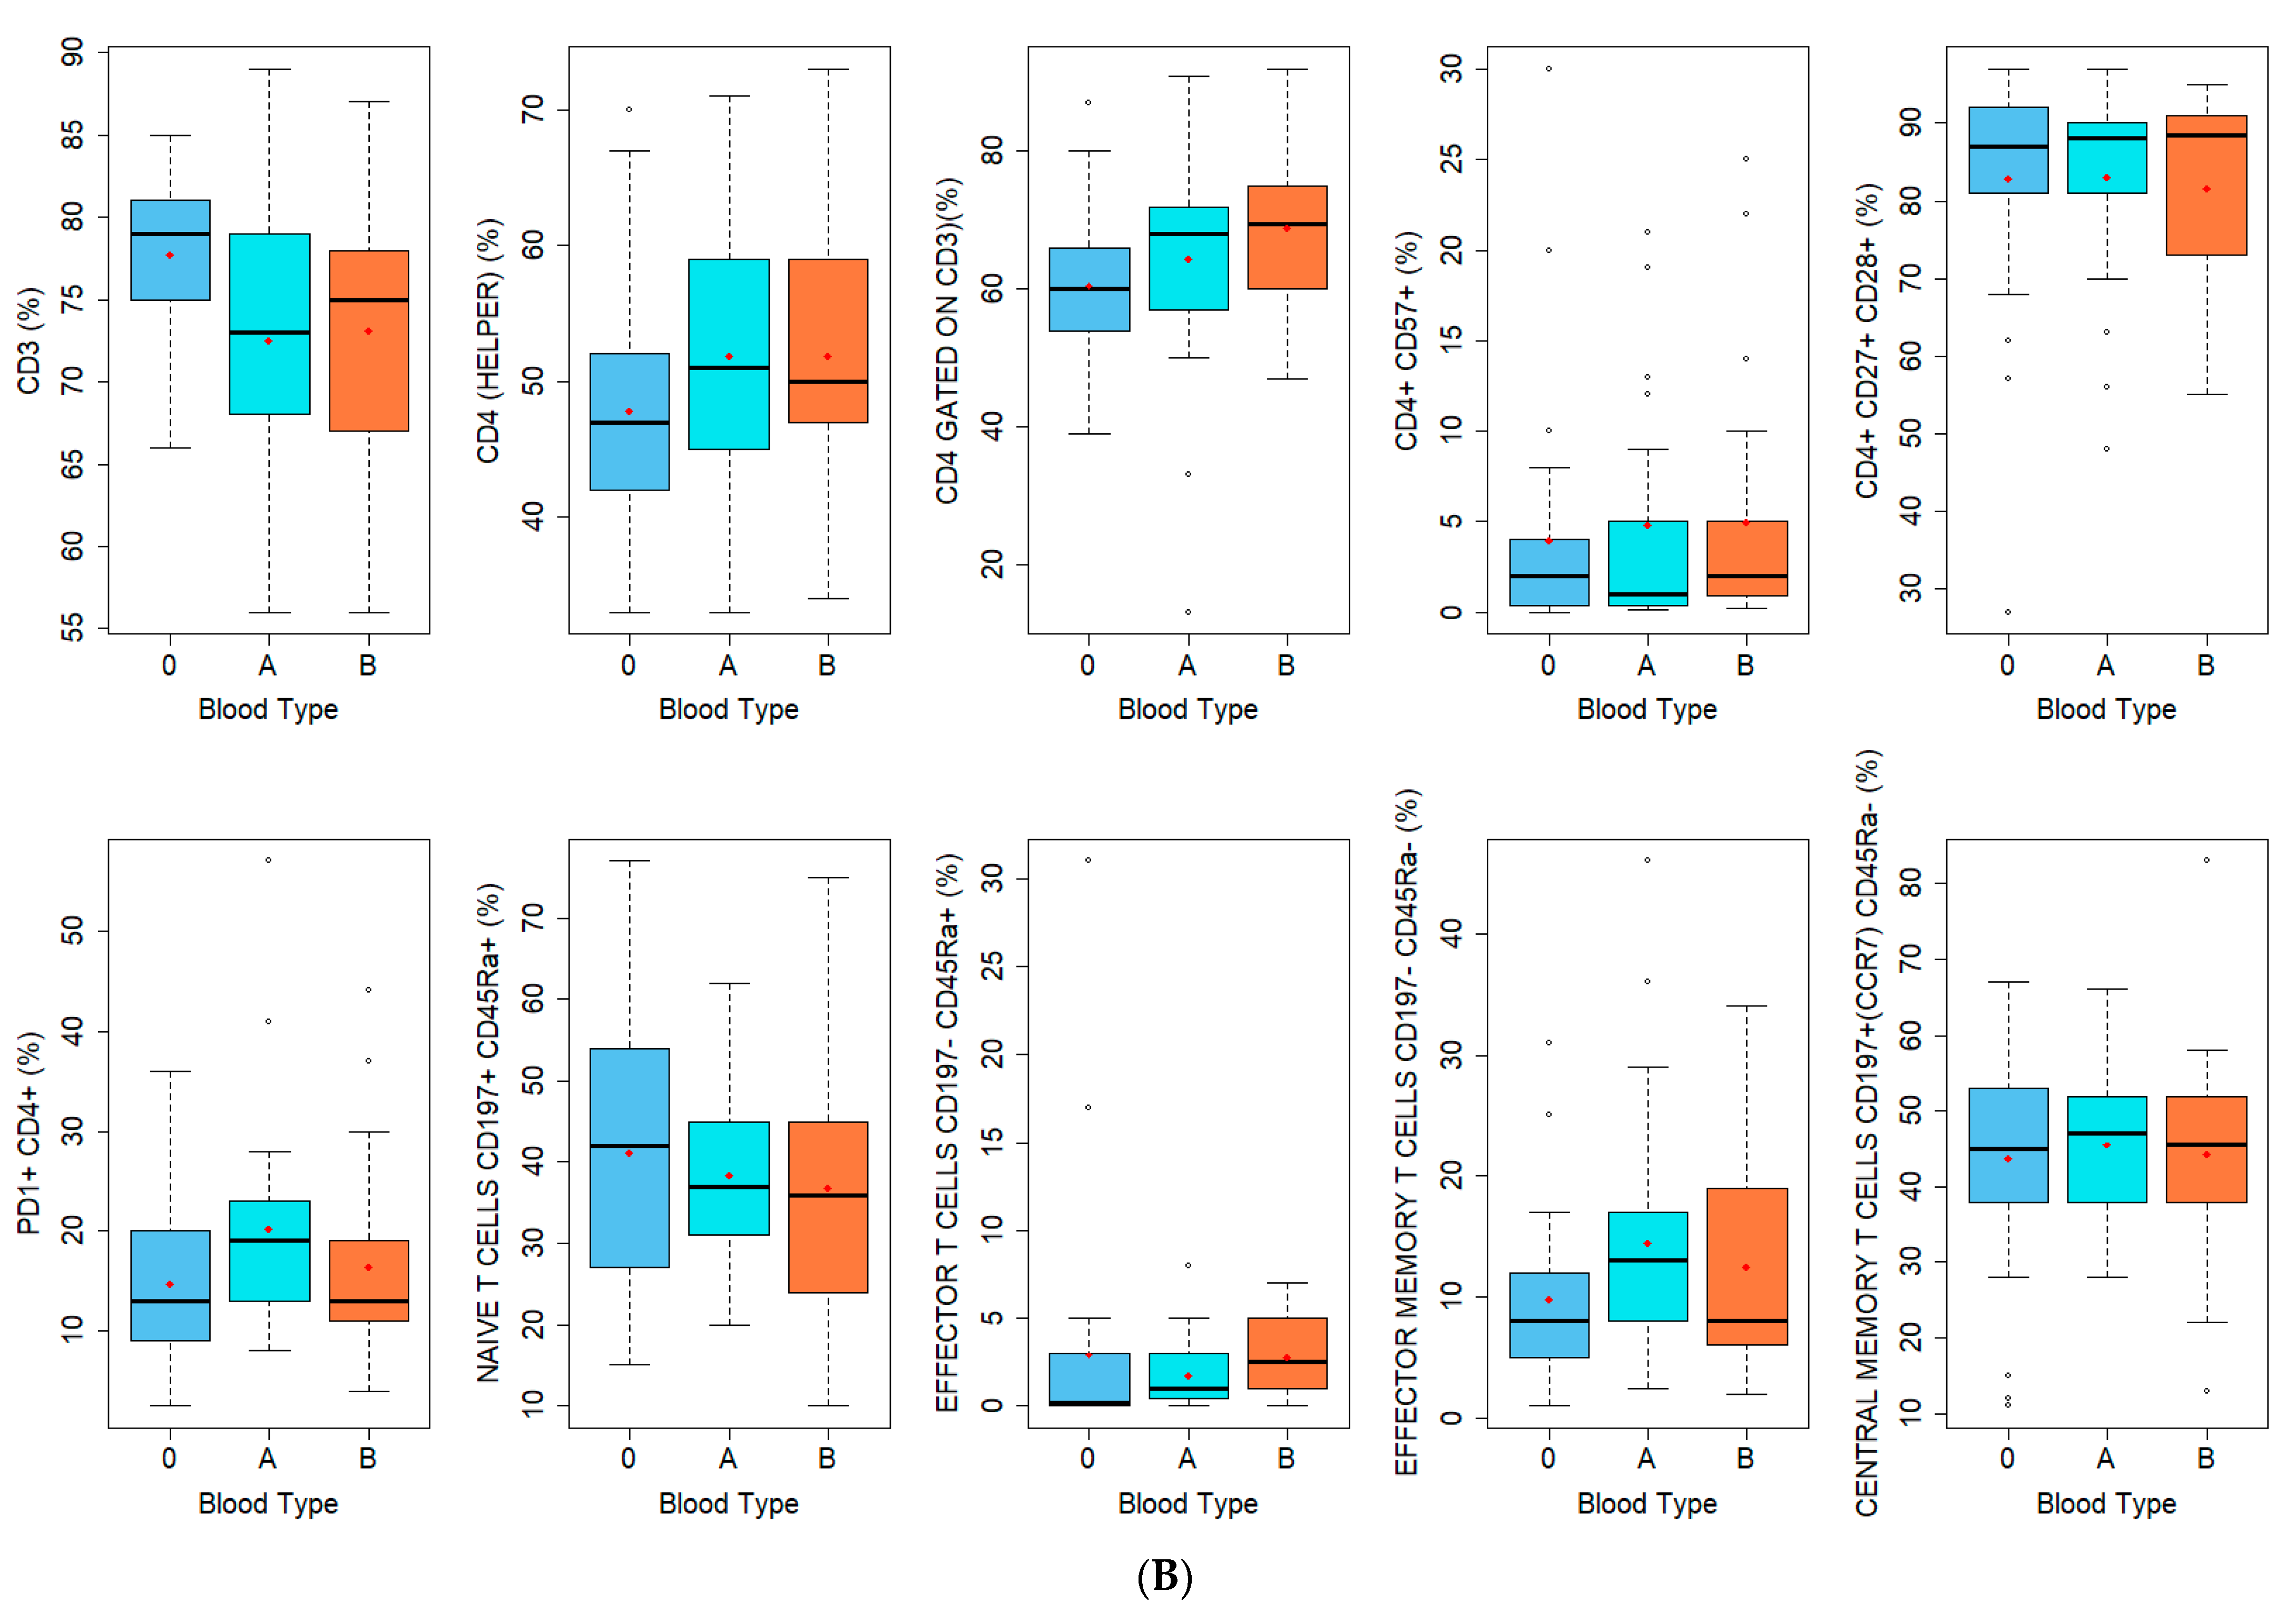
| Lymphocytes T CD4+ (%) | Lymphocytes T CD8+ (%) |
| CD3 | CD3 |
| CD4 (HELPER) | CD8 (CYTOTOXIC) |
| CD4 GATED ON CD3 | CD8 GATED ON CD3 |
| CD4+ CD57+ | CD8+ CD57+ |
| CD4+ CD27+ CD28+ | CD8+ CD27+ CD28+ |
| PD1+ CD4+ | PD1+ CD8+ |
| NAIVE T CELLS CD197+ CD45Ra+ | NAIVE T CELLS CD197+ CD45Ra+ |
| EFFECTOR T CELLS CD197− CD45Ra+ | EFFECTOR T CELLS CD197− CD45Ra+ |
| EFFECTOR MEMORY T CELLS CD197− CD45Ra- | EFFECTOR MEMORY T CELLS CD197− CD45Ra− |
| CENTRAL MEMORY T CELLS CD197+(CCR7) CD45Ra− | CENTRAL MEMORY T CELLS CD197+(CCR7) CD45Ra− |
| B | |
| Enrolled Population Variable | Study Population (N = 72) |
|---|---|
| Age | |
| Median (IQR) | 46.0 (20.0–64.0) |
| Sex | |
| F | 23 (31.9%) |
| M | 49 (68.1%) |
| Province of residence | |
| Benevento | 2 (2.8%) |
| Caserta | 64 (88.9%) |
| Napoli | 5 (6.9%) |
| Roma | 1 (1.4%) |
| Blood type | |
| A | 21 (29.2%) |
| B | 22 (30.6%) |
| 0 | 29 (40.3%) |
| Rhesus factor | |
| − | 6 (8.3%) |
| + | 66 (91.7%) |
| Previous SARS-CoV-2 infection | |
| Yes | 51 (70.8%) |
| No | 21 (29.2%) |
| Number of SARS-CoV-2 infection | |
| 0 | 22 (30.6%) |
| 1 | 47 (65.3%) |
| 2 | 3 (4.2%) |
| Doses of SARS-CoV-2 vaccine received | |
| 1 | 2 (2.8%) |
| 2 | 10 (13.9%) |
| 3 | 58 (80.6%) |
| 4 | 2 (4.8%) |
| Variables | Blood Type | p-Value | ||
|---|---|---|---|---|
| A | B | 0 | ||
| (N = 21) | (N = 22) | (N = 29) | ||
| Age | 0.355 | |||
| Mean (SD) | 44.9 (11.4) | 47.3 (11.6) | 42.6 (11.9) | |
| Sex | 0.503 | |||
| F | 8 (38.1%) | 8 (36.4%) | 7 (24.1%) | |
| M | 13 (61.9%) | 14 (63.6%) | 22 (75.9%) | |
| City of residence | 0.127 | |||
| Benevento | 0 (0%) | 0 (0%) | 2 (6.9%) | |
| Caserta | 20 (95.2%) | 21 (95.5%) | 23 (79.3%) | |
| Napoli | 0 (0%) | 1 (4.5%) | 4 (13.8%) | |
| Roma | 1 (4.8%) | 0 (0%) | 0 (0%) | |
| Previous SARS-CoV-2 infection | 0.340 | |||
| Yes | 17 (81.0%) | 16 (72.7%) | 18 (72.7%) | |
| No | 4 (19.0%) | 6 (27.3%) | 11 (27.3%) | |
| Number of SARS-CoV-2 infection | 0.390 | |||
| 0 | 4 (19.0%) | 6 (27.3%) | 11 (37.9%) | |
| 1 | 15 (71.4%) | 16 (72.7%) | 17 (58.6%) | |
| 2 | 2 (9.5%) | 0 (0%) | 1 (3.4%) | |
| Doses of SARS-CoV-2 vaccine received | 0.083 | |||
| 1 | 1 (4.8%) | 1 (4.5%) | 0 (0%) | |
| 2 | 6 (28.6%) | 1 (4.5%) | 3 (10.3%) | |
| 3 | 14 (66.7%) | 20 (90.9%) | 24 (82.8%) | |
| 4 | 0 (0%) | 0 (0%) | 2 (6.9%) | |
| White blood cells | ||||
| Lymphocytes % | 0.212 | |||
| Mean (SD) | 34.2 (8.4) | 32.9 (8.92) | 36.7 (6.9) | |
| Lymphocytes abs. count | 0.472 | |||
| Mean (SD) | 1.9 (0.67) | 2.0 (0.6) | 2.1 (0.6) | |
| Monocytes % | 0.761 | |||
| Mean (SD) | 6.3 (1.7) | 6.5 (1.3) | 6.7 (1.7) | |
| Monocytes abs. count | 0.284 | |||
| Mean (SD) | 0.7 (1.4) | 0.4 (0.1) | 0.4 (0.2) | |
| Granulocytes % | 0.593 | |||
| Mean (SD) | 58.1 (9.2) | 58.6 (8.3) | 56.4 (6.9) | |
| Granulocytes abs. count | 0.785 | |||
| Mean (SD) | 3.5 (1.4) | 3.7 (1.2) | 3.4 (1.3) | |
| Lymphocytes B Subpopulations (%) | Blood Type | p-Value | ||
|---|---|---|---|---|
| A | B | 0 | ||
| (N = 21) | (N = 22) | (N = 29) | ||
| CD19 | 0.111 | |||
| Median (IQR) | 9.0 (7.0–11.0) | 7.0 (6.0–8.8) | 8.0 (6.0–9.0) | |
| Naive B cells: IgD+ CD27− gated on CD19 | 0.437 | |||
| Median (IQR) | 55.0 (45.0–65.0) | 63.0 (57.0–68.8) | 64.0 (48.0–71.0) | |
| Marginal Zone B cells: IgD+ CD27+ gated on CD19 | 0.497 | |||
| Median (IQR) | 9.0 (4.0–13.0) | 6.0 (3.3–8.0) | 6.0 (4.0–12.0) | |
| B cells IgM+ IgD+ gated on CD19+ | 0.113 | |||
| Mean (SD) | 42.2 (19.4) | 37.2 (20.4) | 47.6 (13.0) | |
| CD27+ CD38− gated on IgM+ IgD+ (unswitched memory B cells) | 0.939 | |||
| Mean (SD) | 18.0 (8.0–20.0) | 16.0 (9.0–24.8) | 17.0 (9.0–25.0) | |
| CD38- CD27+ GATED ON IgM−IgD−(switched memory B cells) | 0.284 | |||
| Mean (SD) | 59.1 (14.6) | 50.5 (20.2) | 56.7 (19.7) | |
| CD38high CD27+ gated on IgD−IgM−(plasmablast) | 0.522 | |||
| Mean (SD) | 2.0 (1.0–6.0) | 1.5 (0.0–3.0) | 2.0 (0.0–4.0) | |
| Lymphocytes T Subpopulations (%) | Blood Type | p-Value * | ||
|---|---|---|---|---|
| A | B | 0 | ||
| (N = 21) | (N = 22) | (N = 29) | ||
| CD3 | 0.026 | |||
| Mean (SD) | 72.5 (8.94) | 73.1 (8.44) | 77.7 (4.93) | |
| CD4 (helper) | 0.219 | |||
| Mean (SD) | 51.9 (10.0) | 51.9 (9.3) | 47.8 (9.6) | |
| CD4 gated on CD3 | 0.044 | |||
| Median (IQR) | 68.0 (57.0–72.0) | 69.5 (60.0–74.0) | 60.0 (54.0–66.0) | |
| CD4+ CD57+ | 0.679 | |||
| Median (IQR) | 1.0 (0.4–5.0) | 2.0 (0.9–5.0) | 2.0 (0.4–4.0) | |
| CD4+ CD27+ CD28+ | 0.961 | |||
| Median (IQR) | 88.0 (81.0–90.0) | 88.5 (73.8–91.0) | 87.0 (81.0–92.0) | |
| PD1+ CD4+ | 0.090 | |||
| Median (IQR) | 19.0 (13.0–23.0) | 13.0 (11.0–18.8) | 13.0 (9.0–20.0) | |
| Naive T cells CD197+ CD45Ra+ CD4+ | 0.611 | |||
| Mean (IQR) | 38.4 (11.5) | 36.8 (17.6) | 41.1 (16.8) | |
| Effector T cells CD197−CD45Ra+ CD4+ | 0.061 | |||
| Median (IQR) | 1.0 (0.4–3.0) | 2.5 (1.0–4.5) | 0.2 (0.0–3.0) | |
| Effector memory T cells CD197− CD45Ra-CD4+ | 0.240 | |||
| Median (IQR) | 13.0 (8.0–17.0) | 8.0 (6.3–18.0) | 8.0 (5.0–12.0) | |
| Central memory T cells CD197+ (CCR7) CD45Ra- CD4+ | 0.980 | |||
| Median (IQR) | 47.0 (38.0–52.0) | 45.5 (38.8–51.8) | 45.0 (38.0–53.0) | |
| CD8 (cytotoxic) | <0.001 | |||
| Mean (SD) | 19.3 (7.5) | 20.5 (9.8) | 29.0 (10.8) | |
| CD8 gated on CD3 | 0.029 | |||
| Median (IQR) | 26.0 (20.0–35.0) | 26.5 (18.3–31.0) | 32.0 (28.0–39.0) | |
| CD8+ CD57+ | 0.541 | |||
| Median (IQR) | 22.0 (11.0–38.0) | 26.5 (17.0–45.5) | 26.0 (18.0–38.0) | |
| CD8+ CD27+ CD28+ | 0.769 | |||
| Mean (SD) | 55.2 (18.3) | 51.2 (18.5) | 52.9 (17.4) | |
| PD1+ CD8+ | 0.080 | |||
| Mean (SD) | 30.9 (14.7) | 22.7 (14.5) | 30.3 (11.3) | |
| Naive T cells CD197+ CD45Ra+ CD8+ | 0.483 | |||
| Median (IQR) | 31.0 (28.0–41.0) | 26.0 (10.5–45.5) | 30.0 (20.0–50.0) | |
| Effector T cells CD197−CD45Ra+ CD8+ | 0.783 | |||
| Median (IQR) | 25.0 (13.0–40.0) | 28.0 (19.3–41.5) | 28.0 (17.0–46.0) | |
| Effector memory T cells CD197− CD45Ra− CD8+ | 0.294 | |||
| Median (IQR) | 18.0 (15.0–27.0) | 18.5 (13.0–24.0) | 16.0 (11.0–20.0) | |
| Central memory T cells CD197+ (CCR7) CD45Ra− CD8+ | 0.177 | |||
| Median (IQR) | 13.0 (10.0–16.0) | 12.0 (10.0–19.8) | 9.0 (7.0–12.0) | |
Disclaimer/Publisher’s Note: The statements, opinions and data contained in all publications are solely those of the individual author(s) and contributor(s) and not of MDPI and/or the editor(s). MDPI and/or the editor(s) disclaim responsibility for any injury to people or property resulting from any ideas, methods, instructions or products referred to in the content. |
© 2024 by the authors. Licensee MDPI, Basel, Switzerland. This article is an open access article distributed under the terms and conditions of the Creative Commons Attribution (CC BY) license (https://creativecommons.org/licenses/by/4.0/).
Share and Cite
Di Domenico, M.; Serretiello, E.; Smimmo, A.; Vieira e Silva, F.F.; Raimondi, S.A.; Pascariello, C.; Marino, M.M.; Lo Muzio, L.; Caponio, V.C.A.; Cantore, S.; et al. Monitoring of Immune Memory by Phenotypical Lymphocyte Subsets Identikit: An Observational Study in a Blood Donors’ Cohort. J. Pers. Med. 2024, 14, 733. https://doi.org/10.3390/jpm14070733
Di Domenico M, Serretiello E, Smimmo A, Vieira e Silva FF, Raimondi SA, Pascariello C, Marino MM, Lo Muzio L, Caponio VCA, Cantore S, et al. Monitoring of Immune Memory by Phenotypical Lymphocyte Subsets Identikit: An Observational Study in a Blood Donors’ Cohort. Journal of Personalized Medicine. 2024; 14(7):733. https://doi.org/10.3390/jpm14070733
Chicago/Turabian StyleDi Domenico, Marina, Enrica Serretiello, Annafrancesca Smimmo, Fábio França Vieira e Silva, Sonia Anna Raimondi, Caterina Pascariello, Maria Michela Marino, Lorenzo Lo Muzio, Vito Carlo Alberto Caponio, Stefania Cantore, and et al. 2024. "Monitoring of Immune Memory by Phenotypical Lymphocyte Subsets Identikit: An Observational Study in a Blood Donors’ Cohort" Journal of Personalized Medicine 14, no. 7: 733. https://doi.org/10.3390/jpm14070733