
Point of Care Ultrasound (POCUS) in the Management of Heart Failure: A Narrative Review

Abstract
:1. Introduction
2. Cardiac Ultrasound
3. Lung Ultrasound (LUS)
4. Inferior Vena Cava (IVC) Ultrasound
5. Internal Jugular Vein (IJV) Ultrasound
6. Venous Doppler and Venous Excess Grading Ultrasound (VExUS)
7. Discussion
Author Contributions
Funding
Institutional Review Board Statement
Informed Consent Statement
Data Availability Statement
Conflicts of Interest
References
- Bozkurt, B.; Ahmad, T.; Alexander, K.M.; Baker, W.L.; Bosak, K.; Breathett, K.; Fonarow, G.C.; Heidenreich, P.; Ho, J.E.; Hsich, E.; et al. Heart Failure Epidemiology and Outcomes Statistics: A Report of the Heart Failure Society of America. J. Card. Fail. 2023, 29, 1412–1451. [Google Scholar] [CrossRef] [PubMed]
- Koratala, A.; Kazory, A. Point of Care Ultrasonography for Objective Assessment of Heart Failure: Integration of Cardiac, Vascular, and Extravascular Determinants of Volume Status. Cardiorenal Med. 2021, 11, 5–17. [Google Scholar] [CrossRef] [PubMed]
- Pellicori, P.; Platz, E.; Dauw, J.; ter Maaten, J.M.; Martens, P.; Pivetta, E.; Cleland, J.G.; McMurray, J.J.; Mullens, W.; Solomon, S.D.; et al. Ultrasound imaging of congestion in heart failure: Examinations beyond the heart. Eur. J. Heart Fail. 2021, 23, 703–712. [Google Scholar] [CrossRef] [PubMed]
- Heidenreich, P.A.; Bozkurt, B.; Aguilar, D.; Allen, L.A.; Byun, J.J.; Colvin, M.M.; Deswal, A.; Drazner, M.H.; Dunlay, S.M.; Evers, L.R.; et al. 2022 AHA/ACC/HFSA Guideline for the Management of Heart Failure: A Report of the American College of Cardiology/American Heart Association Joint Committee on Clinical Practice Guidelines. Circulation 2022, 145, E895–E1032. [Google Scholar] [CrossRef] [PubMed]
- Pellicori, P.; Kallvikbacka-Bennett, A.; Khaleva, O.; Carubelli, V.; Costanzo, P.; Castiello, T.; Wong, K.; Zhang, J.; Cleland, J.G.F.; Clark, A.L. Global longitudinal strain in patients with suspected heart failure and a normal ejection fraction: Does it improve diagnosis and risk stratification? Int. J. Cardiovasc. Imaging 2014, 30, 69–79. [Google Scholar] [CrossRef]
- Hall, M.K.; Coffey, E.C.; Herbst, M.; Liu, R.; Pare, J.R.; Taylor, R.A.; Thomas, S.; Moore, C.L. The “5Es” of Emergency Physician–performed Focused Cardiac Ultrasound: A Protocol for Rapid Identification of Effusion, Ejection, Equality, Exit, and Entrance. Acad. Emerg. Med. 2015, 22, 583–593. [Google Scholar] [CrossRef] [PubMed]
- Nagueh, S.F.; Smiseth, O.A.; Appleton, C.P.; Byrd, B.F., 3rd; Dokainish, H.; Edvardsen, T.; Flachskampf, F.A.; Gillebert, T.C.; Klein, A.L.; Lancellotti, P.; et al. Recommendations for the Evaluation of Left Ventricular Diastolic Function by Echocardiography: An Update from the American Society of Echocardiography and the European Association of Cardiovascular Imaging. J. Am. Soc. Echocardiogr. 2016, 29, 277–314. [Google Scholar] [CrossRef] [PubMed]
- Simioniuc, A.; Carluccio, E.; Ghio, S.; Rossi, A.; Biagioli, P.; Reboldi, G.; Galeotti, G.G.; Lu, F.; Zara, C.; Whalley, G.; et al. Echo and natriuretic peptide guided therapy improves outcome and reduces worsening renal function in systolic heart failure: An observational study of 1137 outpatients. Int. J. Cardiol. 2016, 224, 416–423. [Google Scholar] [CrossRef] [PubMed]
- Fletcher, A.J.; Robinson, S.; Rana, B.S. Echocardiographic RV-E/e′ for predicting right atrial pressure: A review. Echo Res. Pract. 2020, 7, R11–R20. [Google Scholar] [CrossRef]
- Lichtenstein, D.A.; Mezière, G.A.; Lagoueyte, J.-F.; Biderman, P.; Goldstein, I.; Gepner, A. A-lines and B-lines: Lung ultrasound as a bedside tool for predicting pulmonary artery occlusion pressure in the critically ill. Chest 2009, 136, 1014–1020. [Google Scholar] [CrossRef]
- Imanishi, J.; Maeda, T.; Ujiro, S.; Masuda, M.; Kusakabe, Y.; Takemoto, M.; Fujimoto, W.; Kuroda, K.; Yamashita, S.; Iwasaki, M.; et al. Association between B-lines on lung ultrasound, invasive haemodynamics, and prognosis in acute heart failure patients. Eur. Heart J. Acute Cardiovasc. Care 2022, 12, 115–123. [Google Scholar] [CrossRef] [PubMed]
- Coiro, S.; Rossignol, P.; Ambrosio, G.; Carluccio, E.; Alunni, G.; Murrone, A.; Tritto, I.; Zannad, F.; Girerd, N. Prognostic value of residual pulmonary congestion at discharge assessed by lung ultrasound imaging in heart failure. Eur. J. Heart Fail. 2015, 17, 1172–1181. [Google Scholar] [CrossRef] [PubMed]
- Dubón-Peralta, E.E.; Lorenzo-Villalba, N.; García-Klepzig, J.L.; Andrès, E.; Méndez-Bailon, M. Prognostic value of B lines detected with lung ultrasound in acute heart failure. A systematic review. J. Clin. Ultrasound 2022, 50, 273–283. [Google Scholar] [CrossRef]
- Mhanna, M.; Beran, A.; Nazir, S.; Sajdeya, O.; Srour, O.; Ayesh, H.; A Eltahawy, E. Lung ultrasound–guided management to reduce hospitalization in chronic heart failure: A systematic review and meta-analysis. Heart Fail. Rev. 2022, 27, 821–826. [Google Scholar] [CrossRef] [PubMed]
- Li, Y.; Ai, H.; Ma, N.; Li, P.; Ren, J. Lung ultrasound-guided treatment for heart failure: An updated meta-analysis and trial sequential analysis. Front. Cardiovasc. Med. 2022, 9, 943633. [Google Scholar] [CrossRef] [PubMed]
- Curbelo, J.; Aguilera, M.; Rodriguez-Cortes, P.; Gil-Martinez, P.; Fernandez, C.S. Usefulness of inferior vena cava ultrasonography in outpatients with chronic heart failure. Clin. Cardiol. 2018, 41, 510–517. [Google Scholar] [CrossRef] [PubMed]
- Pellicori, P.; Shah, P.; Cuthbert, J.; Urbinati, A.; Zhang, J.; Kallvikbacka-Bennett, A.; Clark, A.L.; Cleland, J.G. Prevalence, pattern and clinical relevance of ultrasound indices of congestion in outpatients with heart failure. Eur. J. Heart Fail. 2019, 21, 904–916. [Google Scholar] [CrossRef]
- Hossein-Nejad, H.; Mohammadinejad, P.; Ahmadi, F. Internal jugular vein/common carotid artery cross-sectional area ratio and central venous pressure. J. Clin. Ultrasound 2016, 44, 312–318. [Google Scholar] [CrossRef]
- Wang, L.; Harrison, J.; Dranow, E.; Aliyev, N.; Khor, L. Accuracy of Ultrasound Jugular Venous Pressure Height in Predicting Central Venous Congestion. Ann. Intern. Med. 2022, 175, 344–351. [Google Scholar] [CrossRef]
- Vaidya, G.N.; Ghafghazi, S. Correlation of internal jugular and subclavian vein diameter variation on bedside ultrasound with invasive right heart catheterization. Indian Heart J. 2021, 73, 231–235. [Google Scholar] [CrossRef]
- Beaubien-Souligny, W.; Rola, P.; Haycock, K.; Bouchard, J.; Lamarche, Y.; Spiegel, R.; Denault, A.Y. Quantifying systemic congestion with Point-Of-Care ultrasound: Development of the venous excess ultrasound grading system. Ultrasound J. 2020, 12, 16. [Google Scholar] [CrossRef] [PubMed]
- Beigel, R.; Cercek, B.; Arsanjani, R.; Siegel, R.J. Echocardiography in the use of noninvasive hemodynamic monitoring. J. Crit. Care 2014, 29, 184.e1–184.e8. [Google Scholar] [CrossRef] [PubMed]
- Lindenfeld, J.; Costanzo, M.R.; Zile, M.R.; Ducharme, A.; Troughton, R.; Maisel, A.; Mehra, M.R.; Paul, S.; Sears, S.F.; Smart, F.; et al. Implantable Hemodynamic Monitors Improve Survival in Patients With Heart Failure and Reduced Ejection Fraction. J. Am. Coll. Cardiol. 2024, 83, 682–694. [Google Scholar] [CrossRef] [PubMed]
- Rao, S.D.; Adusumalli, S.; Mazurek, J.A. Pulmonary Hypertension in Heart Failure Patients. Card. Fail. Rev. 2020, 6, e05. [Google Scholar] [CrossRef] [PubMed]
- Stevenson, L.W.; Zile, M.; Bennett, T.D.; Kueffer, F.J.; Jessup, M.L.; Adamson, P.; Abraham, W.T.; Manda, V.; Bourge, R.C. Chronic Ambulatory Intracardiac Pressures and Future Heart Failure Events. Circ. Heart Fail. 2010, 3, 580–587. [Google Scholar] [CrossRef] [PubMed]
- Stevenson, L.W.; Ross, H.J.; Rathman, L.D.; Boehmer, J.P. Remote Monitoring for Heart Failure Management at Home. J. Am. Coll. Cardiol. 2023, 81, 2272–2291. [Google Scholar] [CrossRef] [PubMed]
- Patel, N.; Durland, J.; Awosika, A.O.; Makaryus, A.N. Physiology, Cardiac Index; StatPearls Publishing: Treasure Island, FL, USA, 2024. [Google Scholar]
- Maw, A.M.; Hassanin, A.; Ho, P.M.; McInnes, M.D.F.; Moss, A.; Juarez-Colunga, E.; Soni, N.J.; Miglioranza, M.H.; Platz, E.; DeSanto, K.; et al. Diagnostic Accuracy of Point-of-Care Lung Ultrasonography and Chest Radiography in Adults With Symptoms Suggestive of Acute Decompensated Heart Failure: A Systematic Review and Meta-analysis. JAMA Netw. Open 2019, 2, e190703. [Google Scholar] [CrossRef] [PubMed]
- Glockner, E.; Wening, F.; Christ, M.; Dechene, A.; Singler, K. Lung Ultrasound Eight-Point Method in Diagnosing Acute Heart Failure in Emergency Patients with Acute Dyspnea: Diagnostic Accuracy and 72 h Monitoring. Medicina 2020, 56, 379. [Google Scholar] [CrossRef] [PubMed]
- Lang, R.M.; Badano, L.P.; Mor-Avi, V.; Afilalo, J.; Armstrong, A.; Ernande, L.; Flachskampf, F.A.; Foster, E.; Goldstein, S.A.; Kuznetsova, T.; et al. Recommendations for Cardiac Chamber Quantification by Echocardiography in Adults: An Update from the American Society of Echocardiography and the European Association of Cardiovascular Imaging. J. Am. Soc. Echocardiogr. 2015, 28, 1–39.e14. [Google Scholar] [CrossRef]
- Rudski, L.G.; Lai, W.W.; Afilalo, J.; Hua, L.; Handschumacher, M.D.; Chandrasekaran, K.; Solomon, S.D.; Louie, E.K.; Schiller, N.B. Guidelines for the echocardiographic assessment of the right heart in adults: A report from the American Society of Echocardiography endorsed by the European Association of Echocardiography, a registered branch of the European Society of Cardiology, and the Canadian Society of Echocardiography. J. Am. Soc. Echocardiogr. 2010, 23, 685–713; quiz 786–788. [Google Scholar] [CrossRef]
- Burgos, L.M.; Vila, R.B.; Goyeneche, A.; Muñoz, F.; Spaccavento, A.; Fasan, M.A.; Ballari, F.; Vivas, M.; Riznyk, L.; Ghibaudo, S.; et al. Design and rationale of the inferior vena CAVA and Lung UltraSound-guided therapy in Acute Heart Failure (CAVAL US-AHF Study): A randomised controlled trial. Open Heart 2022, 9, e002105. [Google Scholar] [CrossRef] [PubMed]
- Pellicori, P.; Kallvikbacka-Bennett, A.; Dierckx, R.; Zhang, J.; Putzu, P.; Cuthbert, J.; Boyalla, V.; Shoaib, A.; Clark, A.L.; Cleland, J.G.F. Prognostic significance of ultrasound-assessed jugular vein distensibility in heart failure. Heart 2015, 101, 1149–1158. [Google Scholar] [CrossRef] [PubMed]
- Pellicori, P.; Kallvikbacka-Bennett, A.; Zhang, J.; Khaleva, O.; Warden, J.; Clark, A.L.; Cleland, J.G. Revisiting a classical clinical sign: Jugular venous ultrasound. Int. J. Cardiol. 2014, 170, 364–370. [Google Scholar] [CrossRef] [PubMed]
- Duarte, K.; Monnez, J.-M.; Albuisson, E.; Pitt, B.; Zannad, F.; Rossignol, P. Prognostic Value of Estimated Plasma Volume in Heart Failure. JACC Heart Fail. 2015, 3, 886–893. [Google Scholar] [CrossRef] [PubMed]
- Felker, G.M.; Ahmad, T.; Anstrom, K.J.; Adams, K.F.; Cooper, L.S.; Ezekowitz, J.A.; Fiuzat, M.; Houston-Miller, N.; Januzzi, J.L.; Leifer, E.S.; et al. Rationale and design of the GUIDE-IT study: Guiding Evidence Based Therapy Using Biomarker Intensified Treatment in Heart Failure. JACC Heart Fail. 2014, 2, 457–465. [Google Scholar] [CrossRef] [PubMed]
- Ibrahim, N.E.; Januzzi, J.L. The Future of Biomarker-Guided Therapy for Heart Failure After the Guiding Evidence-Based Therapy Using Biomarker Intensified Treatment in Heart Failure (GUIDE-IT) Study. Curr. Heart Fail. Rep. 2018, 15, 37–43. [Google Scholar] [CrossRef]
- Núñez-Ramos, J.A.; Aguirre-Acevedo, D.C.; Pana-Toloza, M.C. Point of care ultrasound impact in acute heart failure hospitalization: A retrospective cohort study. Am. J. Emerg. Med. 2023, 66, 141–145. [Google Scholar] [CrossRef] [PubMed]
- Nakao, S.; Vaillancourt, C.; Taljaard, M.; Nemnom, M.-J.; Woo, M.Y.; Stiell, I.G. Evaluating the impact of point-of-care ultrasonography on patients with suspected acute heart failure or chronic obstructive pulmonary disease exacerbation in the emergency department: A prospective observational study. CJEM 2020, 22, 342–349. [Google Scholar] [CrossRef] [PubMed]
- Platz, E.; Campbell, R.T.; Claggett, B.; Lewis, E.F.; Groarke, J.D.; Docherty, K.F.; Lee, M.M.; Merz, A.A.; Silverman, M.; Swamy, V.; et al. Lung Ultrasound in Acute Heart Failure: Prevalence of Pulmonary Congestion and Short- and Long-Term Outcomes. JACC Heart Fail. 2019, 7, 849–858. [Google Scholar] [CrossRef]
- Rastogi, T.; Gargani, L.; Pellicori, P.; Lamiral, Z.; Ambrosio, G.; Bayés-Genis, A.; Domingo, M.; Lupon, J.; Simonovic, D.; Pugliese, N.R.; et al. Prognostic implication of lung ultrasound in heart failure: A pooled analysis of international cohorts. Eur. Heart J. Cardiovasc. Imaging 2024, 2024, jeae099. [Google Scholar] [CrossRef]
- Zisis, G.; Yang, Y.; Huynh, Q.; Whitmore, K.; Lay, M.; Wright, L.; Carrington, M.J.; Marwick, T.H. Nurse-Provided Lung and Inferior Vena Cava Assessment in Patients with Heart Failure. J. Am. Coll. Cardiol. 2022, 80, 513–523. [Google Scholar] [CrossRef] [PubMed]


| Study | Study Type | POCUS Intervention | Population | Objective | Sample Size | Results |
|---|---|---|---|---|---|---|
| Transthoracic Echocardiography | ||||||
| Simioniuc et al., 2016 [8] | Retrospective cohort | Doppler echocardiography: mitral inflow velocities | Outpatient HF patients | Outcomes and renal function in outpatients with HFrEF who received echocardiography/BNP-guided therapy vs. standard of care | n = 1137 | Decreased mortality in the echo–BNP group (HR 0.45, 95%CI: 0.30–0.67, p < 0.0001) and decreased rates of renal dysfunction (HR 0.49, 95%CI 0.36–0.67, p < 0.0001). |
| Fletcher et al., 2020 [9] | Systematic review | Tricuspid inflow velocities | Patients with valvular disease, altered RV systolic function, recent cardiac surgery, acute heart failure, heart transplant, pulmonary hypertension, atrial fibrillation | Strength of correlation between E/e’ and RAP | 17 articles | Consistent positive correlation between E/e’ and RAP in patients with reduced RV systolic function; equivocal support correlating E/e’ and RAP in heart failure patients. |
| Lung US | ||||||
| Lichtenstein et al., 2009 [10] | Prospective observational | Lung US | Mechanically ventilated ICU patients | Association between A-line pattern and PCWP | n = 102 | A-line predominant lung pattern had 90% specificity, 67% sensitivity, 91% positive predictive value, and 65% negative predictive value for diagnosing a PCWP ≤13 mm Hg. |
| Imanishi et al., 2022 [11] | Prospective cohort | 8-zone lung US | Acute HF patients | Association between B-line pattern and PCWP | n = 116 | 1. Clear transition point where PCWP correlated with sudden increase in B-lines: HFrEF, at PCWP = 25 (Δ of 23 B-lines); HFpEF, at PCWP = 19 (Δ of 8 B-lines). 2. Greater than 6 B-lines at discharge resulted in higher risk for cardiac events (HR 12.6, 95% CI: 4.71–33.7; log-rank, p < 0.0001). |
| Coiro et al., 2015 [12] | Prospective cohort | 28-zone lung US at discharge | Acute HF patients | Association between B-line pattern and event free survival (all-cause death or HF hospitalization) | n = 60 | Three-month event-free survival: 27 ± 10% in patients with ≥30 B-lines and 88% ± 5% in those with < 30 B-lines (p < 0.0001). |
| Dubón-Peralta et al., 2022 [13] | Systematic review | Lung US | Acute HF patients | Association between B-line number and hospital readmission/mortality | 14 studies | 1. More than 30–40 B-lines at admission were a risk factor for readmission or mortality. 2. Persistent B-lines >15 was also a risk factor for readmission or mortality. |
| Mhanna et al., 2022 [14] | Systematic review and meta-analysis | Lung US-guided diuresis | Outpatient HF patients | HF hospitalization rates and all-cause mortality in HF patients undergoing LUS-guided diuresis vs. standard of care | 493 patients across three studies | No significant difference in the rates of heart failure hospitalization between the two groups (RR 0.65; 95% CI 0.34–1.22; p = 0.18). No significant difference in all-cause mortality (RR 1.39; 95% CI 0.68–2.82; p = 0.37). |
| Li et al., 2022 [15] | Meta analysis | Lung US-guided diuresis | Outpatient HF patients | Effect of LUS-guided treatment vs. usual care in reducing the major adverse cardiac event (MACE) rate in patients with HF | 1203 patients over ten RCT studies | LUS-guided treatment group was associated with a significantly lower risk of MACE compared to standard of care (RR, 0.59; 95% CI: 0.48–0.71; p < 0.001). |
| Other POCUS | ||||||
| CAVA-ADHF (NCT03140566) | RCT | IVC-guided diuresis | Acute HF patients | IVC US measurement compared to clinical assessment to guide diuresis | n = 388 | Unavailable |
| JECICA (NCT02892227) | RCT | Cardiac and IVC US | Acute HF patients | Determine if mitral inflow velocities and IVC measurements taken daily will decrease 30-day readmission | n = 250 | Unavailable |
| CAVAL US-AHF (NCT04549701) | RCT | IVC and lung US | Acute HF patients | Determine if IVC and LUS decrease subclinical congestion at discharge | n = 58 | Unavailable |
| Curbello et al., 2018 [16] | Prospective cohort | IVC collapsibility index | Outpatient HF patients | Association of IVC collapsibility index and worsening HF | n = 95 | IVCCI <30% and worsening HF: HR of 2.8 (95% CI: 1.3–6.2); IVCCI <30% and hospitalization: HR was 13.9 (95% CI: 1.7–113.0); all-cause mortality—no statistically significant difference. |
| Pellicori et al., 2019 [17] | Prospective observational | Lung US/IVC US/IJV US and JVD ratio | Outpatient HF patients | Prevalence and clinical significance of subclinical congestion (assessed by ultrasound) in outpatient HF patients | n = 203 | High levels of N-terminal pro-B-type natriuretic peptide, large IVC diameter, and low JVD ratio were associated with increased hospitalizations/death. |
| Hossein-Nejad et al., 2016 [18] | Prospective observational | IJV ultrasound: IJV/CCA ratio | Inpatients who underwent central venous catheterization to monitor CVP | Strength of correlation between IJV/CCA and CVP | n = 52 | 1. Significant correlation between IJV/CCA ratio and CVP at inspiration (r = 0.728, p < 0.0001) and expiration (r = 0.736, p < 0.0001 at expiration). 2. For predicting a CVP <10, IJV/CCA ratio had a sensitivity of 90%, specificity of 86.36%, PPV of 90%, and NPV of 86.36%. |
| Wang et al., 2022 [19] | Prospective observational | Upright JVP assessment (uJVP) | Adult patients undergoing right heart catheterization for heart failure indications | Strength of correlation between upright assessment of JVP with ultrasound and RAP | n = 100 | uJVP assessment was 94.6% specific for predicting elevated RAP. |
| Vaidya et al., 2021 [20] | Prospective cohort | IJV respiratory variation diameter and collapsibility | Heart failure patients undergoing right heart catheterization | Strength of correlation between respiratory variation diameter [(Dmax − Dmin)/Dmax] and IJV collapsibility with RAP | n = 72 | 1. RAP >10 had decreased respiratory variation diameter (14% vs. 40% for IJV, p = 0.001) and reduced chance of total collapsibility with sniff (16% vs. 66%, p = 0.001). 2. No complete IJV collapsibility had an 84% sensitivity for elevated RAP. |
| Beaubien-Souligny et al., 2020 [21] | Prospective observational | Hepatic, portal, intra-renal vein Doppler and IVC ultrasound | Cardiac surgery patients | To create a venous excess grading system using ultrasound markers to quantify systemic congestion; association of each grade in the system with AKI | n = 145 | Significant association between AKI and severe venous congestion grade—defined as IVC >2 and presence of severe flow abnormalities on multiple Doppler patterns (HR: 3.69 CI 1.65–8.24 p = 0.001). |
| Modality | Measure | Normal Range | Interpretation | Limitations |
|---|---|---|---|---|
| Cardiac Ultrasound | ||||
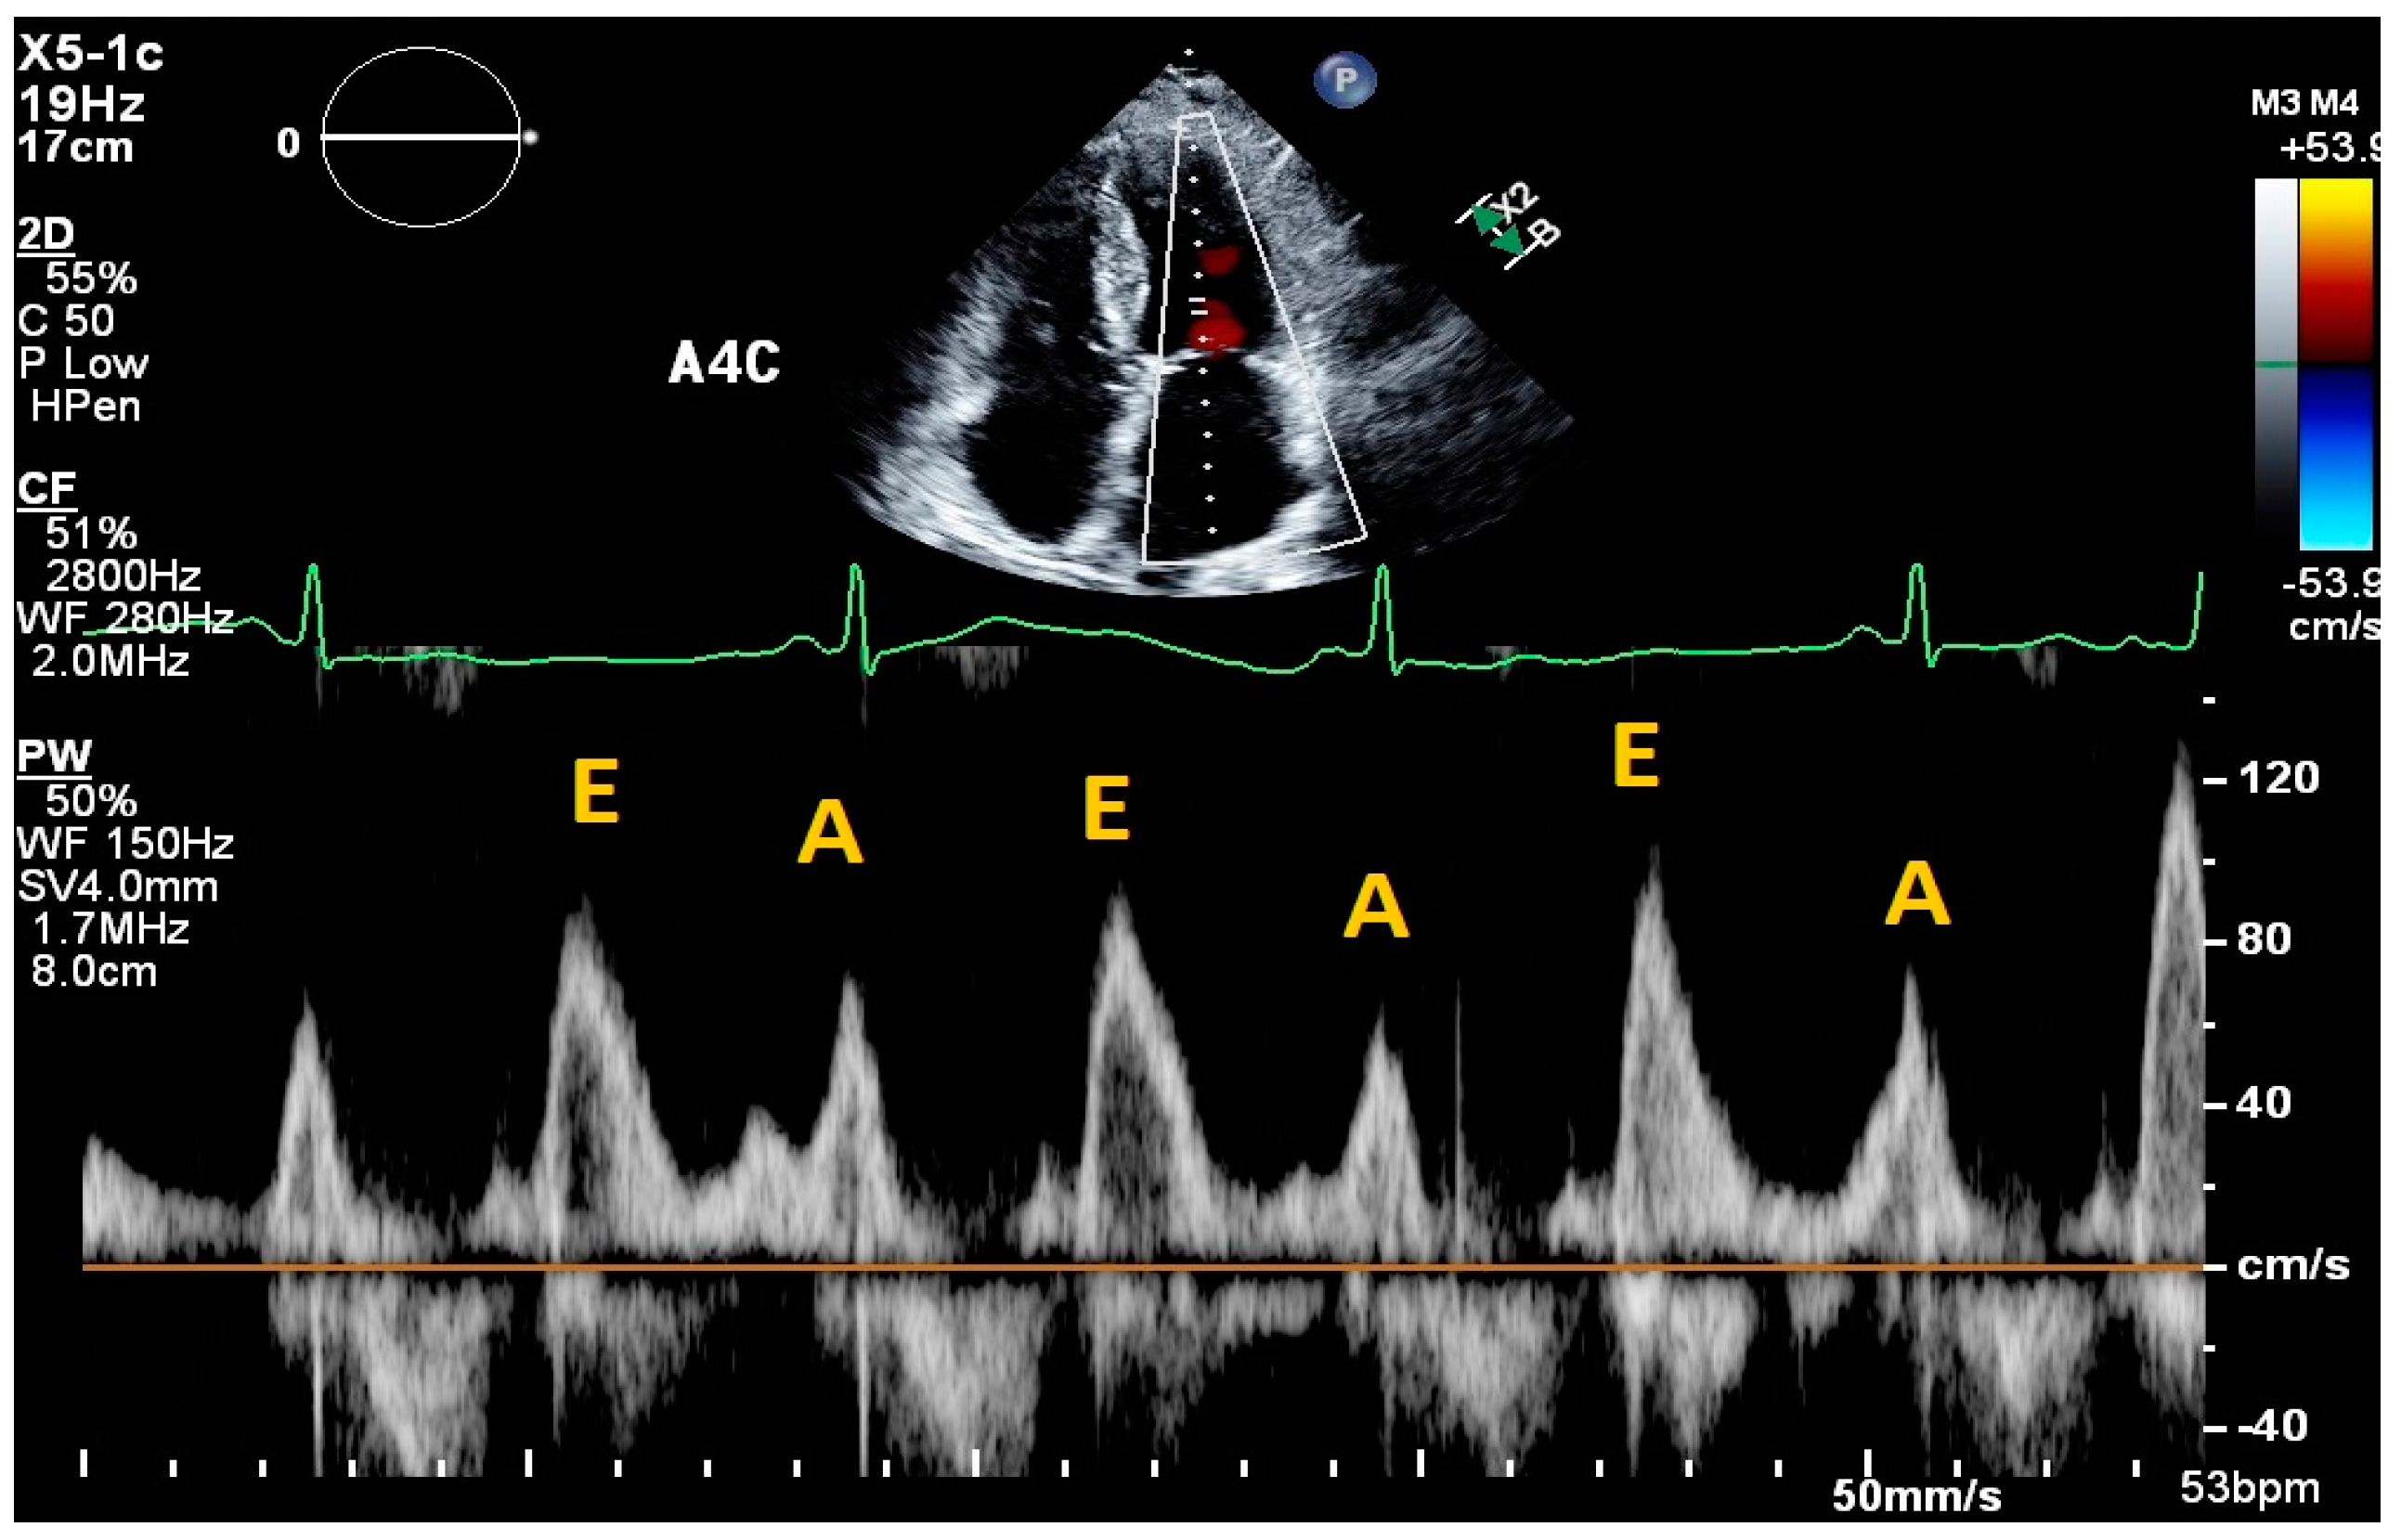
| Mitral E/e’ ratio estimated from the E wave velocity of the mitral inflow Doppler envelope and the tissue Doppler e’ wave velocity at the mitral annulus (septal and/or lateral) | E/e’ ≤ 14 |
|
| |
| DT in the mitral inflow Doppler envelope | 160–200 ms |
|
| |
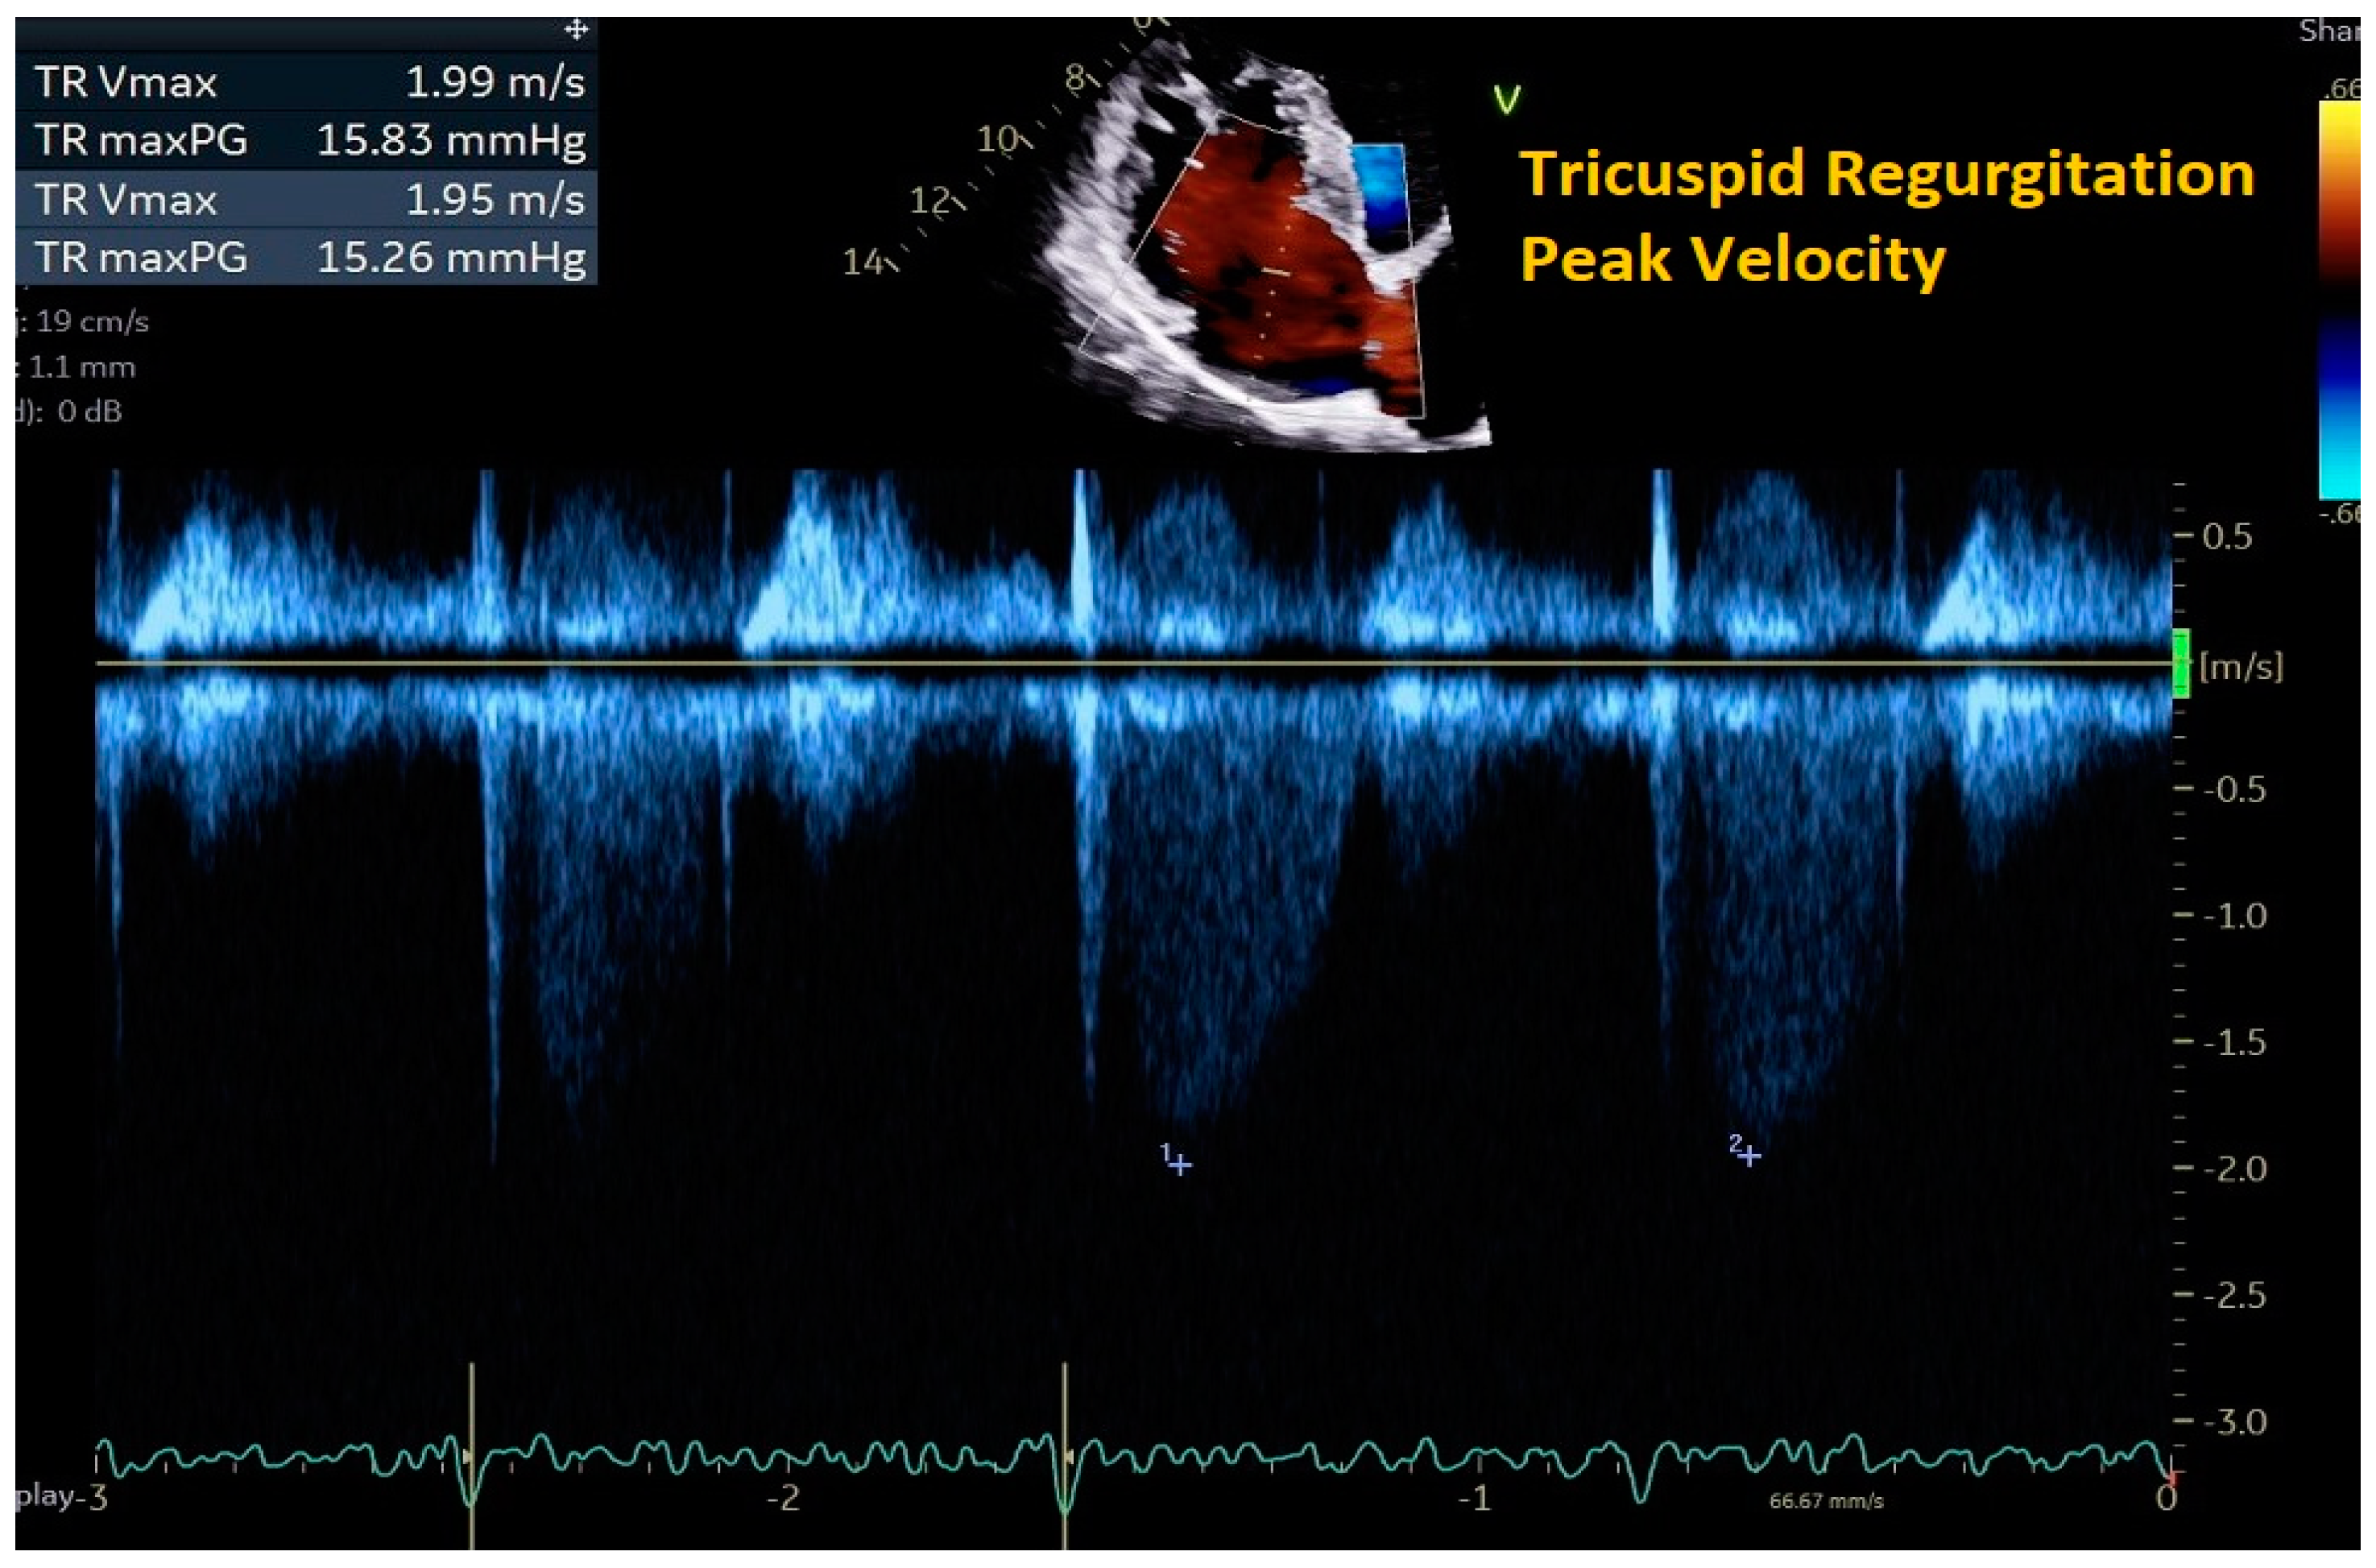
| Peak velocity of the TR jet | ≤2/8 m/s |
|
| |
| Estimated PASP using TR jet plus estimated RAP from IVC assessment | ≤35 mmHg |
|
| |
| IVC Ultrasound | ||||
| Inferior vena cava (IVC) diameter and collapsibility with inspiration | Diameter <21 mm that collapses >50% with sniff |
|
| |
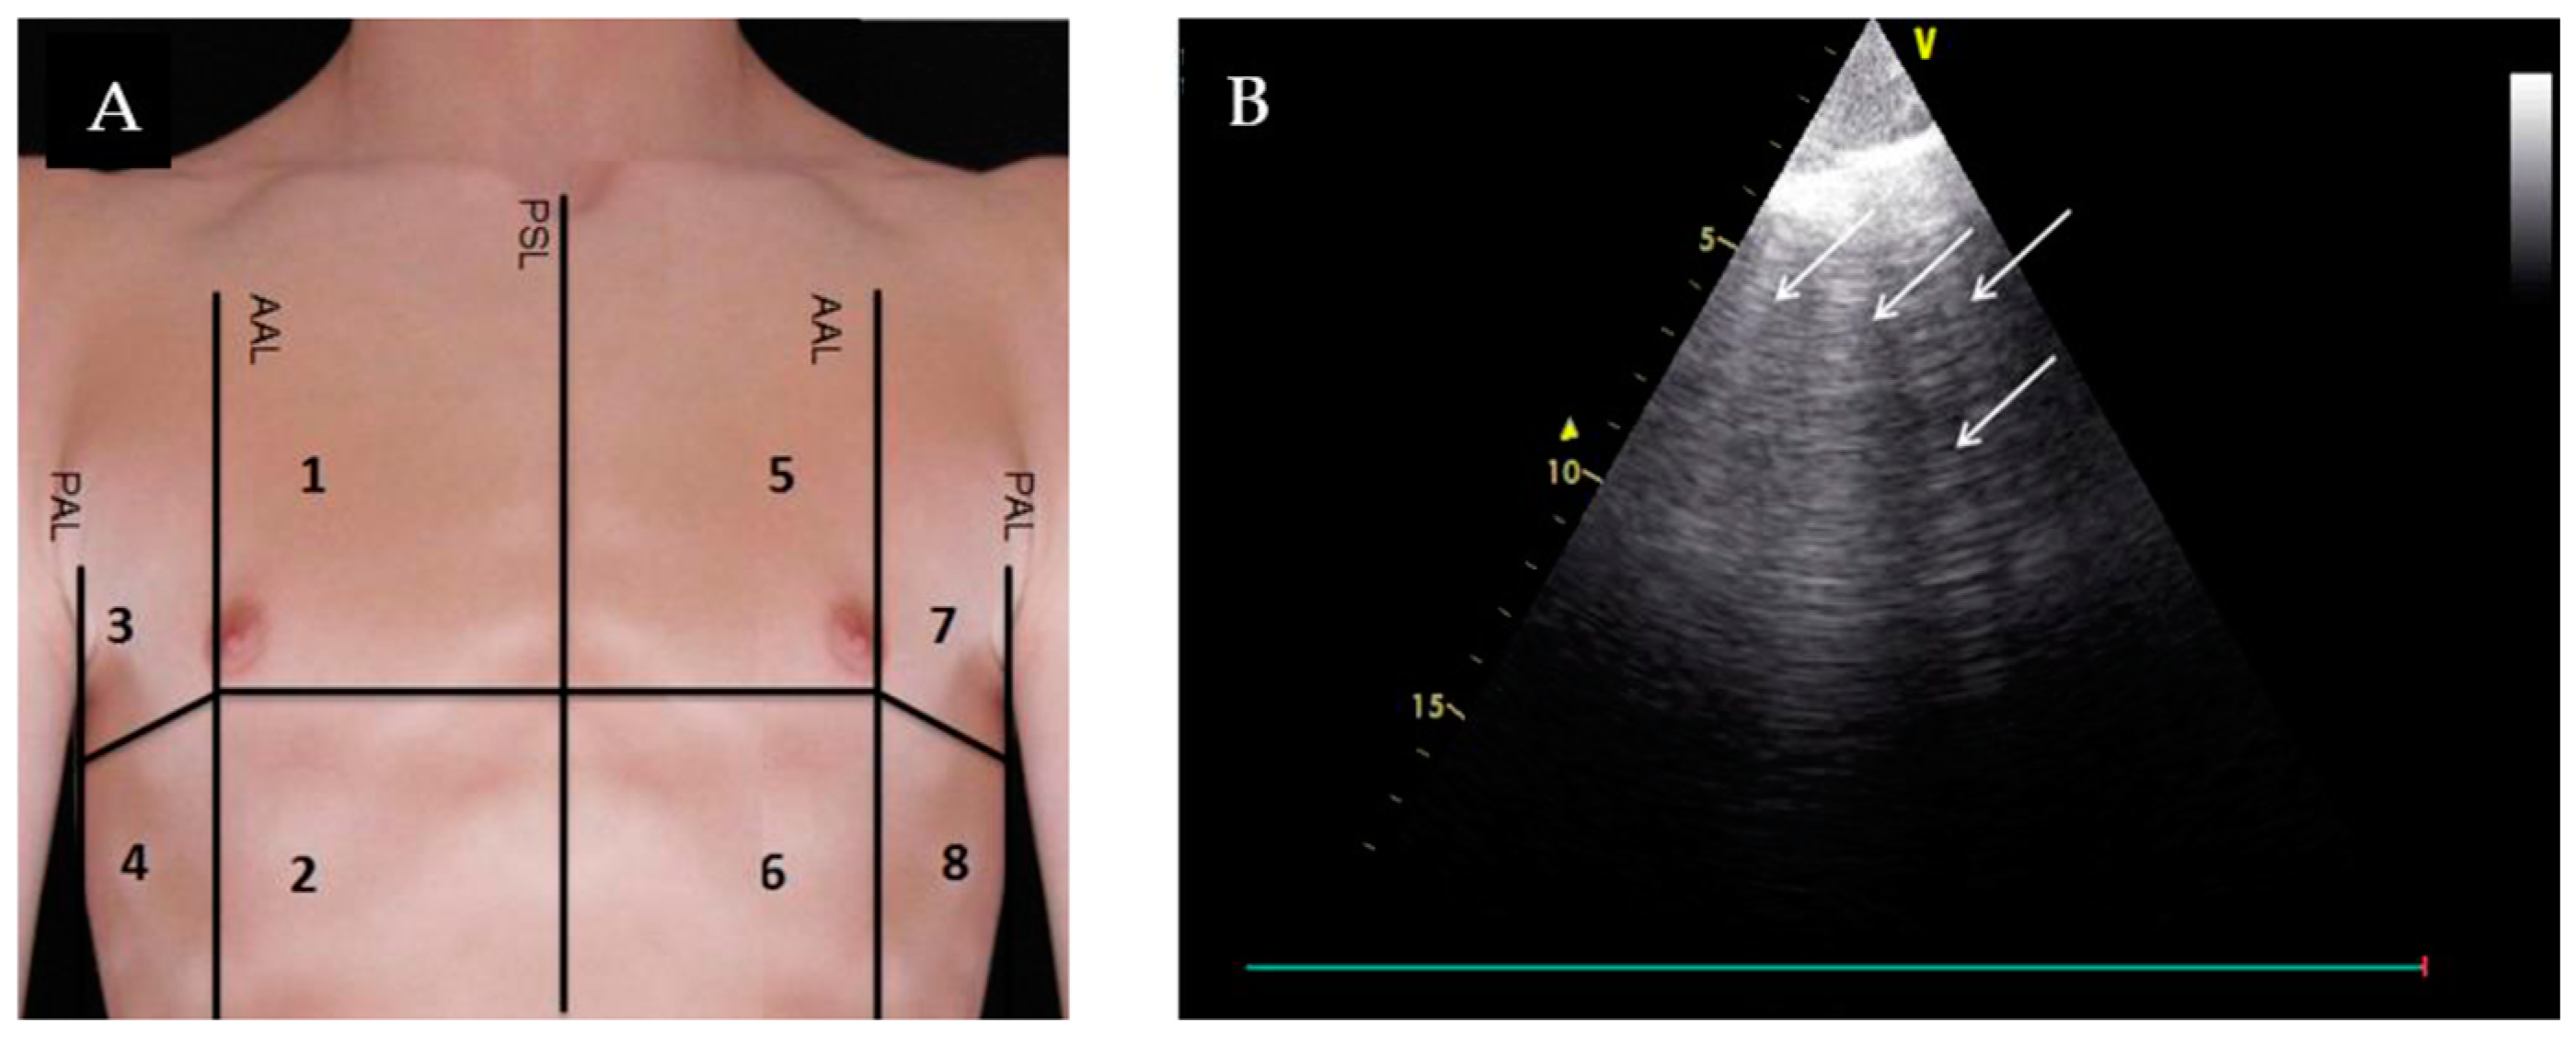
| Lung Ultrasound | ||||
| Evaluation for B-lines | Absence of B-lines |
|
| |
| IJV Ultrasound | ||||
| Ratio of the maximum cross-sectional diameter of the IJV during Valsalva to the diameter at rest (JVD ratio) | JVD ratio ≥4 |
|
|
Disclaimer/Publisher’s Note: The statements, opinions and data contained in all publications are solely those of the individual author(s) and contributor(s) and not of MDPI and/or the editor(s). MDPI and/or the editor(s) disclaim responsibility for any injury to people or property resulting from any ideas, methods, instructions or products referred to in the content. |
© 2024 by the authors. Licensee MDPI, Basel, Switzerland. This article is an open access article distributed under the terms and conditions of the Creative Commons Attribution (CC BY) license (https://creativecommons.org/licenses/by/4.0/).
Share and Cite
Naddaf, N.; Dianati Maleki, N.; Goldschmidt, M.E.; Kalogeropoulos, A.P. Point of Care Ultrasound (POCUS) in the Management of Heart Failure: A Narrative Review. J. Pers. Med. 2024, 14, 766. https://doi.org/10.3390/jpm14070766
Naddaf N, Dianati Maleki N, Goldschmidt ME, Kalogeropoulos AP. Point of Care Ultrasound (POCUS) in the Management of Heart Failure: A Narrative Review. Journal of Personalized Medicine. 2024; 14(7):766. https://doi.org/10.3390/jpm14070766
Chicago/Turabian StyleNaddaf, Nicki, Neda Dianati Maleki, Marc E. Goldschmidt, and Andreas P. Kalogeropoulos. 2024. "Point of Care Ultrasound (POCUS) in the Management of Heart Failure: A Narrative Review" Journal of Personalized Medicine 14, no. 7: 766. https://doi.org/10.3390/jpm14070766