Article

Two Classes of Gamma-ray Bursts Distinguished within the First Second of Their Prompt Emission

School of Physics and Centre for Space Research, University College Dublin, Belfield, D04 V1W8 Dublin, Ireland
*
Author to whom correspondence should be addressed.
Galaxies 2022, 10(4), 78; https://doi.org/10.3390/galaxies10040078
Submission received: 27 April 2022 / Revised: 16 June 2022 / Accepted: 23 June 2022 / Published: 26 June 2022
(This article belongs to the Special Issue Gamma-Ray Burst Science in 2030)

Abstract

:
Studies of Gamma-Ray Burst (GRB) properties, such as duration and spectral hardness, have found evidence for additional classes, beyond the short/hard and long/soft prototypes, using model-dependent methods. In this paper, a model-independent approach was used to analyse the gamma-ray light curves of large samples of GRBs detected by BATSE, Swift/BAT and Fermi/GBM. All the features were extracted from the GRB time profiles in four energy bands using the Stationary Wavelet Transform and Principal Component Analysis. t-distributed Stochastic Neighbourhood Embedding (t-SNE) visualisation of the features revealed two distinct groups of Swift/BAT bursts using the T100 interval with 64 ms resolution data. When the same analysis was applied to 4 ms resolution data, two groups were seen to emerge within the first second (T1) post-trigger. These two groups primarily consisted of short/hard (Group 1) and long/soft (Group 2) bursts, and were 95% consistent with the groups identified using the T100 64 ms resolution data. Kilonova candidates, arising from compact object mergers, were found to belong to Group 1, while those events with associated supernovae fell into Group 2. Differences in cumulative counts between the two groups in the first second, and in the minimum variability timescale, identifiable only with the 4 ms resolution data, may account for this result. Short GRBs have particular significance for multi-messenger science as a distinctive EM signature of a binary merger, which may be discovered by its gravitational wave emissions. Incorporating the T1 interval into classification algorithms may support the rapid classification of GRBs, allowing for an improved prioritisation of targets for follow-up observations.

1. Introduction

Gamma-Ray Bursts (GRBs) are traditionally classified based on their duration and hardness as short/hard or long/soft bursts. These classes are separated at T90 ≈ 2 s, derived from the duration distribution of the Third BATSE catalogue [1]. T90 is defined as the duration during which 5–95% of the counts above background are detected. The properties of these classes suggest different progenitors—long GRBs often lie in star-forming galaxies [2] and some long GRBs are associated with Type Ic supernovae [3,4,5,6] linking them to the deaths of massive stars [7]. Short GRBs are linked to compact object mergers [8,9], as some short GRBs have been identified near elliptical galaxies [10], and many are offset from their hosts [11,12]. The detection of GRB 170817A [13,14], associated with the neutron star merger GW170817, detected in gravitational waves by LIGO [15], lends further weight to this progenitor theory.
The classification of GRBs based on their duration is affected by the significant overlap between the duration distributions of the long and short groups, and is further complicated by a possible ‘intermediate’ class of GRBs, first identified through Gaussian fits to the duration distribution of GRBs in the third BATSE catalogue [16]. Clustering of the duration–hardness plane and multi-dimensional analyses of GRB samples from different satellites have also revealed evidence of more than two classes of bursts.
Salmon et al. [17] presents a review of previous studies and reports on an updated clustering analysis of Swift/BAT and Fermi/GBM bursts which finds that Gaussian models applied to Swift/BAT and Fermi/GBM GRB samples recover three clusters, including an intermediate-duration one. However, the latter is identified as an excess Gaussian component when an entropy criterion is used and the resulting best-fit solution contains two classes, which are broadly consistent with the typical short- and long-duration groups. A key conclusion of the analysis is that model-based methods may identify spurious components in one-, two- and multi-dimensional analyses of GRB samples and that model-independent analyses of GRBs should be conducted, for example, using GRB light curves.
Short GRBs with extended emissions have been detected, which may form an additional sub-class [18,19,20] and are possibly associated with a magnetar central engine [21]. These episodes, combined with the late X-ray flares in some short GRBs, and the non-detection of supernovae associated with some long GRBs, led to the suggestion of a new classification scheme by Zhang et al. [22]. Type I (massive star/collapsar origin) and Type II (compact-object merger origin) bursts are defined by multiple observational criteria beyond duration and hardness [23]. Other classification methods, based on afterglow and host galaxy properties [24], minimum variability timescales [25] and prompt emission and energetics, have been defined [26,27,28,29,30]. The instrument, sample size and classification method used can lead to different results [31], and the collapsar/merger fractions for each instrument’s sample cannot simply be defined by a T90 = 2 s threshold [32].
Analysis of GRB light curves in several bands does not rely on summary statistics, such as parameters derived from spectral fits, which could be poorly fit or incorrect. Jespersen et al. [33] extracted features from 64 ms-resolution Swift/BAT light curves using Discrete Fourier Transforms and found two groups using t-distributed Stochastic Neighbourhood Embedding (t-SNE). This approach does not assume the underlying distribution of the variables, unlike model-based clustering and distribution fitting.
An alternative to Fourier analysis is wavelet analysis, which has been used to study non-stationary time-series [34]. Wavelet analysis has the advantage of extracting both frequency and temporal information, and for this reason it has been used to compress and de-noise GRB light curves for the study of their time evolution [35,36,37], to identify peaks [38,39,40,41], and to quantify the minimum variability timescale of GRBs [42,43,44,45,46]. Wavelet decomposition has been used to reduce the dimensionality of supernova light curves for classification [47], and has been combined with Principal Component Analysis (PCA) and t-SNE for classification [48,49]. Lochner et al. [48] found that classifiers performed better when supplied with wavelet coefficients of supernova light curves, in contrast to feature extraction using parametric models.
GRB pulses exhibit spectral evolution, including hard-to-soft [50] or intensity-tracking [51] behaviour. Other common features of all GRB pulses include longer-observed durations at lower energies [52] and asymmetric shapes [53,54]. These commonalities suggest that a similar emission mechanism creates GRB pulses, regardless of the progenitor [55,56].
However, pulses in short and long bursts also exhibit some differences. Long GRB pulses are observed to peak earlier at higher energies, but these spectral lags are not typically significant in short GRBs [18,54,57,58,59,60,61,62,63]. The minimum variability timescales [44,45,46] retrieved from wavelet analysis of long and short GRBs are ∼200 ms and ∼10 ms respectively. Hakkila and Preece [64] found that pulses in short GRBs are shorter and harder than long GRBs, and exhibit more spectral evolution. Coupled with the observation that shorter pulses have a higher peak flux and ∼90% of short GRBs consist of a single pulse, compared to 25–40% for long GRBs, the pulse properties are likely to be a distinguishing feature in the first seconds of a burst. In particular, spectral evolution is evident at early times in previous studies of bursts from BATSE [65,66,67,68,69,70], Swift [71] and Fermi/GBM [72,73,74].
Redshift effects have not been observed in GRB light curves, as the standard time dilation of GRB pulses is thought to be masked by a contrasting effect whereby only the shorter, brightest portion of the burst is observed [75]. Therefore, analysis of GRB light curves is unlikely to be strongly affected by cosmological effects [76].
In this work, the light curves of GRBs in four energy bands from three different instruments are analysed, using wavelets as a feature-extraction method. The T100 burst intervals, during which 100% of the counts above background is recorded, are studied at 64-ms resolution, and the early phase of GRB emission (first few seconds) at 4-ms resolution. Wavelet coefficients are extracted and reduced and then visualised using PCA and t-SNE. Section 2 outlines the sample construction, while Section 3 provides details of the methods applied to perform feature extraction. Results are presented in Section 4 and consistency checks with other studies and between instrument samples are discussed in Section 5. The classification of notable GRBs is presented in Section 6. Possible signatures in the first second are discussed in Section 7, while conclusions are outlined in Section 8.

2. GRB Light Curves

The analysed GRB samples include bursts detected by the BATSE instrument on the Compton Gamma-Ray Observatory [77], the Burst Alert Telescope (BAT) on the Neil Gehrels Swift Observatory (hereafter Swift/BAT; Gehrels et al. [78]) and the Gamma-ray Burst Monitor (GBM) on the Fermi Gamma-ray Space Telescope (hereafter Fermi/GBM; Meegan et al. [79]).

2.1. BATSE

The BATSE 64 ms-binned light curves were stored as ascii files on the BATSE Public Data Archive (https://heasarc.gsfc.nasa.gov/FTP/compton/data/batse/trigger/, accessed on 17 February 2021). There were 2704 bursts in the final BATSE catalogue from 21 April 1991 to 17 August 2000, and 1956 light curves at 64 ms resolution were available. Background subtraction was applied via polynomial fits to the 64 ms light curves pre- and post-burst. The BATSE 4 ms-binned light curves were generated using the TTE files for individual bursts in the BATSE Public Data Archive, which stores 1732 TTE files, 1721 of which have successful background subtraction. The count rate was divided by the number of triggered detectors to obtain light curves measured in counts s−1 det−1. The resulting light curves were stored in the four standard BATSE bands (20–50 keV, 50–100 keV, 100–300 keV and >300 keV).

2.2. Swift/BAT

The Swift/BAT Gamma-Ray Burst Catalogue (https://swift.gsfc.nasa.gov/results/batgrbcat/, accessed on 29 January 2021) hosts ascii files containing the 64 ms- and 4 ms-binned background-subtracted light curves. There were 1388 GRBs detected between 17 December 2004 and 28 August 2020 in this catalogue, which was extended from the Third Swift BAT Catalogue [80]. 1273 light curve files were available at 4 ms resolution, containing four background-subtracted light curves, corresponding to four bands (15–25 keV, 25–50 keV, 50–100 keV and 100–350 keV) in units of counts s−1 det−1. Twenty-two bursts with no documented duration (T90) were removed from the sample. At 64 ms resolution, light curves were available for the same set of bursts, with three additional GRBs added to the sample.

2.3. Fermi/GBM

Fermi/GBM light curves were generated from TTE data in 64 ms and 4 ms bins using the Fermi-GBM Data Tools [81]. A total of 3000 bursts from 10 August 2008 to 17 March 2021 were included, with 2678 successful background subtracted light curves created. Only triggered detectors were used, and the background intervals defined in the Fermi/GBM catalogue were used for background subtraction. Count rates were transformed to counts s−1 det−1 by normalising according to the number of triggered detectors. Unlike Swift and BATSE, Fermi/GBM does not have defined light curve bands. Thus, they were chosen to capture the energy ranges of the NaI and BGO detectors, and the bands were considered in hardness ratio calculations. Four energy bands were considered: the Fermi trigger band (50–300 keV), the lower energy band used in hardness ratio calculations (8–50 keV), the energy range of the NaI detectors (8–1000 keV) and the higher energy range of the BGO detectors (>1000 keV). The effect of the choice of these bands was studied by repeating the analysis of light curves within the four Swift bands, which was shown to produce similar results.

3. Feature Extraction

The feature extraction algorithm consists of multiple steps, which are outlined in Figure 1 for the analysis of light curves in the T100 interval at 64 ms resolution. Light curves were first pre-processed, before Stationary Wavelet Transform was applied. PCA was used to reduce the dimensionality of the resulting coefficients before visualisation with a t-SNE map. Figure 2 depicts the steps that were followed for the analysis of the first second of prompt emission. This section outlines the details of each step in the feature extraction algorithm.

3.1. Light Curve Pre-Processing

3.1.1. 64 ms Light Curves

To obtain counts recorded at identical times relative to the trigger time for each light curve, BATSE and Swift/BAT light curves were modelled and resampled onto an identical grid using Gaussian Process Regression (GPR), a machine learning method that uses the input data to infer the function and explain the observations [82]. Gaussian processes model observations function as joint multivariate normal distributions, which can be fully specified by a mean function and covariance matrix. GPR determines the mean function and the entries of the covariance matrix using a user-specified covariance function (kernel). Hyperparameters of the kernel were optimised to maximise the marginal likelihood of the data under the Gaussian process prior.
The Gaussian Process model was implemented using the GPFlow library in Python [83], which originates from GPy but is built on TensorFlow [84]. A heteroscedastic regression model was used, which incorporates uncertainty in each point into the interpolation process by applying less weight to points with greater uncertainty. The radial-basis function kernel (also known as squared exponential kernel) was used, as it is infinitely differentiable and produces smooth functions. The Adam and natural gradient optimisers were used to converge to the best-fit hyperparameters. The resulting equally spaced, evenly sampled 64 ms light curves were zero-padded beyond T100 to ensure noise was discarded. The T100 interval was extracted from the GRB catalogues. The four-band light curves were concatenated together and input to the feature extraction algorithm depicted in Figure 1.

3.1.2. 4 ms Light Curves

Wavelet decomposition requires a time series of equal and even lengths. At 4 ms resolution, the light curves were restricted to even-length time intervals starting at T0, the burst start time documented in the GRB catalogues. Light curves spanning different intervals were created and extended in intervals of 0.1 s until T0 + 3 s. Many of the BATSE TTE datasets did not extend past 3 s, and BATSE light curves were zero-padded if they did not extend to the specified interval. For each GRB, the light curves in the four energy bands were concatenated together to form one vector to be input to the feature extraction algorithm, depicted in Figure 2 for the case in which light curves between T0 and T0 + 1.004 s were studied.

3.2. Wavelet Decomposition

Fourier analysis is often used to examine the frequency composition of signals and to extract features from time series (e.g., Jespersen et al. [33]). However, a drawback of Fourier transforms is the loss of temporal information and the stringent sine and cosine basis functions. Wavelets are more suited to the analysis of images, music and transient events, as they overcome the limitations of Fourier analysis by encoding both time and frequency information in the basis function [85]. The Stationary Wavelet Transform (SWT), also known as the Á Trous algorithm [86], is a shift-invariant transform, which convolves a signal with scaled and shifted versions of the basis wavelet function. The shift-invariance feature of the SWT has made it a popular method for pattern recognition [87,88]. The SWT returns two coefficients, known as Approximation and Detail coefficients, of equal length to the input signal. The coefficients are computed using a filter-bank algorithm [34] with low- and high-pass filters, which decomposes the input signal. Multiple levels of decomposition can be performed, whereby the output of the low-pass filter is successively fed to the next decomposition level.
The pywt.swt function of the PyWavelets package [89] was applied to the light curve vectors using the symlet family of wavelets, which is a more symmetric version of the Daubechies wavelet family [90], but other wavelet families produce similar results. A two-level decomposition was performed, resulting in four components of equal length to the vector containing the light curves in four bands (Figure 2). These were concatenated into one vector for each GRB prior to dimensionality reduction.

3.3. Principal Component Analysis

After performing a two-level wavelet decomposition, the dataset for each GRB increased in length by a factor of four. A dimensionality reduction technique was used to extract only the most significant information encoded in the wavelet coefficients. PCA is a form of decomposition, which extracts uncorrelated Principal Components from correlated data via an orthogonal transformation [91,92]. PCA involves eigenvalue decomposition of the covariance matrix of the input wavelet coefficient data. The eigenvectors are sorted by the magnitude of their eigenvalues. The user must choose how many eigenvectors to keep based on the percentage of variance explained by each eigenvector. The chosen eigenvectors represent the original data in a new PCA reference frame and are known as the Principal Components (PCs). The matrix of PCs is used to project the wavelet coefficients onto the lower-dimensional PCA space.
In this work, PCA was carried out using the sklearn.decomposition.PCA function. For Swift/BAT, the components whose cumulative variance reached >70% were chosen as the new representation of the dataset, as the number of components required to meet >90% was large. For BATSE and Fermi/GBM, the number of retained components ensured that >90% of the variance was captured.

3.4. t-SNE

The chosen PCA components require transformation to a 2D space so that features can be visualised. Stochastic Neighbourhood Embedding (SNE; Hinton and Roweis [93]) provided a 2D visual representation of the components on arbitrary axes by computing the probability that each point is a neighbour of another point. This used a Gaussian probability density and Kullback–Leibler minimisation [94] to ensure that the low-dimensional space adequately represented the high-dimensional space. A user-specified parameter called Perplexity specified the importance of local or global structure. In general, the Perplexity can be considered representative of the number of nearest neighbours of each point.
t-SNE (t-distributed SNE; Maaten and Hinton [95]) used a Student t-distribution with a single degree of freedom, replacing the Gaussian comparison between points. The sklearn.manifold.TSNE method was used with a Perplexity, which maximises the separation of clusters in the final representation. In this case, the smaller Swift/BAT sample was analysed with a Perplexity of 40, while for the larger samples of BATSE and Fermi/GBM, Perplexities of 50 and 70 were used, respectively. The result is a 2D representation of the PCA feature space, in which similar light curves were grouped together.

3.5. GMM Clustering

Finally, Gaussian Mixture Model (GMM)-based clustering was applied to the t-SNE plots to identify clusters using the mclust package in R [96,97]. GMM clustering assumes that the observed data are generated from a mixture of K components, where the density of each component is described by a multivariate Gaussian distribution. mclust applies 14 different models and chooses the best-fit model and number of clusters based on the Bayesian Information Criterion (BIC; Schwarz et al. [98]). Since the underlying distributions are non-Gaussian, clusters are combined using the clustCombi function to converge on the optimum number of clusters, calculated via an entropy criterion [99].

4. Results

The results obtained by analysing GRB light curves, as described in Section 3 for the T100 intervals at 64 ms resolution, and for the first three seconds post-trigger at 4 ms resolution, are presented.

4.1. 64 ms Results

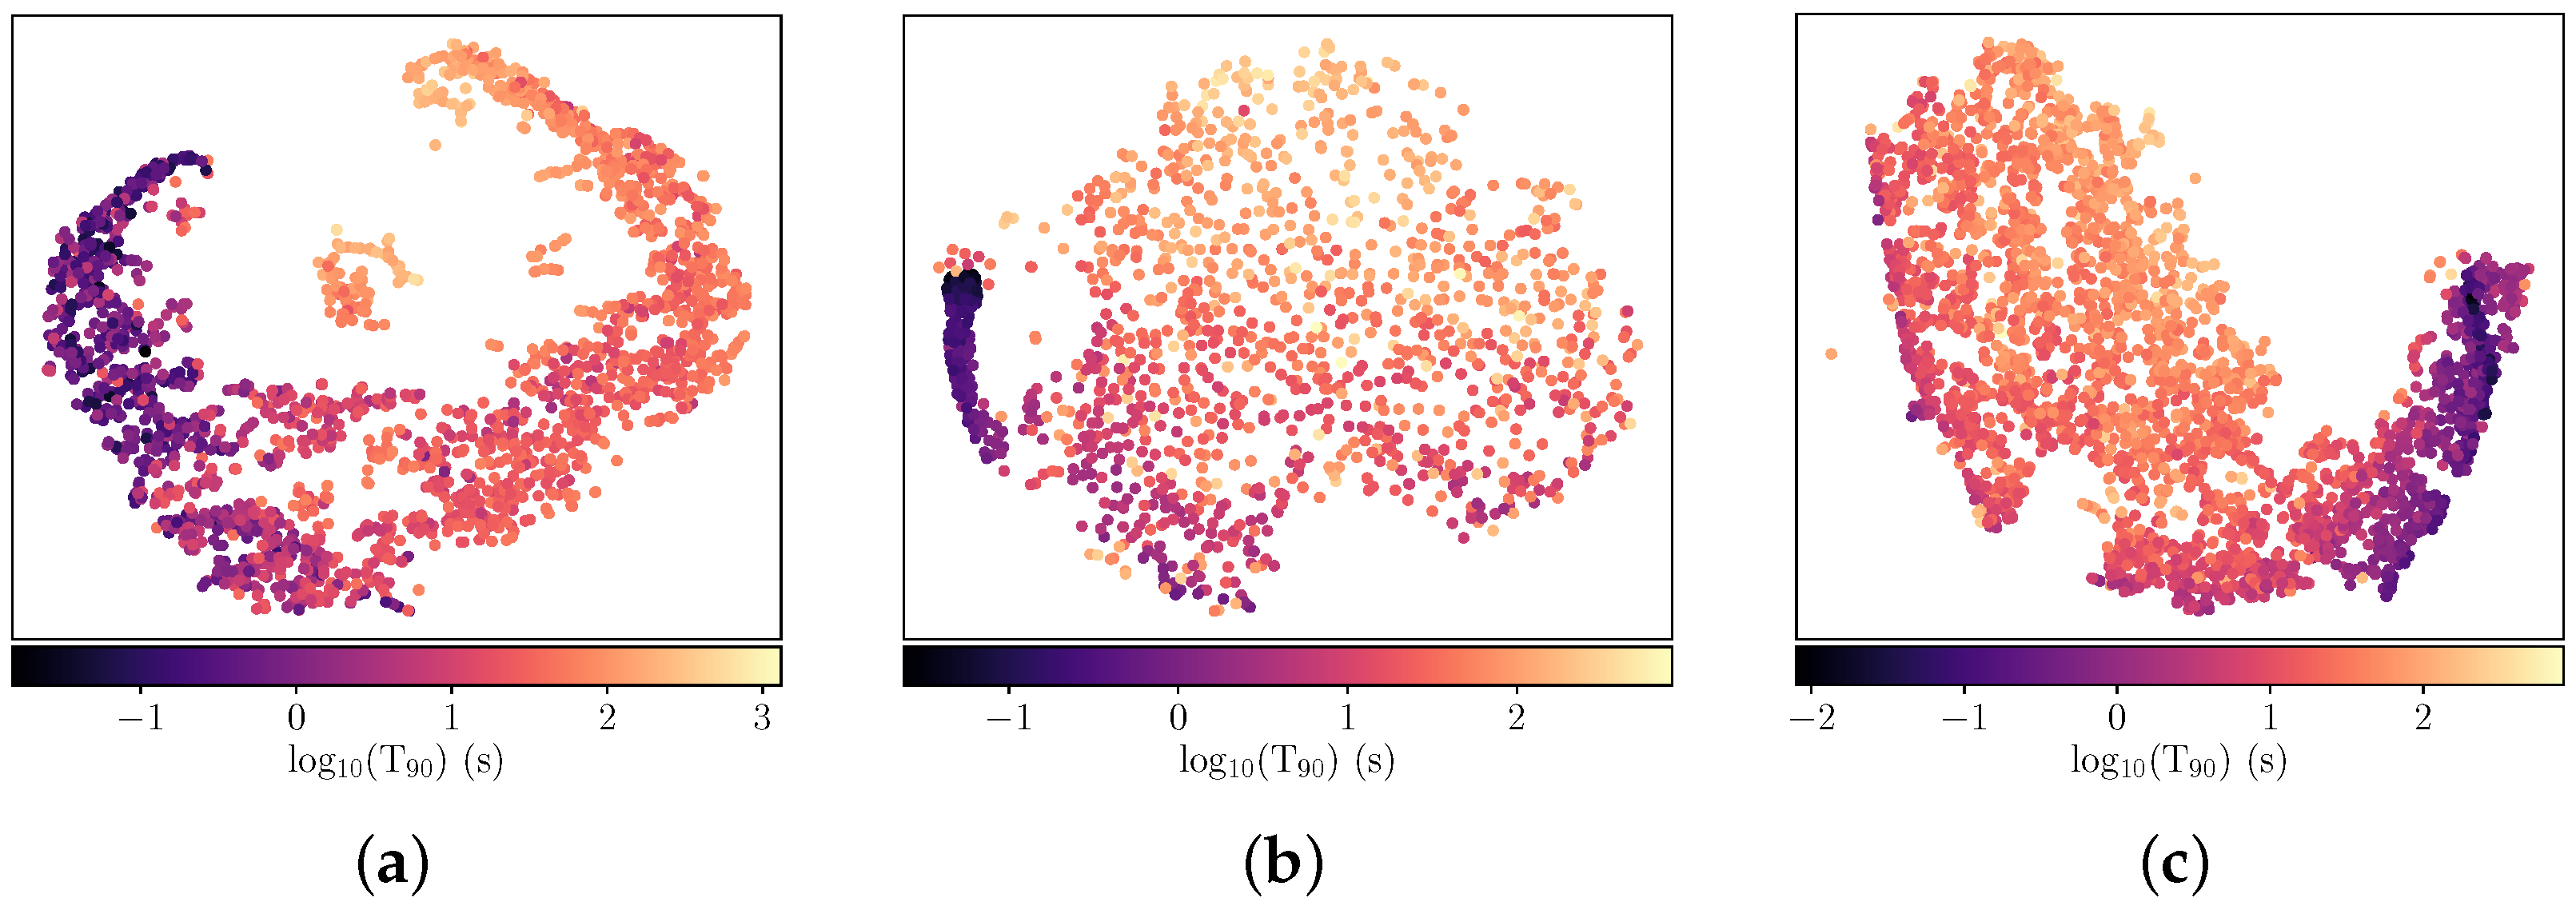
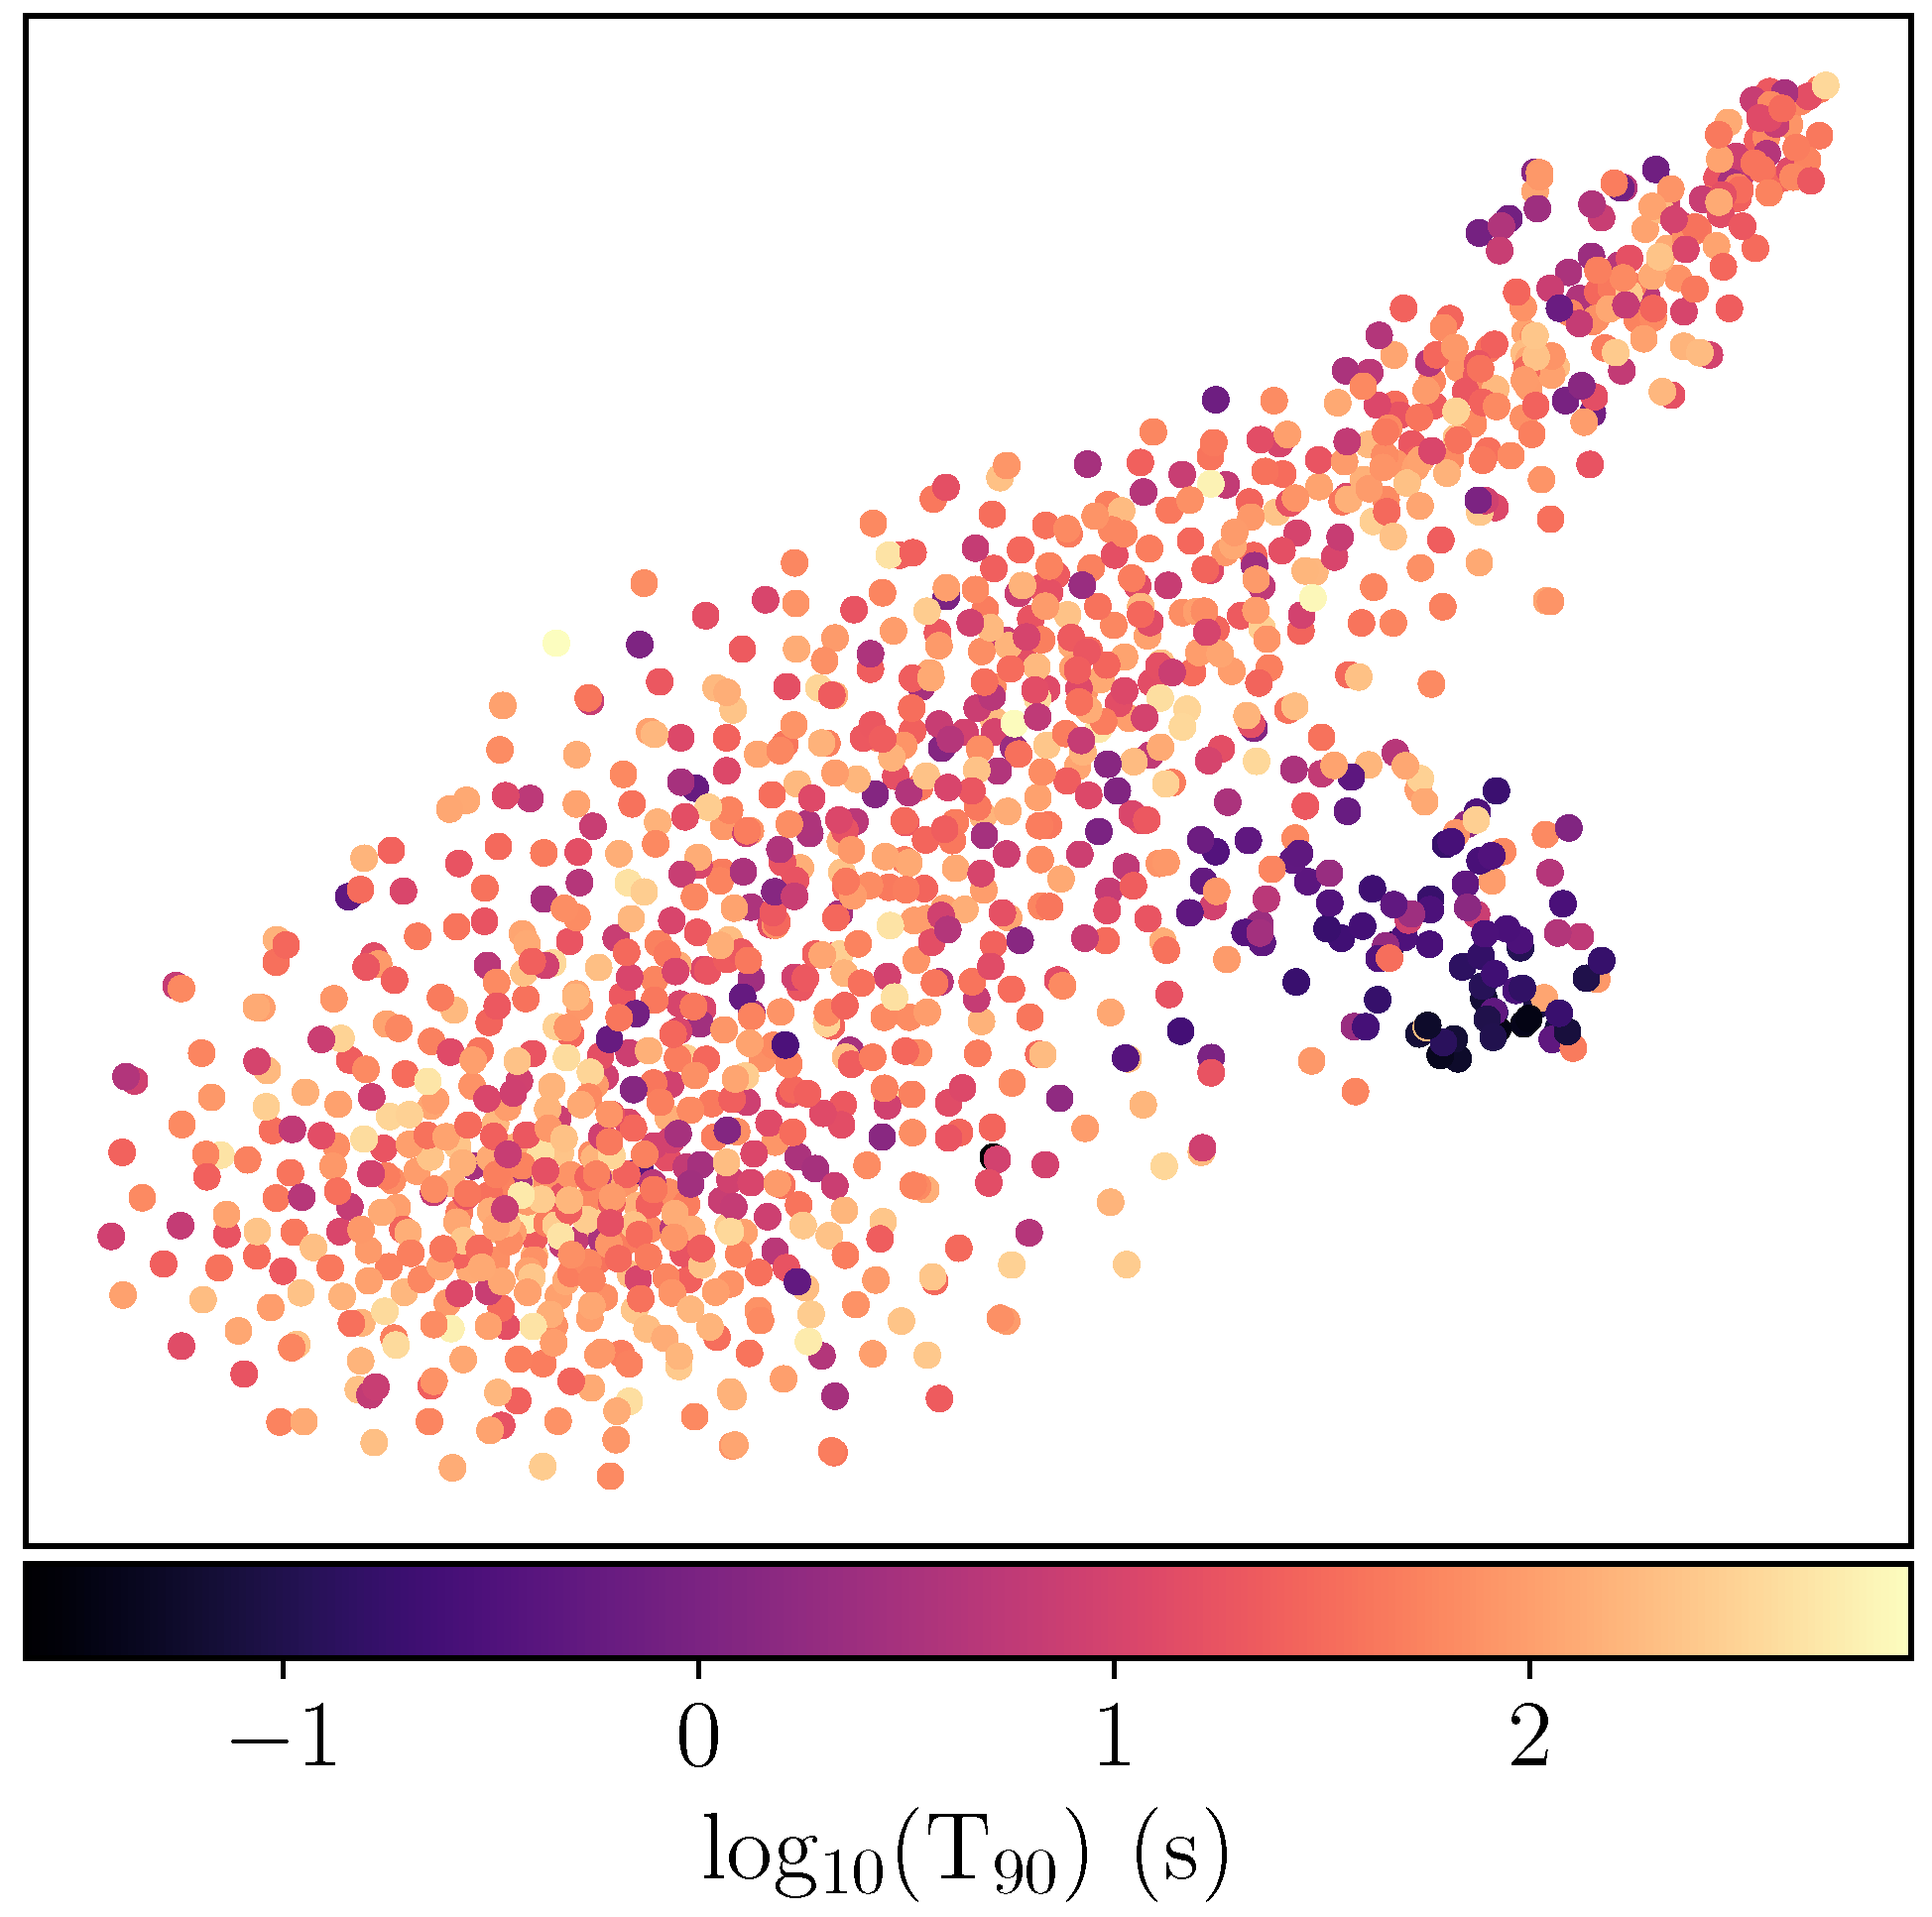
The t-SNE plots, coloured by burst duration (T90), are shown in Figure 3 for the T100 intervals of bursts from BATSE, Swift/BAT and Fermi/GBM. t-SNE plots produce a mapping onto an arbitrary space, whereby the scale of the axes have no units or physical meaning. Thus, the t-SNE plots presented in this paper do not label the X and Y axes, and the precise position of points along the axes is not significant. However, the structure within the t-SNE space is significant and is identified. A separate group of shorter-duration bursts is evident in Figure 3b for Swift/BAT, while for BATSE and Fermi/GBM, the separation is not as clear.
GMM clustering, applied to the t-SNE map for Swift/BAT (Figure 3b), identified four clusters of bursts. However, the distribution is complex and is likely unsuitable for model-based clustering. When coloured by duration, it is clear that two groups of bursts were identified within the T100 intervals of Swift/BAT light curves: one consisting primarily of short bursts and a larger group of longer duration bursts.

4.2. 4 ms Results

The t-SNE plots from the analysis of the 4 ms light curves are shown in the animations in Figure 4, coloured by burst duration (T90). The video animations are available to download in the Supplementary Materials. The intervals shown in each iteration of the t-SNE plot increase by 0.1 s, starting from the burst trigger time, T0. For Swift/BAT, a small group of shorter-duration bursts, begins to form and separate from the larger group of longer bursts within T0 + 0.2 s. This shorter group of bursts grows and detaches from the longer group by T0 to T0 + 1.004 s, remaining detached up to the first 3 s post-trigger, which is the maximum interval available at 4 ms resolution. For BATSE and Fermi/GBM, the distinction between groups is not as clear, but a similar pattern is observed—a group of shorter bursts begins to form at ∼T0 + 0.2 s and grows, separating itself from the larger, longer-duration group. We conclude that the time at which the two clusters of bursts become clearly separated is T0 + 1.004 s.

4.3. Properties of GRB Clusters Identified in the First Second Post-Trigger

2D t-SNE representation of the extracted wavelet and PCA features from the first second (T0 to T0 + 1.004 s) of GRB light curves, coloured by burst duration T90 and hardness ratio HR32 for BATSE, Swift/BAT and Fermi/GBM, are shown in Figure 5. The projections indicate the presence of two groups of bursts, which can be seen clearly in Figure 5b for Swift/BAT. For BATSE (Figure 5a) and Fermi/GBM (Figure 5c), this separation is less well-defined.
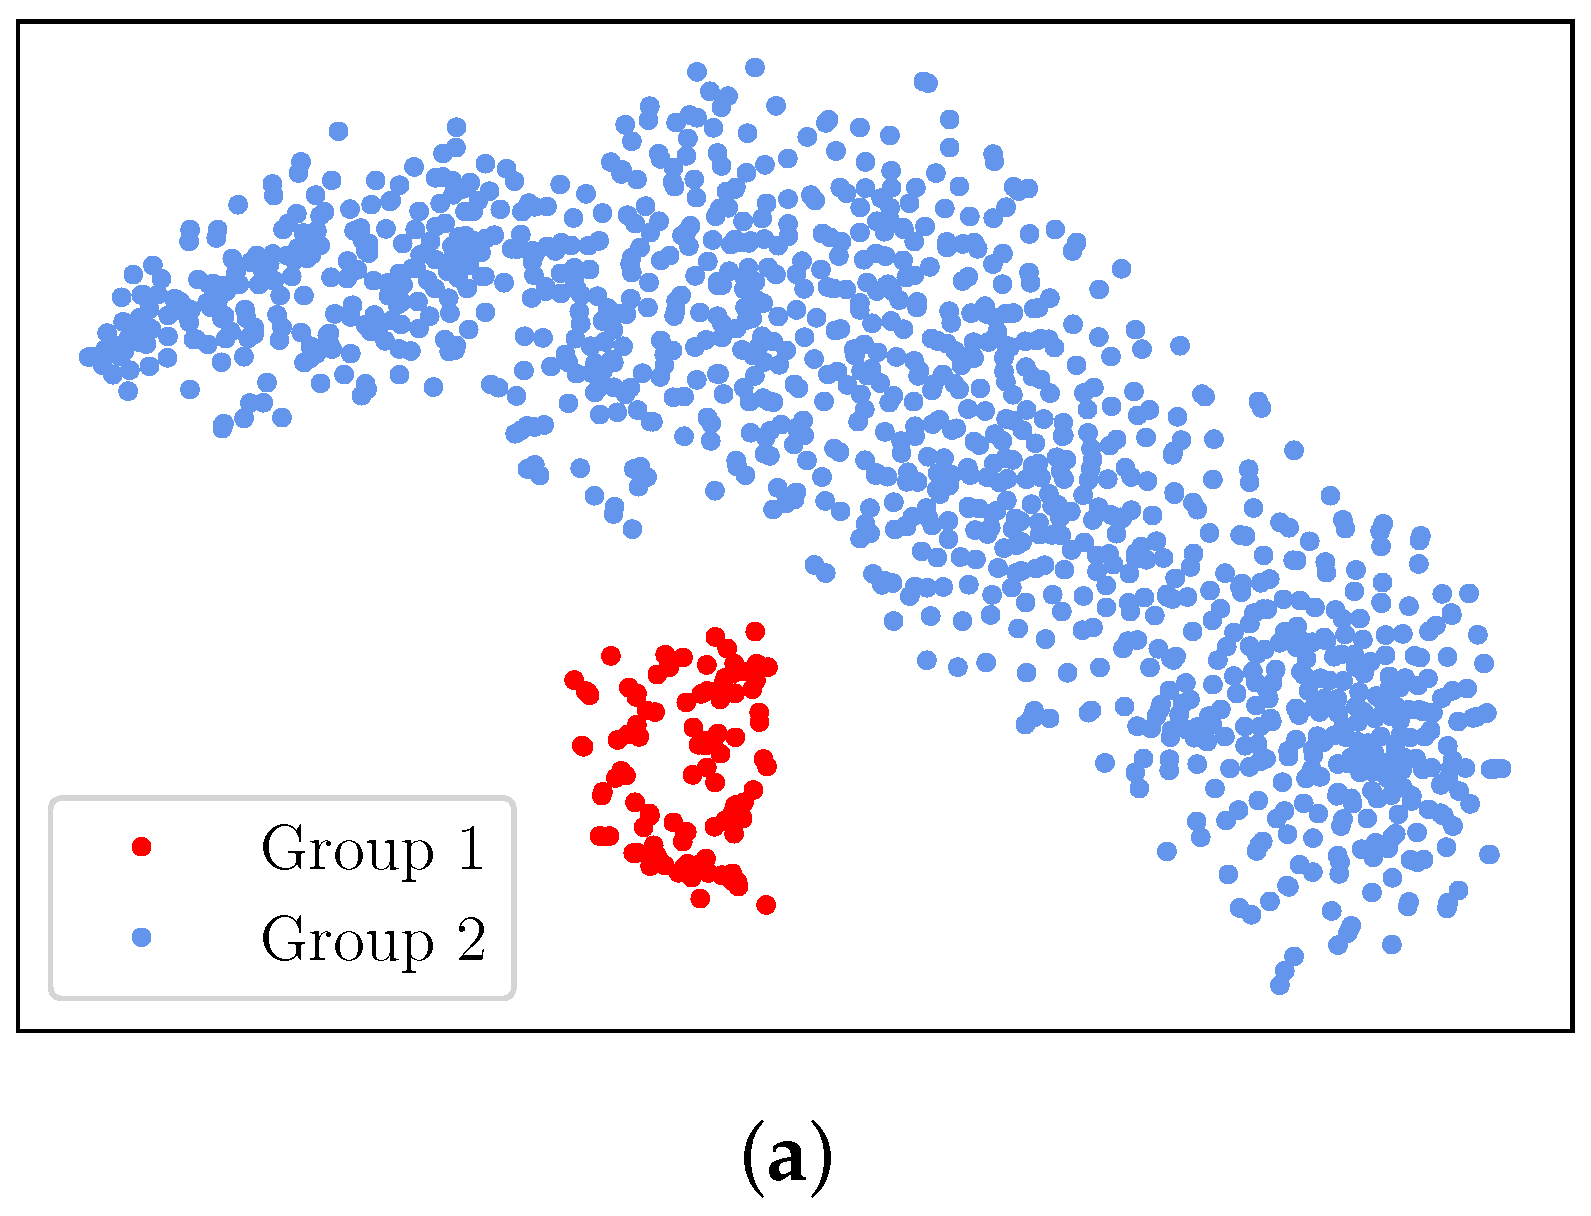
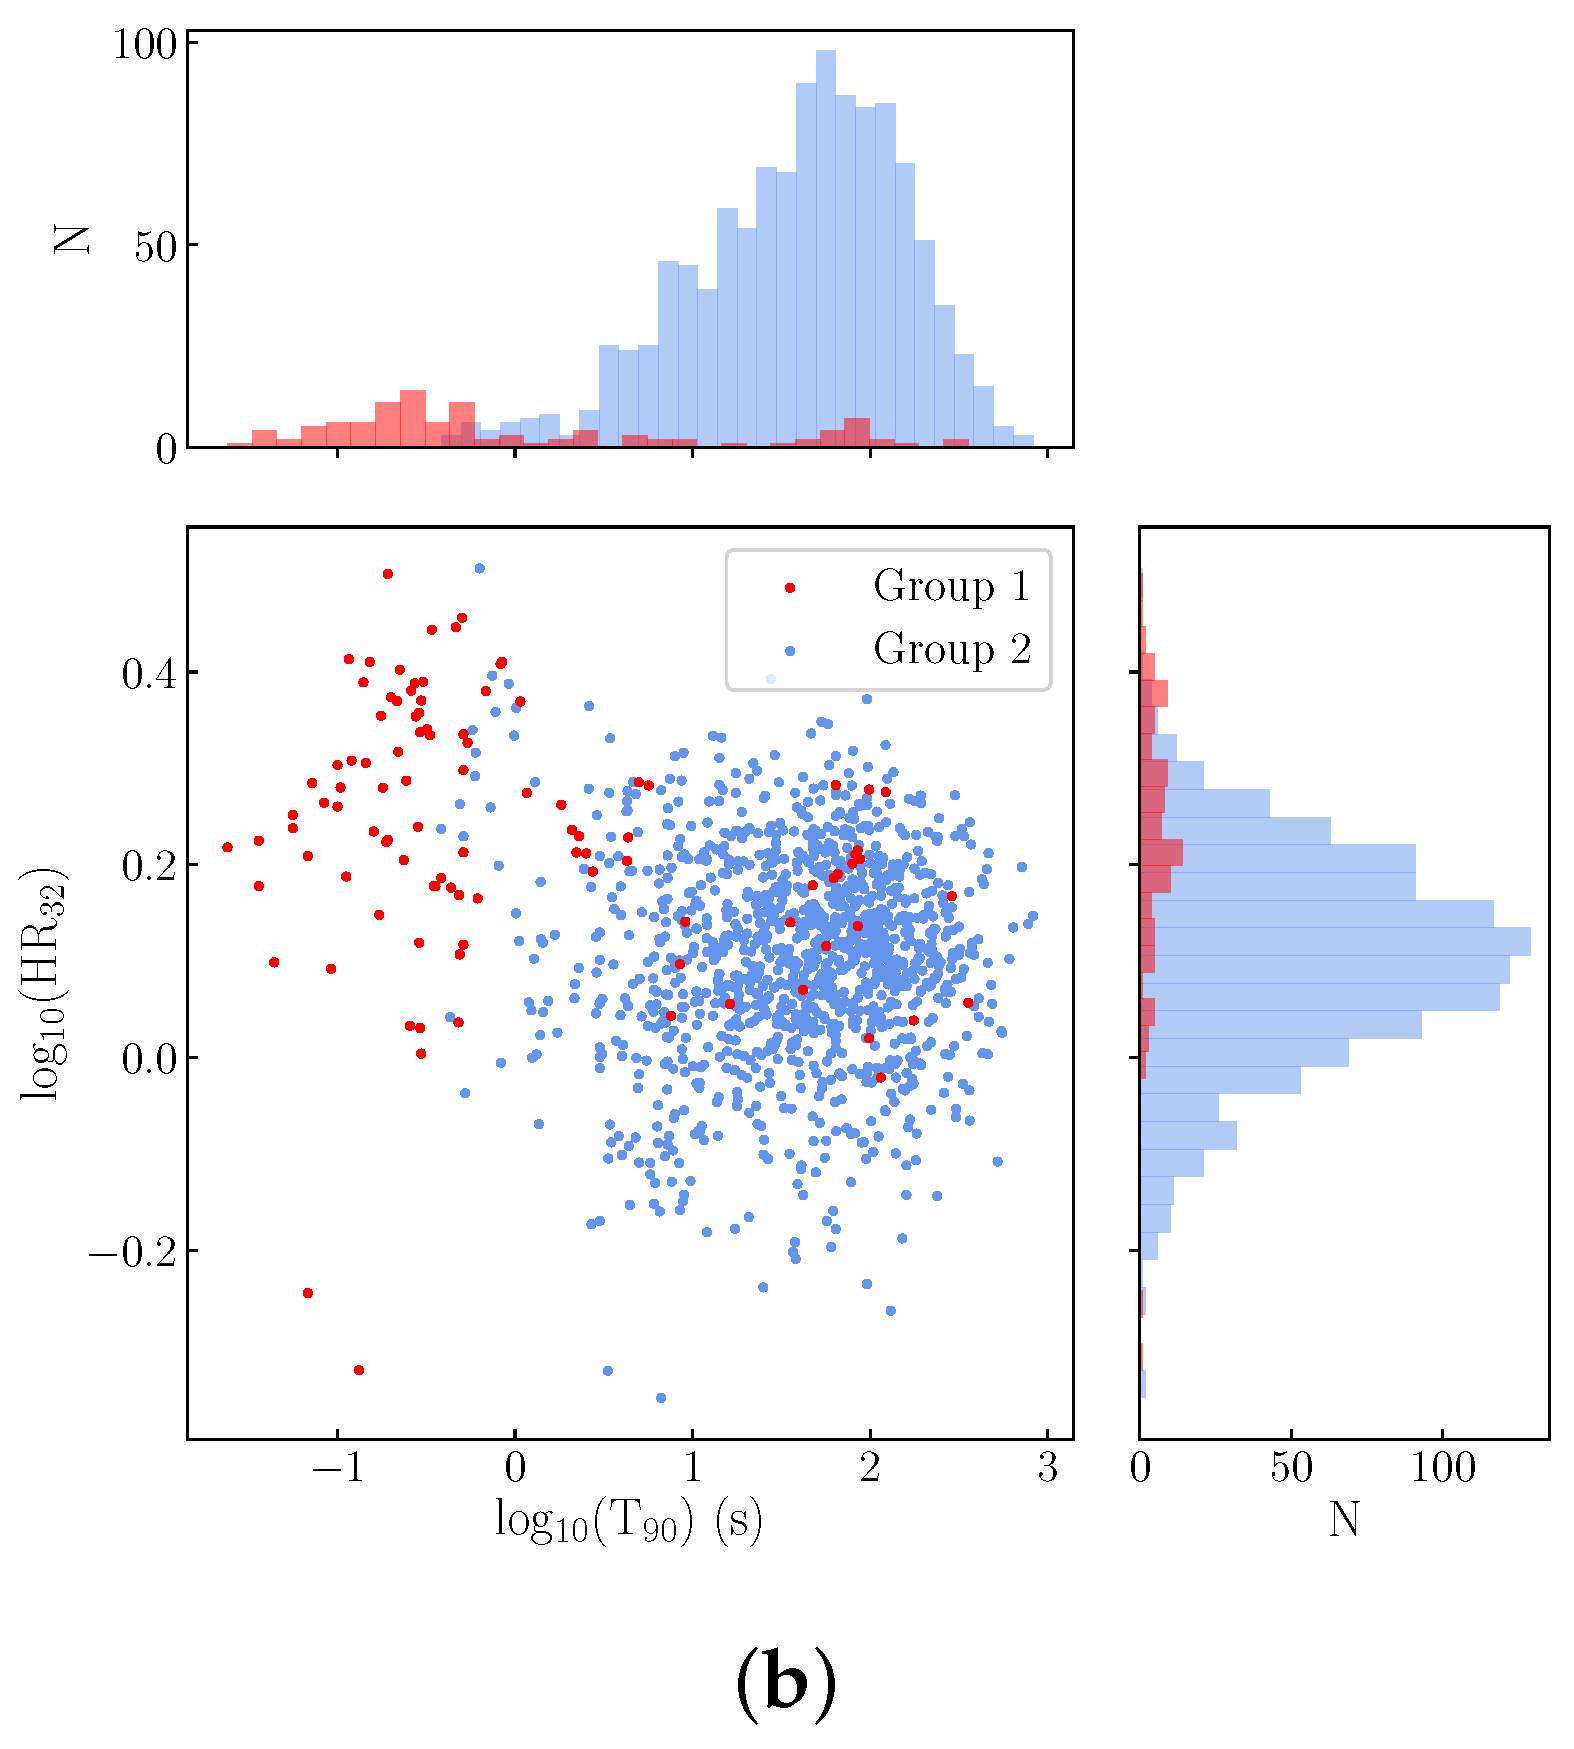
GMM clustering applied to the Swift/BAT projection identifies two separate groups, shown in Figure 6a. The group consisting of mostly short/hard bursts is labelled Group 1, and the larger, longer-duration group is denoted Group 2. The groups are shown projected onto the duration-hardness plane in Figure 6b.
Two-dimensional Kolmogorov–Smirnov (KS) tests applied to Group 1 and Group 2 verify that there are statistically significant differences in GRB properties such as the duration (T90), hardness (HR32), peak energy ( E peak ) and fluence (S) of the two clusters. Table 1 presents the results of the KS test. The probability (p-value) presented in Table 1 indicates the probability that Groups 1 and 2 are drawn from the same distribution. This hypothesis is rejected, as all probabilities are below 1%. Figure 7 demonstrates the distribution of the GRB properties for Group 1 and Group 2.
Table 2 lists the cluster memberships of a subset of the Swift GRBs for both the analysis of the T100 interval at 64 ms resolution, and the interval from T0 to T0 + 1.004 s at 4 ms resolution. The full table is available to download from the Supplementary Materials. When the first 1 s of prompt emission is considered, Group 1 contains 107 bursts, 73 of which are short-duration (T90 < 2 s). There are 1144 bursts in Group 2, containing 1112 long-duration bursts (T90 > 2 s). The composition of each group and the properties of GRBs in Groups 1 and 2 are further discussed in Section 5.
As with the T100 analysis (Section 4.1), the results obtained for the T0 to T0 + 1.004 s interval at 4 ms resolution for BATSE and Fermi/GBM GRBs are not as clear-cut as they are for Swift/BAT. In the case of BATSE, GMM clustering with mclust identifies six clusters within the t-SNE projection in Figure 5a. However, we can tentatively identify two clusters of bursts for BATSE by eye. These two groups resemble the short/hard and long/soft groups identified for Swift/BAT. Similarly to Swift/BAT, a KS test applied to the two BATSE groups reveals significant differences in their duration, hardness, peak energy and peak flux. BATSE has a harder energy range than Swift/BAT; thus, the BATSE population contains more short/hard bursts. Therefore for BATSE, the short-duration Group 1 contains a larger proportion of bursts compared to Swift/BAT.
For Fermi/GBM, the projection in Figure 5c indicates two groups, primarily consisting of short/hard and long/soft bursts, but their clustering is not dense enough to allow for a clean separation between them. mclust identifies five clusters. This may indicate that the application of a Gaussian model does not adequately represent the underlying complex distributions [17].

5. Consistency Checks

The analysis of the first second of prompt emission (T1) identifies two groups of bursts within the BATSE, Swift/BAT and Fermi/GBM samples. We focus this discussion on the more clear-cut results obtained with Swift/BAT.

5.1. T100 vs. T1 Analysis

For Swift/BAT, two groups are identified using both the T100 and T1 intervals. Table 2 provides the classification results obtained with each interval. The sample sizes of the two groups are shown in Table 3, separated into long- (T90 > 2 s) and short- (T90 < 2 s) duration bursts.
A total of 95% (1185 of the 1251 bursts) of the classifications of Swift/BAT bursts determined using the T1 interval at 4 ms resolution are consistent with those derived using the T100 intervals at 64 ms resolution. There are 21 short-duration bursts, which are classified as Group 2 bursts when the T1 interval is considered, but move to Group 1 when the T100 interval is used for the analysis. There are 28 long-duration bursts, which move from Group 1 in the T1 analysis to Group 2 when the T100 interval is considered. These include five bursts in the list of Swift/BAT bursts with extended emission episodes compiled by Gibson et al. [100]. The long-duration supernova-accompanied burst GRB 101219B moves to Group 2 in the T100 analysis, correctly placing it amongst the other bursts with associated supernovae. The inclusion of the full light-curve data in these cases is important for correct classification. The classification of bursts with associated supernovae is further discussed in Section 6. Some of the movement between groups may reflect the different temporal resolutions used for the T1 (4 ms) and T100 (64 ms) analyses. The minimum variability timescale with short GRBs of order 10 ms would not necessarily be captured by the T100 analysis. There may also be cases where there are pre-trigger emissions that are not captured in the current approach, which starts at the trigger time.

5.2. Inter-Comparison of Swift/BAT and Fermi/GBM Results

In all three GRB samples, clear evidence of a separation into two groups by the end of the first second was observed. The clean separation of bursts in the Swift/BAT sample indicates that the T1 interval could potentially be used to classify GRBs independently of their T90 duration. The less clear-cut cluster separation found in the BATSE and Fermi/GBM samples most likely arose from instrumental differences (e.g., energy ranges, triggering methods and sensitivities). Of the three instruments, Swift/BAT has the largest effective area, and detects more spectrally softer, long-duration GRBs [101], and fewer short GRBs, than BATSE or Fermi/GBM [80,102].
A total of 293 bursts were analysed, which were detected by both Fermi/GBM and Swift/BAT. There is excellent (274/293) agreement between the two instruments in the cluster membership of these GRBs using the T1 interval at 4 ms resolution. Differences in classification can primarily be attributed to the lack of clear separation between groups in the Fermi/GBM sample, which makes cluster identification less definitive than it is for Swift/BAT. In 6 of the 19 cases where cluster membership is found to disagree between the two detectors, significantly different (>50%) T90 durations are recorded by the instruments.

5.3. Time Intervals

The analysis was repeated for different intervals within the bursts to investigate the intervals in which classes may be identified in the Swift/BAT sample.
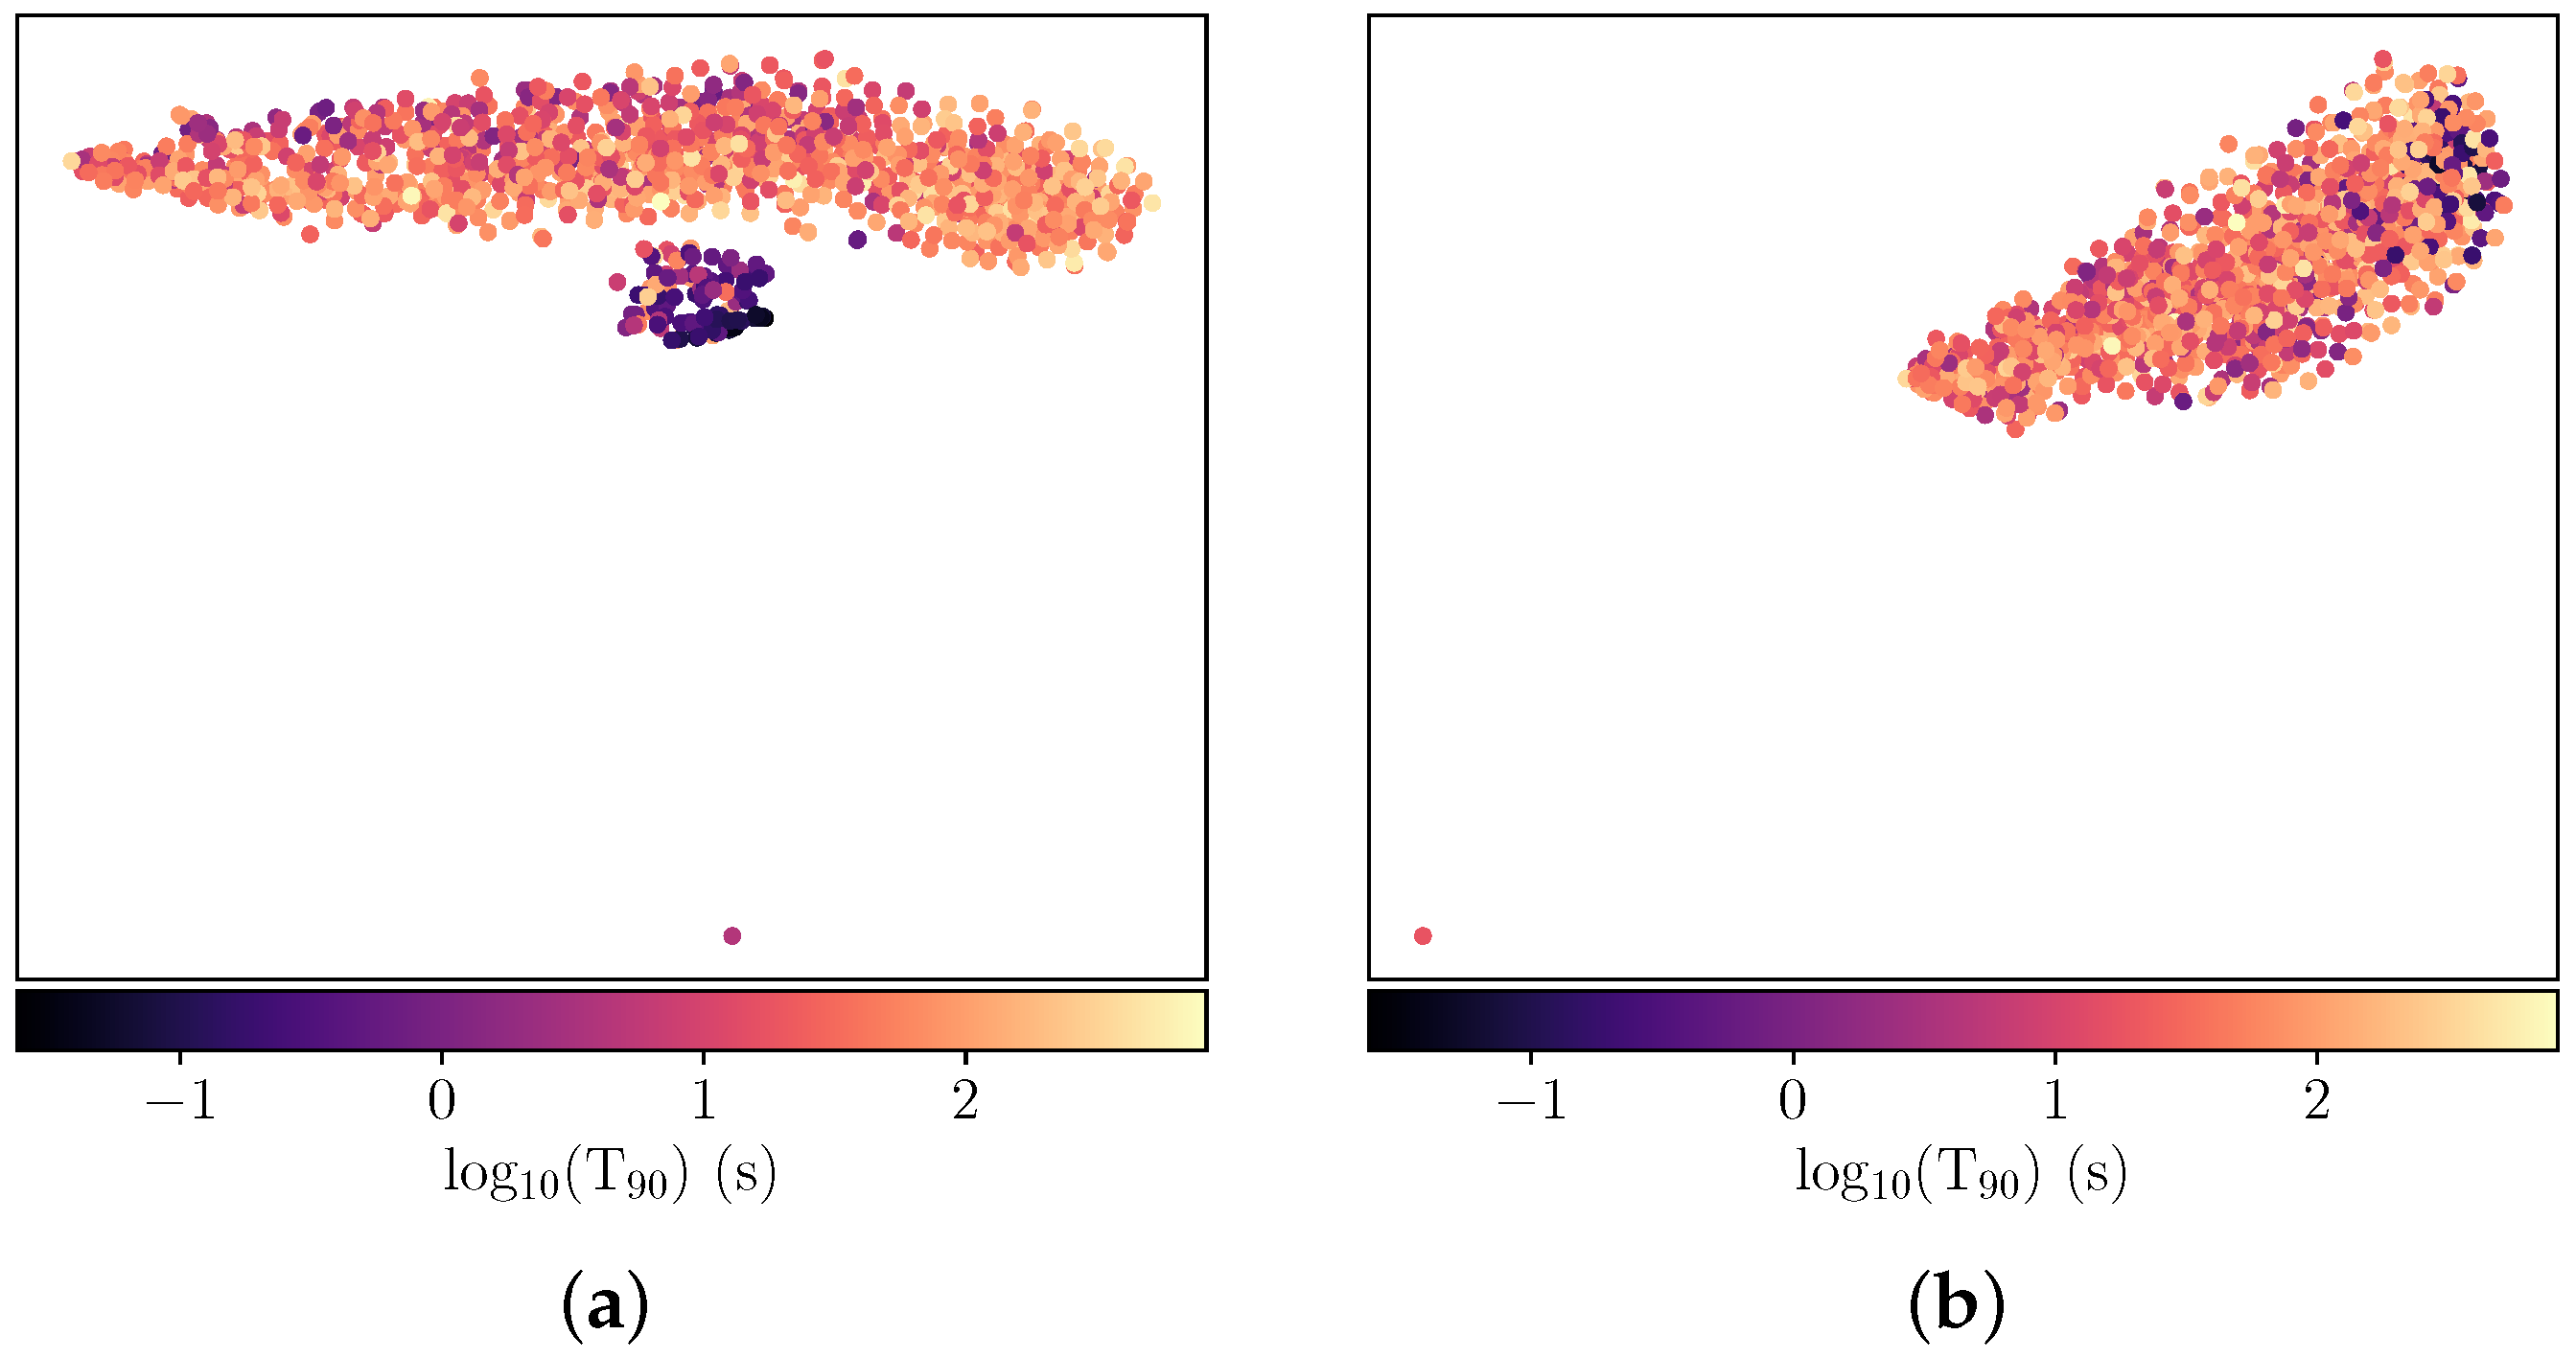
First, the feature extraction analysis with 4 ms resolution light curves was performed for the interval of T0 − 1 s to T0 + 1 s (Figure 8a). The addition of pre-trigger data is shown to produce almost identical results to those obtained by starting at T0. However, the analysis requires additional Principal Components to explain the variance, indicating that including 1 s of data before the trigger adds more noise than information. Secondly, when the selected interval is between T0 + 1.004 s and T0 + 2.008 s, the separation disappears, as shown in Figure 8b, indicating that the early prompt emission in the first second post-trigger is the key interval for separating the two classes.

5.4. Light Curve Classifications

In Salmon et al. [17], Gaussian Mixture Model-based clustering of the hardness-T90 plane identified two classes of bursts in the Swift/BAT and Fermi/GBM samples. The results suggest that the intermediate duration class may be an artefact of the application of unsuitable models, as was also suggested by Tarnopolski [25], Koen and Bere [103], Tarnopolski [104], Tarnopolski [105]. The results of the model-independent analysis of light curves presented in this paper and by Jespersen et al. [33] lend further support to this conclusion.
Jespersen et al. [33] found two distinct groups of bursts in their t-SNE map obtained from Fourier decomposition of full Swift/BAT light curves. The composition of the ‘type-S’ and ‘type-L’ groups from Jespersen et al. [33] are compared to the clusters found in this work. For the T100 interval, there is an agreement in classification for 96% of bursts, after removing bursts for which no light curve files are available. Although the same burst intervals are considered, Jespersen et al. [33] input flux-normalised light curves into a Fourier-based analysis, potentially leading to small differences in the resulting burst memberships compared to the wavelet-based analysis presented here. The light curves in this study were not flux-normalised, as the resulting t-SNE maps did not separate the groups.
More than 96% of the bursts classified using wavelets and the T1 interval were found to match the membership assigned by Jespersen et al. [33] based on Fourier decomposition in the T100 interval. Eight of the 20 bursts found to be within Group 1 in this study, classified as type-L by Jespersen et al. [33], have extended emission episodes, which are not captured within the first second.

5.5. Collapsar ‘Contamination’

The fraction of Swift/BAT bursts within Groups 1 and 2 can be compared to the expected distributions that are specific to the Swift/BAT detector.
Bromberg et al. [32] quantified the contamination of short GRB samples by collapsar bursts by fitting the duration distribution of Swift bursts with a function representing the merger and collapsar duration distributions. The model is based on the plateau in the duration distribution for shorter durations than the jet breakout time, which is predicted by the collapsar model [106]. According to this model ∼40% of Swift/BAT bursts with durations <2 s are collapsar bursts. Swift/BAT is more sensitive to soft GRBs, meaning that low-fluence long GRBs contaminate the short GRB population to a greater extent than they do for BATSE (∼10%) and Fermi/GBM (∼15%).
There are 27 bursts for which Bromberg et al. [32] assigns a probability of being a non-Collapsar of >90%. The majority (23) of these are classified as Group 1 in this analysis, indicating that Group 1 primarily consists of bursts arising from mergers. The collapsar (Group 2) contamination of Swift/BAT bursts with durations <2 s from our analysis of the first 1 s of prompt emission is 31.8%, or 34/107 bursts (Table 3), consistent within 1 σ with the predictions in Bromberg et al. [32]. The collapsar contamination of short-duration bursts for the T100 analysis is significantly lower, at ∼15%. These results suggest that classification based on the T1 interval may be useful for identifying collapsar ‘imposters’ in short GRB samples.

6. Notable GRBs

We discuss cluster membership for some notable GRBs. As a default, the discussion relates to the results obtained with the T1 interval at 4 ms resolution unless otherwise indicated. We identify cluster membership for GRBs in any of the three analysed samples, which have associated kilonovae or supernovae. We note that cluster membership for the BATSE and Fermi samples is not as clear-cut as it is for the Swift sample, and the cut in t-SNE space is made by eye.

6.1. GRBs with Associated Supernovae

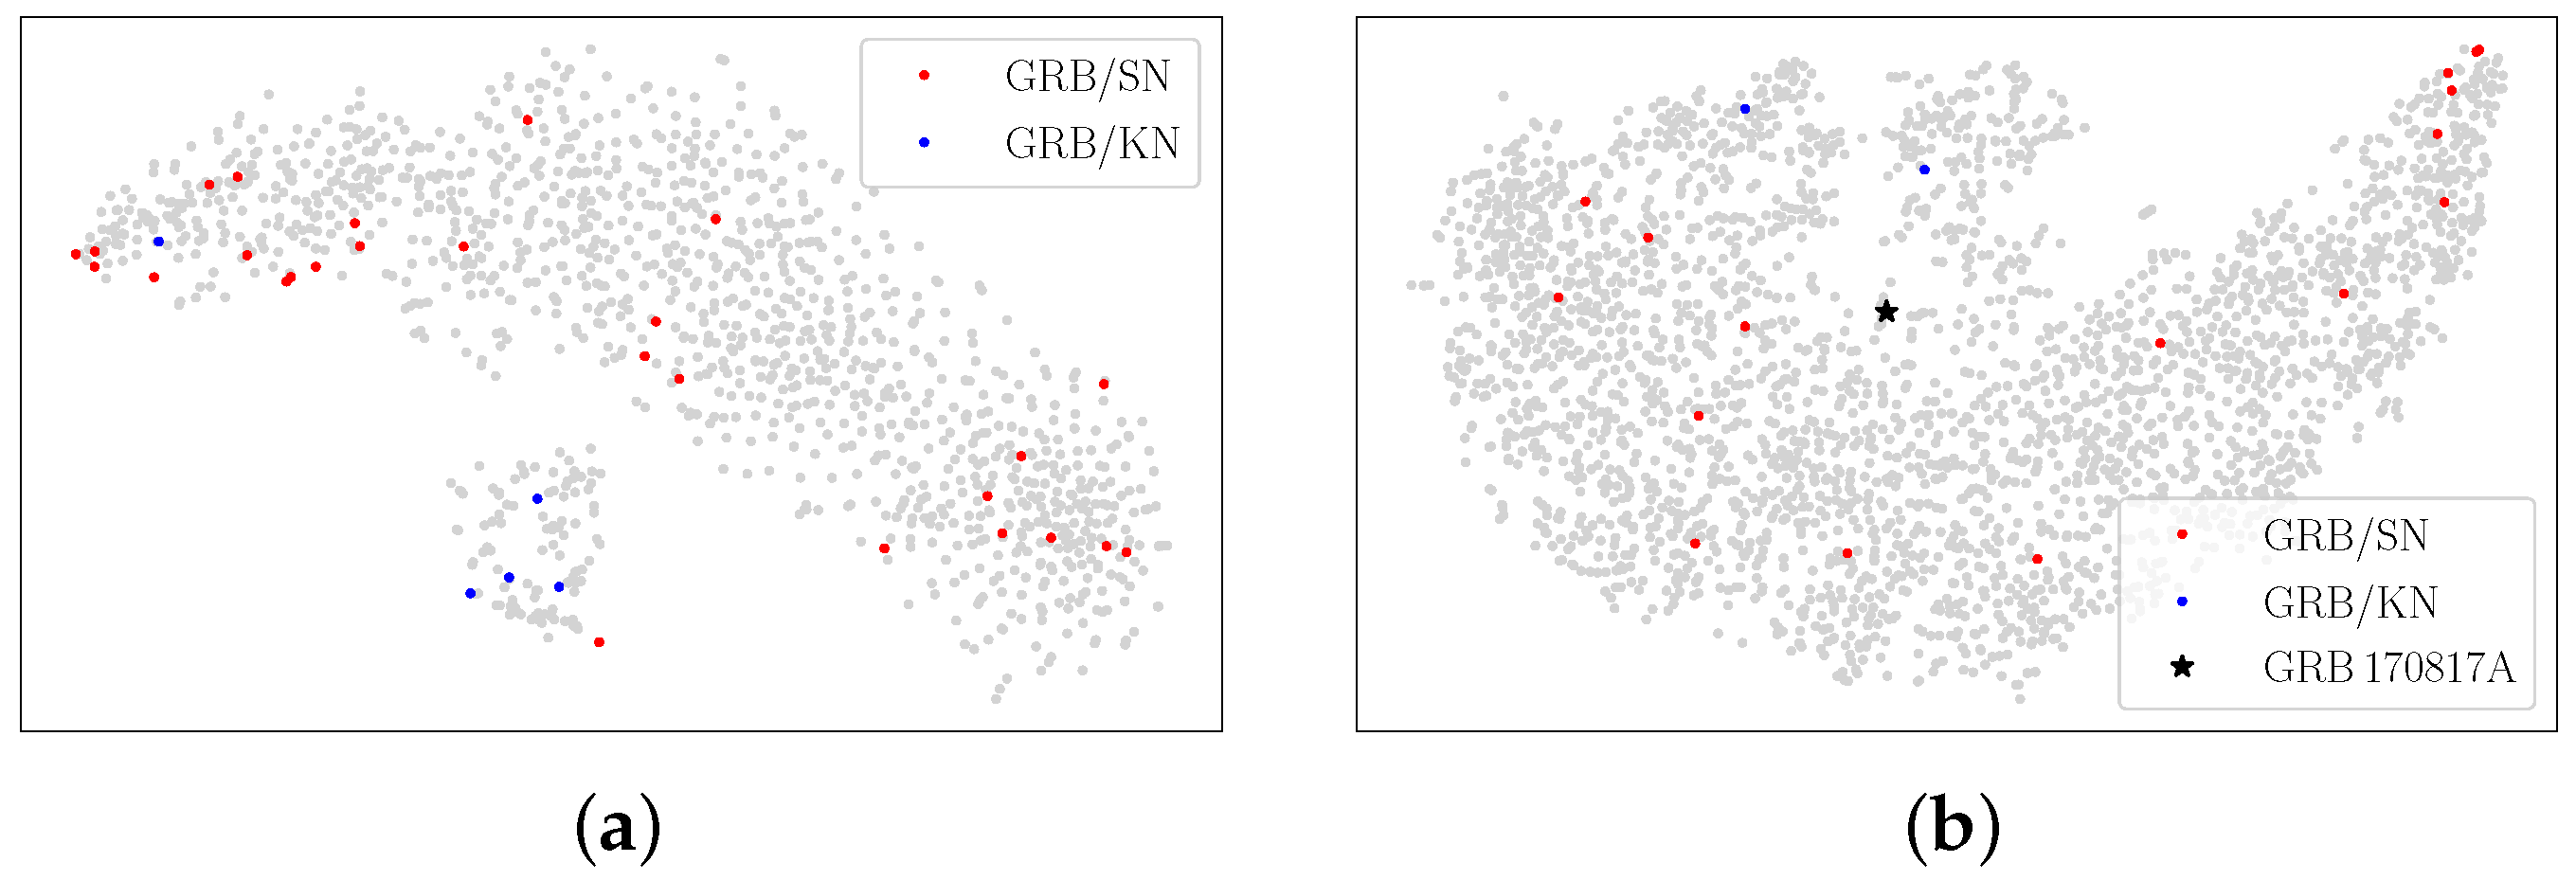
As discussed in Section 5.5, Group 2 is associated with collapsar bursts. Thus, it is expected that GRBs with associated supernovae will lie within Group 2. The list of 31 Swift and 10 Fermi Supernova (SN)-GRBs provided in Cano et al. [107] is extended to include additional SN-GRB events GRB 161219B/SN 2016jca [108], GRB 171205A/SN 2017htp [109], GRB 180728A/SN 2018fip [110,111], GRB 190114C/SN 2019jrj and GRB 190829A/AT2019 oyw [112] and the peculiar short GRB 200826A [113,114,115]. Figure 9 indicates the location of these bursts within the t-SNE plot. The 25 SN-GRBs for which light curve files are available lie in Group 2 of Swift/BAT and Fermi/GBM, as expected, with the exception of GRB 101219B, which is an outlier to Swift/BAT Group 1 but lies within Group 2 of Fermi/GBM bursts. The analysis using the T100 interval correctly places GRB 101219B in Group 2 for Swift/BAT. The shortest collapsar burst detected to date, GRB 200826A, lies within Group 2 of the Fermi/GBM sample despite its observed duration of T90 ≈ 0.96 s [115].
The remaining bursts are identified in Group 2, with their classifications unchanged by the interval used in analysis, with the exception of GRB 050824, which migrates to Group 1 when the T100 interval is used for analysis.

6.2. GRBs with Possible Kilonovae

The only confirmed kilonova is associated with GRB 170817A, which is in the Fermi/GBM sample (Figure 9b) and does not clearly belong to either group. However, GRB 170817A was not a standard ‘short’ GRB, and would probably have been unremarked on if not for the associated gravitational wave source [13,14]. Near-infrared excesses, similar to kilonova signatures, have been found in the afterglows of a handful of nearby short GRBs. Following detection in GRB 130603B [116,117], reanalysis of GRB 060614 [118,119], GRB 080503 [120] and GRB 050709 [121] revealed similar near-IR components. Since then, GRB 150101B [122], GRB 160821B [123,124,125,126] and GRB 200522A [127] have all been suggested as kilonova candidates.
Figure 9 shows that all the kilonova candidate bursts lie within Group 1 of Swift and Fermi GRBs, except for GRB 050709, for which no light curve file is available, and GRB 060614, which is in Group 2. GRB 060614 is an anomalous GRB with a short pulse followed by a longer period of soft flaring emission. Some properties of this burst are typical of the long GRB population [128], but the lack of supernova detection for this close burst (z = 0.125 Price et al. [129], Fugazza et al. [130]) and possible near-infrared excess led to the suggestion that this burst originates from a merger [22], or is within its own subclass [131,132,133,134,135]. Our results agree with the classification by Jespersen et al. [33], who place this burst in the longer-duration, collapsar group. When the T100 light-curve interval is considered, the classifications remain unchanged for the kilonova candidates, with the exception of GRB 080503, which moves to Group 2. This is an example of a GRB with a short initial spike and extended emission, which may be the result of a merger rather than a collapsar [120]. The T1 interval appears to return the more appropriate classification in this case.

7. Discussion

Studies of GRB pulses at early times have revealed that the dominant radiation process is usually photospheric emission [136,137,138,139,140,141]. These thermal pulses exhibit significant spectral evolution, with bursts usually evolving to be dominated by synchrotron emission [137,139,142]. If this is the case, the first second of all GRBs should be dominated by thermal pulses; therefore, the radiation process is unlikely to be the driver of the observed differences in light curves that appear at early times.
The feature extraction algorithm may identify differences in the spectral evolution and pulse shapes of the two burst groups. The spectral lags of long and short bursts are different, with many short bursts exhibiting zero lag [18,63]. The minimum variability timescales for short and long bursts have also been found to be different [44,45,46]. For example Golkhou et al. [46] found median minimum variability timescales of 10 ms and 45 ms for short and long bursts, respectively. Hakkila and Preece [64] found that pulses in short GRBs are shorter and harder than those in long GRBs, and exhibit more rapid spectral evolution. Coupled with the observation that shorter pulses have a higher peak flux and ∼90% of short GRBs consist of a single pulse, compared to 25–40% for long GRBs, pulse properties are likely to be a distinguishing feature in the first pulses and first seconds of a burst. Short GRBs have shorter pulse durations and their triple peaked substructure shows more intense precursor and decay peaks (on either side of the central peak) than long GRBs Hakkila et al. [56].
The magnitude of the PCA components in the different Swift/BAT energy bands indicate that Bands 2 and 3 contain the most variance; therefore, they are the most important for the 4 ms light curves. Figure 10 shows that the results of the feature extraction algorithm only applied to Band 3 data, showing that some segregation of the bursts into two groups is evident using light curves in one energy band. Thus, energy-dependent pulse characteristics are not the sole driver of the classification.

Cumulative Counts

Figure 6 shows that, for the Swift/BAT sample, Group 1 and Group 2 GRBs, identified within the T1 interval, mostly consist of bursts from the classical short-duration (T90 < 2 s) and long-duration (T90 > 2 s) samples, respectively. However, there are some ‘strays’, as shown in Table 3 and discussed in Section 5.
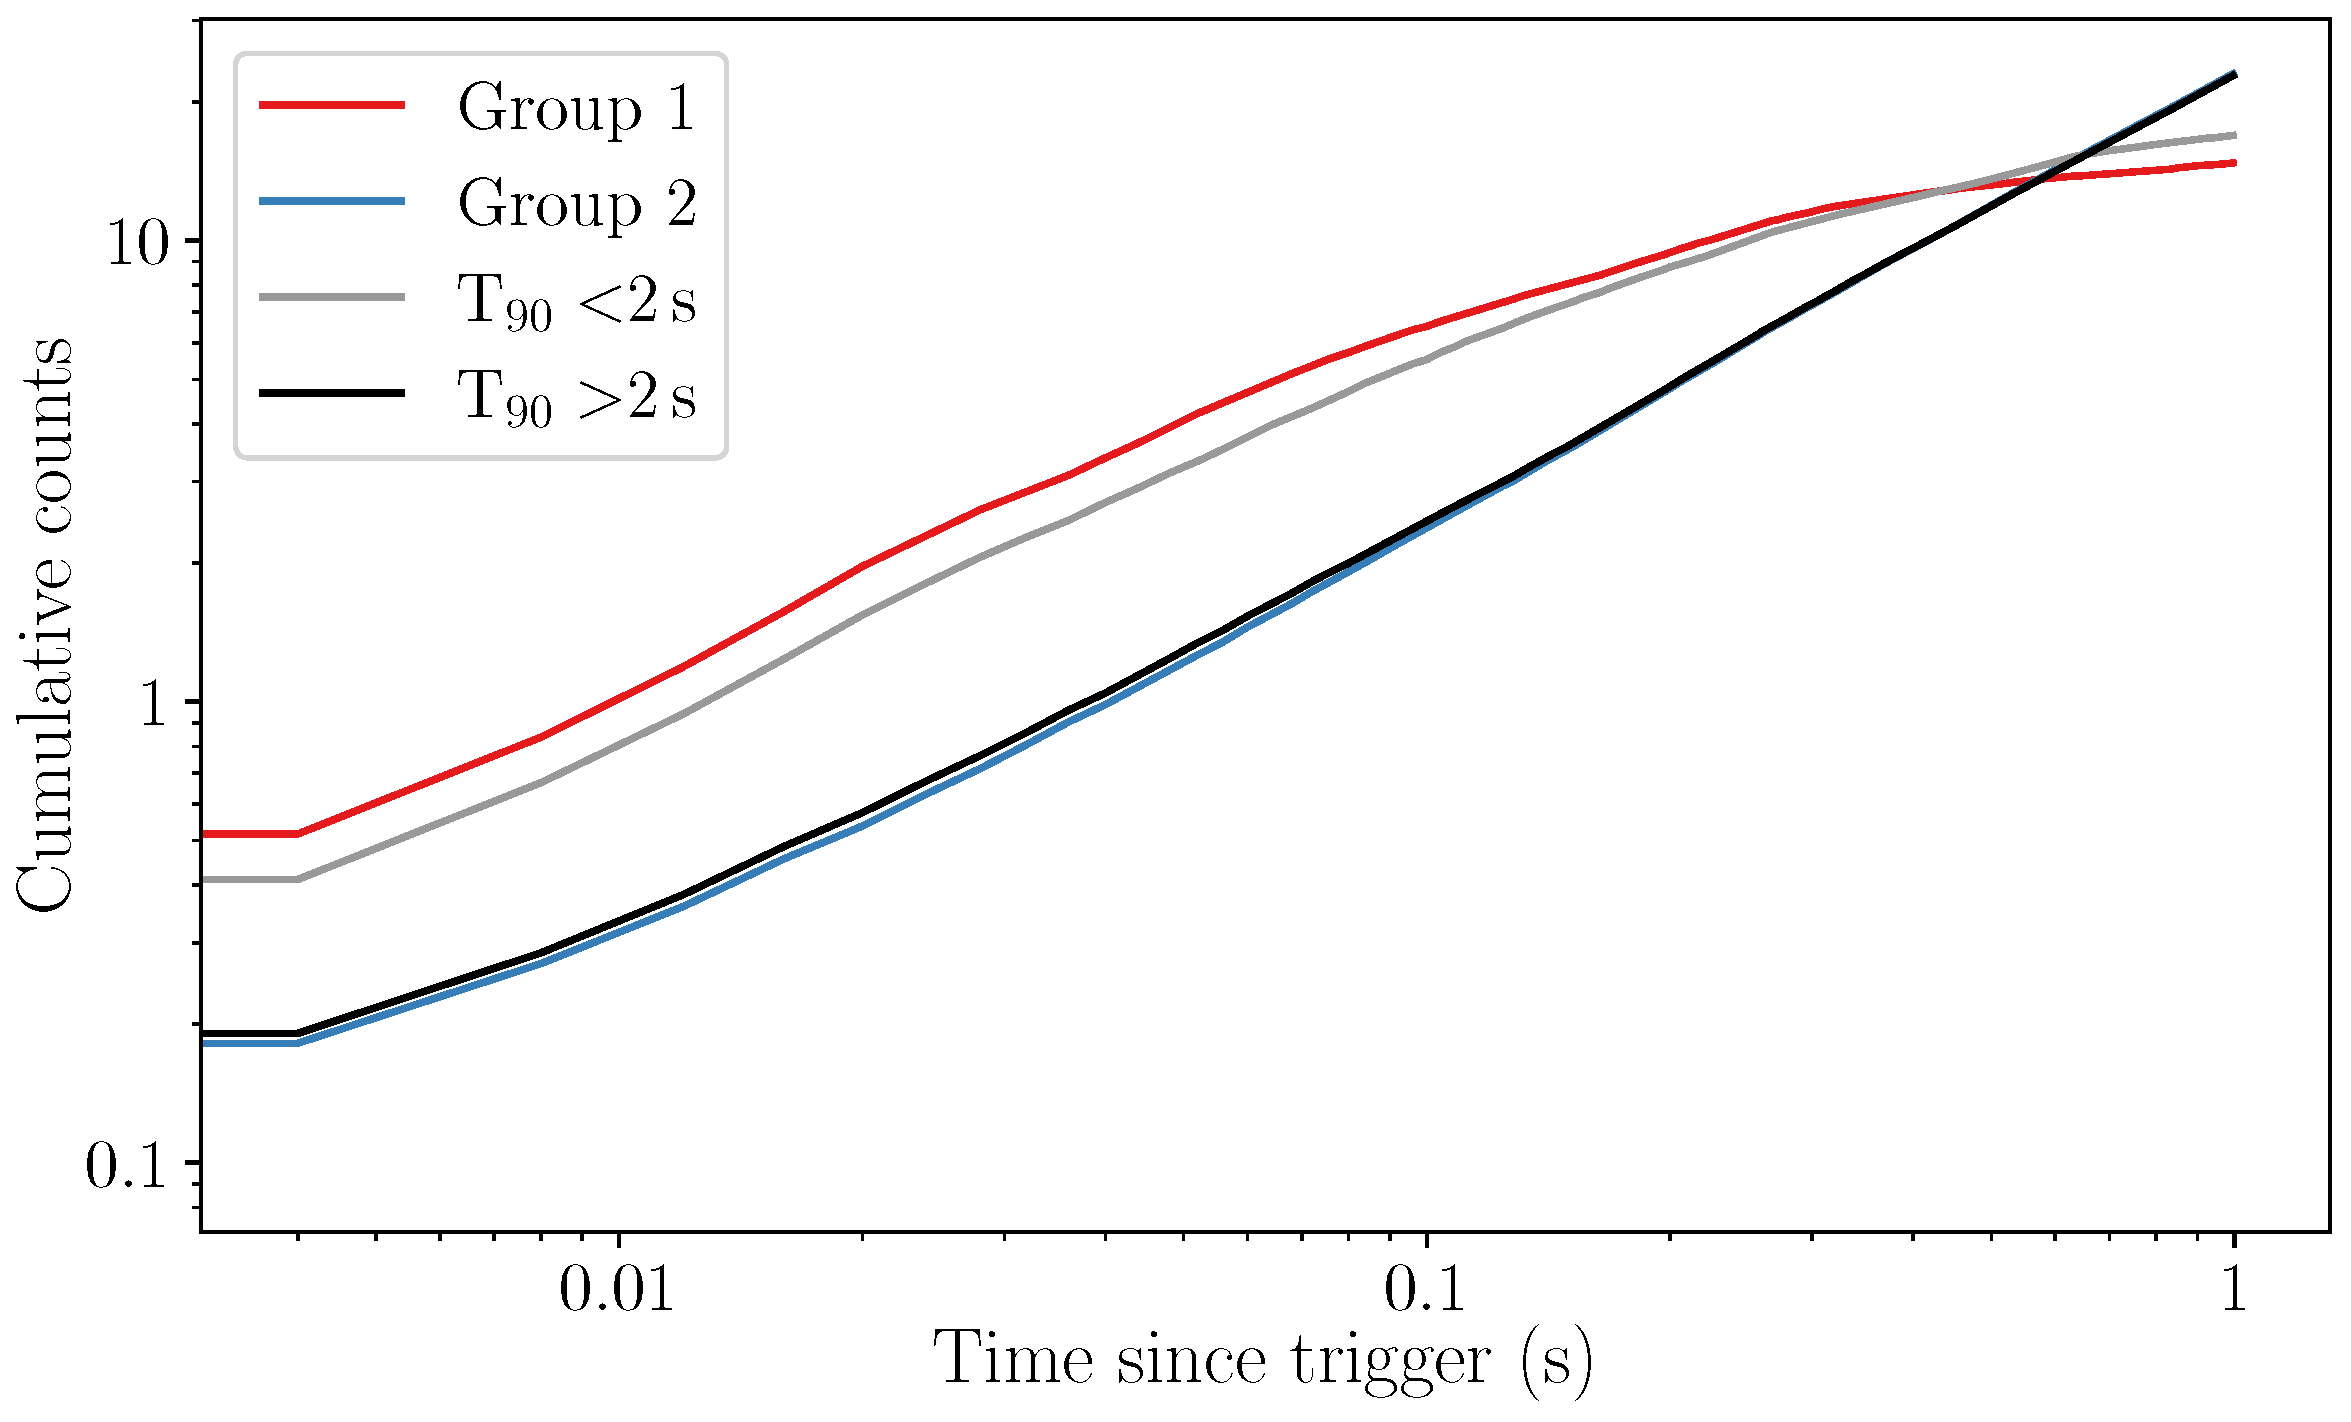
The counts measured in Band 3 (50–100 keV) of the first second of Swift/BAT 4 ms light curves are summed and normalised by the number of light curves, to obtain an average cumulative counts measure for bursts in each group in Table 3 (Figure 11). The cumulative counts of Group 1 and Group 2 bursts track those of short and long GRBs, respectively, during the first second.
The results of this analysis suggest that the behaviour of GRB pulses in the first second carries essential information, which is needed to classify GRBs in the vast majority of cases, independent of their duration. The characteristics of the ‘long’ Group 1 and ‘short’ Group 2 bursts suggests that they have not been misclassified, but are duration outliers of their identified class. Group 1 and Group 2 bursts evolve in a similar way to the traditional short and long classes, respectively.
Previous studies have interpreted the cumulative GRB light-curves slope as a measure of the cumulative power output of the central engine [143]. Combined with the association of Group 1 and 2 bursts with kilonovae and supernovae, respectively (Section 6), the cumulative counts behaviour in the first second suggests that Group 1 and 2 represent distinct progenitors, namely, the merger and collapsar populations.

8. Conclusions

Wavelet decomposition, combined with PCA and t-SNE, provides an effective method for extracting the similarities between gamma-ray light curves from BATSE, Swift/BAT and Fermi/GBM. The features extracted from the T100 interval of light curves in four energy bands at 64 ms resolution reveal a separation between two groups of bursts. These groups are labelled Group 1 and Group 2. Two groups have also been identified through feature extraction from high resolution (4 ms) light curves within the first seconds of prompt emission. The shortest timescale at which this separation is clear is one second (T1 interval).
The separation between groups is clearest for Swift/BAT and is less distinct for the BATSE and Fermi/GBM samples of bursts, perhaps due to instrumental effects. Despite the different timescales and resolutions that were studied, there is >95% agreement between the groups identified within the T100 and T1 interval for Swift/BAT. The T100 interval is shown to produce different and more classical classifications for some bursts, especially those with long emission episodes. There is also >95% agreement between the results of the T1 analysis with the results of the Fourier-based feature extraction of Swift/BAT light curves by Jespersen et al. [33]. The separation between Swift/BAT groups is clearest when all four energy bands are considered. However, energy-dependent characteristics are not the sole effect that drives the classification, as some separation can only be seen when one energy band is considered. Pulse shape and evolution may be important, and the accumulation of counts within the first second is found to be distinct between groups.
Group 1 mostly consists of short-duration, spectrally hard bursts. Group 2 mostly consists of spectrally soft, long-duration bursts. When segmented at T90 = 2 s, the traditional dividing line between long and short GRBs, we found that 99% (97%) of Swift/BAT Group 2 bursts have durations >2 s when the T100 (T1) interval is used. A total of 32% of the 107 GRBs with T90 < 2 s are identified as Group 2 bursts when the T1 interval is used, consistent (within 1 σ ) with a model in which the duration distribution of Swift bursts is fit with a function representing the merger and collapsar distributions, possibly reflecting the amount of collapsar ‘contamination’ in the short GRB sample. The observed contamination fraction is significantly lower (16%) when the T100 interval is used. Thus, the groups can be associated with distinct progenitors, namely, mergers and collapsars. GRBs with associated supernovae are within Group 2, while GRBs with suspected kilonovae lie in Group 1.
Previous studies found that the pulse and spectral properties of the early seconds of long GRBs are similar to those of short GRBs. In this analysis, no significant differences can be identified in pulse or spectral properties to account for Group 1 and Group 2 GRBs being distinguishable in the T1 interval. Differences in minimum variability timescale, identifiable only when the 4 ms resolution data are used, may account for some of the observed behaviour. However, the two groups in subsequent 1 s intervals should also be evident, which is not the case. The observed different slopes in the first second between the two groups in the combined cumulative counts may point towards differences in the central engine.
The presented results indicate that the nature of a burst may be inferred from the earliest prompt emission, without considering the full burst duration. Prompt classification will be helpful in the era of ‘big data’ in time-domain astronomy. Gravitational wave detectors will detect mergers at increased rates in the near- and longer-term [144]. State-of-the-art optical surveys such as the Vera Rubin Observatory will deliver an increased number of transient targets in the crowded optical sky [145]. While many optical transients are false positives, the rare gamma-ray transients can pinpoint the unambiguous target of interest. The early detection and classification of these gamma-ray transients will help to prioritise counterpart follow-up for optical telescopes and spectroscopic observations. Classification schemes and triggering algorithms could incorporate a wavelet-based analysis, such as that presented here, to prioritise targets for follow-up observations.

Supplementary Materials

The following are available online at https://www.mdpi.com/article/10.3390/galaxies10040078/s1. The electronic version of this article showcases Figure 4 as three mp4 animations of the t-SNE plots for BATSE, Swift and Fermi. We provide the full version of Table 2 which includes the classification of Swift/BAT GRBs using the first second of prompt emission.

Author Contributions

Conceptualization, L.S., L.H. and A.M.-C.; methodology, L.S., L.H. and A.M.-C.; software, L.S.; validation, L.S., L.H. and A.M.-C.; formal analysis, L.S.; investigation, L.S.; resources, L.S., L.H. and A.M.-C.; data curation, L.S.; writing—original draft preparation, L.S.; writing—review and editing, L.H. and A.M.-C.; visualization, L.S.; supervision, L.H. and A.M.-C.; project administration, L.H. and A.M.-C.; funding acquisition, L.H. and A.M.-C. All authors have read and agreed to the published version of the manuscript.

Funding

L.S. acknowledges the Irish Research Council Postgraduate Scholarship No GOIPG/2017/1525. LH acknowledges support from Science Foundation Ireland (Grant number 19/FFP/6777) and the EU H2020 (Grant agreement 871158).

Institutional Review Board Statement

Not applicable.

Informed Consent Statement

Not applicable.

Data Availability Statement

The BATSE Public Data Archive (https://heasarc.gsfc.nasa.gov/FTP/compton/data/batse/trigger/, accessed on 17 February 2021) hosts the 64 ms light curves in ascii files, and the TTE data which is used to generate the 4 ms BATSE light curves. The Swift/BAT light curves analysed in this paper are available as ascii files from the Swift/BAT Gamma-Ray Burst Catalogue (https://swift.gsfc.nasa.gov/results/batgrbcat/, accessed on 29 January 2021). The Fermi-GBM Data Tools [81] are used to access Fermi/GBM TTE files.

Acknowledgments

This research made use of the following Python packages: NumPy [146], Matplotlib [147], pandas [148,149], scikit-learn [150], GPFlow [83] and PyWavelets [89].

Conflicts of Interest

The authors declare no conflict of interest. The funders had no role in the design of the study; in the collection, analyses, or interpretation of data; in the writing of the manuscript, or in the decision to publish the results.

References

  1. Kouveliotou, C.; Meegan, C.A.; Fishman, G.J.; Bhat, N.P.; Briggs, M.S.; Koshut, T.M.; Paciesas, W.S.; Pendleton, G.N. Identification of Two Classes of Gamma-Ray Bursts. Astrophys. J. 1993, 413, L101. [Google Scholar] [CrossRef]
  2. Perley, D.A.; Niino, Y.; Tanvir, N.R.; Vergani, S.D.; Fynbo, J.P.U. Long-Duration Gamma-Ray Burst Host Galaxies in Emission and Absorption. Space Sci. Rev. 2016, 202, 111–142. [Google Scholar] [CrossRef] [Green Version]
  3. Galama, T.J.; Vreeswijk, P.M.; van Paradijs, J.; Kouveliotou, C.; Augusteijn, T.; Böhnhardt, H.; Brewer, J.P.; Doublier, V.; Gonzalez, J.F.; Leibundgut, B.; et al. An unusual supernova in the error box of the γ-ray burst of 25 April 1998. Nature 1998, 395, 670–672. [Google Scholar] [CrossRef]
  4. Hjorth, J.; Sollerman, J.; Møller, P.; Fynbo, J.P.U.; Woosley, S.E.; Kouveliotou, C.; Tanvir, N.R.; Greiner, J.; Andersen, M.I.; Castro-Tirado, A.J.; et al. A very energetic supernova associated with the γ-ray burst of 29 March 2003. Nature 2003, 423, 847–850. [Google Scholar] [CrossRef] [Green Version]
  5. Stanek, K.Z.; Matheson, T.; Garnavich, P.M.; Martini, P.; Berlind, P.; Caldwell, N.; Challis, P.; Brown, W.R.; Schild, R.; Krisciunas, K.; et al. Spectroscopic Discovery of the Supernova 2003dh Associated with GRB 030329. Astrophys. J. 2003, 591, L17–L20. [Google Scholar] [CrossRef] [Green Version]
  6. Woosley, S.E.; Bloom, J.S. The Supernova Gamma-Ray Burst Connection. Annu. Rev. Astron. Astrophys. 2006, 44, 507–556. [Google Scholar] [CrossRef] [Green Version]
  7. MacFadyen, A.I.; Woosley, S.E. Collapsars: Gamma-Ray Bursts and Explosions in “Failed Supernovae”. Astrophys. J. 1999, 524, 262–289. [Google Scholar] [CrossRef] [Green Version]
  8. Eichler, D.; Livio, M.; Piran, T.; Schramm, D.N. Nucleosynthesis, neutrino bursts and γ-rays from coalescing neutron stars. Nature 1989, 340, 126–128. [Google Scholar] [CrossRef]
  9. Narayan, R.; Paczynski, B.; Piran, T. Gamma-Ray Bursts as the Death Throes of Massive Binary Stars. Astrophys. J. 1992, 395, L83. [Google Scholar] [CrossRef] [Green Version]
  10. Berger, E. Short-Duration Gamma-Ray Bursts. Annu. Rev. Astron. Astrophys. 2014, 52, 43–105. [Google Scholar] [CrossRef] [Green Version]
  11. Berger, E. A Short Gamma-ray Burst “No-host” Problem? Investigating Large Progenitor Offsets for Short GRBs with Optical Afterglows. Astrophys. J. 2010, 722, 1946–1961. [Google Scholar] [CrossRef] [Green Version]
  12. Tunnicliffe, R.L.; Levan, A.J.; Tanvir, N.R.; Rowlinson, A.; Perley, D.A.; Bloom, J.S.; Cenko, S.B.; O’Brien, P.T.; Cobb, B.E.; Wiersema, K.; et al. On the nature of the ‘hostless’ short GRBs. Mon. Not. R. Astron. Soc. 2014, 437, 1495–1510. [Google Scholar] [CrossRef] [Green Version]
  13. Goldstein, A.; Veres, P.; Burns, E.; Briggs, M.S.; Hamburg, R.; Kocevski, D.; Wilson-Hodge, C.A.; Preece, R.D.; Poolakkil, S.; Roberts, O.J.; et al. An Ordinary Short Gamma-Ray Burst with Extraordinary Implications: Fermi-GBM Detection of GRB 170817A. Astrophys. J. 2017, 848, L14. [Google Scholar] [CrossRef] [Green Version]
  14. Savchenko, V.; Ferrigno, C.; Kuulkers, E.; Bazzano, A.; Bozzo, E.; Brandt, S.; Chenevez, J.; Courvoisier, T.L.; Diehl, R.; Domingo, A.; et al. INTEGRAL detection of the first prompt gamma-ray signal coincident with the gravitational-wave event GW170817. Astrophys. J. 2017, 848, L15. [Google Scholar] [CrossRef] [Green Version]
  15. Abbott, B.P.; Abbott, R.; Abbott, T.D.; Acernese, F.; Ackley, K.; Adams, C.; Adams, T.; Addesso, P.; Adhikari, R.X.; Adya, V.B.; et al. Multi-messenger Observations of a Binary Neutron Star Merger. Astrophys. J. 2017, 848, L12. [Google Scholar] [CrossRef]
  16. Horváth, I. A Third Class of Gamma-Ray Bursts? Astrophys. J. 1998, 508, 757–759. [Google Scholar] [CrossRef] [Green Version]
  17. Salmon, L.; Martin-Carrillo, A.; Hanlon, L. Two Dimensional Clustering of Swift/BAT and Fermi/GBM Gamma-Ray Bursts. Galaxies 2022. submitted. [Google Scholar] [CrossRef]
  18. Norris, J.P.; Bonnell, J.T. Short Gamma-Ray Bursts with Extended Emission. Astrophys. J. 2006, 643, 266–275. [Google Scholar] [CrossRef]
  19. Barkov, M.V.; Pozanenko, A.S. Model of the extended emission of short gamma-ray bursts. Mon. Not. R. Astron. Soc. 2011, 417, 2161–2165. [Google Scholar] [CrossRef] [Green Version]
  20. Norris, J.P.; Gehrels, N.; Scargle, J.D. Threshold for Extended Emission in Short Gamma-Ray Bursts. Astrophys. J. 2011, 217, 411. [Google Scholar] [CrossRef]
  21. D’Avanzo, P. Short gamma-ray bursts: A review. J. High Energy Astrophys. 2015, 7, 73–80. [Google Scholar] [CrossRef] [Green Version]
  22. Zhang, B.; Zhang, B.B.; Liang, E.W.; Gehrels, N.; Burrows, D.N.; Mészáros, P. Making a Short Gamma-Ray Burst from a Long One: Implications for the Nature of GRB 060614. Astrophys. J. 2007, 655, L25–L28. [Google Scholar] [CrossRef] [Green Version]
  23. Zhang, B.; Zhang, B.B.; Virgili, F.J.; Liang, E.W.; Kann, D.A.; Wu, X.F.; Proga, D.; Lv, H.J.; Toma, K.; Mészáros, P.; et al. Discerning the Physical Origins of Cosmological Gamma-ray Bursts Based on Multiple Observational Criteria: The Cases of z = 6.7 GRB 080913, z = 8.2 GRB 090423, and Some Short/Hard GRBs. Astrophys. J. 2009, 703, 1696–1724. [Google Scholar] [CrossRef] [Green Version]
  24. Li, Y.; Zhang, B.; Yuan, Q. A Comparative Study of Long and Short GRBs. II. A Multiwavelength Method to Distinguish Type II (Massive Star) and Type I (Compact Star) GRBs. Astrophys. J. 2020, 897, 154. [Google Scholar] [CrossRef]
  25. Tarnopolski, M. Distinguishing short and long Fermi gamma-ray bursts. Mon. Not. R. Astron. Soc. 2015, 454, 1132–1139. [Google Scholar] [CrossRef] [Green Version]
  26. Goldstein, A.; Preece, R.D.; Briggs, M.S. A New Discriminator for Gamma-ray Burst Classification: The Epeak-fluence Energy Ratio. Astrophys. J. 2010, 721, 1329–1332. [Google Scholar] [CrossRef] [Green Version]
  27. Qin, Y.P.; Chen, Z.F. Statistical classification of gamma-ray bursts based on the Amati relation. Mon. Not. R. Astron. Soc. 2013, 430, 163–173. [Google Scholar] [CrossRef] [Green Version]
  28. Lü, H.J.; Liang, E.W.; Zhang, B.B.; Zhang, B. A New Classification Method for Gamma-ray Bursts. Astrophys. J. 2010, 725, 1965–1970. [Google Scholar] [CrossRef] [Green Version]
  29. Lü, H.J.; Zhang, B.; Liang, E.W.; Zhang, B.B.; Sakamoto, T. The ‘amplitude’ parameter of gamma-ray bursts and its implications for GRB classification. Mon. Not. R. Astron. Soc. 2014, 442, 1922–1929. [Google Scholar] [CrossRef] [Green Version]
  30. Zhang, S.; Shao, L.; Zhang, B.B.; Zou, J.H.; Sun, H.Y.; Yao, Y.J.; Li, L.L. A Tight Three-parameter Correlation and Related Classification on Gamma-Ray Bursts. arXiv 2022, arXiv:2201.10861. [Google Scholar] [CrossRef]
  31. Hakkila, J.; Giblin, T.W.; Roiger, R.J.; Haglin, D.J.; Paciesas, W.S.; Meegan, C.A. How Sample Completeness Affects Gamma-Ray Burst Classification. Astrophys. J. 2003, 582, 320–329. [Google Scholar] [CrossRef]
  32. Bromberg, O.; Nakar, E.; Piran, T.; Sari, R. Short versus Long and Collapsars versus Non-collapsars: A Quantitative Classification of Gamma-Ray Bursts. Astrophys. J. 2013, 764, 179. [Google Scholar] [CrossRef] [Green Version]
  33. Jespersen, C.K.; Severin, J.B.; Steinhardt, C.L.; Vinther, J.; Fynbo, J.P.U.; Selsing, J.; Watson, D. An Unambiguous Separation of Gamma-Ray Bursts into Two Classes from Prompt Emission Alone. Astrophys. J. 2020, 896, L20. [Google Scholar] [CrossRef]
  34. Mallat, S.G. A theory for multiresolution signal decomposition—The wavelet representation. IEEE Trans. Pattern Anal. Mach. Intell. 1989, 11, 674–693. [Google Scholar] [CrossRef] [Green Version]
  35. Meredith, D.C.; Ryan, J.M.; Young, C.A.; Lestrade, J.P. Wavelet Analysis of Gamma Ray Bursts. AIP Conf. Proc. 1994, 307, 701. [Google Scholar] [CrossRef]
  36. Young, C.A.; Meredith, D.C.; Ryan, J.M. A Compact Representation of Gamma-Ray Burst Time Series. Astrophys. Space Sci. 1995, 231, 119–122. [Google Scholar] [CrossRef]
  37. Bagoly, Z.; Balázs, L.G.; Horváth, I.; Mészáros, A. Wavelet Analysis of the BATSE 64ms GRB Lightcurves. ASP Conf. Ser. 2004, 312, 51. [Google Scholar]
  38. Hurley, K.J.; McBreen, B.; Quilligan, F.; Delaney, M.; Hanlon, L. Wavelet analysis and lognormal distributions in GRBs. AIP Conf. Ser. 1998, 428, 191–195. [Google Scholar] [CrossRef] [Green Version]
  39. Quilligan, F.; Hurley, K.J.; McBreen, B.; Hanlon, L.; Duggan, P. Characteristic properties of peaks in GRBs. Astron. Astrophys. Suppl. Ser. 1999, 138, 419–420. [Google Scholar] [CrossRef] [Green Version]
  40. Quilligan, F.; McBreen, B.; Hanlon, L.; McBreen, S.; Hurley, K.J.; Watson, D. Temporal properties of gamma ray bursts as signatures of jets from the central engine. Astron. Astrophys. 2002, 385, 377–398. [Google Scholar] [CrossRef] [Green Version]
  41. Qin, Y.P.; Liang, E.W.; Xie, G.Z.; Su, C.Y. Statistical Properties of the Highest Pulses in Gamma-Ray Bursts. Chin. J. Astron. Astrophys. 2003, 3, 38–48. [Google Scholar] [CrossRef] [Green Version]
  42. Walker, K.C.; Schaefer, B.E.; Fenimore, E.E. Gamma-Ray Bursts Have Millisecond Variability. Astrophys. J. 2000, 537, 264–269. [Google Scholar] [CrossRef]
  43. MacLachlan, G.A.; Shenoy, A.; Sonbas, E.; Dhuga, K.S.; Eskandarian, A.; Maximon, L.C.; Parke, W.C. The minimum variability time-scale and its relation to pulse profiles of Fermi GRBs. Mon. Not. R. Astron. Soc. 2012, 425, L32–L35. [Google Scholar] [CrossRef] [Green Version]
  44. MacLachlan, G.A.; Shenoy, A.; Sonbas, E.; Dhuga, K.S.; Cobb, B.E.; Ukwatta, T.N.; Morris, D.C.; Eskandarian, A.; Maximon, L.C.; Parke, W.C. Minimum variability time-scales of long and short GRBs. Mon. Not. R. Astron. Soc. 2013, 432, 857–865. [Google Scholar] [CrossRef] [Green Version]
  45. Golkhou, V.Z.; Butler, N.R. Uncovering the Intrinsic Variability of Gamma-Ray Bursts. Astrophys. J. 2014, 787, 90. [Google Scholar] [CrossRef] [Green Version]
  46. Golkhou, V.Z.; Butler, N.R.; Littlejohns, O.M. The Energy Dependence of GRB Minimum Variability Timescales. Astrophys. J. 2015, 811, 93. [Google Scholar] [CrossRef]
  47. Varughese, M.M.; von Sachs, R.; Stephanou, M.; Bassett, B.A. Non-parametric transient classification using adaptive wavelets. Mon. Not. R. Astron. Soc. 2015, 453, 2848–2861. [Google Scholar] [CrossRef] [Green Version]
  48. Lochner, M.; McEwen, J.D.; Peiris, H.V.; Lahav, O.; Winter, M.K. Photometric Supernova Classification with Machine Learning. Astrophys. J. 2016, 225, 31. [Google Scholar] [CrossRef] [Green Version]
  49. Vargas dos Santos, M.; Quartin, M.; Reis, R.R.R. On the cosmological performance of photometrically classified supernovae with machine learning. Mon. Not. R. Astron. Soc. 2020, 497, 2974–2991. [Google Scholar] [CrossRef]
  50. Norris, J.P.; Share, G.H.; Messina, D.C.; Dennis, B.R.; Desai, U.D.; Cline, T.L.; Matz, S.M.; Chupp, E.L. Spectral Evolution of Pulse Structures in Gamma-Ray Bursts. Astrophys. J. 1986, 301, 213. [Google Scholar] [CrossRef]
  51. Golenetskii, S.V.; Mazets, E.P.; Aptekar, R.L.; Ilinskii, V.N. Correlation between luminosity and temperature in γ-ray burst sources. Nature 1983, 306, 451–453. [Google Scholar] [CrossRef]
  52. Fenimore, E.E.; in ’t Zand, J.J.M.; Norris, J.P.; Bonnell, J.T.; Nemiroff, R.J. Gamma-Ray Burst Peak Duration as a Function of Energy. Astrophys. J. 1995, 448, L101. [Google Scholar] [CrossRef]
  53. Nemiroff, R.J.; Norris, J.P.; Kouveliotou, C.; Fishman, G.J.; Meegan, C.A.; Paciesas, W.S. Gamma-Ray Bursts Are Time-asymmetric. Astrophys. J. 1994, 423, 432. [Google Scholar] [CrossRef]
  54. Norris, J.P.; Nemiroff, R.J.; Bonnell, J.T.; Scargle, J.D.; Kouveliotou, C.; Paciesas, W.S.; Meegan, C.A.; Fishman, G.J. Attributes of Pulses in Long Bright Gamma-Ray Bursts. Astrophys. J. 1996, 459, 393. [Google Scholar] [CrossRef]
  55. Hakkila, J.; Preece, R.D. Unification of Pulses in Long and Short Gamma-Ray Bursts: Evidence from Pulse Properties and Their Correlations. Astrophys. J. 2011, 740, 104. [Google Scholar] [CrossRef] [Green Version]
  56. Hakkila, J.; Horváth, I.; Hofesmann, E.; Lesage, S. Properties of Short Gamma-ray Burst Pulses from a BATSE TTE GRB Pulse Catalog. Astrophys. J. 2018, 855, 101. [Google Scholar] [CrossRef] [Green Version]
  57. Cheng, L.X.; Ma, Y.Q.; Cheng, K.S.; Lu, T.; Zhou, Y.Y. The time delay of gamma-ray bursts in the soft energy band. Astron. Astrophys. 1995, 300, 746. [Google Scholar]
  58. Norris, J.P.; Marani, G.F.; Bonnell, J.T. Connection between Energy-dependent Lags and Peak Luminosity in Gamma-Ray Bursts. Astrophys. J. 2000, 534, 248–257. [Google Scholar] [CrossRef]
  59. Wu, B.; Fenimore, E. Spectral Lags of Gamma-Ray Bursts From Ginga and BATSE. Astrophys. J. 2000, 535, L29–L32. [Google Scholar] [CrossRef] [Green Version]
  60. Ukwatta, T.N.; Dhuga, K.S.; Stamatikos, M.; Dermer, C.D.; Sakamoto, T.; Sonbas, E.; Parke, W.C.; Maximon, L.C.; Linnemann, J.T.; Bhat, P.N.; et al. The lag-luminosity relation in the GRB source frame: An investigation with Swift BAT bursts. Mon. Not. R. Astron. Soc. 2012, 419, 614–623. [Google Scholar] [CrossRef] [Green Version]
  61. Ukwatta, T.N.; Stamatikos, M.; Dhuga, K.S.; Sakamoto, T.; Barthelmy, S.D.; Eskandarian, A.; Gehrels, N.; Maximon, L.C.; Norris, J.P.; Parke, W.C. Spectral Lags and the Lag-Luminosity Relation: An Investigation with Swift BAT Gamma-ray Bursts. Astrophys. J. 2010, 711, 1073–1086. [Google Scholar] [CrossRef] [Green Version]
  62. Hakkila, J.; Giblin, T.W.; Norris, J.P.; Fragile, P.C.; Bonnell, J.T. Correlations between Lag, Luminosity, and Duration in Gamma-Ray Burst Pulses. Astrophys. J. 2008, 677, L81. [Google Scholar] [CrossRef]
  63. Bernardini, M.G.; Ghirlanda, G.; Campana, S.; Covino, S.; Salvaterra, R.; Atteia, J.L.; Burlon, D.; Calderone, G.; D’Avanzo, P.; D’Elia, V.; et al. Comparing the spectral lag of short and long gamma-ray bursts and its relation with the luminosity. Mon. Not. R. Astron. Soc. 2015, 446, 1129–1138. [Google Scholar] [CrossRef] [Green Version]
  64. Hakkila, J.; Preece, R.D. Gamma-Ray Burst Pulse Shapes: Evidence for Embedded Shock Signatures? Astrophys. J. 2014, 783, 88. [Google Scholar] [CrossRef] [Green Version]
  65. Bhat, P.N.; Fishman, G.J.; Meegan, C.A.; Wilson, R.B.; Kouveliotou, C.; Paciesas, W.S.; Pendleton, G.N.; Schaefer, B.E. Spectral Evolution of a Subclass of Gamma-Ray Bursts Observed by BATSE. Astrophys. J. 1994, 426, 604. [Google Scholar] [CrossRef]
  66. Band, D.L. Gamma-Ray Burst Spectral Evolution through Cross-Correlations of Discriminator Light Curves. Astrophys. J. 1997, 486, 928–937. [Google Scholar] [CrossRef]
  67. Ford, L.A.; Band, D.L.; Matteson, J.L.; Briggs, M.S.; Pendleton, G.N.; Preece, R.D.; Paciesas, W.S.; Teegarden, B.J.; Palmer, D.M.; Schaefer, B.E.; et al. BATSE Observations of Gamma-Ray Burst Spectra. II. Peak Energy Evolution in Bright, Long Bursts. Astrophys. J. 1995, 439, 307. [Google Scholar] [CrossRef]
  68. Borgonovo, L.; Ryde, F. On the Hardness-Intensity Correlation in Gamma-Ray Burst Pulses. Astrophys. J. 2001, 548, 770–786. [Google Scholar] [CrossRef] [Green Version]
  69. Peng, Z.Y.; Ma, L.; Lu, R.J.; Fang, L.M.; Bao, Y.Y.; Yin, Y. Spectral hardness evolution characteristics of tracking gamma-ray burst pulses. New Astron. 2009, 14, 311–320. [Google Scholar] [CrossRef] [Green Version]
  70. Lu, R.J.; Hou, S.J.; Liang, E.W. The Ep-flux Correlation in the Rising and Decaying Phases of gamma-ray Burst Pulses: Evidence for Viewing Angle Effect? Astrophys. J. 2010, 720, 1146–1154. [Google Scholar] [CrossRef] [Green Version]
  71. Hakkila, J.; Lien, A.; Sakamoto, T.; Morris, D.; Neff, J.E.; Giblin, T.W. Swift Observations of Gamma-Ray Burst Pulse Shapes: GRB Pulse Spectral Evolution Clarified. Astrophys. J. 2015, 815, 134. [Google Scholar] [CrossRef] [Green Version]
  72. Ghirlanda, G.; Nava, L.; Ghisellini, G. Spectral-luminosity relation within individual Fermi gamma rays bursts. Astron. Astrophys. 2010, 511, A43. [Google Scholar] [CrossRef] [Green Version]
  73. Ghirlanda, G.; Ghisellini, G.; Nava, L.; Burlon, D. Spectral evolution of Fermi/GBM short gamma-ray bursts. Mon. Not. R. Astron. Soc. 2011, 410, L47–L51. [Google Scholar] [CrossRef] [Green Version]
  74. Lu, R.J.; Wei, J.J.; Liang, E.W.; Zhang, B.B.; Lü, H.J.; Lü, L.Z.; Lei, W.H.; Zhang, B. A Comprehensive Analysis of Fermi Gamma-Ray Burst Data. II. Ep Evolution Patterns and Implications for the Observed Spectrum-Luminosity Relations. Astrophys. J. 2012, 756, 112. [Google Scholar] [CrossRef] [Green Version]
  75. Kocevski, D.; Petrosian, V. On the Lack of Time Dilation Signatures in Gamma-Ray Burst Light Curves. Astrophys. J. 2013, 765, 116. [Google Scholar] [CrossRef] [Green Version]
  76. Littlejohns, O.M.; Tanvir, N.R.; Willingale, R.; Evans, P.A.; O’Brien, P.T.; Levan, A.J. Are gamma-ray bursts the same at high redshift and low redshift? Mon. Not. R. Astron. Soc. 2013, 436, 3640–3655. [Google Scholar] [CrossRef] [Green Version]
  77. Fishman, G.; Johnson, W.N. Proceedings of the Gamma Ray Observatory Science Workshop; Johnson, W.N., Ed.; NASA/GSFC Greenbelt: Greenbelt, MD, USA, 1989; pp. 2–39. [Google Scholar]
  78. Gehrels, N.; Chincarini, G.; Giommi, P.; Mason, K.O.; Nousek, J.A.; Wells, A.A.; White, N.E.; Barthelmy, S.D.; Burrows, D.N.; Cominsky, L.R.; et al. The Swift Gamma-Ray Burst Mission. Astrophys. J. 2004, 611, 1005–1020. [Google Scholar] [CrossRef] [Green Version]
  79. Meegan, C.; Lichti, G.; Bhat, P.N.; Bissaldi, E.; Briggs, M.S.; Connaughton, V.; Diehl, R.; Fishman, G.; Greiner, J.; Hoover, A.S.; et al. The Fermi Gamma-ray Burst Monitor. Astrophys. J. 2009, 702, 791–804. [Google Scholar] [CrossRef] [Green Version]
  80. Lien, A.; Sakamoto, T.; Barthelmy, S.D.; Baumgartner, W.H.; Cannizzo, J.K.; Chen, K.; Collins, N.R.; Cummings, J.R.; Gehrels, N.; Krimm, H.A.; et al. The Third Swift Burst Alert Telescope Gamma-Ray Burst Catalog. Astrophys. J. 2016, 829, 7. [Google Scholar] [CrossRef] [Green Version]
  81. Goldstein, A.; Cleveland, W.H.; Kocevski, D. Fermi GBM Data Tools: V1.04. 2020. Available online: https://fermi.gsfc.nasa.gov/ssc/data/analysis/gbm (accessed on 26 April 2022).
  82. Sacks, J.; Welch, W.J.; Mitchell, T.J.; Wynn, H.P. Design and analysis of computer experiments. Stat. Sci. 1989, 4, 409–423. [Google Scholar] [CrossRef]
  83. De, G.; Matthews, A.G.; Van Der Wilk, M.; Nickson, T.; Fujii, K.; Boukouvalas, A.; León-Villagrá, P.; Ghahramani, Z.; Hensman, J. GPflow: A Gaussian process library using TensorFlow. J. Mach. Learn. Res. 2017, 18, 1299–1304. [Google Scholar]
  84. Abadi, M.; Agarwal, A.; Barham, P.; Brevdo, E.; Chen, Z.; Citro, C.; Corrado, G.S.; Davis, A.; Dean, J.; Devin, M.; et al. TensorFlow: Large-Scale Machine Learning on Heterogeneous Systems. 2015. Available online: tensorflow.org (accessed on 15 March 2021).
  85. Daubechies, I. Ten Lectures on Wavelets; SIAM: Philadelphia, PA, USA, 1992. [Google Scholar]
  86. Holschneider, M.; Kronland-Martinet, R.; Morlet, J.; Tchamitchian, P. A Real-Time Algorithm for Signal Analysis with the Help of the Wavelet Transform. In Wavelets. Time-Frequency Methods and Phase Space; Combes, J.M., Grossmann, A., Tchamitchian, P., Eds.; Spinger: Berlin/Heidelberg, Germany, 1989; p. 286. [Google Scholar]
  87. Addison, P.S. The Illustrated Wavelet Transform Handbook: Introductory Theory and Applications in Science, Engineering, Medicine and Finance; CRC Press: Boca Raton, FL, USA, 2017. [Google Scholar]
  88. Rhif, M.; Ben Abbes, A.; Farah, I.R.; Martínez, B.; Sang, Y. Wavelet transform application for/in non-stationary time-series analysis: A review. Appl. Sci. 2019, 9, 1345. [Google Scholar] [CrossRef] [Green Version]
  89. Lee, G.; Gommers, R.; Waselewski, F.; Wohlfahrt, K.; O’Leary, A. PyWavelets: A Python package for wavelet analysis. J. Open Source Softw. 2019, 4, 1237. [Google Scholar] [CrossRef]
  90. Daubechies, I. Orthonormal bases of compactly supported wavelets. Commun. Pure Appl. Math. 1988, 41, 909–996. [Google Scholar] [CrossRef] [Green Version]
  91. Pearson, K. LIII. On lines and planes of closest fit to systems of points in space. Lond. Edinb. Dublin Philos. Mag. J. Sci. 1901, 2, 559–572. [Google Scholar] [CrossRef] [Green Version]
  92. Hotelling, H. Analysis of a complex of statistical variables into principal components. J. Educ. Psychol. 1933, 24, 417. [Google Scholar] [CrossRef]
  93. Hinton, G.E.; Roweis, S.T. Stochastic neighbor embedding. Adv. Neural Inf. Process. Syst. 2003, 15, 857–864. [Google Scholar]
  94. Kullback, S.; Leibler, R.A. On Information and Sufficiency. Ann. Math. Stat. 1951, 22, 79–86. [Google Scholar] [CrossRef]
  95. Maaten, L.v.d.; Hinton, G. Visualizing data using t-SNE. J. Mach. Learn. Res. 2008, 9, 2579–2605. [Google Scholar]
  96. Fraley, C.; Raftery, A.E. MCLUST: Software for model-based cluster analysis. J. Classif. 1999, 16, 297–306. [Google Scholar] [CrossRef] [Green Version]
  97. Scrucca, L.; Fop, M.; Murphy, T.B.; Raftery, A.E. mclust 5: Clustering, classification and density estimation using Gaussian finite mixture models. R J. 2016, 8, 289–317. [Google Scholar] [CrossRef] [PubMed] [Green Version]
  98. Schwarz, G. Estimating the dimension of a model. Ann. Stat. 1978, 6, 461–464. [Google Scholar] [CrossRef]
  99. Baudry, J.P.; Raftery, A.E.; Celeux, G.; Lo, K.; Gottardo, R. Combining Mixture Components for Clustering. J. Comput. Graph. Stat. 2010, 19, 332–353. [Google Scholar] [CrossRef] [Green Version]
  100. Gibson, S.L.; Wynn, G.A.; Gompertz, B.P.; O’Brien, P.T. Fallback accretion on to a newborn magnetar: Short GRBs with extended emission. Mon. Not. R. Astron. Soc. 2017, 470, 4925–4940. [Google Scholar] [CrossRef] [Green Version]
  101. Racusin, J.L.; Oates, S.R.; Schady, P.; Burrows, D.N.; de Pasquale, M.; Donato, D.; Gehrels, N.; Koch, S.; McEnery, J.; Piran, T.; et al. Fermi and Swift Gamma-ray Burst Afterglow Population Studies. Astrophys. J. 2011, 738, 138. [Google Scholar] [CrossRef] [Green Version]
  102. Burgess, J.M.; Greiner, J.; Bégué, D.; Giannios, D.; Berlato, F.; Lipunov, V.M. Viewing Short Gamma-Ray Bursts From a Different Angle. Front. Astron. Space Sci. 2020, 7, 40. [Google Scholar] [CrossRef]
  103. Koen, C.; Bere, A. On multiple classes of gamma-ray bursts, as deduced from autocorrelation functions or bivariate duration/hardness ratio distributions. Mon. Not. R. Astron. Soc. 2012, 420, 405–415. [Google Scholar] [CrossRef] [Green Version]
  104. Tarnopolski, M. Analysis of gamma-ray burst duration distribution using mixtures of skewed distributions. Mon. Not. R. Astron. Soc. 2016. [Google Scholar] [CrossRef] [Green Version]
  105. Tarnopolski, M. Analysis of the Duration-Hardness Ratio Plane of Gamma-Ray Bursts Using Skewed Distributions. Astrophys. J. 2019, 870, 105. [Google Scholar] [CrossRef]
  106. Bromberg, O.; Nakar, E.; Piran, T.; Sari, R. An Observational Imprint of the Collapsar Model of Long Gamma-Ray Bursts. Astrophys. J. 2012, 749, 110. [Google Scholar] [CrossRef] [Green Version]
  107. Cano, Z.; Wang, S.Q.; Dai, Z.G.; Wu, X.F. The Observer’s Guide to the Gamma-Ray Burst Supernova Connection. Adv. Astron. 2017, 2017, 8929054. [Google Scholar] [CrossRef]
  108. Ashall, C.; Mazzali, P.A.; Pian, E.; Woosley, S.E.; Palazzi, E.; Prentice, S.J.; Kobayashi, S.; Holmbo, S.; Levan, A.; Perley, D.; et al. GRB 161219B/SN 2016jca: A powerful stellar collapse. Mon. Not. R. Astron. Soc. 2019, 487, 5824–5839. [Google Scholar] [CrossRef]
  109. Melandri, A.; Malesani, D.B.; Izzo, L.; Japelj, J.; Vergani, S.D.; Schady, P.; Sagués Carracedo, A.; de Ugarte Postigo, A.; Anderson, J.P.; Barbarino, C.; et al. GRB 171010A/SN 2017htp: A GRB-SN at z = 0.33. Mon. Not. R. Astron. Soc. 2019, 490, 5366–5374. [Google Scholar] [CrossRef] [Green Version]
  110. Izzo, L.; Rossi, A.; Malesani, D.; Heintz, K.; Selsing, J.; Schady, P.; Starling, R.; Sollerman, J.; Leloudas, G.; Cano, Z.; et al. GRB 180728A: Discovery of the associated supernova. GRB Coord. Netw. 2018, 23142, 1. [Google Scholar]
  111. Selsing, J.; Izzo, L.; Rossi, A.; Malesani, D.; Heintz, K.; Schady, P.; Starling, R.; Sollerman, J.; Leloudas, G.; Cano, Z.; et al. GRB 180728A: Classification of the associated SN 2018fip. GRB Coord. Netw. 2018, 23181, 1. [Google Scholar]
  112. Hu, Y.D.; Castro-Tirado, A.J.; Kumar, A.; Gupta, R.; Valeev, A.F.; Pandey, S.B.; Kann, D.A.; Castellón, A.; Agudo, I.; Aryan, A.; et al. 10.4 m GTC observations of the nearby VHE-detected GRB 190829A/SN 2019oyw. Astron. Astrophys. 2021, 646, A50. [Google Scholar] [CrossRef]
  113. Ahumada, T.; Singer, L.P.; Anand, S.; Coughlin, M.W.; Kasliwal, M.M.; Ryan, G.; Andreoni, I.; Cenko, S.B.; Fremling, C.; Kumar, H.; et al. Discovery and confirmation of the shortest gamma ray burst from a collapsar. arXiv 2021, arXiv:2105.05067. [Google Scholar] [CrossRef]
  114. Rossi, A.; Rothberg, B.; Palazzi, E.; Kann, D.A.; D’Avanzo, P.; Klose, S.; Perego, A.; Pian, E.; Savaglio, S.; Stratta, G.; et al. The peculiar short-duration GRB 200826A and its supernova. arXiv 2021, arXiv:2105.03829. [Google Scholar] [CrossRef]
  115. Zhang, B.B.; Liu, Z.K.; Peng, Z.K.; Li, Y.; Lü, H.J.; Yang, J.; Yang, Y.S.; Yang, Y.H.; Meng, Y.Z.; Zou, J.H.; et al. A Peculiarly Short-duration Gamma-Ray Burst from Massive Star Core Collapse. arXiv 2021, arXiv:2105.05021. [Google Scholar] [CrossRef]
  116. Berger, E.; Fong, W.; Chornock, R. An r-process Kilonova Associated with the Short-hard GRB 130603B. Astrophys. J. 2013, 774, L23. [Google Scholar] [CrossRef] [Green Version]
  117. Tanvir, N.R.; Levan, A.J.; Fruchter, A.S.; Hjorth, J.; Hounsell, R.A.; Wiersema, K.; Tunnicliffe, R.L. A ‘kilonova’ associated with the short-duration γ-ray burst GRB 130603B. Nature 2013, 500, 547–549. [Google Scholar] [CrossRef] [PubMed] [Green Version]
  118. Jin, Z.P.; Fan, Y.Z.; Wei, D.M. An r-process macronova/kilonova in GRB 060614: Evidence for the merger of a neutron star-black hole binary. In Proceedings of the 13th International Symposium on Origin of Matter and Evolution of Galaxies (OMEG2015), Beijing, China, 24–27 June 2015; EDP Sciences: Les Ulis, France, 2016; Volume 109, p. 08002. [Google Scholar]
  119. Yang, B.; Jin, Z.P.; Li, X.; Covino, S.; Zheng, X.Z.; Hotokezaka, K.; Fan, Y.Z.; Piran, T.; Wei, D.M. A possible macronova in the late afterglow of the long-short burst GRB 060614. Nat. Commun. 2015, 6, 7323. [Google Scholar] [CrossRef] [PubMed]
  120. Perley, D.A.; Metzger, B.D.; Granot, J.; Butler, N.R.; Sakamoto, T.; Ramirez-Ruiz, E.; Levan, A.J.; Bloom, J.S.; Miller, A.A.; Bunker, A.; et al. GRB 080503: Implications of a Naked Short Gamma-Ray Burst Dominated by Extended Emission. Astrophys. J. 2009, 696, 1871–1885. [Google Scholar] [CrossRef]
  121. Jin, Z.P.; Hotokezaka, K.; Li, X.; Tanaka, M.; D’Avanzo, P.; Fan, Y.Z.; Covino, S.; Wei, D.M.; Piran, T. The Macronova in GRB 050709 and the GRB-macronova connection. Nat. Commun. 2016, 7, 12898. [Google Scholar] [CrossRef]
  122. Troja, E.; Ryan, G.; Piro, L.; van Eerten, H.; Cenko, S.B.; Yoon, Y.; Lee, S.K.; Im, M.; Sakamoto, T.; Gatkine, P.; et al. A luminous blue kilonova and an off-axis jet from a compact binary merger at z = 0.1341. Nat. Commun. 2018, 9, 4089. [Google Scholar] [CrossRef] [Green Version]
  123. Kasliwal, M.M.; Korobkin, O.; Lau, R.M.; Wollaeger, R.; Fryer, C.L. Infrared Emission from Kilonovae: The Case of the Nearby Short Hard Burst GRB 160821B. Astrophys. J. 2017, 843, L34. [Google Scholar] [CrossRef]
  124. Jin, Z.P.; Li, X.; Wang, H.; Wang, Y.Z.; He, H.N.; Yuan, Q.; Zhang, F.W.; Zou, Y.C.; Fan, Y.Z.; Wei, D.M. Short GRBs: Opening Angles, Local Neutron Star Merger Rate, and Off-axis Events for GRB/GW Association. Astrophys. J. 2018, 857, 128. [Google Scholar] [CrossRef]
  125. Lamb, G.P.; Tanvir, N.R.; Levan, A.J.; de Ugarte Postigo, A.; Kawaguchi, K.; Corsi, A.; Evans, P.A.; Gompertz, B.; Malesani, D.B.; Page, K.L.; et al. Short GRB 160821B: A Reverse Shock, a Refreshed Shock, and a Well-sampled Kilonova. Astrophys. J. 2019, 883, 48. [Google Scholar] [CrossRef]
  126. Troja, E.; Castro-Tirado, A.J.; Becerra González, J.; Hu, Y.; Ryan, G.S.; Cenko, S.B.; Ricci, R.; Novara, G.; Sánchez-Rámirez, R.; Acosta-Pulido, J.A.; et al. The afterglow and kilonova of the short GRB 160821B. Mon. Not. R. Astron. Soc. 2019, 489, 2104–2116. [Google Scholar] [CrossRef] [Green Version]
  127. Fong, W.; Laskar, T.; Rastinejad, J.; Escorial, A.R.; Schroeder, G.; Barnes, J.; Kilpatrick, C.D.; Paterson, K.; Berger, E.; Metzger, B.D.; et al. The Broadband Counterpart of the Short GRB 200522A at z = 0.5536: A Luminous Kilonova or a Collimated Outflow with a Reverse Shock? Astrophys. J. 2021, 906, 127. [Google Scholar] [CrossRef]
  128. Xu, D.; Starling, R.L.C.; Fynbo, J.P.U.; Sollerman, J.; Yost, S.; Watson, D.; Foley, S.; O’Brien, P.T.; Hjorth, J. In Search of Progenitors for Supernovaless Gamma-Ray Bursts 060505 and 060614: Re-examination of Their Afterglows. Astrophys. J. 2009, 696, 971–979. [Google Scholar] [CrossRef] [Green Version]
  129. Price, P.A.; Berger, E.; Fox, D.B. GRB 060614: Redshift. GRB Coord. Netw. 2006, 5275, 1. [Google Scholar]
  130. Fugazza, D.; Malesani, D.; Romano, P.; Tagliaferri, G.; Covino, S.; Chincarini, G.; Della Valle, M.; Fiore, F.; Stella, L. GRB 060614: Redshift confirmation. GRB Coord. Netw. 2006, 5276, 1. [Google Scholar]
  131. Della Valle, M.; Chincarini, G.; Panagia, N.; Tagliaferri, G.; Malesani, D.; Testa, V.; Fugazza, D.; Campana, S.; Covino, S.; Mangano, V.; et al. An enigmatic long-lasting γ-ray burst not accompanied by a bright supernova. Nature 2006, 444, 1050–1052. [Google Scholar] [CrossRef] [PubMed]
  132. Fynbo, J.P.U.; Watson, D.; Thöne, C.C.; Sollerman, J.; Bloom, J.S.; Davis, T.M.; Hjorth, J.; Jakobsson, P.; Jørgensen, U.G.; Graham, J.F.; et al. No supernovae associated with two long-duration γ-ray bursts. Nature 2006, 444, 1047–1049. [Google Scholar] [CrossRef] [Green Version]
  133. Gal-Yam, A.; Fox, D.B.; Price, P.A.; Ofek, E.O.; Davis, M.R.; Leonard, D.C.; Soderberg, A.M.; Schmidt, B.P.; Lewis, K.M.; Peterson, B.A.; et al. A novel explosive process is required for the γ-ray burst GRB 060614. Nature 2006, 444, 1053–1055. [Google Scholar] [CrossRef]
  134. Gehrels, N.; Norris, J.P.; Barthelmy, S.D.; Granot, J.; Kaneko, Y.; Kouveliotou, C.; Markwardt, C.B.; Mészáros, P.; Nakar, E.; Nousek, J.A.; et al. A new γ-ray burst classification scheme from GRB060614. Nature 2006, 444, 1044–1046. [Google Scholar] [CrossRef] [Green Version]
  135. Lu, Y.; Huang, Y.F.; Zhang, S.N. A Tidal Disruption Model for the Gamma-Ray Burst of GRB 060614. Astrophys. J. 2008, 684, 1330–1335. [Google Scholar] [CrossRef] [Green Version]
  136. Meng, Y.Z.; Geng, J.J.; Zhang, B.B.; Wei, J.J.; Xiao, D.; Liu, L.D.; Gao, H.; Wu, X.F.; Liang, E.W.; Huang, Y.F.; et al. The Origin of the Prompt Emission for Short GRB 170817A: Photosphere Emission or Synchrotron Emission? Astrophys. J. 2018, 860, 72. [Google Scholar] [CrossRef]
  137. Li, L.; Ryde, F.; Pe’er, A.; Yu, H.F.; Acuner, Z. Bayesian Time-Resolved Spectroscopy of Multi-Pulsed GRBs: Variations of Emission Properties amongst Pulses. arXiv 2020, arXiv:2012.03038. [Google Scholar]
  138. Dereli-Bégué, H.; Pe’er, A.; Ryde, F. Classification of Photospheric Emission in Short GRBs. Astrophys. J. 2020, 897, 145. [Google Scholar] [CrossRef]
  139. Li, L. Multipulse Fermi Gamma-Ray Bursts. I. Evidence of the Transition from Fireball to Poynting-flux-dominated Outflow. Astrophys. J. 2019, 242, 16. [Google Scholar] [CrossRef] [Green Version]
  140. Acuner, Z.; Ryde, F.; Pe’er, A.; Mortlock, D.; Ahlgren, B. The Fraction of Gamma-Ray Bursts with an Observed Photospheric Emission Episode. Astrophys. J. 2020, 893, 128. [Google Scholar] [CrossRef]
  141. Acuner, Z.; Ryde, F. Clustering of gamma-ray burst types in the Fermi GBM catalogue: Indications of photosphere and synchrotron emissions during the prompt phase. Mon. Not. R. Astron. Soc. 2018, 475, 1708–1724. [Google Scholar] [CrossRef]
  142. Ryde, F. The Cooling Behavior of Thermal Pulses in Gamma-Ray Bursts. Astrophys. J. 2004, 614, 827–846. [Google Scholar] [CrossRef] [Green Version]
  143. McBreen, S.; McBreen, B.; Hanlon, L.; Quilligan, F. Cumulative light curves of gamma-ray bursts and relaxation systems. Astron. Astrophys. 2002, 393, L29–L32. [Google Scholar] [CrossRef]
  144. Abbott, B.P.; Abbott, R.; Abbott, T.D.; Abraham, S.; Acernese, F.; Ackley, K.; Adams, C.; Adya, V.B.; Affeldt, C.; Agathos, M.; et al. Prospects for observing and localizing gravitational-wave transients with Advanced LIGO, Advanced Virgo and KAGRA. Living Rev. Relativ. 2020, 23, 3. [Google Scholar] [CrossRef]
  145. Ivezić, Ž.; Kahn, S.M.; Tyson, J.A.; Abel, B.; Acosta, E.; Allsman, R.; Alonso, D.; AlSayyad, Y.; Anderson, S.F.; Andrew, J.; et al. LSST: From Science Drivers to Reference Design and Anticipated Data Products. Astrophys. J. 2019, 873, 111. [Google Scholar] [CrossRef]
  146. Harris, C.R.; Millman, K.J.; van der Walt, S.J.; Gommers, R.; Virtanen, P.; Cournapeau, D.; Wieser, E.; Taylor, J.; Berg, S.; Smith, N.J.; et al. Array programming with NumPy. Nature 2020, 585, 357–362. [Google Scholar] [CrossRef]
  147. Hunter, J.D. Matplotlib: A 2D graphics environment. Comput. Sci. Eng. 2007, 9, 90–95. [Google Scholar] [CrossRef]
  148. Pandas Development Team. Pandas-dev/Pandas: Pandas. 2020. Available online: https://doi.org/10.5281/zenodo.3509134 (accessed on 23 June 2021).
  149. McKinney, W. Data Structures for Statistical Computing in Python. In Proceedings of the 9th Python in Science Conference, Austin, TX, USA, 28 June–3 July 2010; pp. 56–61. [Google Scholar] [CrossRef] [Green Version]
  150. Pedregosa, F.; Varoquaux, G.; Gramfort, A.; Michel, V.; Thirion, B.; Grisel, O.; Blondel, M.; Prettenhofer, P.; Weiss, R.; Dubourg, V.; et al. Scikit-learn: Machine Learning in Python. J. Mach. Learn. Res. 2011, 12, 2825–2830. [Google Scholar]
Figure 1. Flowchart of the feature extraction and clustering algorithm for analysis of 64 ms-binned light curves in the interval T0 to T100.
Galaxies 10 00078 g001
Figure 2. Flowchart of the feature extraction and clustering algorithm for analysis of light curves in the interval T0 to T0 + 1.004 s.
Galaxies 10 00078 g002
Figure 3. 2D t-SNE representation of the extracted wavelet and PCA features from the 64 ms light curves from T0 to T100, coloured by burst duration T90, for (a) BATSE, (b) Swift/BAT and (c) Fermi/GBM.
Galaxies 10 00078 g003
Figure 4. Animation of t-SNE projections for different GRB light-curve time-intervals at 4 ms resolution for (a) BATSE (b) Swift/BAT and (c) Fermi/GBM, coloured by their T90 duration. The title indicated on the top axis of each figure denotes the analysed time interval, since the burst trigger. The video files are available in the Supplementary Materials.
Galaxies 10 00078 g004
Figure 5. 2D t-SNE representation of the extracted wavelet and PCA features from the first second (T0 to T0 + 1.004 s) of burst light curves, coloured by burst duration T90 (top row) and hardness ratio HR32 (bottom row) for (a) BATSE, (b) Swift/BAT and (c) Fermi/GBM. Hardness ratios (HR32) for Swift/BAT and BATSE are calculated as the ratio of fluence in Band 3 and Band 2. The hardness ratio of Fermi/GBM bursts is defined as the ratio of fluence in the 50–300 keV and 10–50 keV bands, calculated using the best-fit spectral parameters.
Galaxies 10 00078 g005
Figure 6. (a) The t-SNE map of Swift/BAT bursts derived from the T0 to T0 + 1.004 s interval at 4 ms resolution showing 2 clearly separated groups and (b) their projection onto the duration-hardness plane. Histograms indicate the distribution of duration and hardness for each group.
Galaxies 10 00078 g006aGalaxies 10 00078 g006b
Figure 7. Violin plots showing the distribution of GRB properties for Group 1 (red) and Group 2 (blue) Swift/BAT bursts identified in the T0 to T0 + 1.004 s light curve interval. The white box plots represent the 1 σ interval (i.e., the 16th to 84th percentile), with the median of each parameter marked as a black line.
Galaxies 10 00078 g007
Figure 8. 2D t-SNE representation of the wavelet feature extraction applied to Swift/BAT light curves covering time intervals (a) T0 − 1 s to T0 + 1 s and (b) T0 + 1 s to T0 + 2 s. The plots are coloured by burst duration T90.
Galaxies 10 00078 g008
Figure 9. Locations of GRBs with associated Supernovae (GRB/SN) and possible Kilonovae (GRB/KN) within the t-SNE projections of the T1 interval for (a) Swift/BAT and (b) Fermi/GBM. The location of the only confirmed kilonova, associated with GRB 170817A, is indicated with a black star.
Galaxies 10 00078 g009
Figure 10. 2D t-SNE representation of the wavelet coefficients and PCA features extracted from the light curves measured in Band 3 for Swift/BAT (50–100 keV). The plot is coloured by burst duration T90.
Galaxies 10 00078 g010
Figure 11. Normalised cumulative counts of Band 3 (50–100 keV) Swift/BAT 4 ms light curves. Short (T90 < 2 s) and long (T90 > 2 s) duration bursts, and those within the Groups 1 and 2 identified from the first 1 s of prompt emission, are shown.
Galaxies 10 00078 g011
Table 1. Results of the 2D KS test comparing Group 1 and Group 2 identified within the first second of prompt emission of Swift/BAT bursts.
Parameterp-Value
T904.3 × 10−42
HR321.7 × 10−19
E peak 1.9 × 10⁻³
Fluence (15–350 keV)2.9 × 10⁻²²
Table 2. Group membership of Swift GRBs, based on the analysis of the first second of prompt emission at 4 ms resolution (T1) and the T100 interval at 64 ms resolution. The full table is provided in the Supplementary Materials.
GRBT1 GroupT100 GroupT90 (s)HR32
GRB041220225.61.3
GRB04122322109.11.8
GRB04122422177.61.2
GRB200809B124.21.8
GRB200819A2226.91.0
GRB200829A1213.11.9
1 No 4 ms light-curve file available.
Table 3. Sample sizes of short-duration (T90 < 2 s) and long-duration (T90 > 2 s) bursts in the Swift/BAT sample, and Groups 1 and 2, based on the analysis of the T1 and the T100 intervals.
SampleNumber of Bursts
T90 < 2 sT90 > 2 s
T1T100T1T100
Swift/BAT sample10710711441147
Group 173913214
Group 2341611121133
Publisher’s Note: MDPI stays neutral with regard to jurisdictional claims in published maps and institutional affiliations.