Article

Evaluation of a Candidate Site in the Tibetan Plateau towards the Next Generation Event Horizon Telescope

1
Shanghai Astronomical Observatory, Chinese Academy of Sciences, 80 Nandan Road, Shanghai 200030, China
2
Center for Astrophysics | Harvard & Smithsonian, 60 Garden Street, Cambridge, MA 02138, USA
*
Author to whom correspondence should be addressed.
Current Affiliation: Center for Astrophysics | Harvard & Smithsonian, 60 Garden Street, Cambridge, MA 02138, USA.
Galaxies 2023, 11(1), 7; https://doi.org/10.3390/galaxies11010007
Submission received: 14 November 2022 / Revised: 9 December 2022 / Accepted: 22 December 2022 / Published: 26 December 2022

Abstract

:
In order to enhance the imaging capabilities of the Event Horizon Telescope (EHT) and capture the first black hole movies, the next-generation EHT (ngEHT) team is building new stations. Most stations of the EHT and ngEHT project are located in the Western Hemisphere, leaving a large vacancy in the Eastern Hemisphere. Located in the center of the Eastern Hemisphere, the Tibetan Plateau is believed to have excellent sites for (sub)millimeter astronomical radio observations. Building a telescope here could help to fill this vacancy. In this study, we evaluated the meteorological conditions of a candidate site (Shigatse, hereafter SG) with good astronomical infrastructure for this telescope. The evaluation results show that the precipitable water vapor (PWV) values of the SG site are lower than 4 mm during winter and spring, comparable to those of some existing EHT stations, and the zenith transmittances at 230 GHz and 345 GHz during March and April are excellent. We simulated VLBI observations of Sgr A* and M87 based on the conditions of the SG site and those of other existing/planned (sub)millimeter telescopes with mutual visibility at 230 GHz. The results demonstrated that images of Sgr A* and M87 could be well reconstructed, indicating that the SG site is a good candidate for future EHT/ngEHT observations.

1. Introduction

By combining multiple radio telescopes over a long distance, very-long-baseline interferometry (VLBI) technology can achieve an extremely high angular resolution. As a global VLBI array, the Event Horizon Telescope (EHT) has been used to image the shadow regions of the supermassive black holes Messier 87 (M87) and Sagittarius A* (Sgr A*) [1,2]. However, the baseline coverage of the current EHT is very sparse. To obtain better black hole images and high-quality movies, the next-generation EHT (ngEHT) (https://www.ngeht.org/) (accessed on 8 December 2022) [3] team is actively working to add ∼10 new stations, which, together with the existing EHT stations, will greatly increase their static and dynamic imaging capabilities. In addition, several existing/planned (sub)millimeter telescopes in other regions will also be able to contribute to future EHT/ngEHT observations. These include the planned Africa Millimetre Telescope (AMT) in Namibia [4], the 10 m Solar Planetary Atmosphere Research Telescope (SPART) in Japan, and the KVN Yonsei telescope in South Korea [5]. SPART and the KVN Yonsei are located in the easternmost part of Asia, and have no common visibility with the AMT.
The Tibetan Plateau is the hinterland of Asia, and is believed to have many excellent sites for (sub)millimeter radio astronomical observations [6]. A telescope in this region could serve to connect the stations in east Asia (e.g., SPART and KVN Yonsei) with the AMT, and the EHT/ngEHT coverage in the eastern hemisphere will be well supplemented. For this reason, Shanghai Astronomical Observatory is currently leading preparations for the construction of the 15 m Sub-Millimeter Astronomical Research Telescope (SMART) in this region. Considering the geographical location and infrastructure conditions, Shigatse (hereafter SG; 29.2° N, 88.63° E, altitude of 4080 m) which is located in the south central area of the Tibetan Plateau, has been proposed as a candidate site for the telescope.
An analysis conducted using the dataset from the Modern-Era Retrospective Analysis for Research and Applications project, version 2 (MERRA-2) [7], showed that the meteorological conditions of the SG site are comparable to those of some existing EHT stations. We simulated VLBI observations of Sgr A* and M87 at 230 GHz based on the SG, SPART, KVN Yonsei, AMT, and the existing EHT sites with mutual visibility. Then, we performed imaging with the synthetic data. The results demonstrated that VLBI observations centered on the SG site could be used to reconstruct the images of Sgr A* and M87 well.

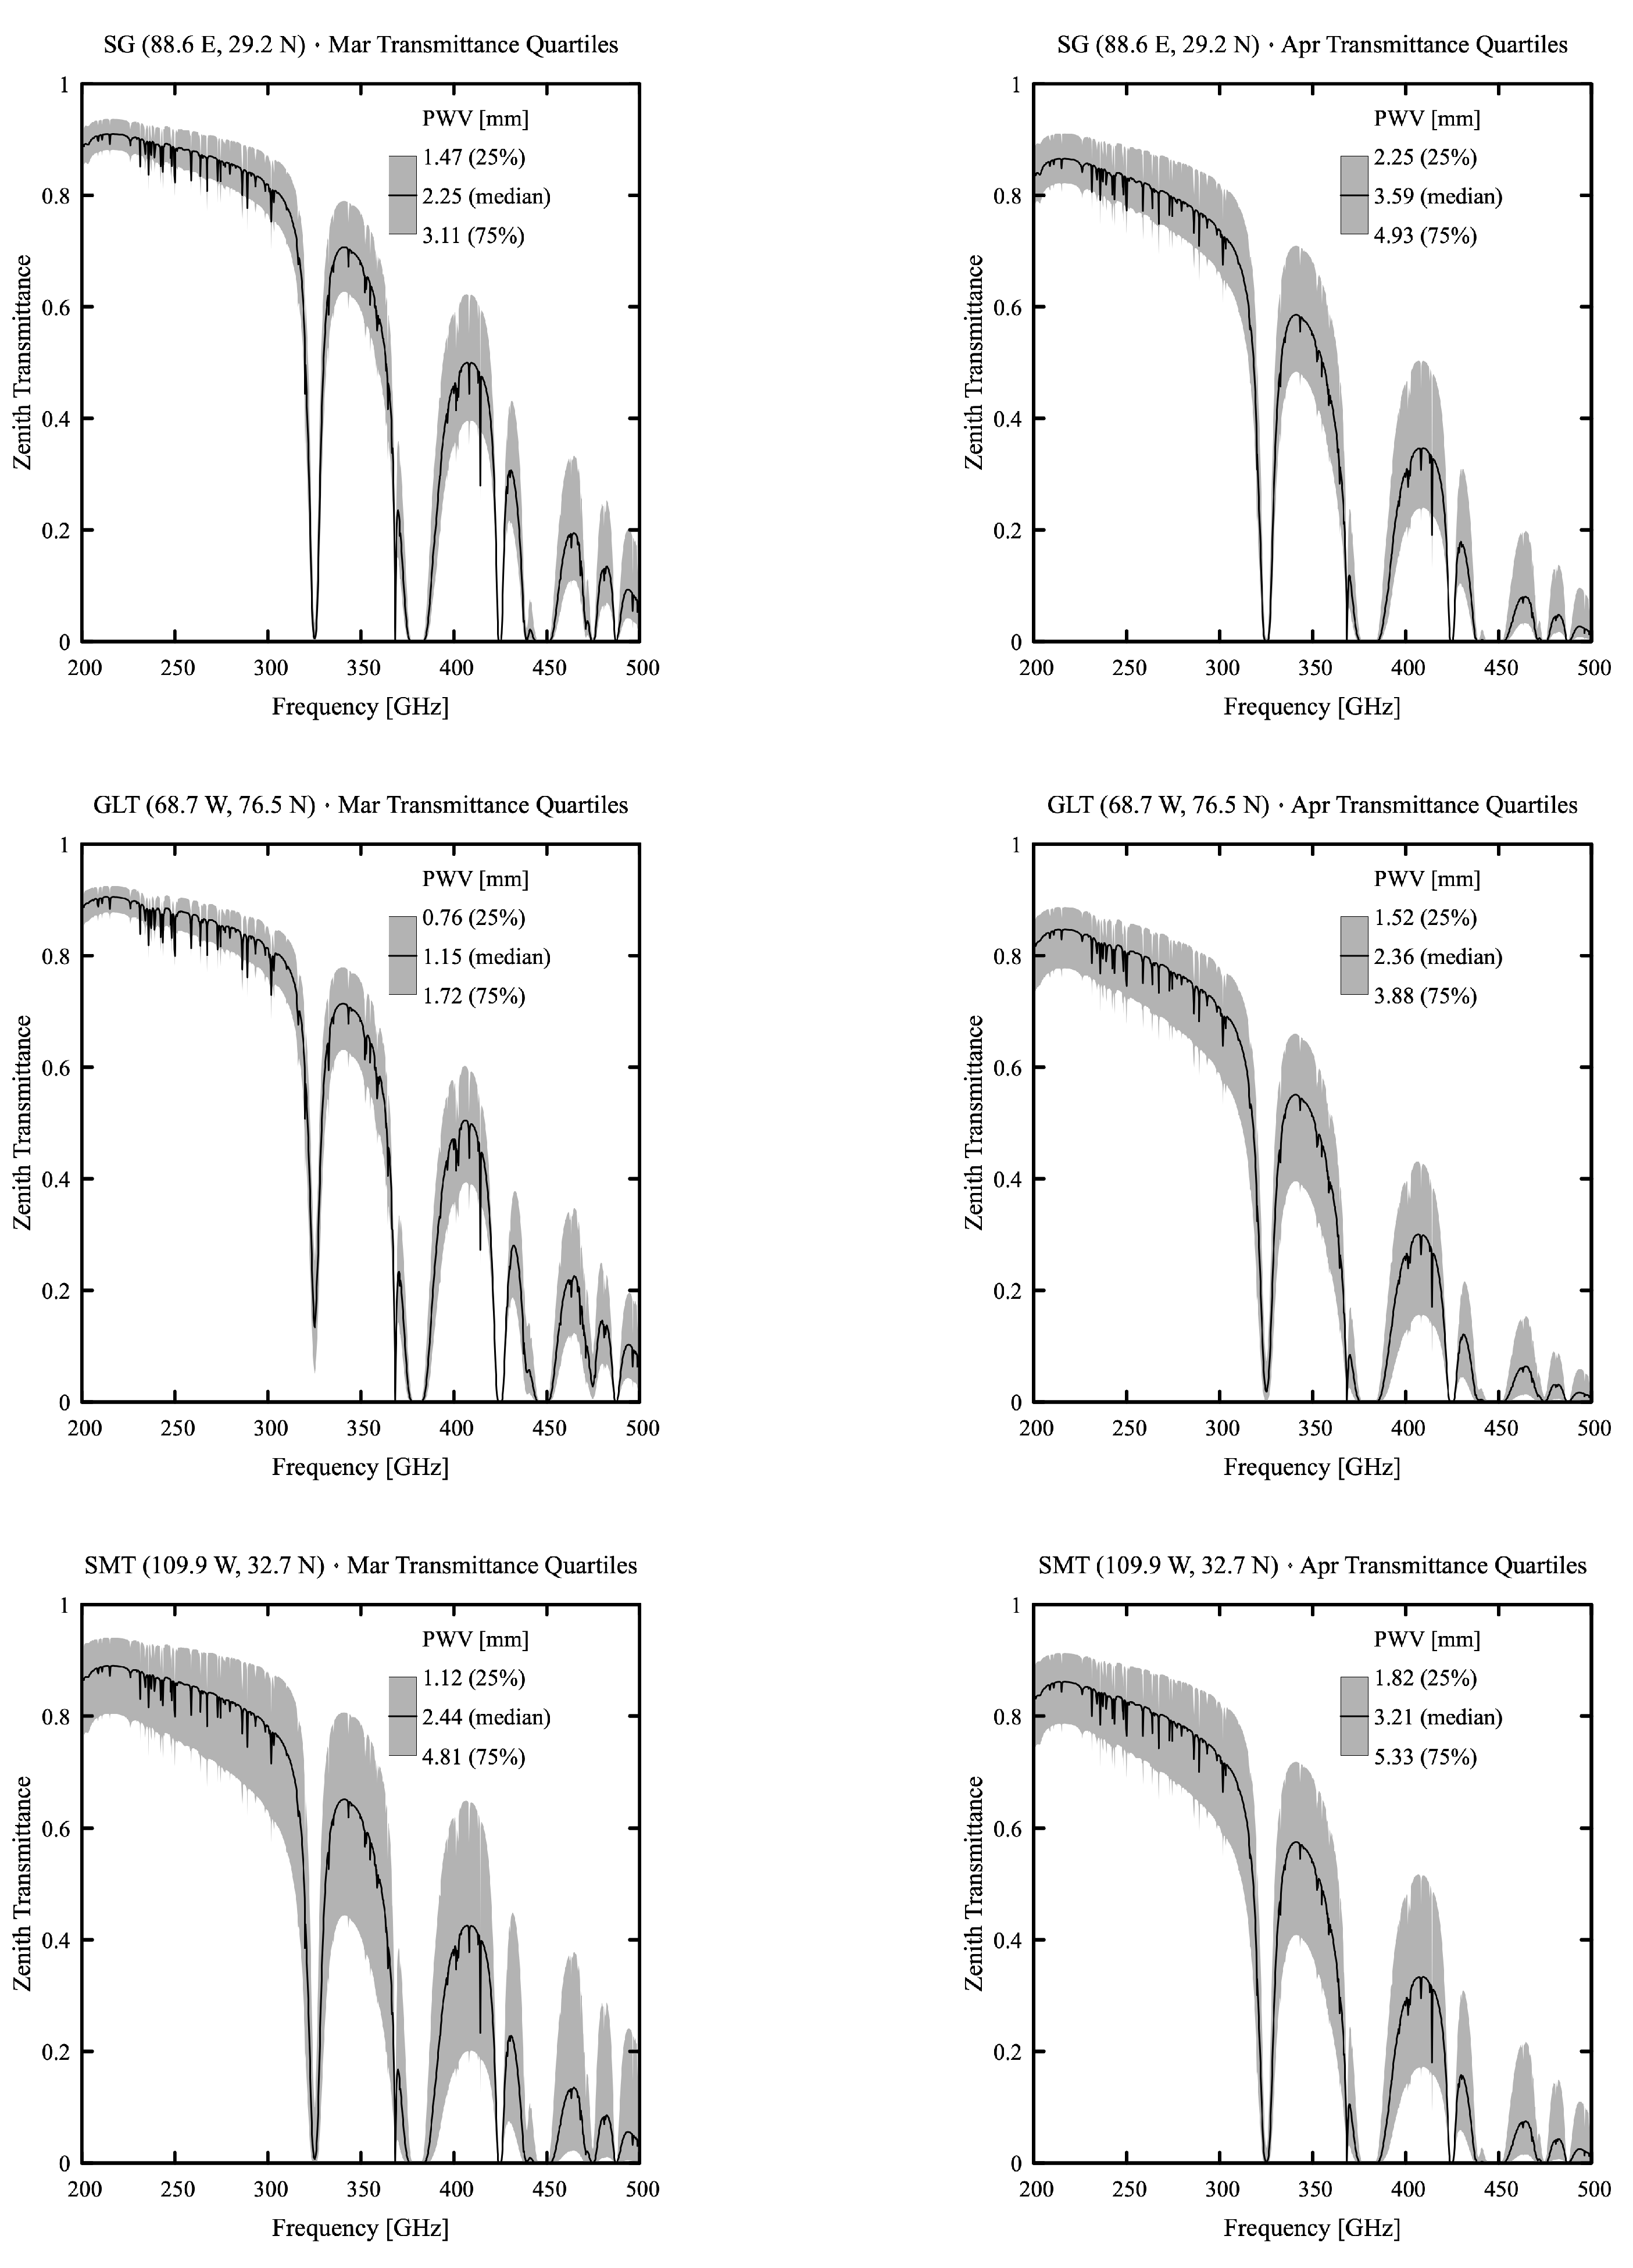
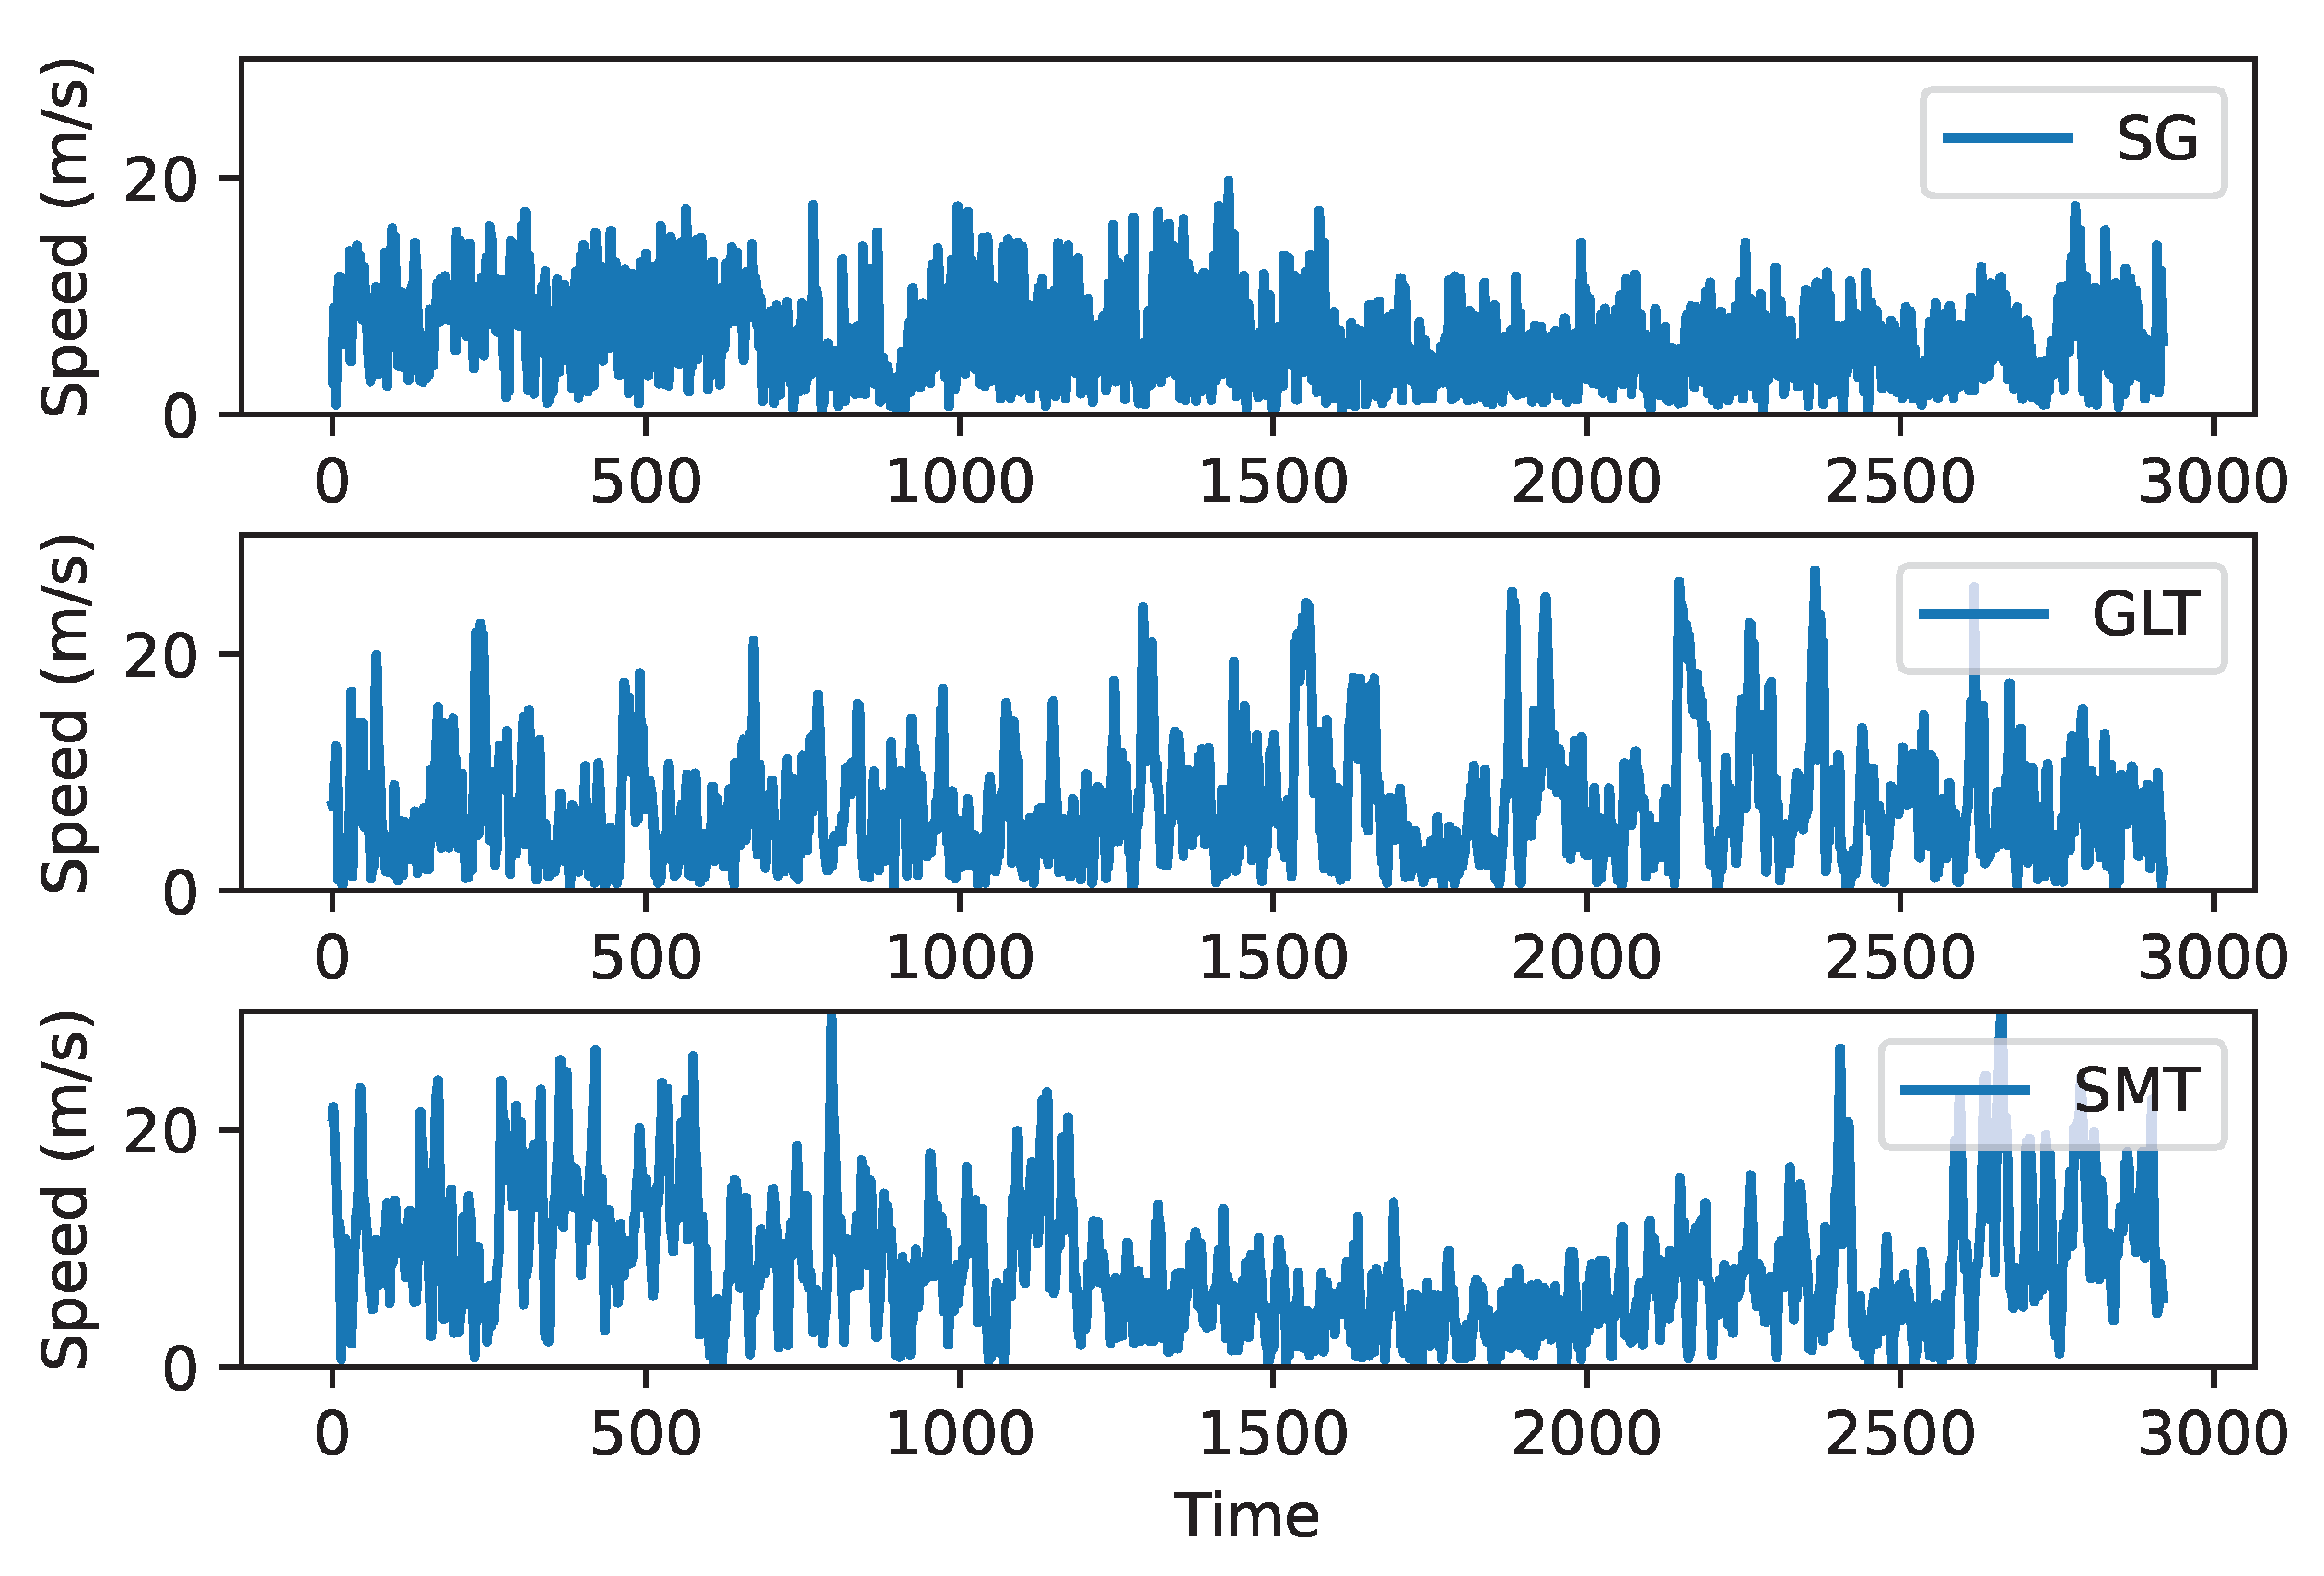
2. Evaluation of Meteorological Conditions

Water vapor in the atmosphere is the main factor related to absorbing (sub)millimeter waves. Therefore, we evaluated two related meteorological metrics, precipitable water vapor (PWV) and zenith transmittance spectra. In addition to the SG site, two representative EHT stations (GLT and SMT) were also evaluated for comparison.
The MERRA-2 data product used is M2I3NPASM, which is an instantaneous 3-dimensional 3-hourly data collection system, with a spatial resolution of 0.5° in latitude and 0.625° in longitude and 42 vertical pressure layers. The time span is from 1 January 2018 to 31 December 2021. am software [8,9] was used to calculate the average meteorological values. Before this calculation, the gridded data were interpolated to the precise location of each site [10]. The 42 pressure layers were truncated according to the actual altitude of each site, and then the values from the first layer to the truncated layer were integrated to calculate the statistical values. The truncated pressures at the SG, GLT, and SMT sites are 580 mbar, 940 mbar, and 700 mbar, respectively (All data and scripts are available at https://github.com/nomadyuwei/Site_Evaluation.git, accessed on 8 December 2022.).
The monthly averaged PWV values of the three sites are shown in Figure 1. GLT exhibits the lowest values in most months. SG and SMT are roughly equivalent, but during the winter months, the values of SG are better than those of SMT. For the months of January, February, March, April, November, and December, the PWV values of all the three sites are lower than 4 mm. This is very important, because EHT observations are often performed in March or April, when all of the existing EHT sites have median PWV values that are less than 5 mm [10]. We also compared the PWV values of GLT and SMT shown in Figure 1 with those reported in other studies from the literature (e.g., Raymond et al. [10] and references therein), and the results were found to be consistent.
Figure 2 shows the four-year averaged zenith transmittance spectra of the three sites in March and April. For the SG site, the median values at 230 GHz and 345 GHz are about 0.9 and 0.7 in March, and about 0.85 and 0.55 in April. These values are comparable to those of GLT and SMT.
The wind speeds throughout the year of 2019 were also evaluated (Figure 3). The values of these three sites are within 20 m/s most of the time, and the SG site exhibits the smallest peak values.

3. Synthetic Data Generation and Imaging Method

We considered an array consisting of the 11 existing EHT stations, the SG station proposed in this paper, and a further three new stations under development (SPART, KVN Yonsei, and AMT). This gives a total of 15 stations located at 13 sites. We simulated VLBI observations during the time interval that the SG site could cover. In practice, only the four new stations and a portion of the existing EHT stations with mutual visibility in relation to the new stations were used. A detailed description of the EHT stations can be found in [11] and the references therein.
The locations and system equivalent flux density (SEFD) values of the four new stations are shown in Table 1. SEFD is the most important metric of the sensitivity of a radio telescope, and it is calculated as follows:
S E F D = 8 k B T s y s η t π D 2 .
where k B is the Boltzmann constant ( 1.38 × 10 3 Jy/K), T s y s is the effective system noise temperature [12] and D and η t are the diameter and efficiency of the telescope. We estimate the SEFD values of SG and AMT (which are in the pre-construction stage) in Table 1 as follows. We assume that the values of T s y s and η t for SG/AMT are 200 K and 0.6, which are the average values of the existing EHT stations. The diameter of the SG telescope is assumed to be 15 m, so the corresponding SEFD is about 5200. According to the literature [4], the diameter of the planned AMT is from 12 m to 16 m; we used the median value of 14 m, so the corresponding SEFD is about 6000.
The black holes Sgr A* and M87 are the main simulated observation targets. The model image of Sgr A* is a semi-analytic radiatively inefficient accretion flow (RIAF) model [13]. For M87, we used a snapshot of a GRMHD simulation [14]. The frequency is set to 230 GHz with a total bandwidth of 8 GHz. The integration time is 10 s with scans taken every 10 min. We adopted eht-imaging software for the creation of synthetic data and imaging.
Ideally, the VLBI imaging process uses inverse Fourier transformation to reconstruct the celestial image I ( x , y ) based on visibility data V ( u , v ) . However, due to the sparse coverage of V ( u , v ) , the imaging process is an ill-posed problem. eht-imaging solves this problem by adding regularization terms based on prior information. The imaging process defines a regularized maximum likelihood (RML) algorithm through the use of a dataset, an initial image, and an objective function with given data and regularization term weights [15], reconstructing celestial image I ( x , y ) as
I = arg min I ( α D χ D 2 ( I ) β R S R ( I ) ) .
The above equation includes two types of terms, data terms ( χ D 2 ( I ) ) and regularization terms ( S R ( I ) ). In this study, we used visibility amplitudes, closure phases, and log closure amplitudes as data terms. Closure phases are triple products of complex visibilities around closed triangles [16,17,18], which can cancel out station-based phase errors. Closure amplitudes were calculated from four telescopes forming a quadrangle. Closure amplitudes cancel out station-based gain errors.
The regularization terms used in this study are entropy, total variation, centroid position constraint, and total flux density. For a detailed description of these, we refer the reader to [19,20,21,22] and references therein. α D and β R are hyperparameters that were adjusted during the imaging process.
The pipeline of the imaging process is shown in Figure 4. We solved iteratively over four rounds to determine the optimal image and self-calibration. This pipeline is very similar to the one used to generate the fiducial images of M87 [1,23]. At the beginning, we used a Gaussian function to model the source structure. The full width at half maximum (FWHM) of the Gaussian function was set to 50 μas and 40 μas for Sgr A* and M87, respectively. The size of the image was set to 32 × 32 pixels. The iteration number of each round was set to 200. In different rounds, the weights of the data terms are different, but the weights of the regularization terms remain the same. We used the same set of weights for all simulated observations. The finely-tuned weights of each round are shown in Table 2 and Table 3 (All data and Python pipelines are available at https://github.com/nomadyuwei/EHT_Asia_Simulation_Imaging.git, accessed on 8 December 2022).
Normalized root-mean-square error (NRMSE) was used as a metric to evaluate the quality of the reconstructed images. The calculation of NRMSE is as follows:
N R M S E = i = 1 n 2 I i I i 2 i = 1 n 2 I i 2 .
where I i and I i are pixels of the reconstructed and original images and n 2 is the size of the images.

4. Simulation Results and Discussion

The simulation results are presented in this section, first in terms of (u, v) coverage as a function of source elevation, and second through a comparison of images simulated with and without the inclusion of the SG site.

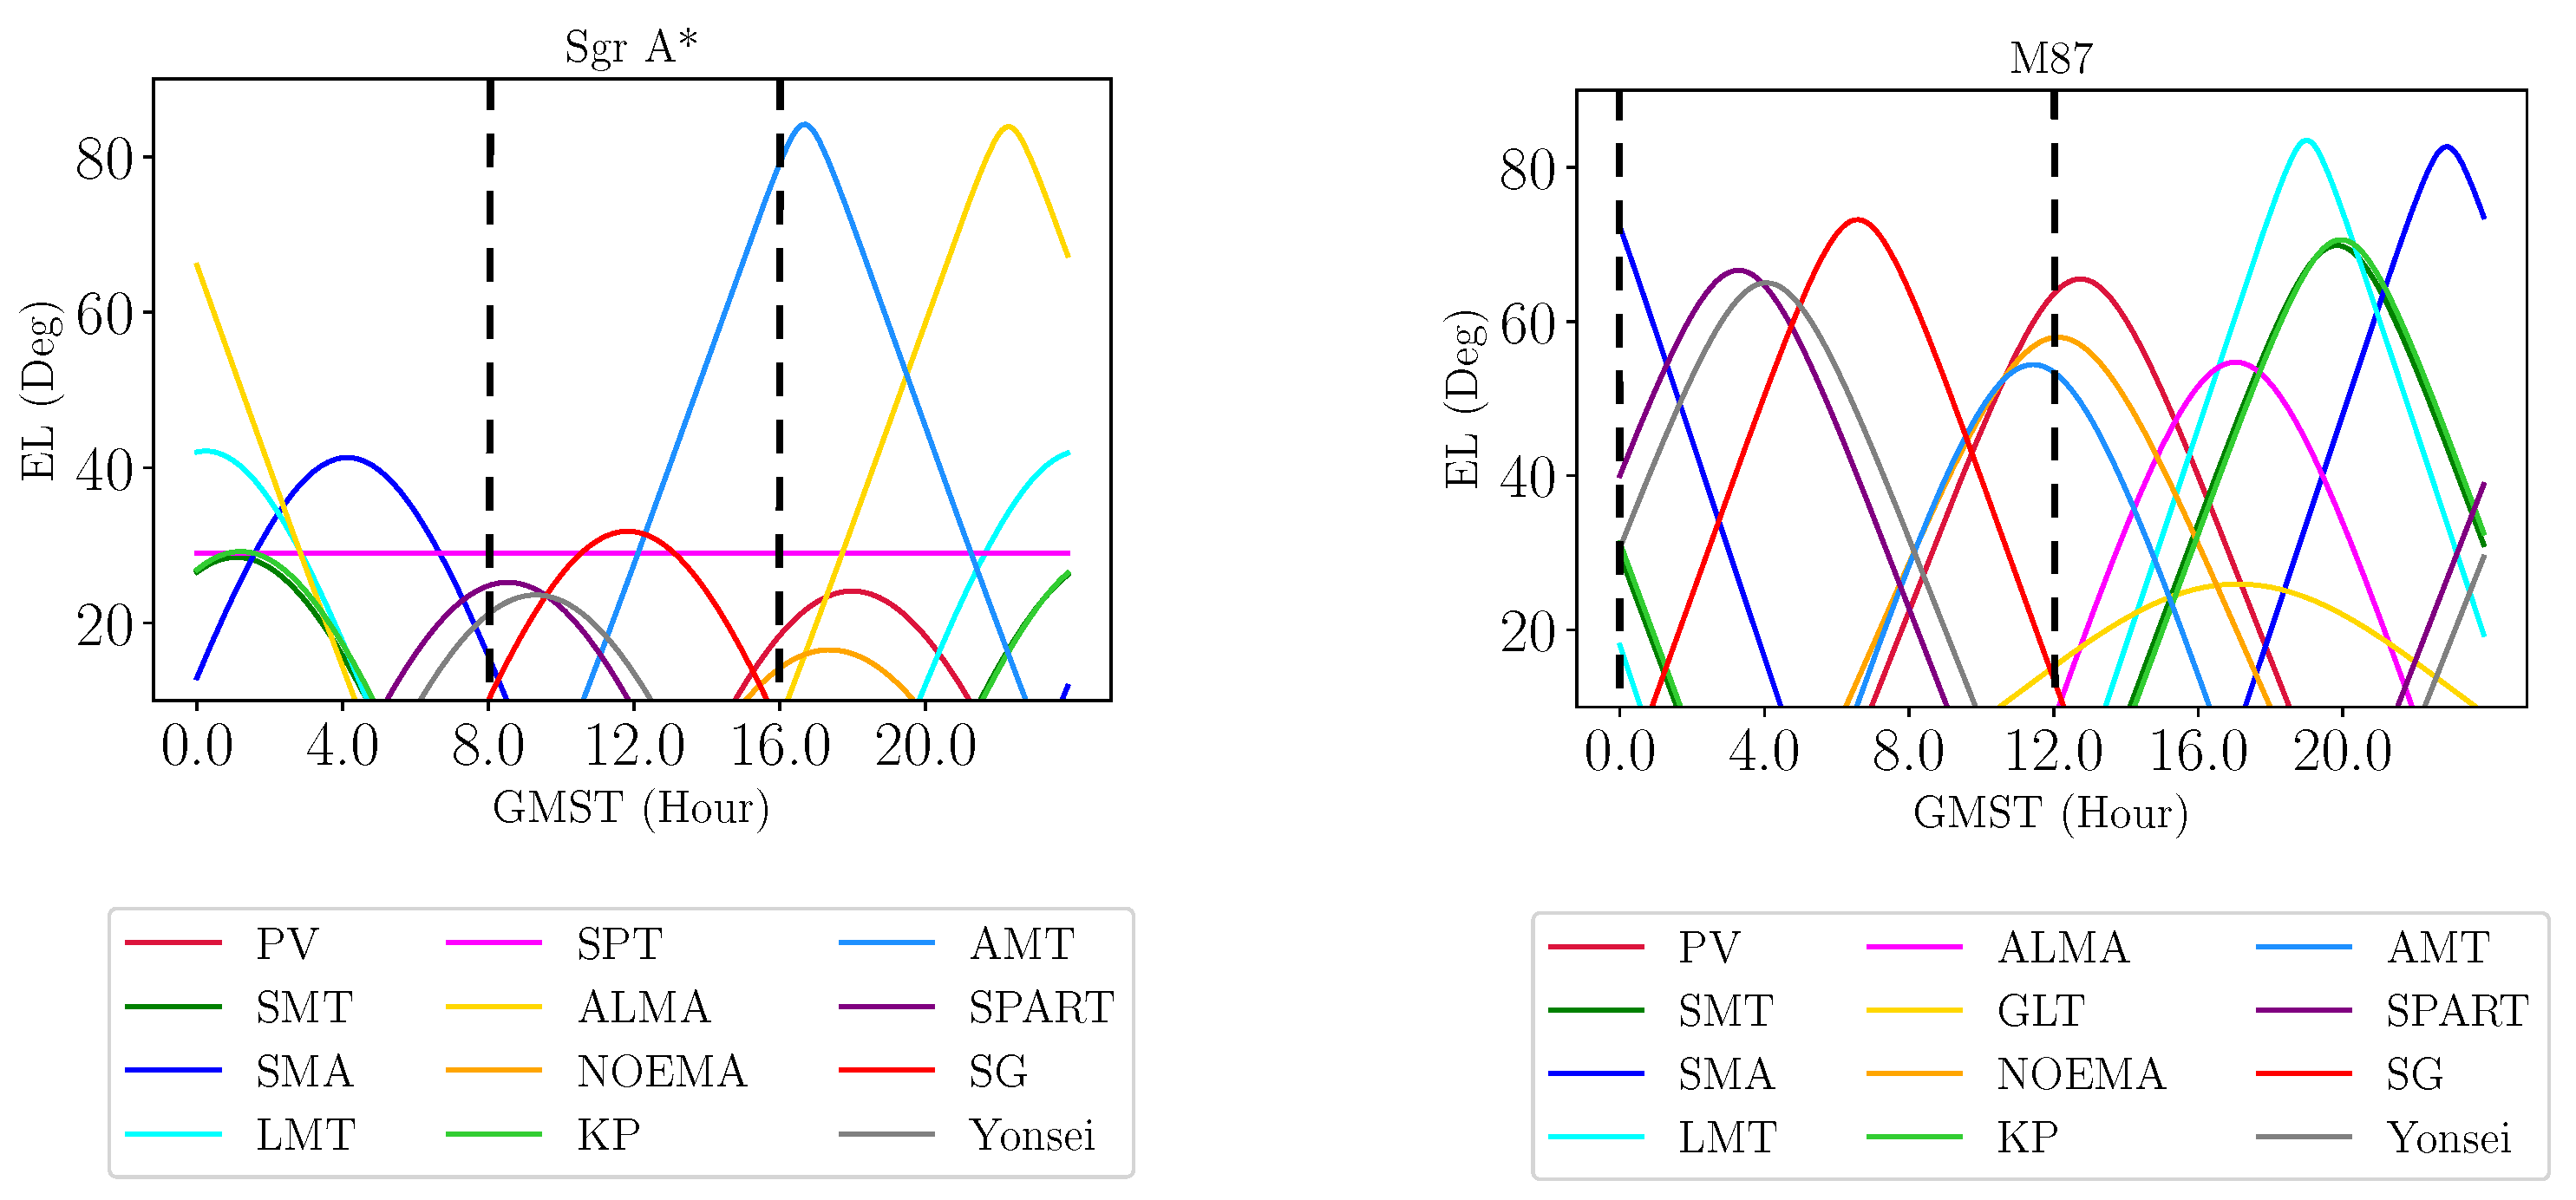
4.1. Elevation and Visibility Coverage
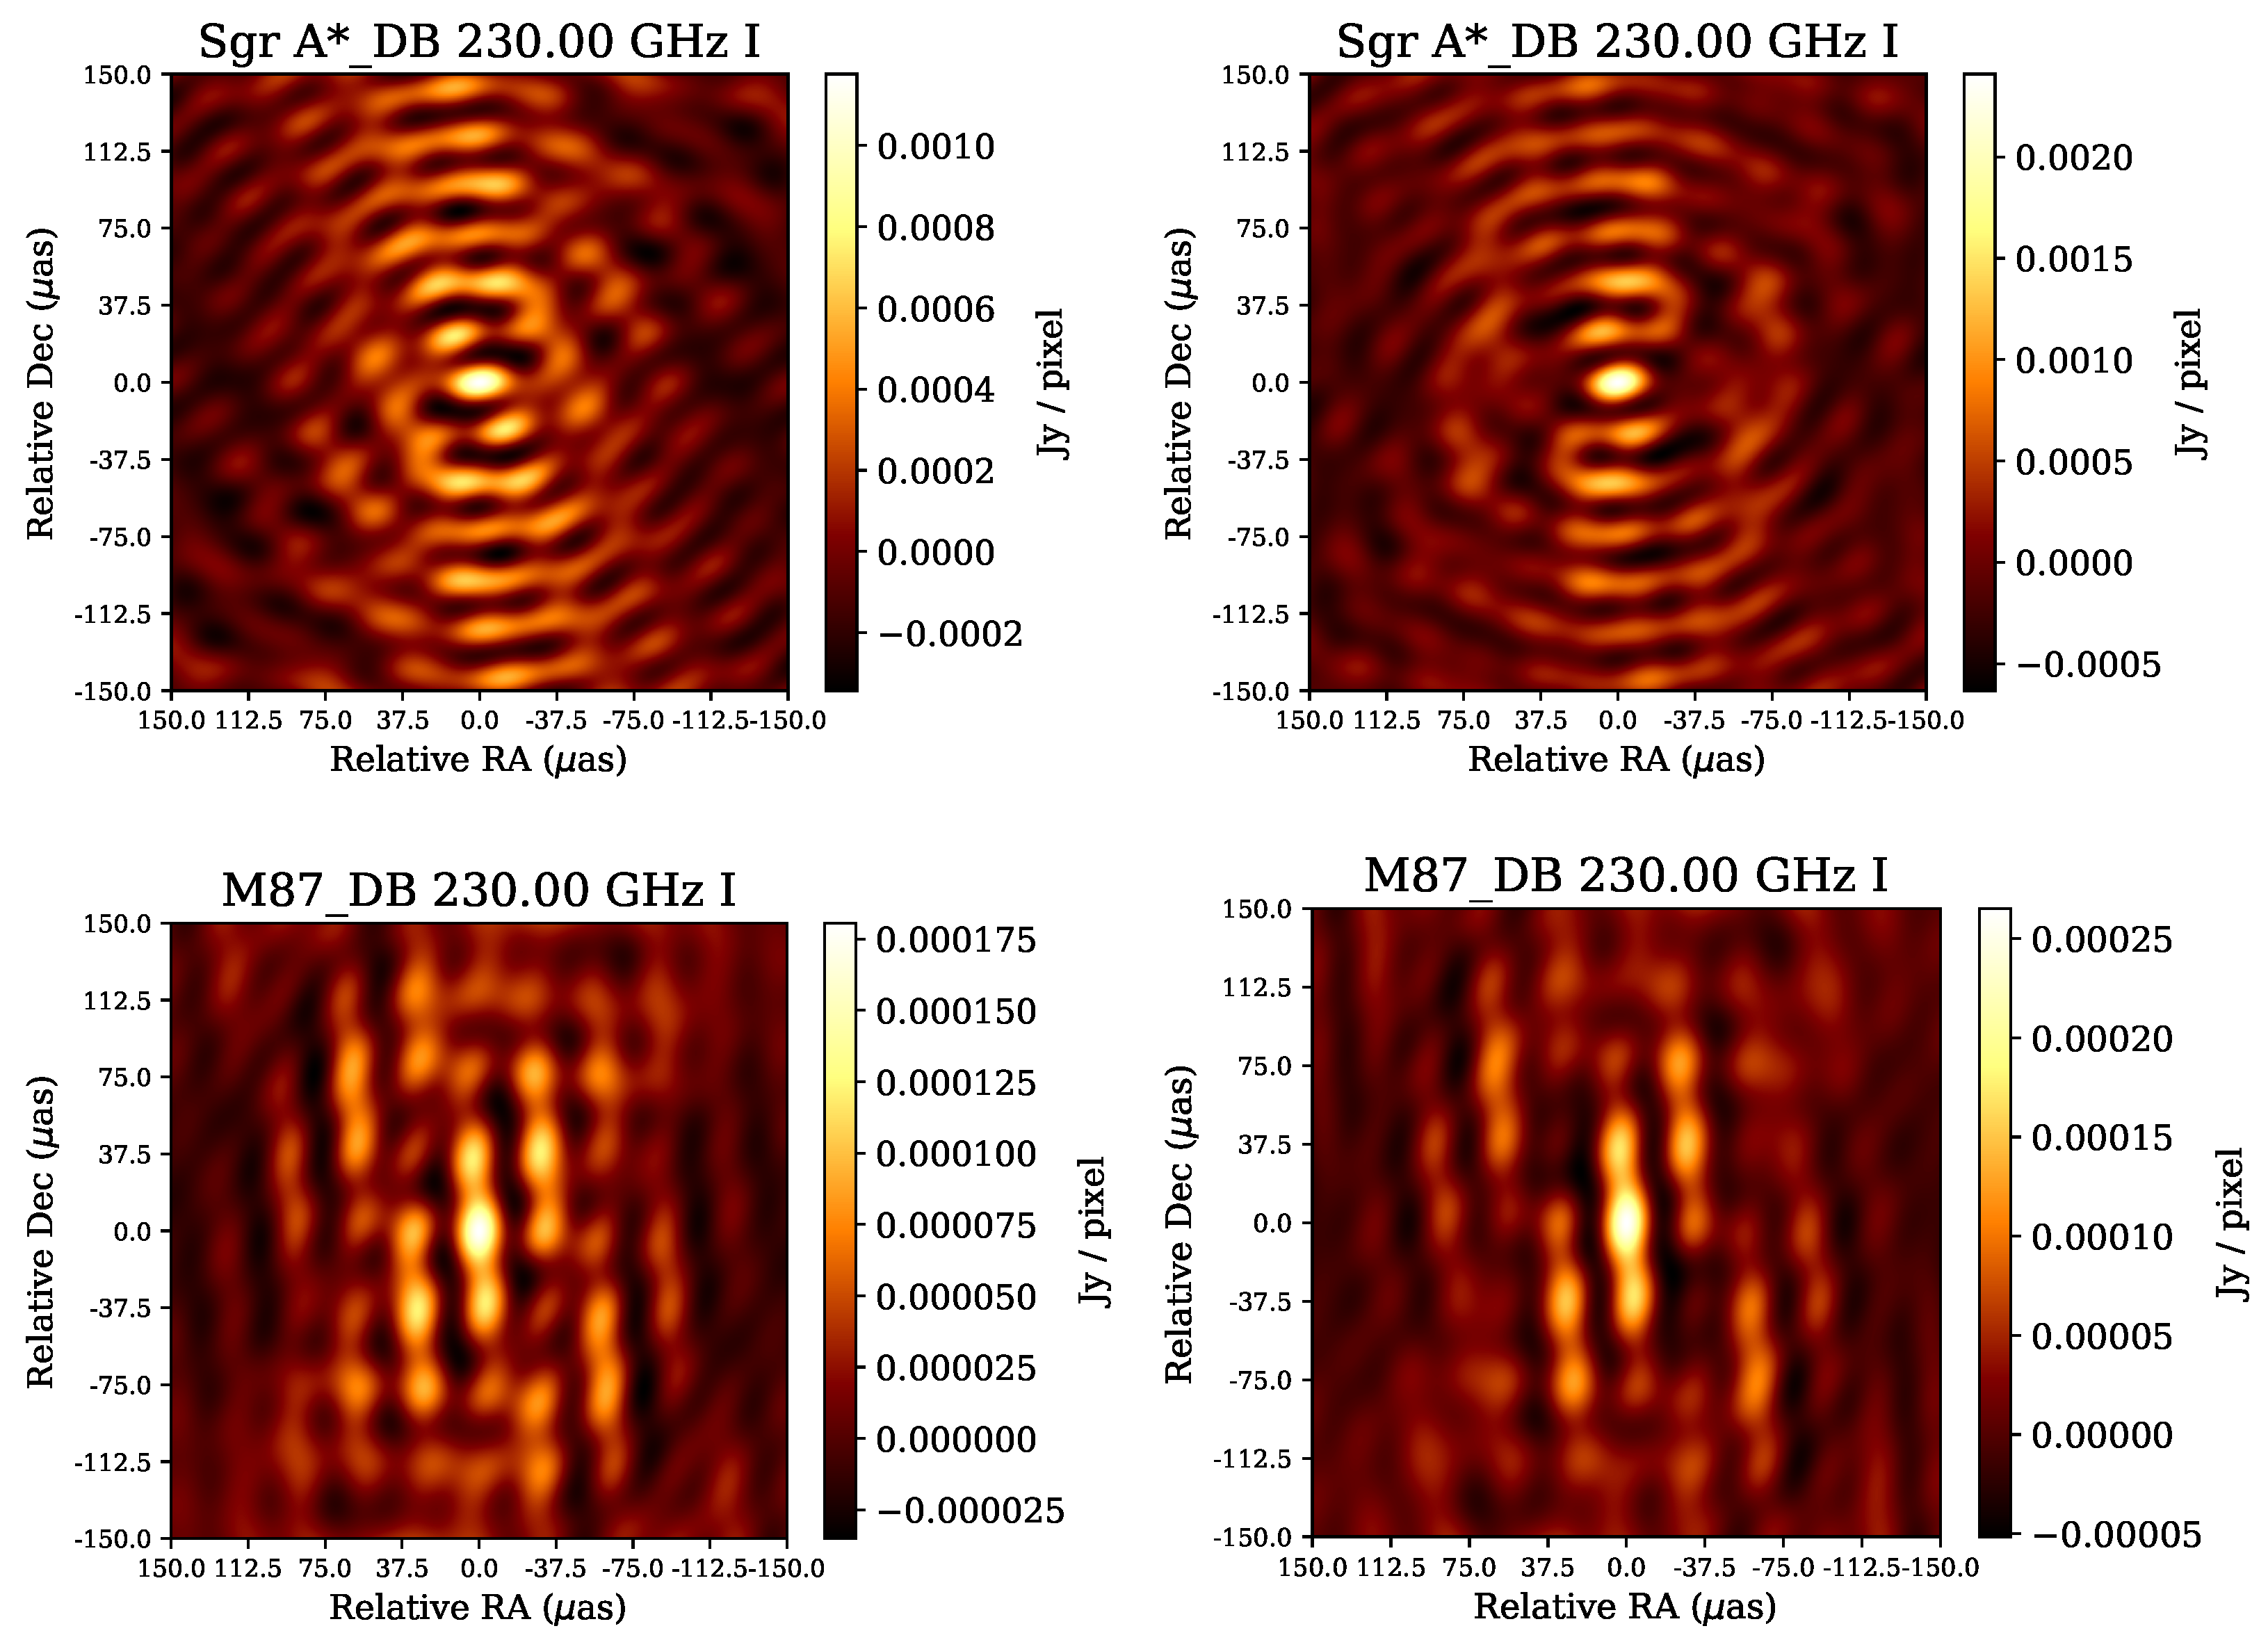
Figure 5 shows the elevation of 13 stations above 10 degrees as a function of Greenwich mean sidereal time (GMST) when observing Sgr A* and M87. As we can see, for Sgr A*, the observable time of the SG site is in the interval of [8:00, 16:00]. With the exception of the South Pole Telescope (SPT), none of the existing EHT stations could fully cover this 8-h interval. The other two eastern telescopes (SPART and Yonsei) have observation times of about 4 h during this interval. Therefore, we conducted simulated observations of Sgr A* with this 8-h interval, and stations outside this interval did not participate in the observations.
The (u, v) coverage of the simulated observation of Sgr A* is shown in Figure 6 (top-right) with the baselines contributed by the SG site highlighted in orange. For comparison, Figure 6 (top-left) also shows the (u, v) coverage without the SG site. It can be seen that the SG site could contribute both long and middle baselines, which are very important for calibration and imaging.
Figure 7 (top-left and top-right) compares the dirty beams of the simulated observations of Sgr A* without and with the SG site. It can be seen that with the SG site, the side lobes are reduced. However, the dirty beams are only used to illustrate the impact of the SG site. eht-imaging does not use the dirty map or dirty beam for imaging, and the reconstructed images also do not need to be convolved with these beams.
Since M87 is in the northern celestial hemisphere, the elevation curves (Figure 5, right) of eastern telescopes (SG, SPART and Yonsei) are much better than those for Sgr A*. It can be seen that the observable time of the SG site is approximately in the interval of [0:00, 12:00]. Most of the observable time of Yonsei and SPART is also within this interval. Therefore, we conducted simulated observations for this 12-h interval. Similarly to the case of Sgr A*, stations outside this interval did not participate in the observations. Figure 6 (bottom-left and bottom-right) shows the (u, v) coverages of the observations of M87 without and with the SG site. It can be seen that, similarly to that of Sgr A*, the SG site could also contribute both long and middle baselines. Figure 7 (bottom-left and bottom-right) shows the dirty beams for M87. It can be seen that that the beam is also somewhat improved with the SG site.

4.2. Imaging

The data terms used for imaging are visibility amplitudes and closure quantities. These are shown in Figure 8 for the eight-hour simulated observations of Sgr A*. It can be seen in the left sub-figure that without the SG site, there are two large gaps in the u–v distance, which reflects the importance of the SG site in baseline coverage. In the right sub-figure, we can see that all of the representative triangles with the SG site have nonzero closure phases. This indicates that the source structure on the 50 μas scale could be resolved with these triangles. Even a constant non-zero closure phase over time indicates a spatially resolved asymmetric structure.
Figure 9 shows the model image and reconstructed images of Sgr A*. Without the SG site, the visual quality of the reconstructed image is not ideal. For example, the shadow area is not obvious, and the NRMSE is large. With the SG site, the reconstructed image shows a clear crescent shape. The shadow and the bright area are clearly visible. The NRMSE value decreases from 0.537 to 0.225.
For M87, the visibility amplitudes and closure phases of the twelve-hour simulated observations are shown in Figure 10. Comparing the left and middle sub-figures, we can see that without the SG site, the baseline coverage is still good. Even so, the SG site provides more baselines, which are beneficial in terms of improving the quality of the reconstructed images.
A null could be observed at the position of about 3.4 G λ of the visibility amplitudes, which is associated with the ring-like structure in the image domain [23]. The Fourier transform of a ring structure shows the first minimum in the visibility amplitude at a baseline length b 1 for which the zero-order Bessel function is zero [24]. This allows us to estimate the source size as follows:
d 0 45 ( 3.5 G λ b 1 ) μas .
The null in the position of 3.4 G λ ( b 1 ) corresponds to a source size of 42 μas ( d 0 ), which matches the model image. With the non-zero closure phases shown in Figure 10 (right), we could resolve the source structure on a 40 μas scale.
Figure 11 shows the model image and reconstructed images of M87. As we can see, the twelve-hour simulated observation without the SG site is still able to reconstruct the shadow and bright areas of the model image. With the SG site, the quality of the reconstructed image can be further improved, although the improvement is not as great as for Sgr A*. This is indicated by the smaller NRMSE value, which is 0.224 without SG, and 0.175 with the extra site.

5. Conclusions

In this study we used four-year MERRA-2 data to evaluate the meteorological conditions of a candidate EHT site at Shigatse, or SG, located in the Tibetan Plateau. The PWV values were found to be very low during winter and spring, and the transmittance values, at 230 GHz and 345 GHz, are excellent in March and April. Thus, SG is a suitable site for (sub)millimeter observations.
We combined the SG site with other (sub)millimeter stations to carry out simulated observations. The other sites include three proposed new VLBI sites and a portion of the current EHT sites having mutual visibility of Sgr A* and M87 with SG. Our simulated results include both (u, v) coverage analysis and imaging comparisons with and without SG. For both sources, SG can provide important baseline coverage. The imaging results showed that with the SG site, the “Eastern ngEHT Array” plus a portion of the existing EHT stations could reconstruct good images for both Sgr A* and M87. In the imaging results, the improvement in the Sgr A* simulation is clearer than for M87; however, there is a measurable improvement for both sources.
In future works, we plan to evaluate the improvement in images obtained from the Eastern ngEHT Array for sources other than SgrA* and M87. With this limited analysis we have shown that the SG site can make a promising contribution to the ngEHT for global observations with continuous time coverage. The SG site will make progressively more significant improvements to imaging as more sites are added to the Eastern ngEHT Array.

Author Contributions

Conceptualization, R.-S.L., Z.-Q.S. and W.Y.; methodology, W.Y. and R.-S.L.; software, W.Y.; writing—original draft, W.Y. and R.-S.L.; writing—review and editing, W.Y., R.-S.L., Z.-Q.S. and J.W.; supervision, R.-S.L., Z.-Q.S. and J.W. All authors have read and agreed to the published version of the manuscript.

Funding

R.-S. Lu was supported by the National Natural Science Foundation of China (1193307), the Key Research Program of Frontier Sciences, CAS (ZDBS-LY-SLH011), and the Shanghai Pilot Program for Basic Research—Chinese Academy of Science, Shanghai Branch: JCYJ-SHFY-2022-013.

Institutional Review Board Statement

Not applicable.

Informed Consent Statement

Not applicable.

Data Availability Statement

Publicly available datasets were analyzed in this study. All data can be found here: https://github.com/nomadyuwei/Site_Evaluation.git and https://github.com/nomadyuwei/EHT_Asia_Simulation_Imaging.git, all accessed on 8 December 2022.

Acknowledgments

We thank Scott Paine, Mark Freeman, Geoffrey Bower, Iniyan Natarajan, Razieh Emami, Freek Roelofs, Daniel Palumbo, and Sheperd Doeleman for their helpful conversations about station meteorological analysis and VLBI imaging.

Conflicts of Interest

The authors declare no conflict of interest.

References

  1. Event Horizon Telescope Collaboration; Akiyama, K.; Alberdi, A.; Alef, W.; Asada, K.; Azulay, R.; Baczko, A.K.; Ball, D.; Baloković, M.; Barrett, J.; et al. First M87 Event Horizon Telescope Results. I. The Shadow of the Supermassive Black Hole. Astrophys. J. Lett. 2019, 875, L1. [Google Scholar] [CrossRef]
  2. Event Horizon Telescope Collaboration; Akiyama, K.; Alberdi, A.; Alef, W.; Algaba, J.C.; Anantua, R.; Asada, K.; Azulay, R.; Bach, U.; Baczko, A.K.; et al. First Sagittarius A* Event Horizon Telescope Results. I. The Shadow of the Supermassive Black Hole in the Center of the Milky Way. Astrophys. J. Lett. 2022, 930, L12. [Google Scholar] [CrossRef]
  3. Doeleman, S.; Blackburn, L.; Dexter, J.; Gomez, J.L.; Johnson, M.D.; Palumbo, D.C.; Weintroub, J.; Farah, J.R.; Fish, V.; Loinard, L.; et al. Studying Black Holes on Horizon Scales with VLBI Ground Arrays. Bull. Am. Astron. Soc. 2019, 51, 256. [Google Scholar]
  4. Backes, M.; Müller, C.; Conway, J.E.; Deane, R.; Evans, R.; Falcke, H.; Fraga-Encinas, R.; Goddi, C.; Klein Wolt, M.; Krichbaum, T.P.; et al. The Africa Millimetre Telescope. In Proceedings of the 4th Annual Conference on High Energy Astrophysics in Southern Africa (HEASA 2016), Cape Town, South Africa, 25–26 August 2016; p. 29. [Google Scholar] [CrossRef] [Green Version]
  5. Asada, K.; Kino, M.; Honma, M.; Hirota, T.; Lu, R.S.; Inoue, M.; Sohn, B.W.; Shen, Z.Q.; Ho, P.T.P.; Akiyama, K.; et al. White Paper on East Asian Vision for mm/submm VLBI: Toward Black Hole Astrophysics down to Angular Resolution of 1∼RS. arXiv 2017, arXiv:1705.04776. [Google Scholar]
  6. Ye, Q.Z.; Su, M.; Li, H.; Zhang, X. Tibet’s Ali: Asia’s Atacama? Mon. Not. R. Astron. Soc. Lett. 2016, 457, L1–L4. [Google Scholar] [CrossRef] [Green Version]
  7. Gelaro, R.; McCarty, W.; Suárez, M.J.; Todling, R.; Molod, A.; Takacs, L.; Randles, C.A.; Darmenov, A.; Bosilovich, M.G.; Reichle, R.; et al. The Modern-Era Retrospective Analysis for Research and Applications, Version 2 (MERRA-2). J. Clim. 2017, 30, 5419–5454. [Google Scholar] [CrossRef] [PubMed]
  8. Paine, S. The Am Atmospheric Model. Zenodo. 2019. Available online: https://doi.org/10.5281/zenodo.3406483 (accessed on 8 December 2022).
  9. Paine, S. BH PIRE Winter School 2018 Tutorial: Radio Climatology. 2018. Available online: https://bhpire.arizona.edu/education/tutorials/ (accessed on 8 December 2022).
  10. Raymond, A.W.; Palumbo, D.; Paine, S.N.; Blackburn, L.; Córdova Rosado, R.; Doeleman, S.S.; Farah, J.R.; Johnson, M.D.; Roelofs, F.; Tilanus, R.P.J.; et al. Evaluation of New Submillimeter VLBI Sites for the Event Horizon Telescope. Astrophys. J. Suppl. Ser. 2021, 253, 5. [Google Scholar] [CrossRef]
  11. Event Horizon Telescope Collaboration; Akiyama, K.; Alberdi, A.; Alef, W.; Asada, K.; Azulay, R.; Baczko, A.K.; Ball, D.; Baloković, M.; Barrett, J.; et al. First M87 Event Horizon Telescope Results. II. Array and Instrumentation. Astrophys. J. Lett. 2019, 875, L2. [Google Scholar] [CrossRef]
  12. Event Horizon Telescope Collaboration; Akiyama, K.; Alberdi, A.; Alef, W.; Asada, K.; Azulay, R.; Baczko, A.K.; Ball, D.; Baloković, M.; Barrett, J.; et al. First M87 Event Horizon Telescope Results. III. Data Processing and Calibration. Astrophys. J. Lett. 2019, 875, L3. [Google Scholar] [CrossRef]
  13. Broderick, A.E.; Fish, V.L.; Doeleman, S.S.; Loeb, A. Evidence for Low Black Hole Spin and Physically Motivated Accretion Models from Millimeter-VLBI Observations of Sagittarius A*. Astrophys. J. 2011, 735. [Google Scholar] [CrossRef]
  14. Chael, A.; Narayan, R.; Johnson, M.D. Two-temperature, Magnetically Arrested Disc simulations of the jet from the supermassive black hole in M87. Mon. Not. R. Astron. Soc. 2019, 486, 2873–2895. [Google Scholar] [CrossRef]
  15. Chael, A.A. Simulating and Imaging Supermassive Black Hole Accretion Flows. Ph.D. Thesis, Harvard University, Cambridge, MA, USA, 2019. [Google Scholar]
  16. Jennison, R.C. A phase sensitive interferometer technique for the measurement of the Fourier transforms of spatial brightness distributions of small angular extent. Mon. Not. R. Astron. Soc. 1958, 118, 276. [Google Scholar] [CrossRef] [Green Version]
  17. Rogers, A.E.E.; Hinteregger, H.F.; Whitney, A.R.; Counselman, C.C.; Shapiro, I.I.; Wittels, J.J.; Klemperer, W.K.; Warnock, W.W.; Clark, T.A.; Hutton, L.K.; et al. The structure of radio sources 3C 273B and 3C 84 deduced from the “closure” phases and visibility amplitudes observed with three-element interferometers. Astrophys. J. 1974, 193, 293–301. [Google Scholar] [CrossRef]
  18. Lu, R.S.; Roelofs, F.; Fish, V.L.; Shiokawa, H.; Doeleman, S.S.; Gammie, C.F.; Falcke, H.; Krichbaum, T.P.; Zensus, J.A. Imaging an Event Horizon: Mitigation of Source Variability of Sagittarius A*. Astrophys. J. 2016, 817, 173. [Google Scholar] [CrossRef] [Green Version]
  19. Chael, A.A.; Johnson, M.D.; Narayan, R.; Doeleman, S.S.; Wardle, J.F.C.; Bouman, K.L. High-resolution Linear Polarimetric Imaging for the Event Horizon Telescope. Astrophys. J. 2016, 829, 11. [Google Scholar] [CrossRef]
  20. Akiyama, K.; Kuramochi, K.; Ikeda, S.; Fish, V.L.; Tazaki, F.; Honma, M.; Doeleman, S.S.; Broderick, A.E.; Dexter, J.; Mościbrodzka, M.; et al. Imaging the Schwarzschild-radius-scale Structure of M87 with the Event Horizon Telescope Using Sparse Modeling. Astrophys. J. 2017, 838, 1. [Google Scholar] [CrossRef]
  21. Akiyama, K.; Ikeda, S.; Pleau, M.; Fish, V.L.; Tazaki, F.; Kuramochi, K.; Broderick, A.E.; Dexter, J.; Mościbrodzka, M.; Gowanlock, M.; et al. Superresolution Full-polarimetric Imaging for Radio Interferometry with Sparse Modeling. Astrophys. J. 2017, 153, 159. [Google Scholar] [CrossRef] [Green Version]
  22. Chael, A.A.; Johnson, M.D.; Bouman, K.L.; Blackburn, L.L.; Akiyama, K.; Narayan, R. Interferometric Imaging Directly with Closure Phases and Closure Amplitudes. Astrophys. J. 2018, 857, 23. [Google Scholar] [CrossRef]
  23. Event Horizon Telescope Collaboration; Akiyama, K.; Alberdi, A.; Alef, W.; Asada, K.; Azulay, R.; Baczko, A.K.; Ball, D.; Baloković, M.; Barrett, J.; et al. First M87 Event Horizon Telescope Results. IV. Imaging the Central Supermassive Black Hole. Astrophys. J. Lett. 2019, 875, L4. [Google Scholar] [CrossRef]
  24. Event Horizon Telescope Collaboration; Akiyama, K.; Alberdi, A.; Alef, W.; Asada, K.; Azulay, R.; Baczko, A.K.; Ball, D.; Baloković, M.; Barrett, J.; et al. First M87 Event Horizon Telescope Results. VI. The Shadow and Mass of the Central Black Hole. Astrophys. J. Lett. 2019, 875, L6. [Google Scholar] [CrossRef]
Figure 1. Monthly average PWV values of the three sites from 1 January 2018 to 31 December 2021. Values were derived from the analysis of MERRA-2 model data.
Galaxies 11 00007 g001
Figure 2. Four-year (2018–2021) averaged zenith transmittance spectra of the three sites in March (left) and April (right). Rows from top to bottom correspond to SG, GLT, and SMT. Values were derived from the analysis of MERRA-2 model data.
Galaxies 11 00007 g002
Figure 3. Wind speeds throughout the year of 2019. Values were derived from the analysis of MERRA-2 model data.
Galaxies 11 00007 g003
Figure 4. Pipeline of the imaging process.
Galaxies 11 00007 g004
Figure 5. (Left) Elevation of telescopes vs GMST when observing Sgr A*. GLT is absent because it cannot observe Sgr A*. (Right) Elevation of telescopes vs GMST when observing M87. SPT is absent because it cannot observe M87. Since JCMT and APEX had the same sites as SMA and ALMA, we omitted them from the figure. The simulated observations were only conducted in the time intervals between the black vertical dashed lines. Stations outside these intervals did not participate in the observations.
Galaxies 11 00007 g005
Figure 6. (u, v) coverage of Sgr A* (top) and M87 (bottom) without and with the SG site (SG site in orange). An elevation limit of 10 degrees is applied for each station.
Galaxies 11 00007 g006
Figure 7. (Top-left) Dirty beam of Sgr A* without the SG site. (Top-right) Dirty beam of Sgr A* with the SG site. (Bottom-left) Dirty beam of M87 without the SG site. (Bottom-right) Dirty beam of M87 with the SG site.
Galaxies 11 00007 g007
Figure 8. (Left) Visibility amplitudes as a function of u–v distance for Sgr A* without the SG site. (Middle) Visibility amplitudes as a function of u–v distance for Sgr A* with the SG site (SG site in orange). (Right) Closure phases as a function of GMST for Sgr A*.
Galaxies 11 00007 g008
Figure 9. (Left) Model image of Sgr A*. (Middle) Reconstructed image of Sgr A* without the SG site (NRMSE = 0.537). (Right) Reconstructed image of Sgr A* with the SG site (NRMSE = 0.225).
Galaxies 11 00007 g009
Figure 10. (Left) Visibility amplitude as a function of u–v distance for M87 without the SG site. (Middle) Visibility amplitude as a function of UV-distance for M87 with the SG site (SG site in orange). (Right) Closure phases as a function of GMST for M87.
Galaxies 11 00007 g010
Figure 11. (Left) Model image of M87 (blurred with 11 μas circle Gauss beam). (Middle) Reconstructed image of M87 without the SG site (NRMSE = 0.224). (Right) Reconstructed image of M87 with the SG site (NRMSE = 0.175).
Galaxies 11 00007 g011
Table 1. Locations and SEFD values of the four new stations. SEFD values were calculated for 230 GHz.
TelescopeLocationSEFD (Jy)X (m)Y (m)Z (m)
SPARTJapan10,000−3,871,061.023,428,327.243,723,784.27
YonseiKorea4428−3,042,280.914,045,902.723,867,374.35
SGChina520092,309.8775,566,822.8093,109,831.733
AMTNamibia60005,627,857.4261,638,239.676−2,512,266.994
Table 2. Weights of data terms.
Data/Regularizer TermsWeight (Round 1)Weight (Round 2)Weight (Rounds 3 and 4)
Visibility Amplitude ( α a m p )115
Closure phase ( α C P )1012
Log Closure Amplitude ( α l n C A )1012
Table 3. Weights of regularization terms.
Entropy ( β e n t r o p y )101010
Total Variation ( β T V )111
Total squared variation ( β T S V )111
Centroid Position ( β c e n )202020
Total Flux Density ( β f l u x )100100100
Disclaimer/Publisher’s Note: The statements, opinions and data contained in all publications are solely those of the individual author(s) and contributor(s) and not of MDPI and/or the editor(s). MDPI and/or the editor(s) disclaim responsibility for any injury to people or property resulting from any ideas, methods, instructions or products referred to in the content.

