Article

Baryonic Mass Inventory for Galaxies and Rarefied Media from Theory and Observations of Rotation and Luminosity

Department of Earth, Environmental, and Planetary Sciences, Washington University, St. Louis, MO 63130, USA
*
Author to whom correspondence should be addressed.
Galaxies 2023, 11(5), 100; https://doi.org/10.3390/galaxies11050100
Submission received: 16 May 2023 / Revised: 11 August 2023 / Accepted: 8 September 2023 / Published: 20 September 2023

Abstract

:
Available inventories of baryonic mass in the universe are based largely on galactic data and empirical calculations made >20 years ago. Values falling below cosmological estimates underlie proposals that certain rarified gassy regions could have extremely high T, which motivated absorption measurements and hydrodynamic models. Yet, the shortfall remains. We inventory the total baryonic mass, focusing on gravitational interactions and updated measurements. A recent analytical inverse method for analyzing galactic rotation curves quantified how baryon mass and associated volumetric density (ρ) depend on distance (r) from galactic centers. The model is based on the dynamical consequences of the observed oblate shape of galaxies and the Virial Theorem. The parameter-free solution provides ρ(r) ∝ 1/r2 which describes star-rich galactic interiors, gas-rich outer discoids, circumgalactic media, and gradation into intergalactic media. Independent observational determinations of baryonic ρ validate that our 1/r2 result describes baryons alone. This solution shows that total baryonic mass associated with any galaxy is 2.4 to 40 times detectable luminosity, depending on galaxy size and spacing. Luminosity data within 50 Mpc show that Andromeda equivalents separated by ~1 Mpc represent the local universe. Combining the above yields (6 ± 2) × 10−25 kg m−3 for the present-day universe. Three other approaches support this high density: (1) evaluating trends and luminosity data near 1000 Mpc; (2) using a recent estimate for the number of galaxies in the universe; (3) calculating an energy balance. We discuss uncertainties in the critical density. Implications of large baryonic ρ are briefly discussed.

1. Introduction

Models of the Big Bang predict ~30% to 40% more baryons than have been estimated from observations of the local universe (e.g., [1,2,3,4]), and suggest that baryons are only a small proportion of total mass. Masses of objects composing the universe, i.e., galaxies with their internal star-rich components, hydrogen-rich interstellar media (ISM), and atmospheres grading into rarified space, have been determined from luminosity measurements and mass–luminosity proportionalities [5,6]. This shortage is currently attributed to underestimation of masses of low-luminosity gas in circumgalactic (CGM) and especially intergalactic (IGM) media. Spectral signatures of the baryons in these two low-density regions would be indistinguishable from noise in most acquisitions if temperatures are sufficiently hot to ionize hydrogen, the dominant species [7,8,9]. This perceived limitation in observing media emissions underlies proposals of warm–hot intergalactic media (WHIM). However, the mass shortfall has not been resolved, despite exploration of the WHIM hypothesis in two unrelated ways: models of shock heating without collisions (e.g., [10,11,12,13]) and measurements of absorptions (e.g., [1,9,14,15,16]). Moreover, absorptions of Fe and O atoms have been attributed to cold outflows, rather than to WHIM itself [17]. Improving accuracy of the baryon inventory is essential. All mass reservoirs need reappraising for the following reasons:
  • Significant advances in the quality and completeness of observations of diverse galaxies, CGM (e.g., Figure 1 [18]), the Local Group (e.g., [19,20]), and galactic inventories (e.g., [21,22]) have been made since Salucci and Persic [5] estimated the amount of hydrogen inside galaxies.
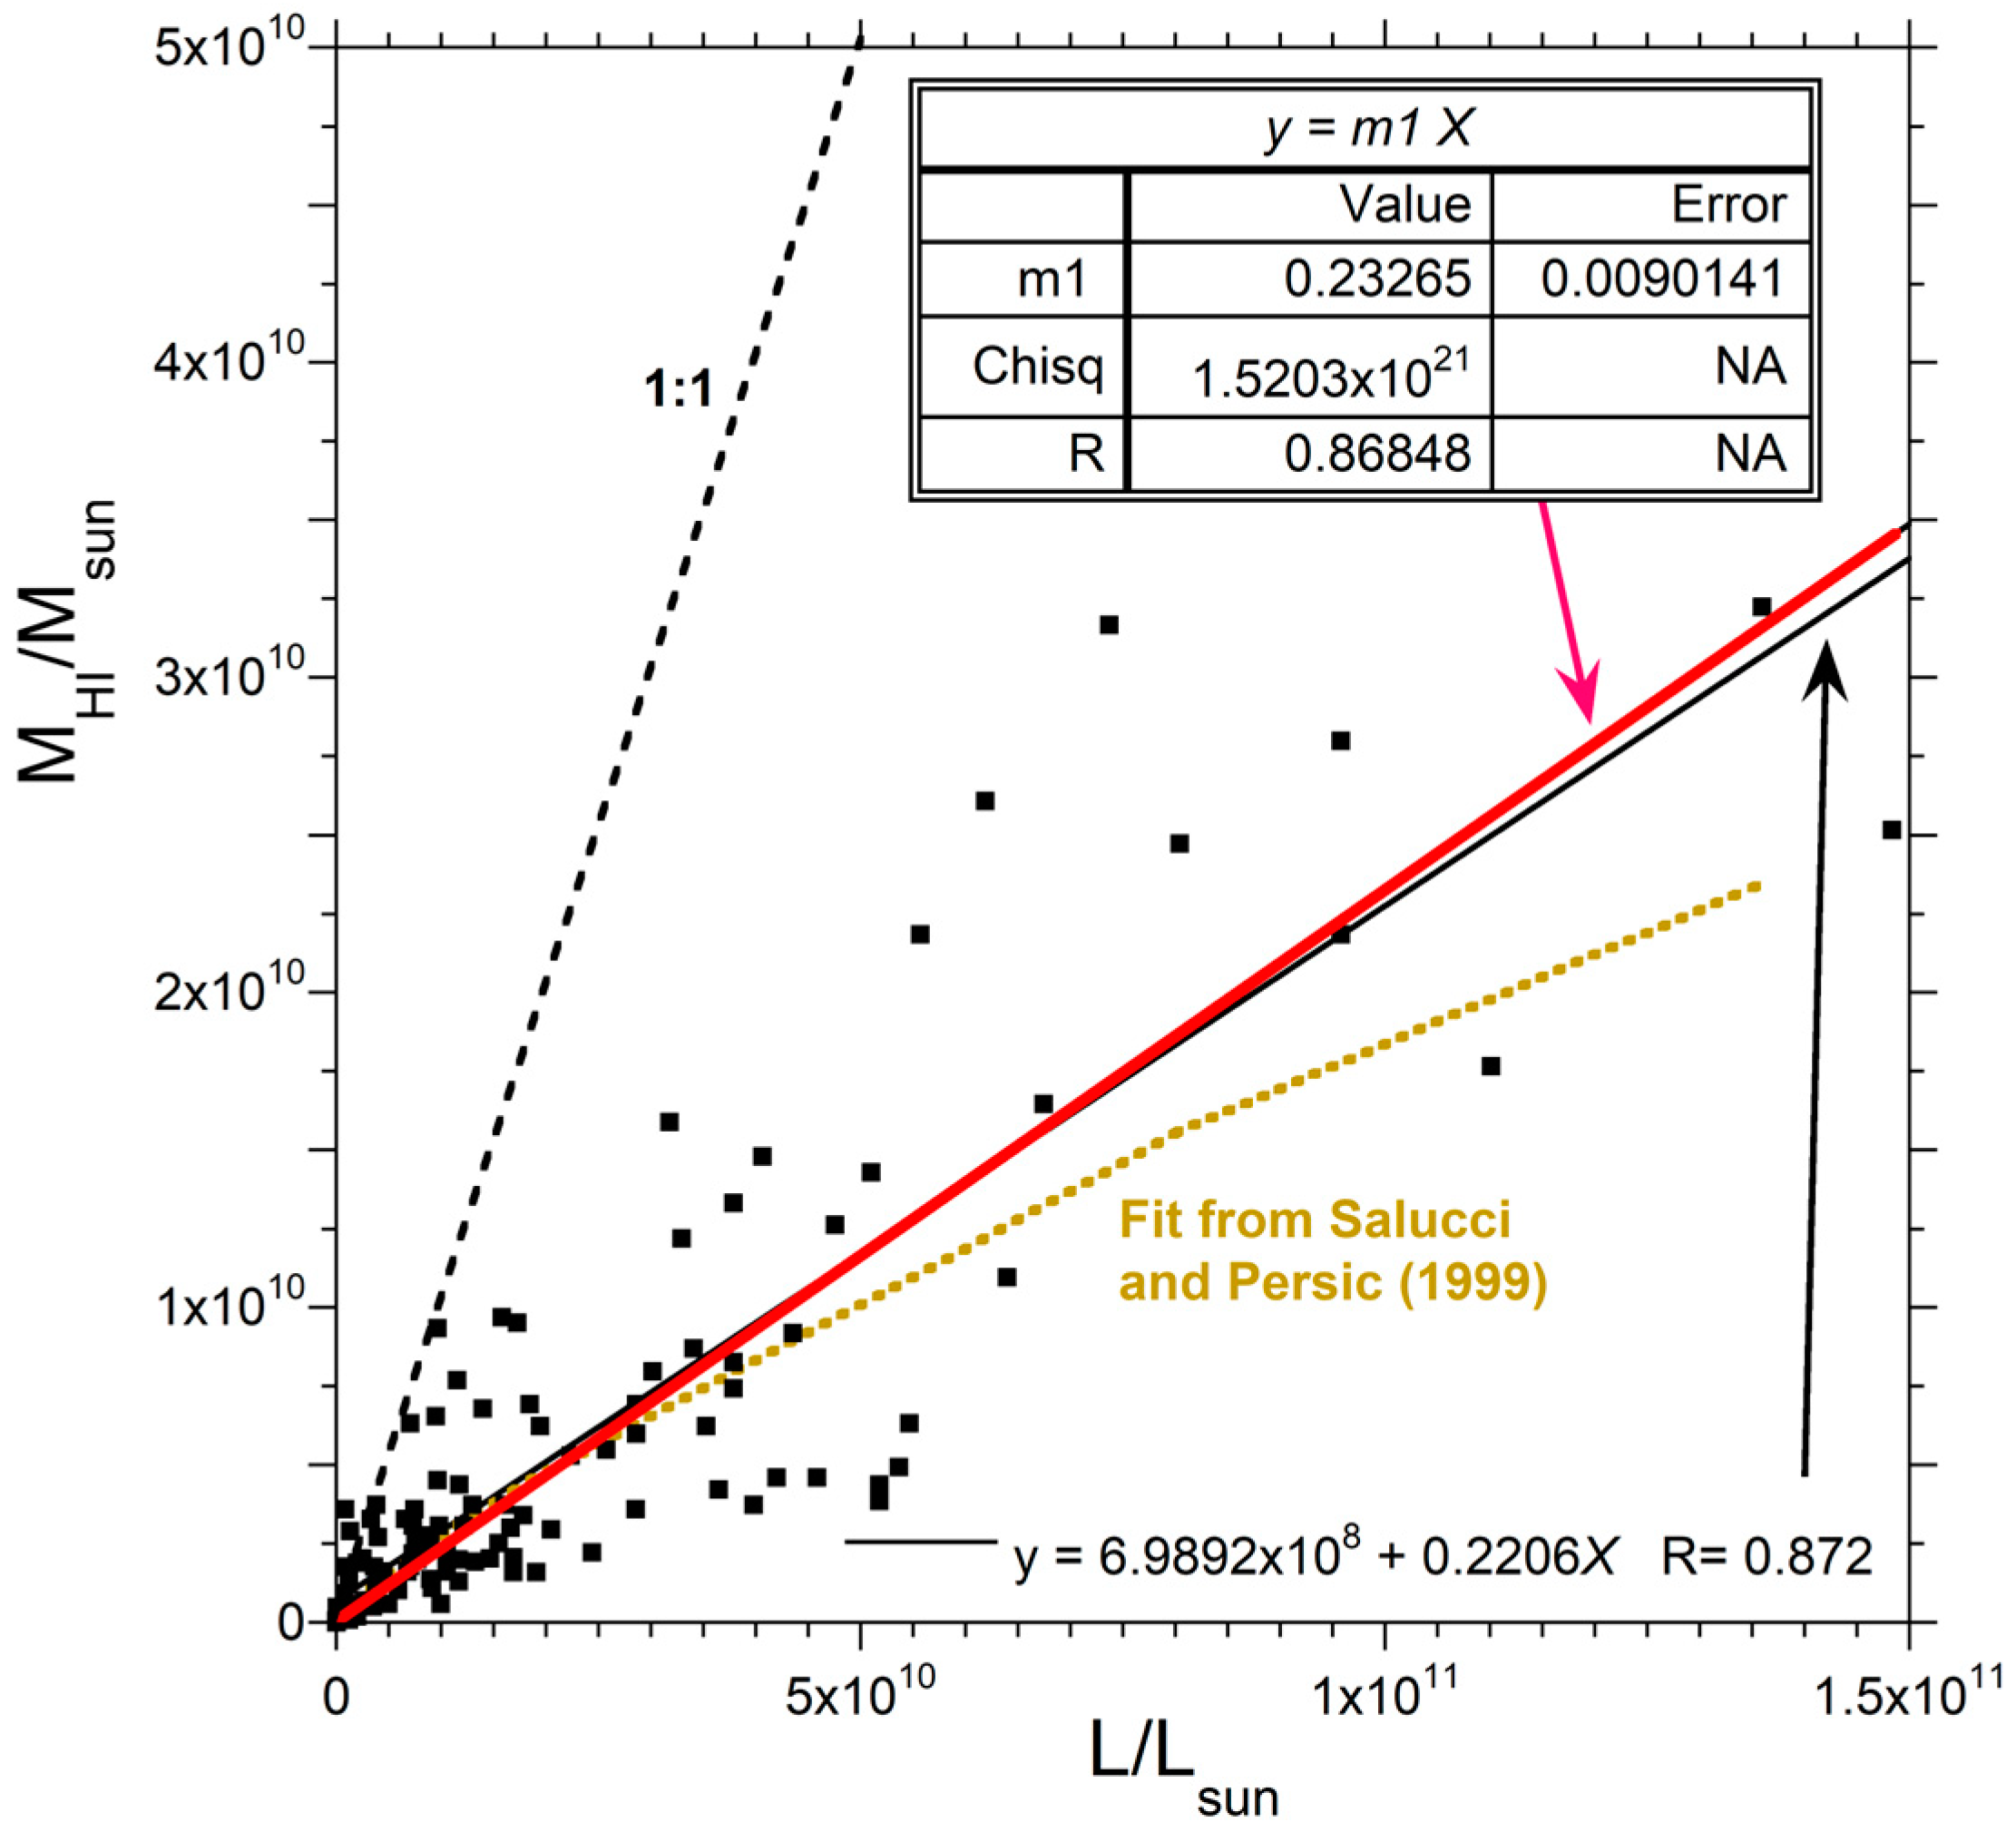
  • The galactic mass inventory rests on an ambiguous mass–luminosity correlation (Figure 2). The fits underestimate hydrogen (HI) mass for large galaxies from their luminosity. This defect is problematic because large galaxies are thought to disproportionately control the distribution function of baryonic mass used in the inventory [5]. Section 1.1 provides further discussion.
  • Revisiting the inventory of baryons, particularly in the Local Group, is warranted not only by the greatly expanded database, but moreover by recent advances in how mass is deduced from the measured rotation curves (RC = tangential velocity vs. equatorial radius: see Section 1.1). Not only do recent data probe CGM, but a recently developed inverse model further permits addressing the gradation of CGM density into IGM (Section 2.1).
  • Distribution functions of galactic luminosity merit revisiting, due to growth of observational data. Roughly 10 times the luminosity data exist today than in 1999 (e.g., the NED website [26]).
Based on the above, we improve the observational inventory by exploring CGM and IGM masses through their gravitational interactions with the mass concentrated in star-rich, galactic interiors. Section 1.1 summarizes previous and recent approaches to gravitational forces associated with galaxies. Section 1.2 describes the organization of our paper.
Figure 2. Least-squares fit to the HI mass and luminosity for various galaxies used by Salucci and Persic [5] to determine the baryonic inventory. Squares = compiled data from two studies. Data on spirals from a thesis [27] are greatly scattered, yet these objects control the slope in a least-squares fit, since dwarfs fall near the origin on a linear plot. For dwarf galaxies, star mass was assumed to be nearly equal to the luminosity [28]. The 1:1 correspondence of mass and luminosity for the stellar component (the dotted line) shows that gas is a minor component (<24%) in the models used. Least-squares linear fits with an intercept (fine black line) and without an intercept (red heavy line) are compared to the fit from [5] (tan dotted curve), which poorly describes large galaxies.
Galaxies 11 00100 g002

1.1. Background on Mass Determinations of Galaxies

Gravitational models of galactic dynamics and uncertainties in rotation curves, which are extracted from Doppler shifts, e.g., of the 21 cm HI spectral line [28], were reviewed in [29]. These Doppler “snapshots” document organized, slow, rotational motions about the special axis of these essentially uniaxial bodies. Gravitational stability is implicated, which is not an equilibrium condition.
The 1999 inventory of baryons in galaxies [5] is based on the ~1970s models of galactic dynamics. Concerns with this approach persist, as described below.
Observations of galactic rotation curves increasing outward from the center and then generally flattening [30] motivated proposals that a huge, but unseen, sphere of non-baryonic dark matter (NBDM) surrounds galaxies. Inference of NBDM haloes was contested almost immediately by G. Burbidge [31]. He pointed out that a reasonable mass for the Milky Way galaxy could be obtained without invoking NBDM from data on the orbits of its dwarf satellite galaxies.
Because independent, direct evidence for NBDM remains unavailable [32,33], this popular explanation for RC continues to be questioned. For example, many researchers since the 1980s have attempted to explain RC by altering Newton’s gravitational constant (G), an approach initiated by Milgrom [34,35]. Newtonian explanations of the RC patterns now exist (discussed below). To place this recent work in context, we next cover the NBDM proposal and its limitations in inventorying baryons in the universe.

1.1.1. Analysis of RC through Multiparameter Fitting Models with Halos

The NBDM proposal assumes that the orbits of innumerable, interacting stars in a galaxy should resemble Kepler’s law for the Solar System, which is also flat. However, the Solar System has only eight large, discrete orbiting bodies (the planets) which negligibly interact with each other [36,37], whereas the multitudinous and continuously distributed stars in galaxies are so strongly interdependent that they are effectively grid-locked [38]. Importantly, galaxies have finite thickness and uniaxial or lower symmetry (Figure 1).
Although spiral galaxies have a center of mass, this situation differs from having a dominant central mass. Specifically, ~½ of galactic mass resides outside the radius half-way between the center and the visible edge perceived in images, in contrast to the Solar System where ~99% of the total mass resides in its central Sun. This crucial difference exists because the area of any disc-like shape increases as equatorial radius squared. Existence of a black-hole at the galactic center has a negligible effect on RC; for example, the central black-hole of the Milky Way (4 × 10⁶ Msun [39]) represents only a tiny fraction, ~10−6, of the total galactic mass, since this total mass substantially exceeds the 2 × 10¹¹ Msun sequestered in stars [40].
All analyses calling on NBDM are forward (or direct) models, which are solved by inserting an assumed input (source characteristics) into a standard equation, formula, or program, which returns a result [41] (chapter 1). Models that fit velocities to an assumed mass distribution can only describe galaxies out to the radius of measurements. Problems also exist in the methodology ([29]). Most importantly, any RC can be fit in these forward models by considering that only an NBDM halo exists because a spherical distribution acts as a point mass inside the relevant radius per Newton [42]. Although fitting approaches minimize the NBDM component [43], this does not quantify the baryonic component, since zero baryons is a valid solution for these models, but this solution is demonstrably incorrect.
Because masses of hydrogen atmospheres (CGM) were not obtained through fitting RC data, other models and additional assumptions were made by [5]. Briefly, the mass–luminosity relationship for HI in the 1999 galaxy inventory was obtained by fitting results from models of HI mass for spirals [27] and dwarfs [28] to a function which sums a logarithmic term with two power law terms [5]. Using a log–log plot emphasizes the small galaxies, which have the least reliable RC and contribute little to the galactic inventory. Figure 2 shows that the data are too scattered to justify the complicated fit of [5], but are reasonably depicted by MHI/Msun = 0.23 L/Lsun. The plot on a linear scale shows that any possible representation of the HI data is dwarfed by the 1:1 correspondence between stellar mass and luminosity, which is widely used to represent galaxies. The outskirts of spirals have abundant gas (Figure 1). Hence, the present inventory has significantly underestimated unconsolidated matter near galaxies.

1.1.2. Recent Inverse Models for RC Analysis

Given the non-spherical distribution of stars and gassy surroundings in galaxies (Figure 1), and axial symmetry of the gravitational field inside and outside oblate objects [44], the effects of non-spherically symmetry on galactic dynamics need to be addressed when analyzing rotation curves. Three Newtonian inverse models were recently developed for each of three shapes: the equatorial plane [45,46], the thin disc [47,48,49], and the oblate spheroid [38,50]. In contrast to forward modeling, the inverse approach deduces the nature of a remote source from its consequences (e.g., [41,51]), which is v(r) for galaxies. All three inverse models calculate the baryonic (total) mass constituent from rotation curves using zero fitting parameters. All inverse models show that flattening of v as r increases results from non-spherical baryonic mass distributions, and that NBDM is not needed. Mutual agreement of masses from three mathematically distinct approaches based on three different shapes (Section 2.2.2) calls for revisiting the baryonic inventory.

1.2. Organization of the Present Paper

Section 2 evaluates the baryon inventory in and around galaxies from their dynamics by considering their oblate shapes. We provide density as a function of radius for the luminous interiors, GCM, and IGM, focusing on the Local Group and well-characterized RC for diverse galactic morphologies. Verification and validation are covered. We derive mass–luminosity relationships for the star-rich interiors and the gas-rich surroundings.
Section 3 provides updated statistical distributions of galactic luminosity for the Local Group, the Virgo Cluster, and out to 250 Mpc from the extensive NED database [25]. Trends with distance are explained in terms of probability functions, observational limitations on the detectable galaxy size, and the volume of space accessed.
The results of Section 2 and Section 3 are used in Section 4 to elucidate the distribution of mass and to provide three independent estimates for the density of baryons in the universe. A fourth theoretical approach supports these three estimates. Section 5 discusses uncertainties and reliability of our different approaches and of the critical density. Section 6 concludes with the implications of our findings.

2. Gravitational Assessment of Baryonic Mass and Density in and near Galaxies

2.1. Summary of a Parameter-Free Inverse Model of Differentially Rotating Oblate Sphereoids

Galaxies are differentially spinning objects which have rotation curves resemble those of hurricanes (see figures in [50,52]). Retention of large-scale coherency by gaseous astronomical objects during spin is also obviated by the global behavior of planetary and stellar atmospheres. These gas molecules are part of the organized spin of the star or planet and cannot be treated as each moving independently. Importantly, the theory predicting an oblate shape describes fluid matter (gases or liquids). Although the resistance of solid matter to deformation is neglected in this formulation, solids such as the Earth are also reasonably represented (e.g., [53]).
The organized phenomenon of spin differs from orbital motions because they are governed by different potentials. Thus, the Sun’s spin is unrelated to orbits of its planets, and Earth’s daily spin is independent of its orbit. Specifically, orbits are governed by the potential exterior to the central object, which may or may not be spinning. Axial spin is controlled by the interior potential of the object itself. These two gravitational potentials are mathematically distinct, matching only on the object’s surface (e.g., [40,54,55]). Although the oblate shape applies to galaxies (e.g., Figure 1) as recognized long ago [56], the complex forms for the potential combined with a mathematical error regarding the z dependence of ρ by [57] misdirected efforts to focus on disc-like shapes (see [29,50] for discussion).
For the oblate spheroid shape, both interior and exterior forces are weaker in the vertical than in the horizontal directions, such that the directional difference increases with flattening. Consequently, orbits around an isolated oblate body are only stable if equatorial or polar [44]. This behavior is exhibited by spiral galaxies:
  • Half of Andromeda’s known 27 dwarf satellite galaxies orbit in a plane with a radius of nearly 400 kpc, which is slightly more than halfway to the proximal Milky Way (MW). This plane is tilted ~23° from Andromeda’s equatorial plane [43] and includes the center of the MW. Hence, the additional force from the MW stabilizes these tilted orbits.
  • Dwarf satellite galaxies around the MW occupy polar orbits [58] rather than having the equatorial orientation expected around an isolated oblate spheroid. Hence, the force from larger, nearby Andromeda influences orientations of MW satellite orbits.
  • Rarely, isolated spiral galaxies exhibit polar structures [59] or have outer rings that rotate nearly perpendicularly to the inner discoid [60,61]. In contrast, counter-rotating galaxies are fairly common, whose orientation can be attributed to a tilted ring being pulled to the equatorial plane of the central body.
If an NBDM spherical halo existed, orbits of dwarf satellite galaxies would be randomly oriented, and tilted rings or discs would be common.

2.1.1. Mathematical Construct

The minor (c) and major (a) axes of an oblate define its ellipticity:
e = ( 1 c 2 / a 2 ) 1 2
Because each surface of the nested homeoidal shells has the same shape factor e, their vertical (z) and radial (r) positions are related:
z 2 = ( 1 e 2 ) ( a 2 r 2 )
Equation (2) underlies the reasonableness of representing the motions of stars in a galaxy as tangential velocities (v) that solely depend on equatorial radius. Furthermore, Equation (2) shows why volumetric density (z) depends on (r), along with a and e, which considerably simplifies analyses of RC for a spinning oblate spheroid.
Because RC data depict an average condition at an instant of time, the motions must be modeled as being steady-state, i.e., the galaxy is spinning stably. Stability requires that each homeoid has constant density and is equipotential, as recognized by Newton (see discussion by [62]; p. 87). On this basis, Criss and Hofmeister [38,50] obtained the homeoid potential by differentiating the self-gravitational potential of a spheroid, which is simply the self-gravitational potential of a homogeneous sphere of equivalent volume multiplied by a simple geometrical factor involving ellipticity (e.g., [63]). Applying the Virial Theorem to each of the nested coaxial homeoids, each with radius r, mass m, and angular velocity ω, yields (GMinm/r)arcsin(e)/e = ⅔mr2ω2. Rearranging terms provides the mass inside the homeoid:
M i n ( r ) = e arcsin ( e ) 2 3 G r v homeoid 2 ( r )
where v is the tangential velocity. Because e ranges only from 0 to 1, the geometrical factor arcsin(e)/e ranges only from 1 to π/2 (i.e., 1 to 1.5708). Thus, for any given RC, the mass of even a very flat galaxy can only be lower than that of a sphere by ×0.6366. Calculations of the dynamical mass, which assumes spherical symmetry, omit the additional factor of ×2/3, due to assuming that tangential velocity is that of an orbit (i.e., the exterior potential is assumed).
Differentiating Equation (3) leads to the analytical solution [38,50]:
ρ ( r ) = 1 6 π G ( 2 v r v r + v 2 r 2 ) 3 e 1 e 2 arcsin ( e ) .
This approach constitutes an inverse model [40,51] because the input is measured RC and the output is the desired density (or mass). Equation (4) applies to isolated galaxies of all morphological types. No assumptions were made other than Newtonian physics and conservation laws. Equation (4) is analytic and exact, has no free parameters, and allows direct and unambiguous extraction of density and interior mass (Min, by integrating or summing) profiles from RC. Ellipticity is constrained for round galaxies and edge-on spirals. Assuming c/a = 0.1 for spirals with unknown e hardly affects calculations of mass and density, as visually depicted in Figure 3.
Alternatively, a spreadsheet approach is equally valid, and it was used to extract Min(r) from published tables of v(r) using Equation (3) for 51 galaxies [38], including Andromeda (Figure 2). Density is then obtained by differentiating the tabulated Min vs. radius and utilizing the volume for the homeoid, dV = 4πr2dr(c/a).
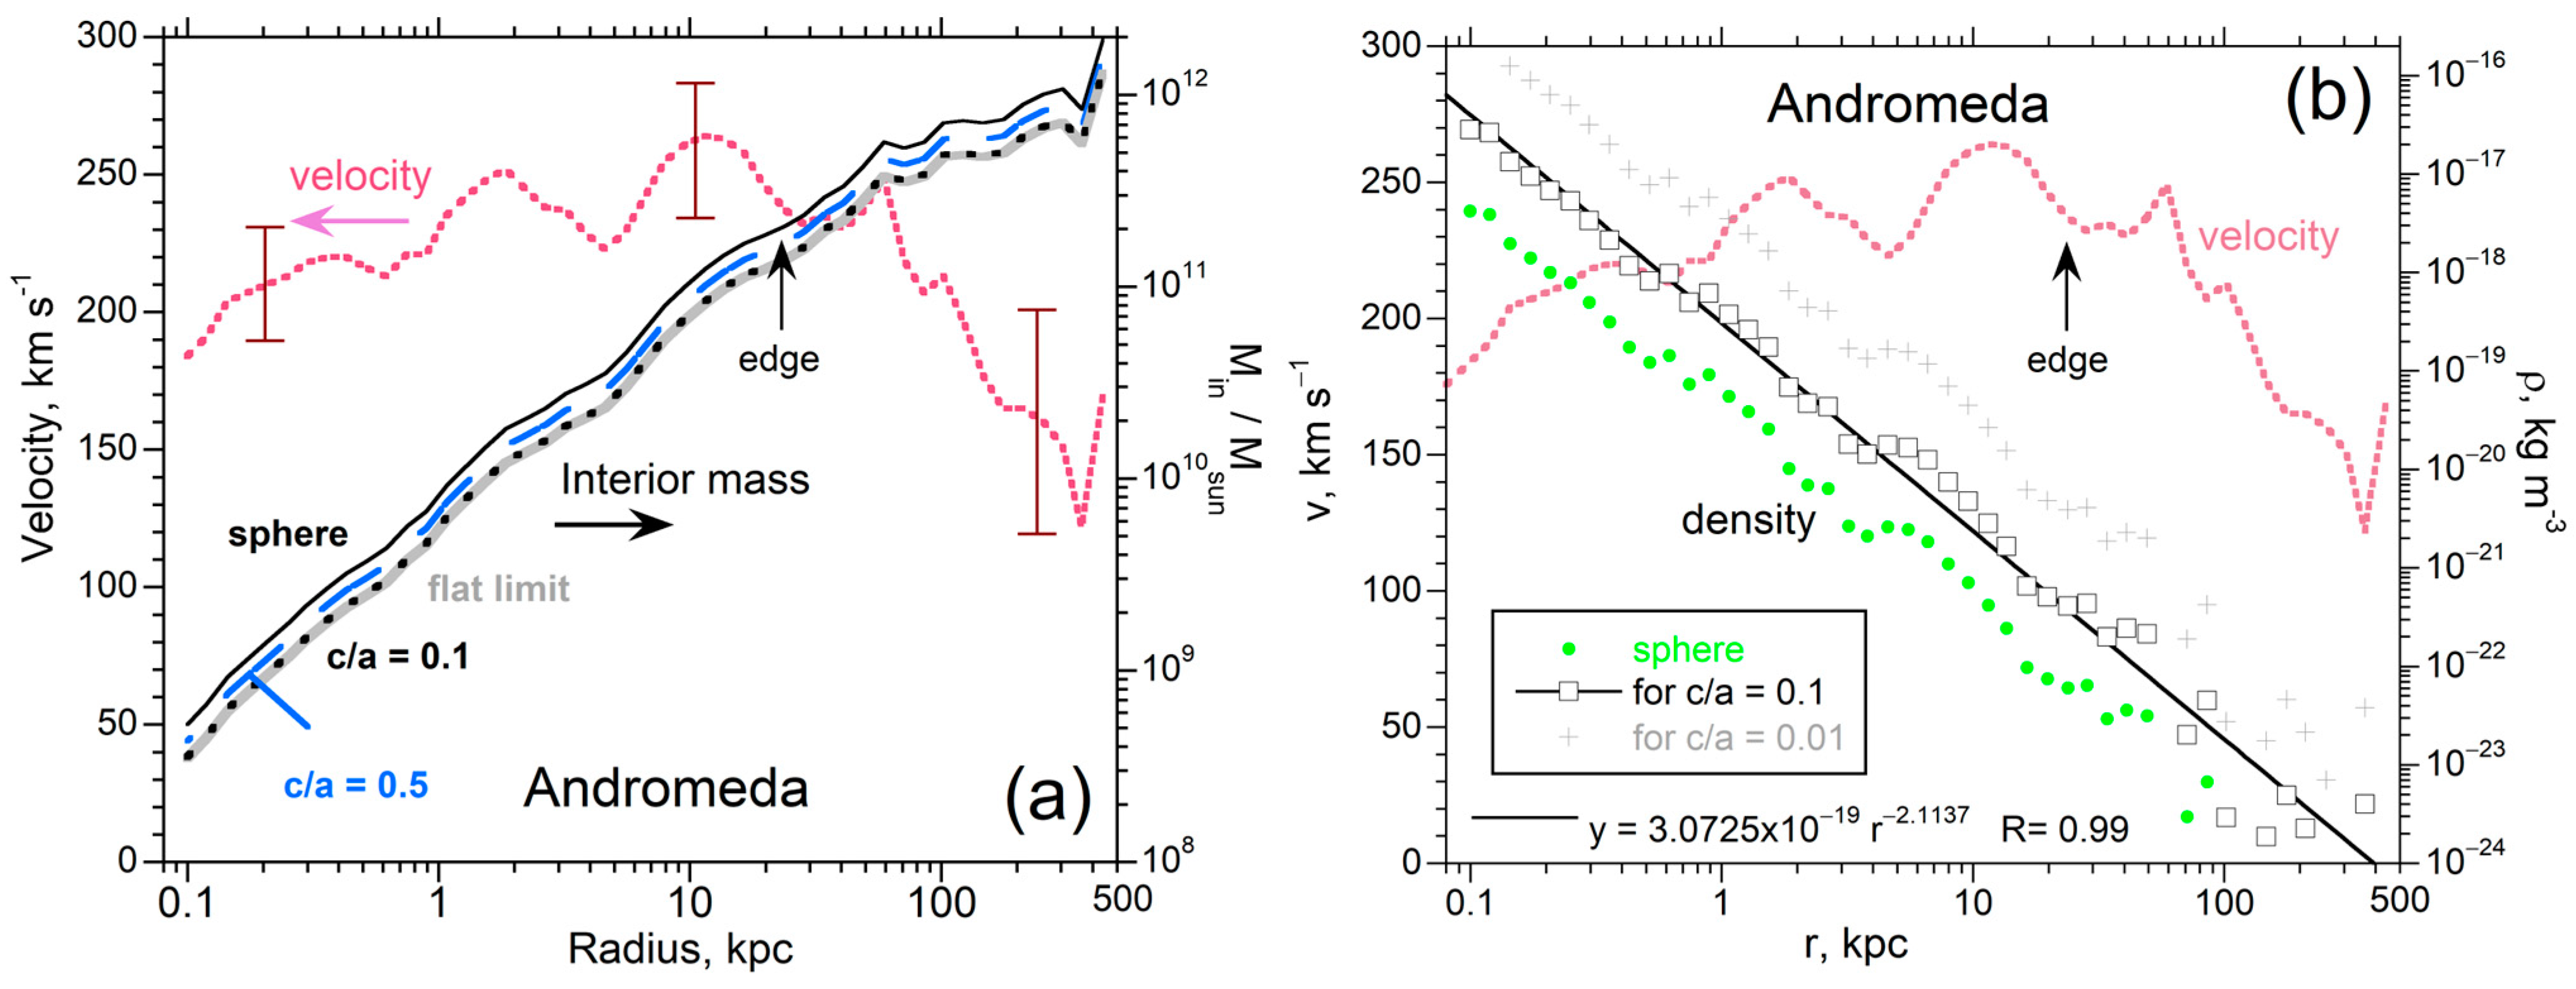
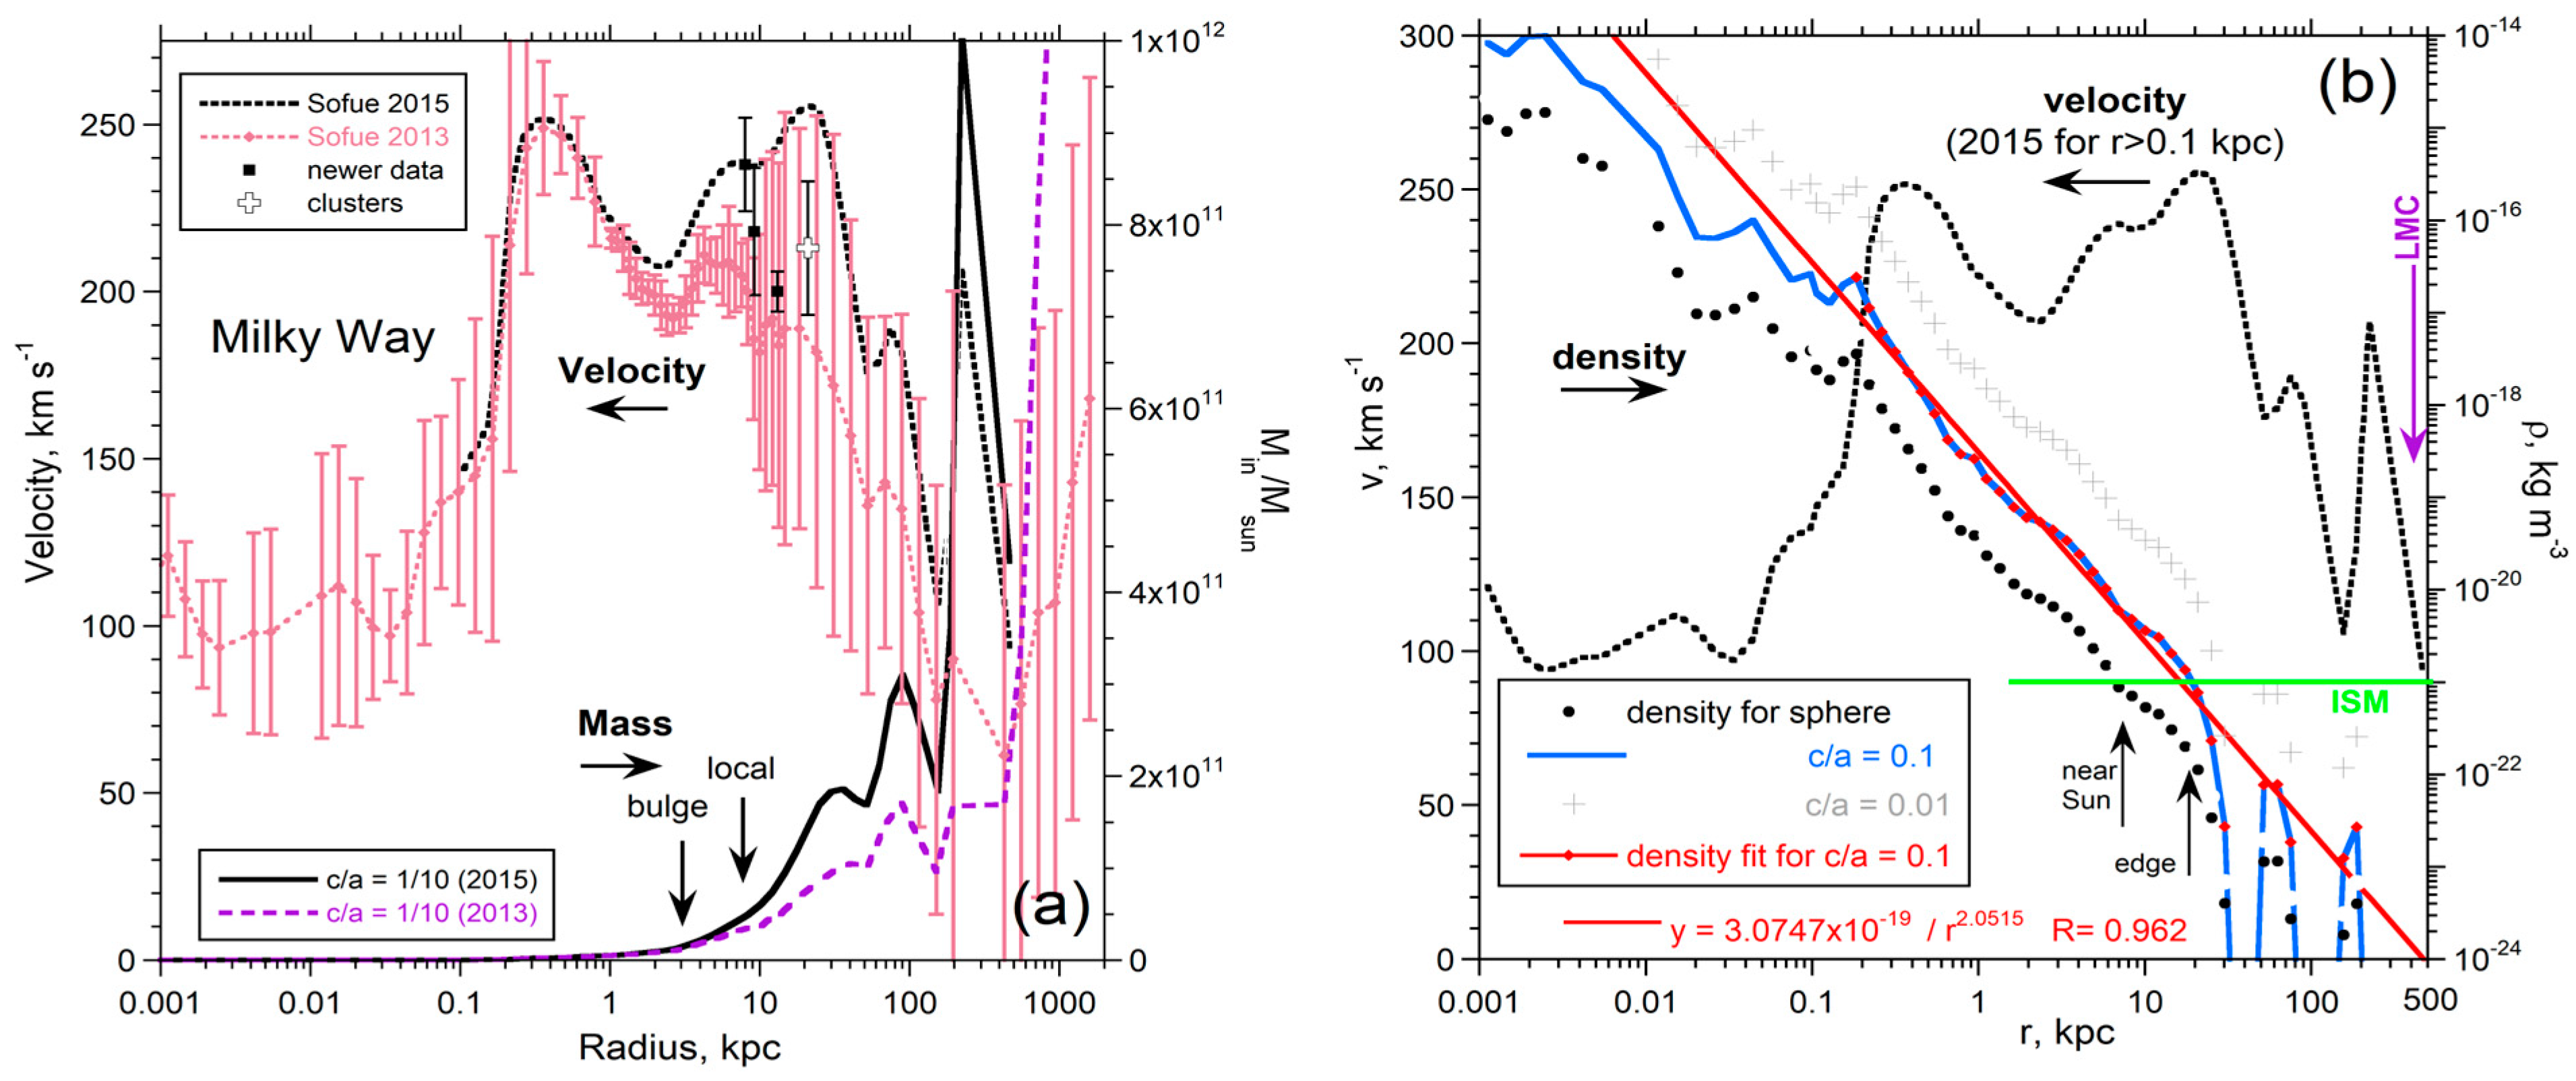
On a log scale, very little difference exists in Min between the limiting aspect ratios at any given radius, as shown by the gray, blue, and thin black sequence of curves in Figure 3a depicting c/a from 0.01 to 1. Uncertainties in mass thus mainly result from uncertainties in the RC. One source of error lies in the distance to the object; thus, we focus on nearby galaxies where the measurements are direct, rather than being established from redshifts. The remaining, dominant, source of experimental error is the velocities. This can be gauged from three examples. Four studies of Andromeda have v within ~10% of Sofue’s [64] average inside the visible edge and slightly beyond (Figure 3). Three studies of Triangulum (Figure A1) similarly differ. The Milky Way is another large, well-studied spiral (Figure 4). However, our unique view from the inside contributes considerable uncertainty to the velocities at large radii due to our off-center galactic perspective. In contrast, averaging Doppler data for the two halves of galaxies measured from the outside is unambiguous, which smooths and reduces uncertainties. Because all other RC are viewed from the outside, a 10% uncertainty in v is expected, based on Andromeda and Triangulum.
Near the center of the Milky Way, the trend of density with radius is shallow compared the trend further out (Figure 4). A fit below r = 0.1 kpc gives ρ = 6.41 × 10⁻¹⁹ r−1.48 with a residual factor of 0.825 (not shown). Data on Andromeda begin above 0.1 kpc; hence, density can be fit to a single power law (Figure 3).

2.2. Parameter-Free Analysis of 72 Galaxies

Appendix A shows analyzed RC for several galaxies in the Local Group (LG), plus some nearby. A few galaxies from the previous study of 51 objects [38] (e.g., Fornax) were reanalyzed to minimize the effect of scatter in the RC data. Table A1 in the Appendix A summarizes results for all galaxies in the Local Group with RC. Table A1 includes results for 23 galaxies not previously analyzed by [38]. Luminosity and the radius of the visible edge, typically calculated at the 25.0 mag arcsec−2 isophote in the B band, were obtained from the NED database [26]. We used measured galactic aspect ratios if available and assumed c/a = 0.1 for spirals when data were unavailable. Figure 3 and Figure 4 show that this assumption hardly affects the results.
The LG contains many dwarfs. Although elliptical galaxies and other roundish types do not technically have RC, we include these types (Table A1) because many researchers (e.g., [68]) have treated their velocity dispersions as RC.
Two of the 51 galaxies in the previous study are not used here. One is the polar ring galaxy (NGC 4560a), because this is a rare type, and RC data do not reach the visible edge radius. The other is NCG 4254 because RC data are only collected out to 1.9 kpc, which is a small fraction of the visible edge radius of 13.5 kpc.
The combination of Appendix A and [38] provides mass inside any given r, and ρ vs. r from measured velocity v(r) for 44 spirals, 6 ellipticals and lenticulars, 1 compact dwarf elliptical, and 21 dwarf irregulars and spheroidals. Although data on large ellipticals and lenticulars are few and less accurate than RC of spirals, dependence of their mass and density on radius is similar to Min and ρ vs. r for spirals. More data exist in the literature, but some are affected by interactions (e.g., M110 [69]).
Consistency of the results for these 72 galaxies, as shown in the figures below and figures in [38], suggests that additional calculations (or measurements) are not needed to quantify mass in and around galaxies, as well as its gradation to great distance.

2.2.1. Dependence of Mass on Galaxy Size

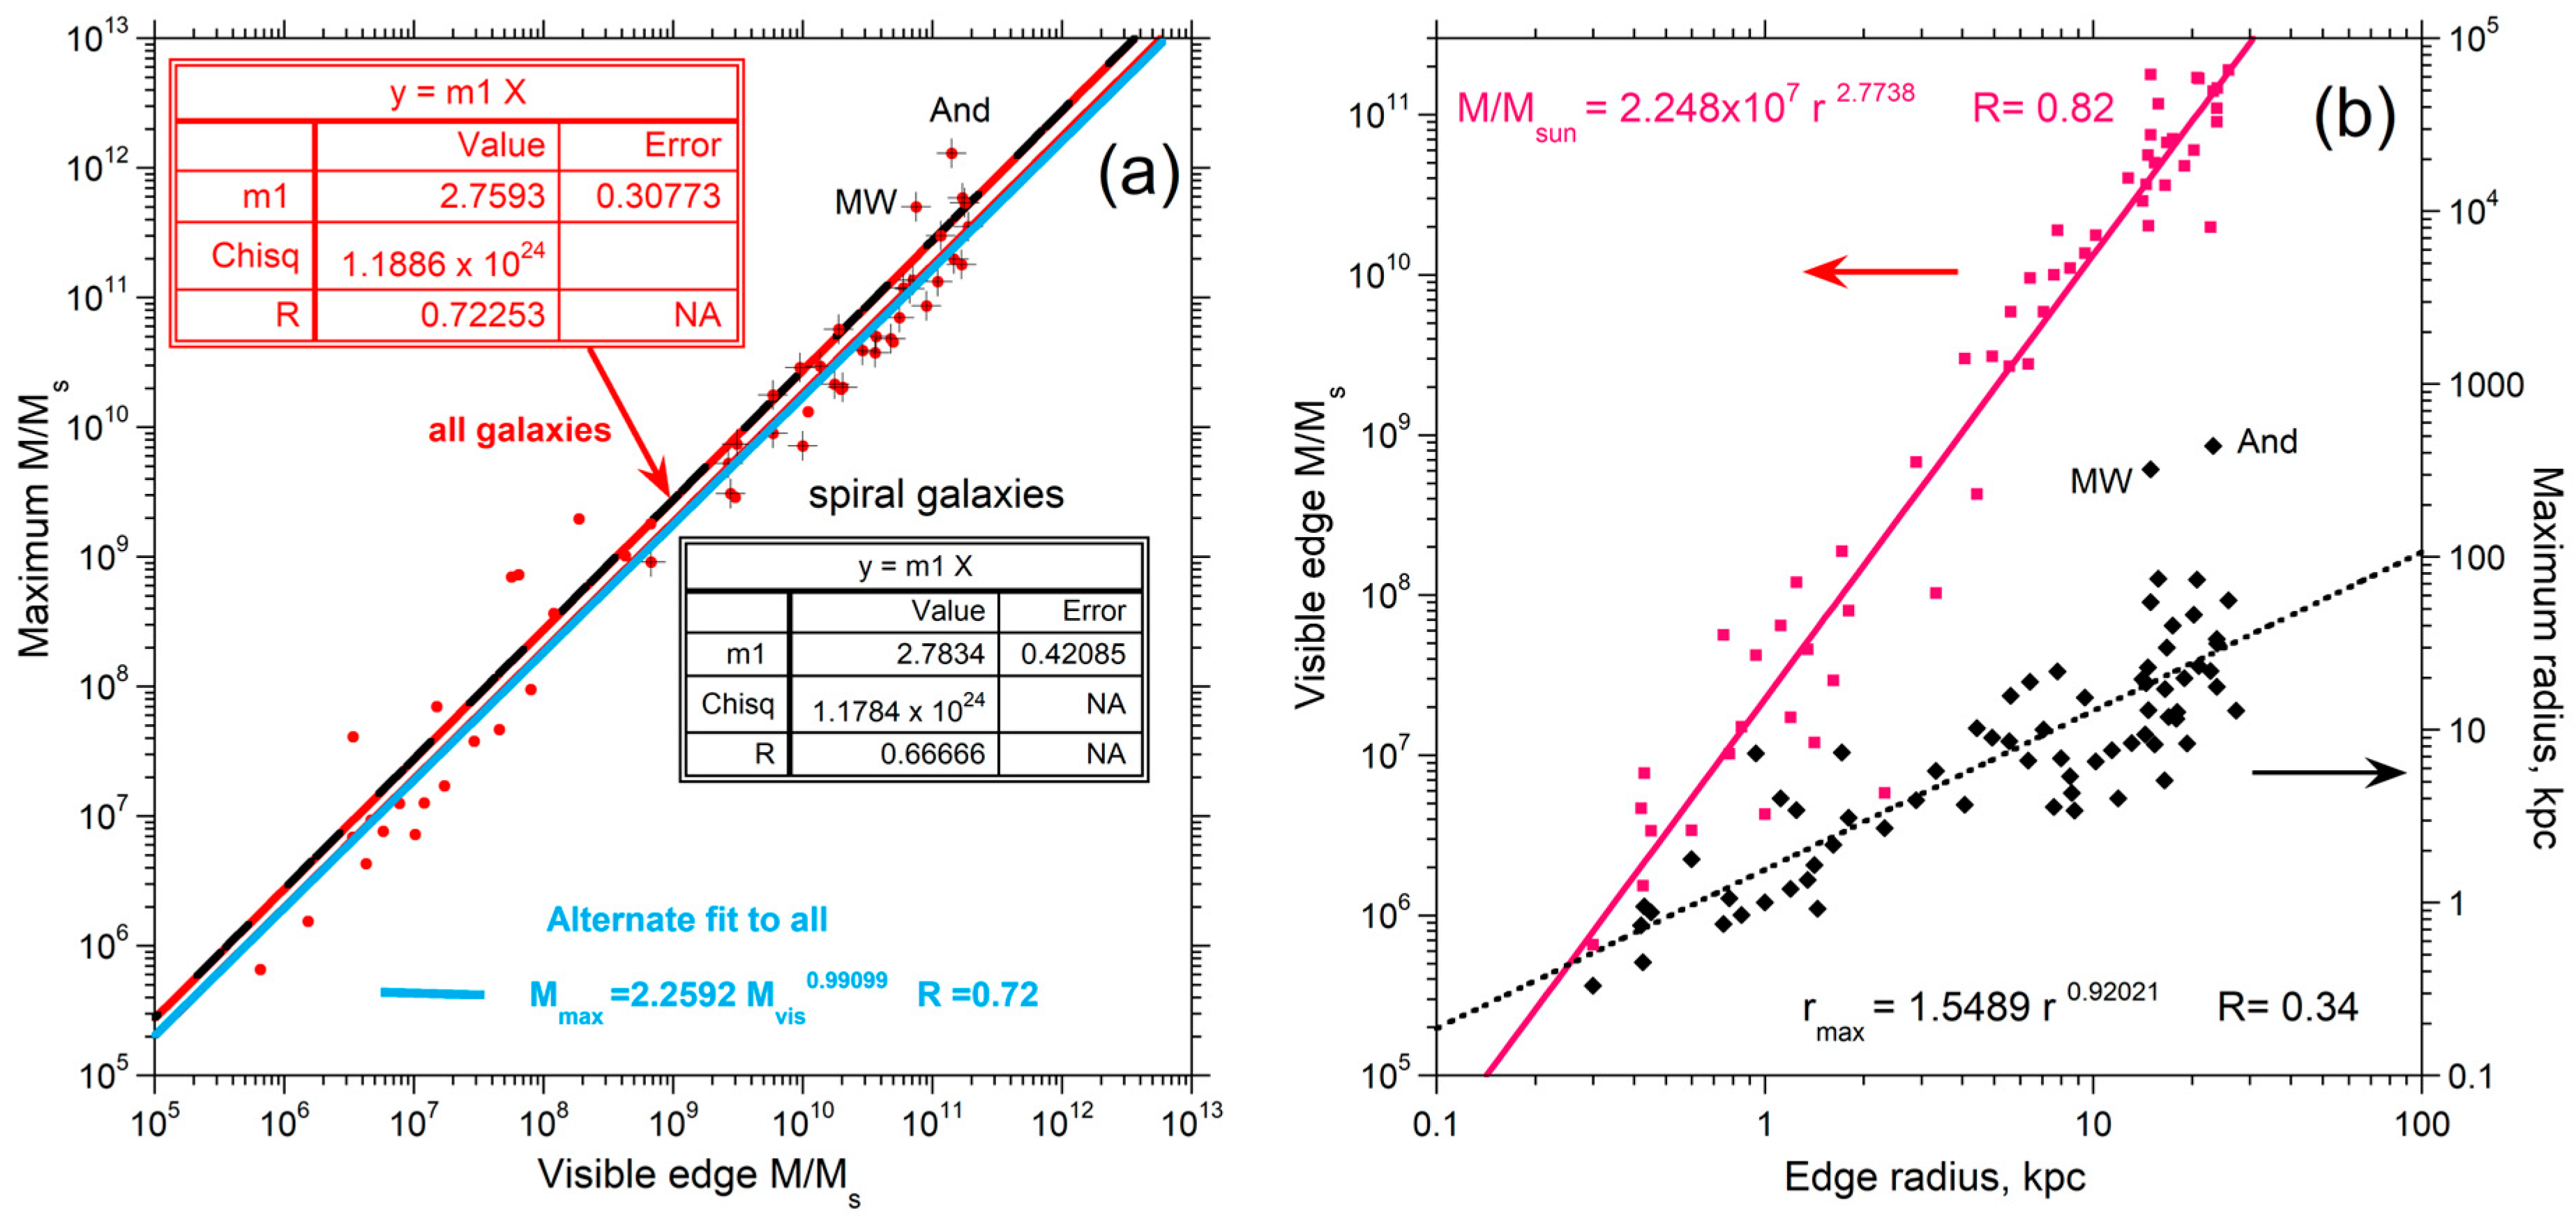
Mass calculated from Newtonian physics of oblate bodies depends on the radius accessed in RC acquisitions. Figure 5a shows that the maximum mass calculated at the largest radius probed is 2.66× the mass calculated at the radius connected with luminosity measurements. RC measurements sample relatively dense regions to obtain reasonable signal-to-noise ratios and rarely probe the distal atmospheres shown in Figure 1.
An important exception to the trend in Figure 5a is Andromeda (And), which contains a greater mass contribution at large distances than any other galaxy explored. Its large maximum mass results because RC data could be collected at an atypically great distance (500 kpc) for this proximal galaxy (cf. Figure 3 and Figure 5b). Data on the Milky Way (MW) likewise extend to great distances; however, because of our inside view, the visible edge and luminosity cannot be directly determined. Section 2.2.2 determines these parameters for the MW from the trends for spirals, which are then added to Figure 5.
More scatter is seen in the data on dwarfs than large spirals in Figure 5 due to uncertainties in the measurements. Typically, RC data for dwarfs have few points, and velocity dispersions rather than rotation curves are commonly measured. Uncertainty also exists in the aspect ratio of these roundish objects. Nonetheless, dwarf galaxies occupy the same trends as the largest spirals.
Figure 5b shows that total mass within the visible edge goes as edge radius to the power of 2.77. This consistent trend describes object masses covering six orders of magnitude, proving that the same processes affect the interiors of all objects, from tiny dwarf spheroid satellites to immense spiral galaxies. Within uncertainty, the power of 2.77 compares well with the cubic power expected for scaling. Figure 5b also shows that RC studies usual probe a radius ~1.5× the visual edge, which is consistent with the simple dependence of the maximum mass with the mass associated with the visual edge in Figure 5a.

2.2.2. Uncertainties from Comparison to Other Inverse Models and Shape Effects

The inverse models of Feng and Gallo [47,48,49] and Sipols and Pavlovich [45,46], which respectively explore the thin disc and the equatorial plane, bracket mass extracted considering an oblate shape [38]. This is expected, because the cross-section of the disc is a rectangle, which has extra mass in the corners compared to the cross section of an oblate with the same radius or the cross sections of observed shapes (Figure 1), whereas the plane describes the mass from the detectable surface of the galaxy. For NGC 1808, the disc model of Feng [49] gave 2.25 times the oblate mass determination, whereas, for NGC 1808, the equatorial plane model of Sipols and Pavlovich [45,46] gave 0.75 times the oblate mass determination, and demonstrated a strong correlation with surface brightness. The equatorial plane calculation is closer to the oblate results because the equatorial plane model represents the mathematically defined vertical collapse of all the stars which contribute light to the RC.
Based on these comparisons, shapes of galaxies, and the shape factor only varying from 1 to 1.57 (Section 2.1.1), our mass and density determinations for galaxies err by less than a factor of 25%. Importantly, Equation (3) provides the total mass inside the radius explored and offers considerable improvement over the estimated dynamical mass (e.g., [70]), which assumes the outside stars orbit about a spherically distributed mass.

2.2.3. Dependence of Density on Radius and Inclination

An accurate and complete inventory requires ascertaining density within CGM and IGM. Although only RC studies of Andromeda and, to a lesser extent, of the Milky Way probe very distant regions (i.e., IGM), our coherent trends permit extracting density in the rarefied surroundings of any large galaxy.
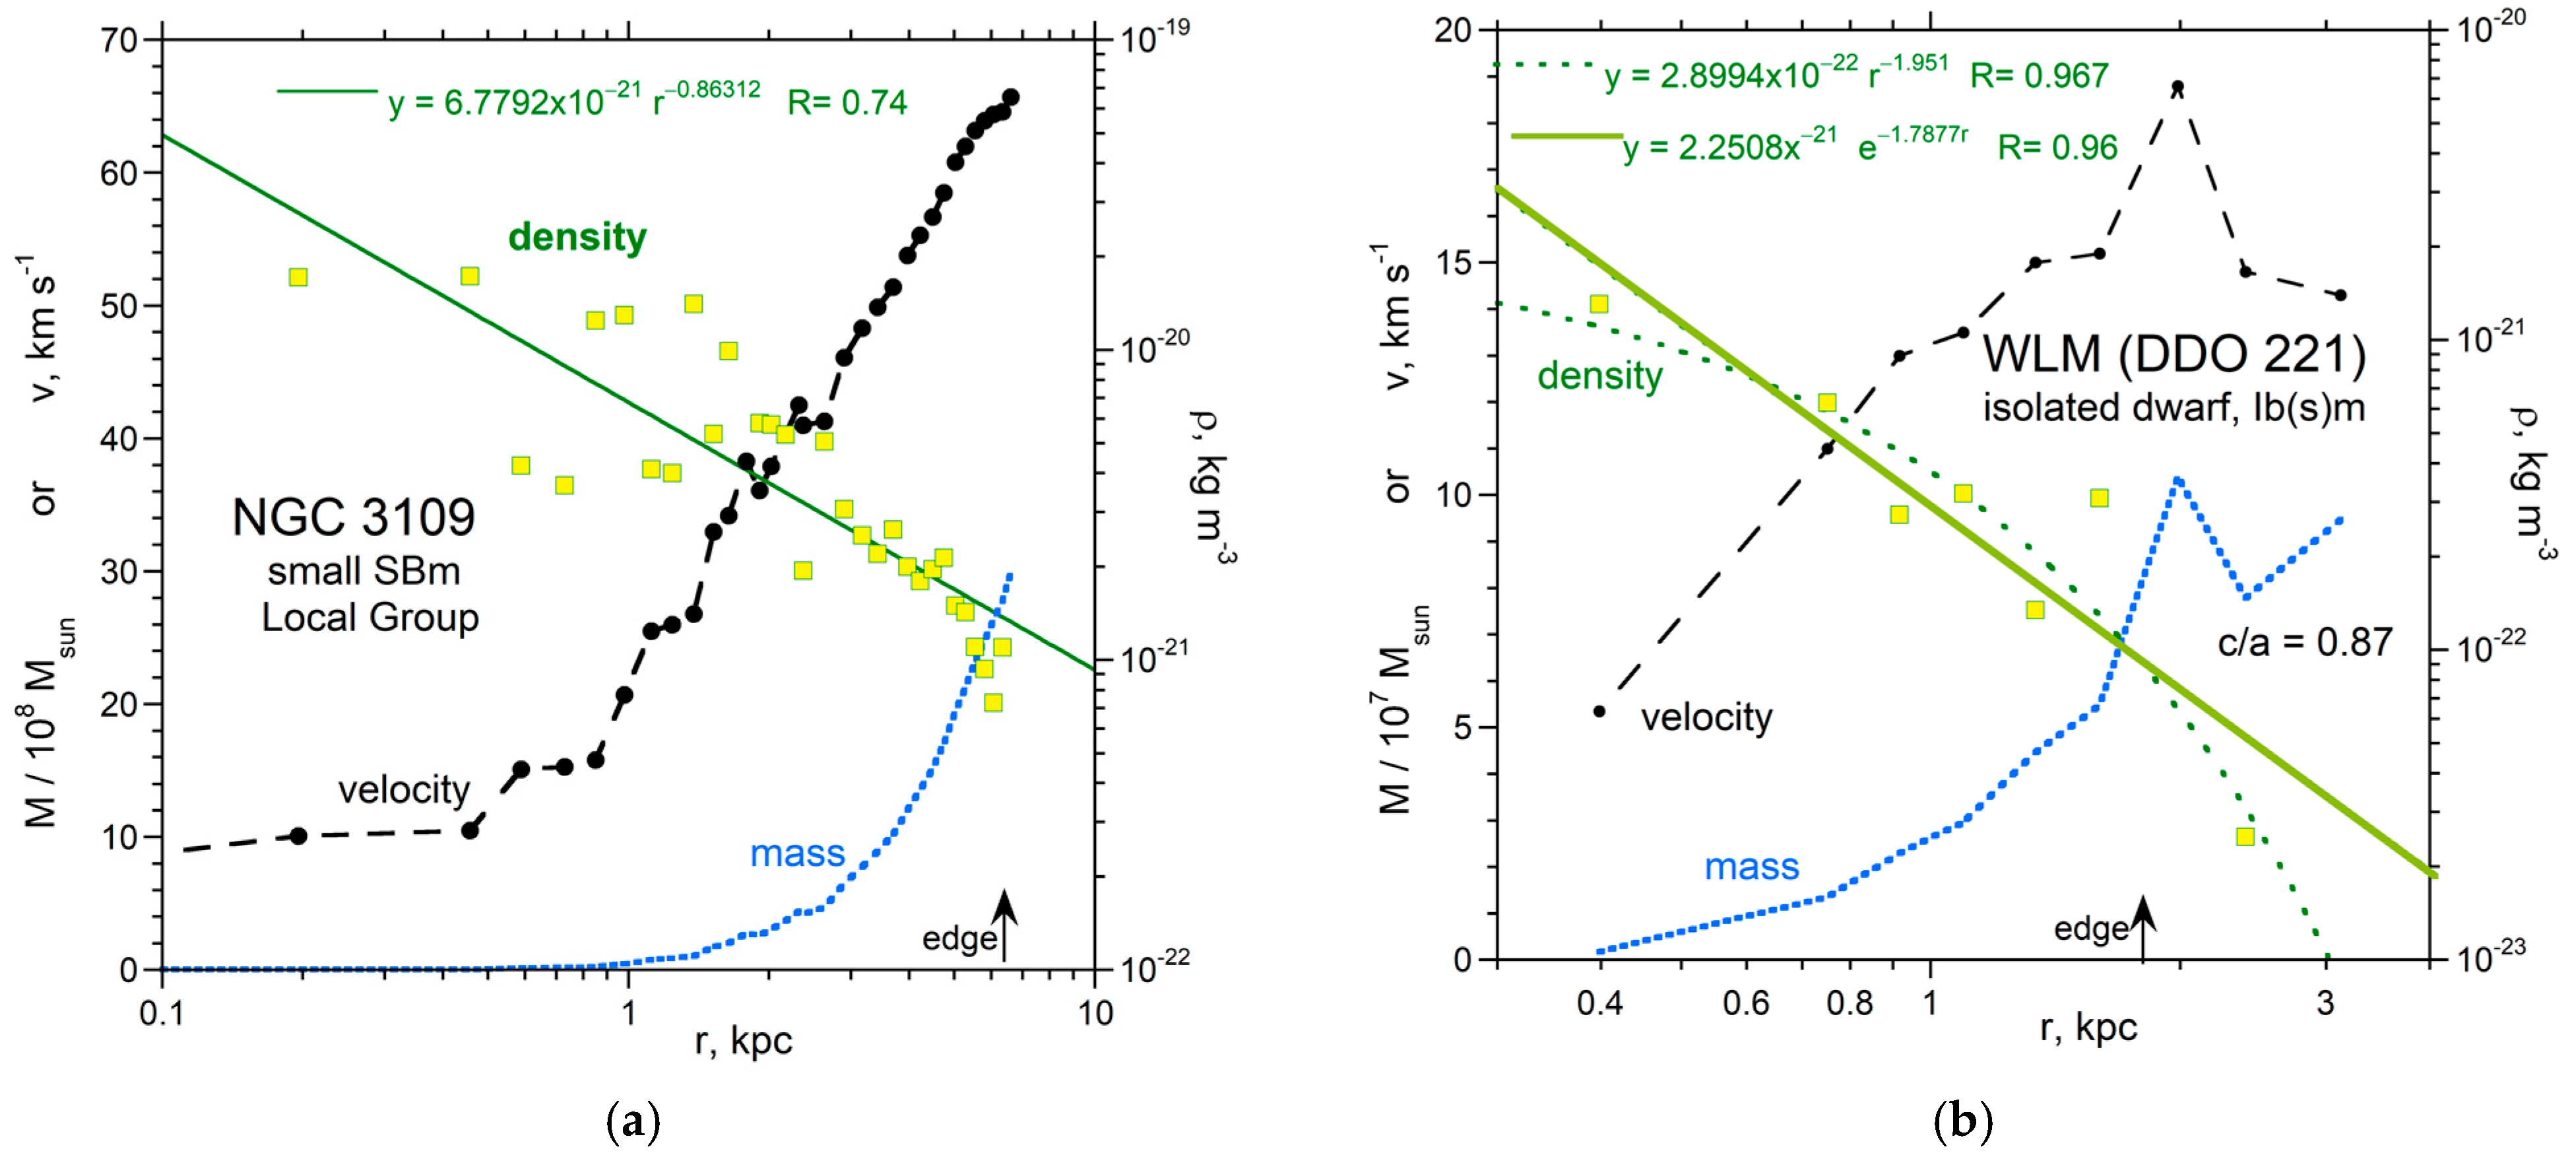
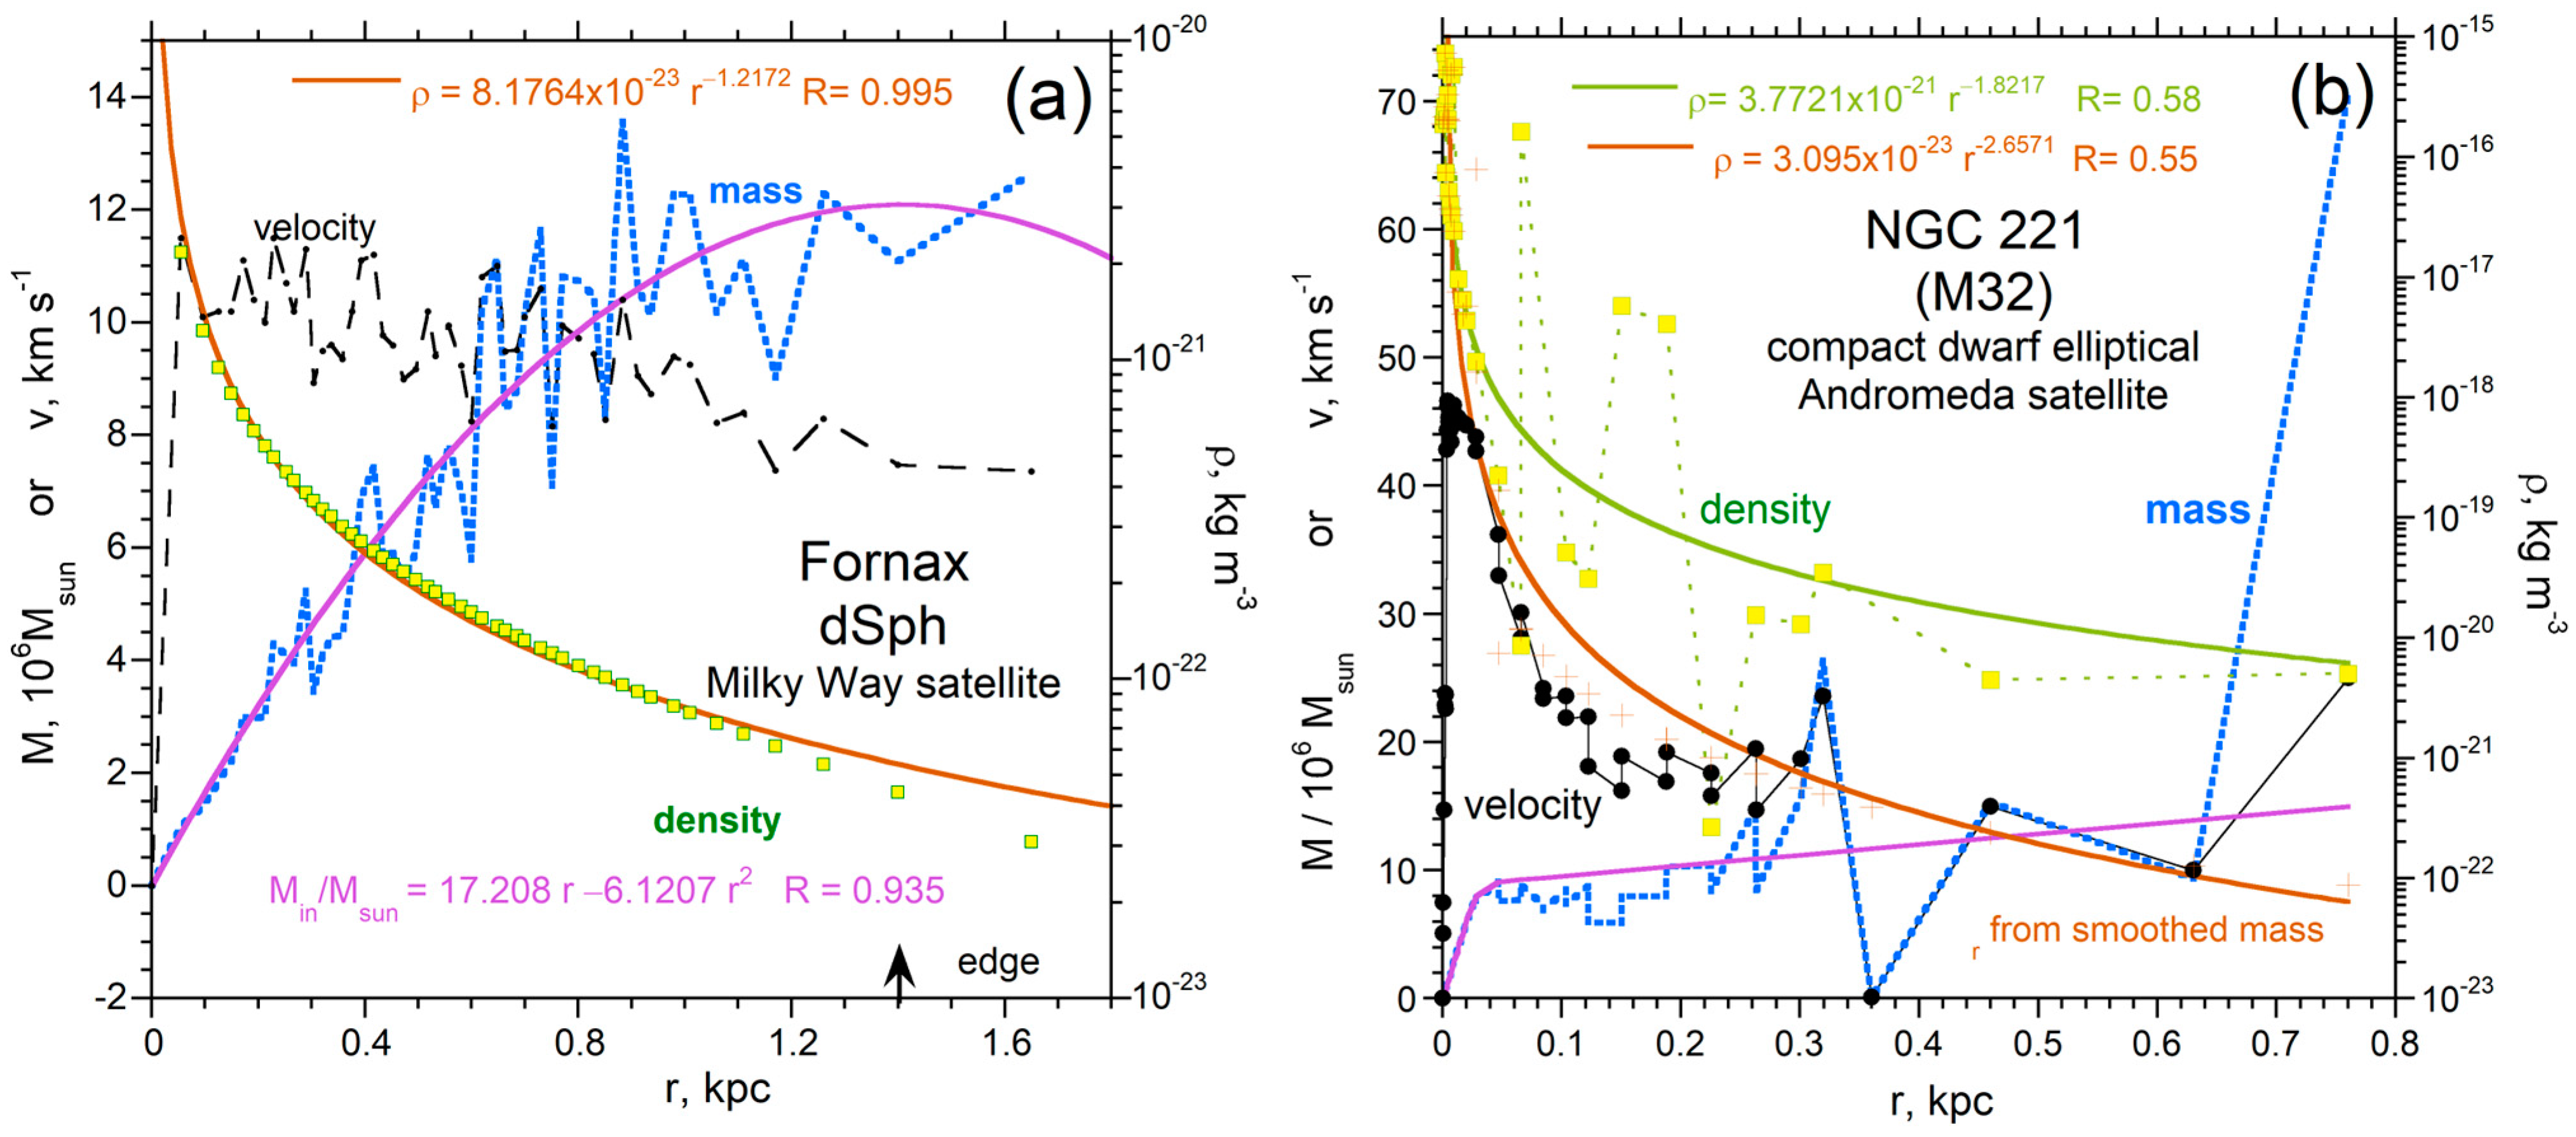
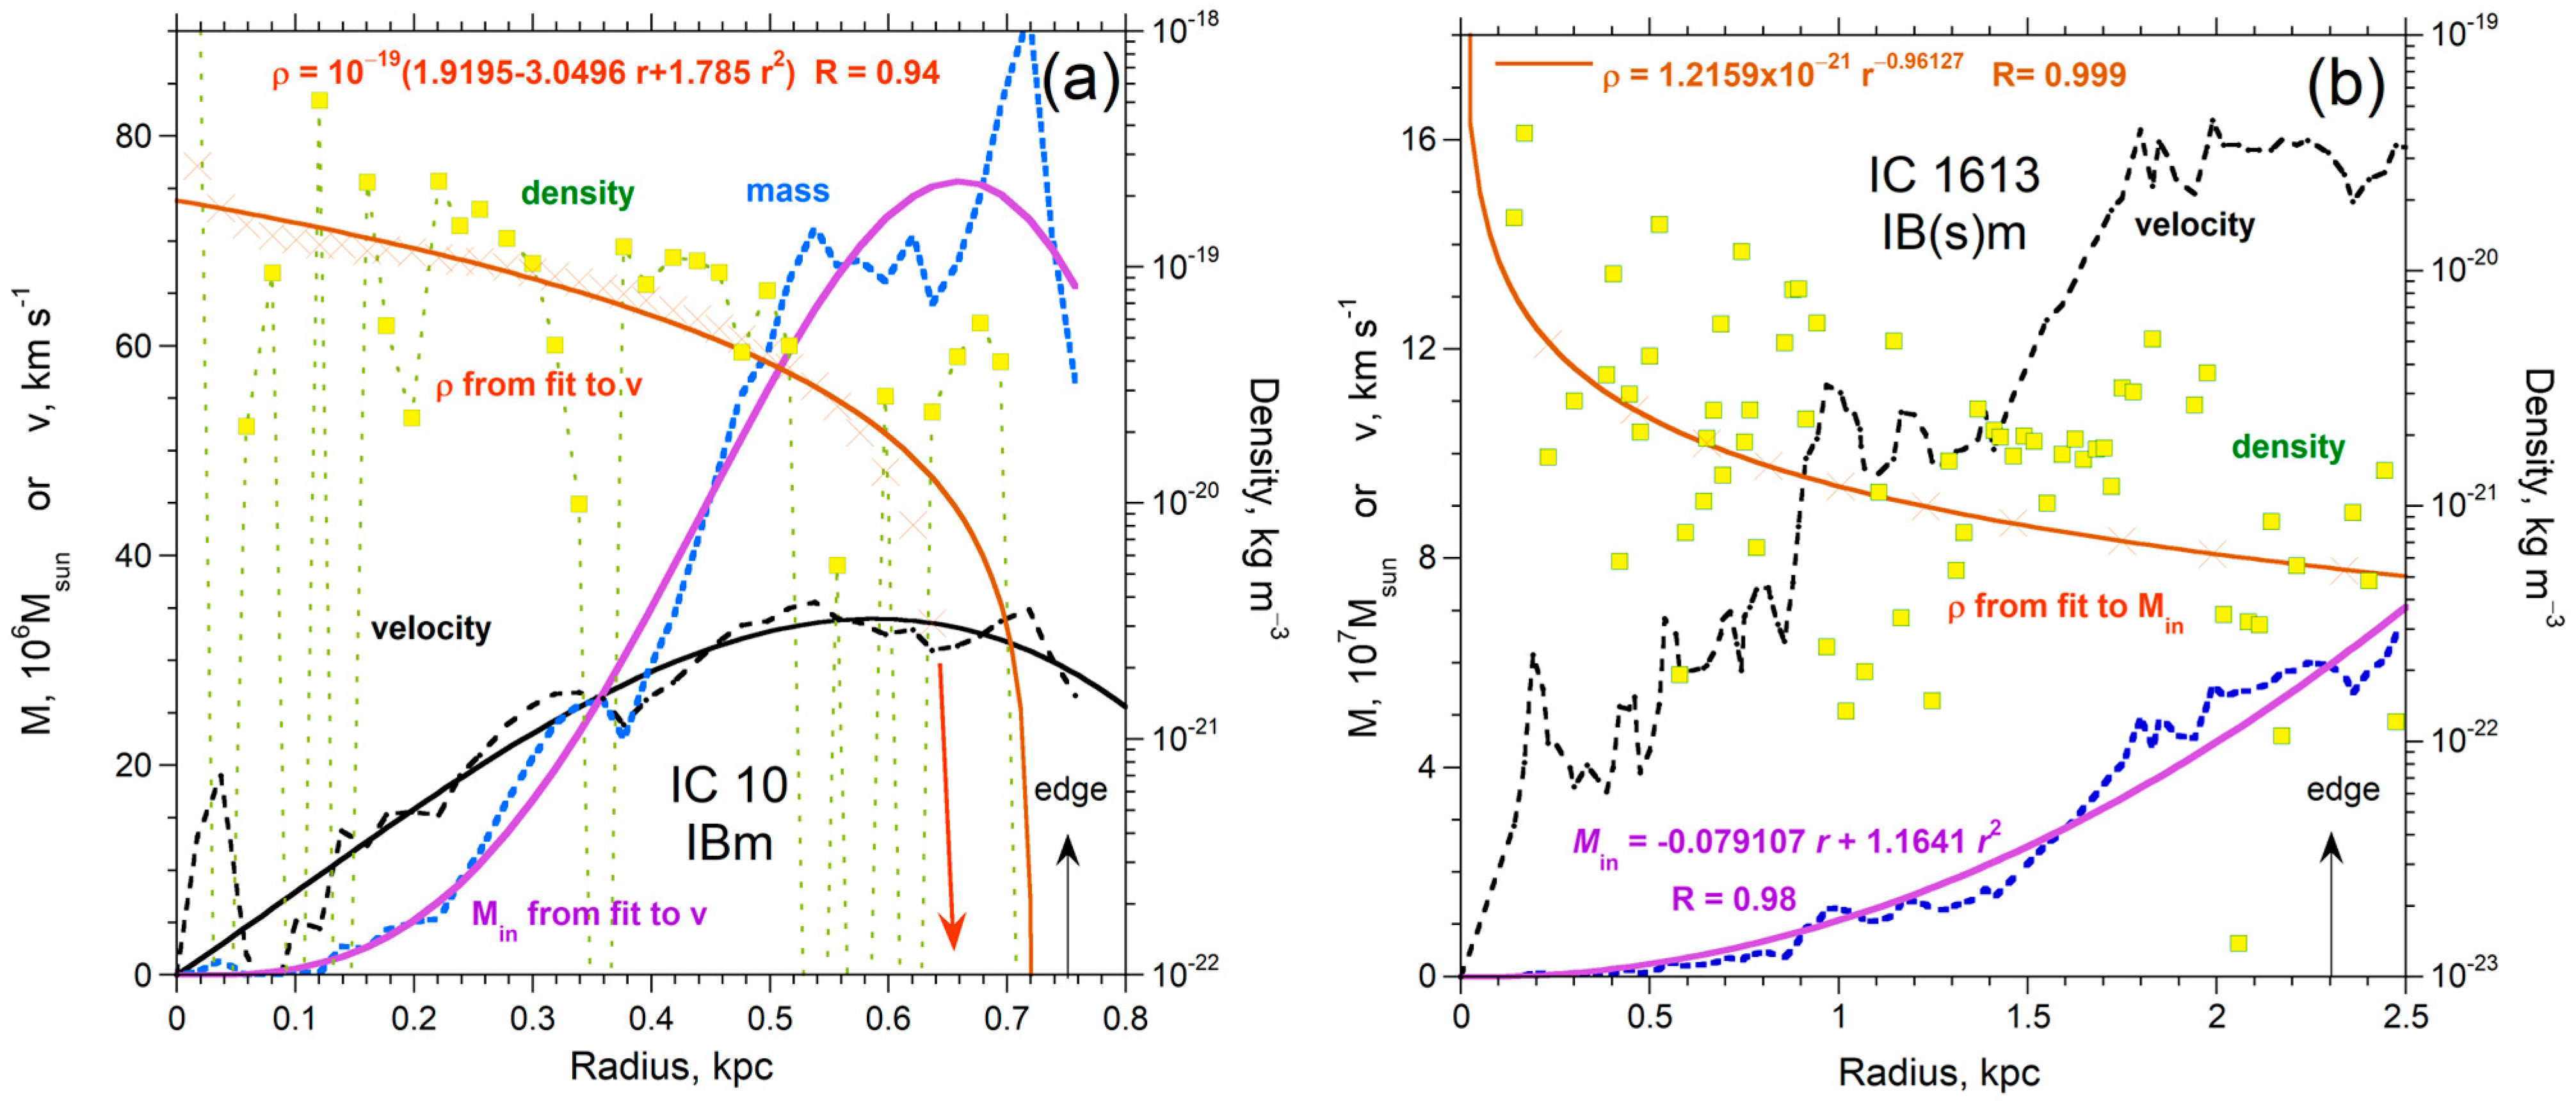
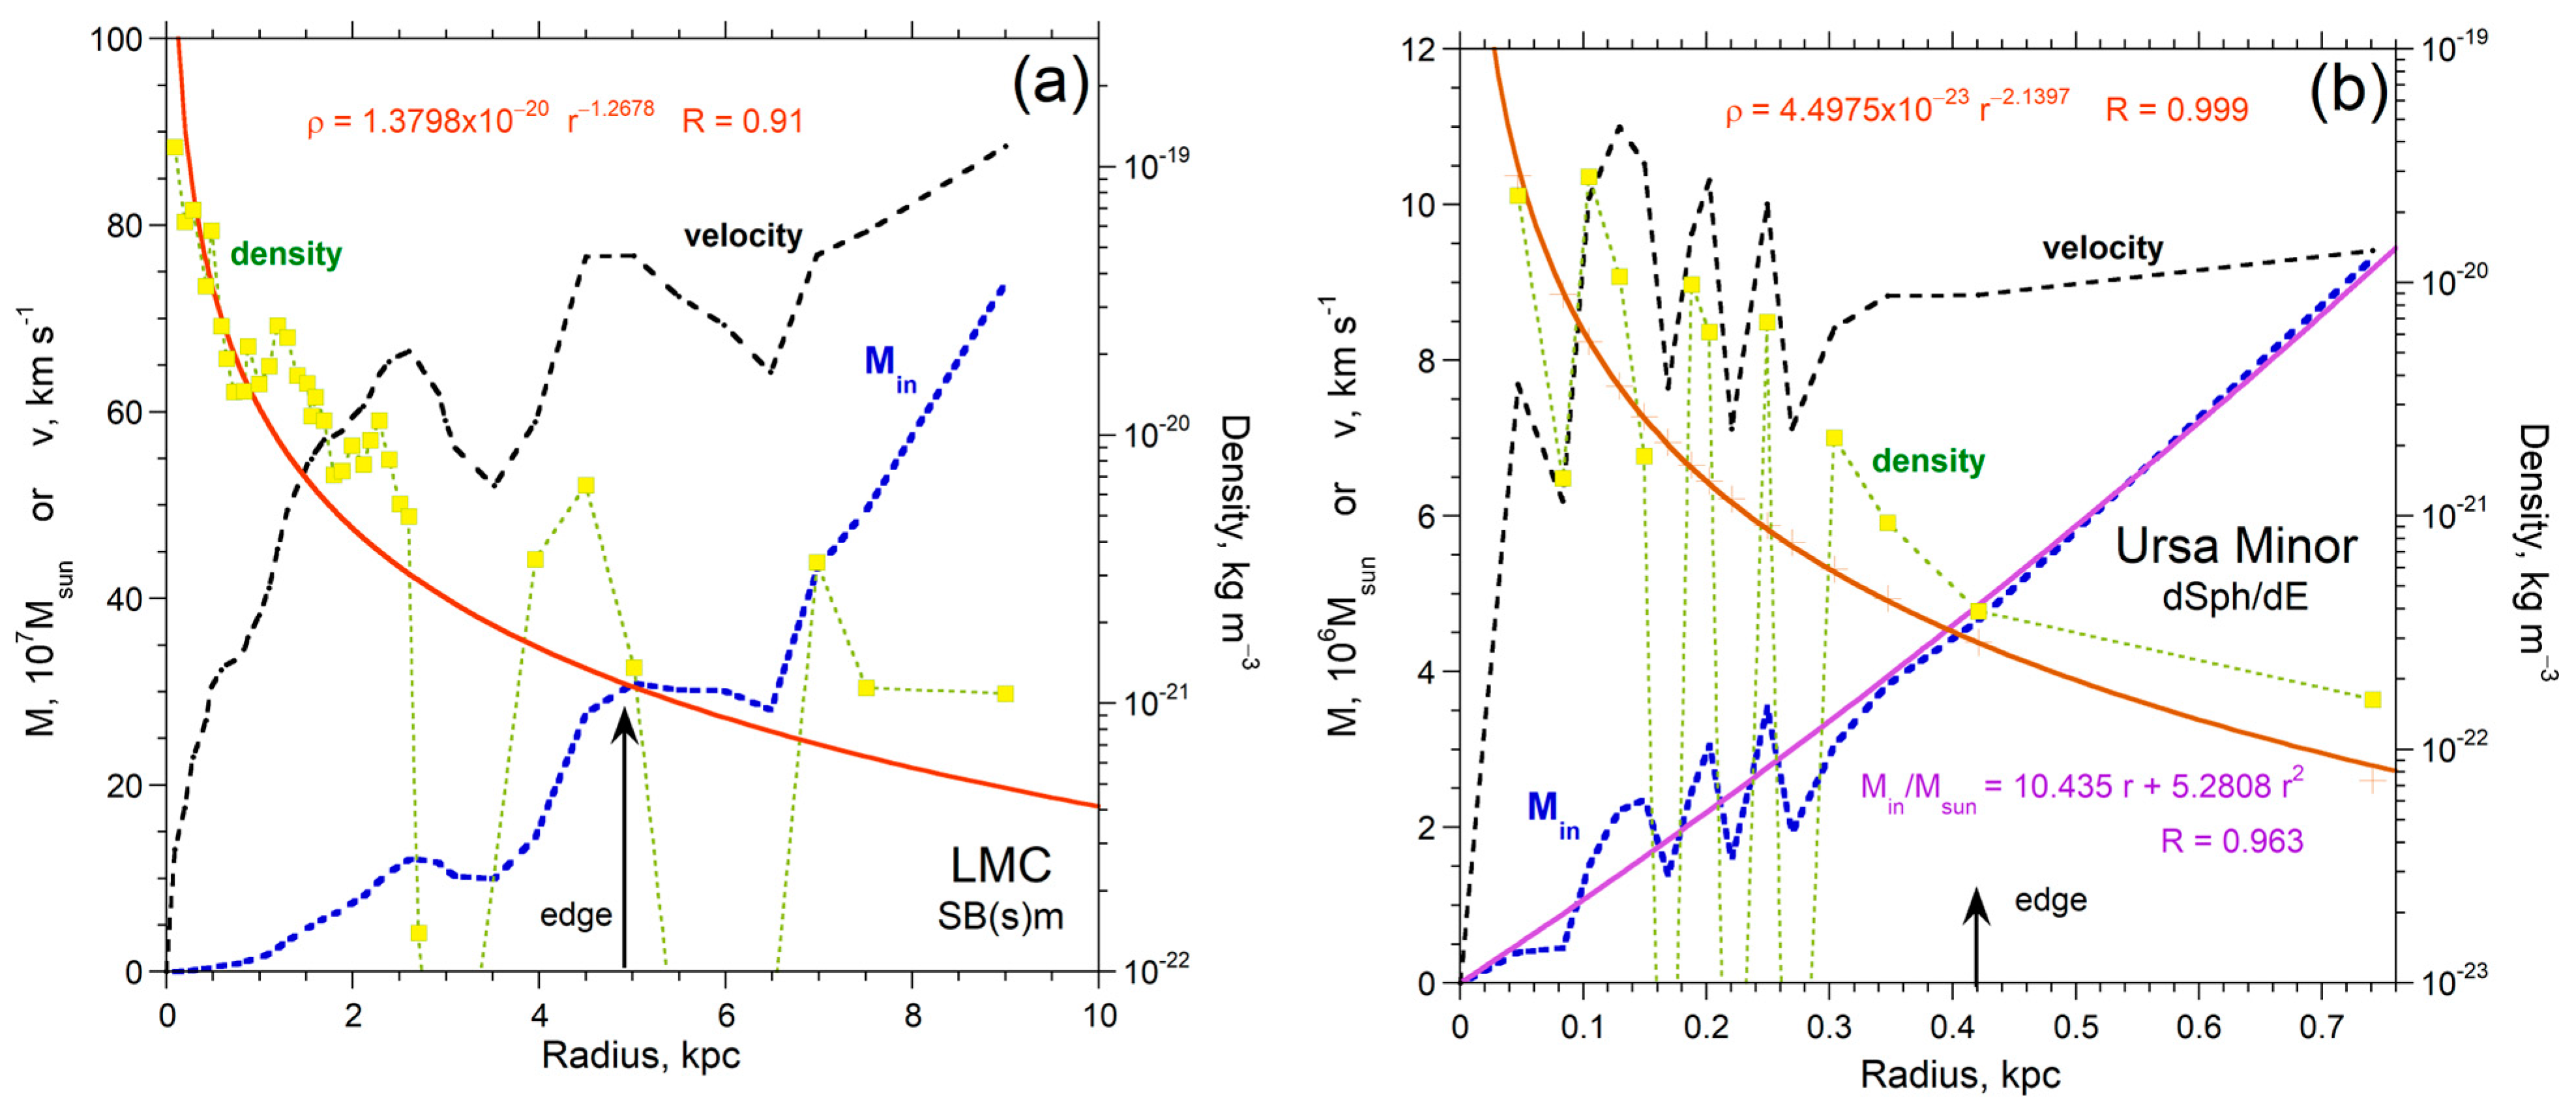
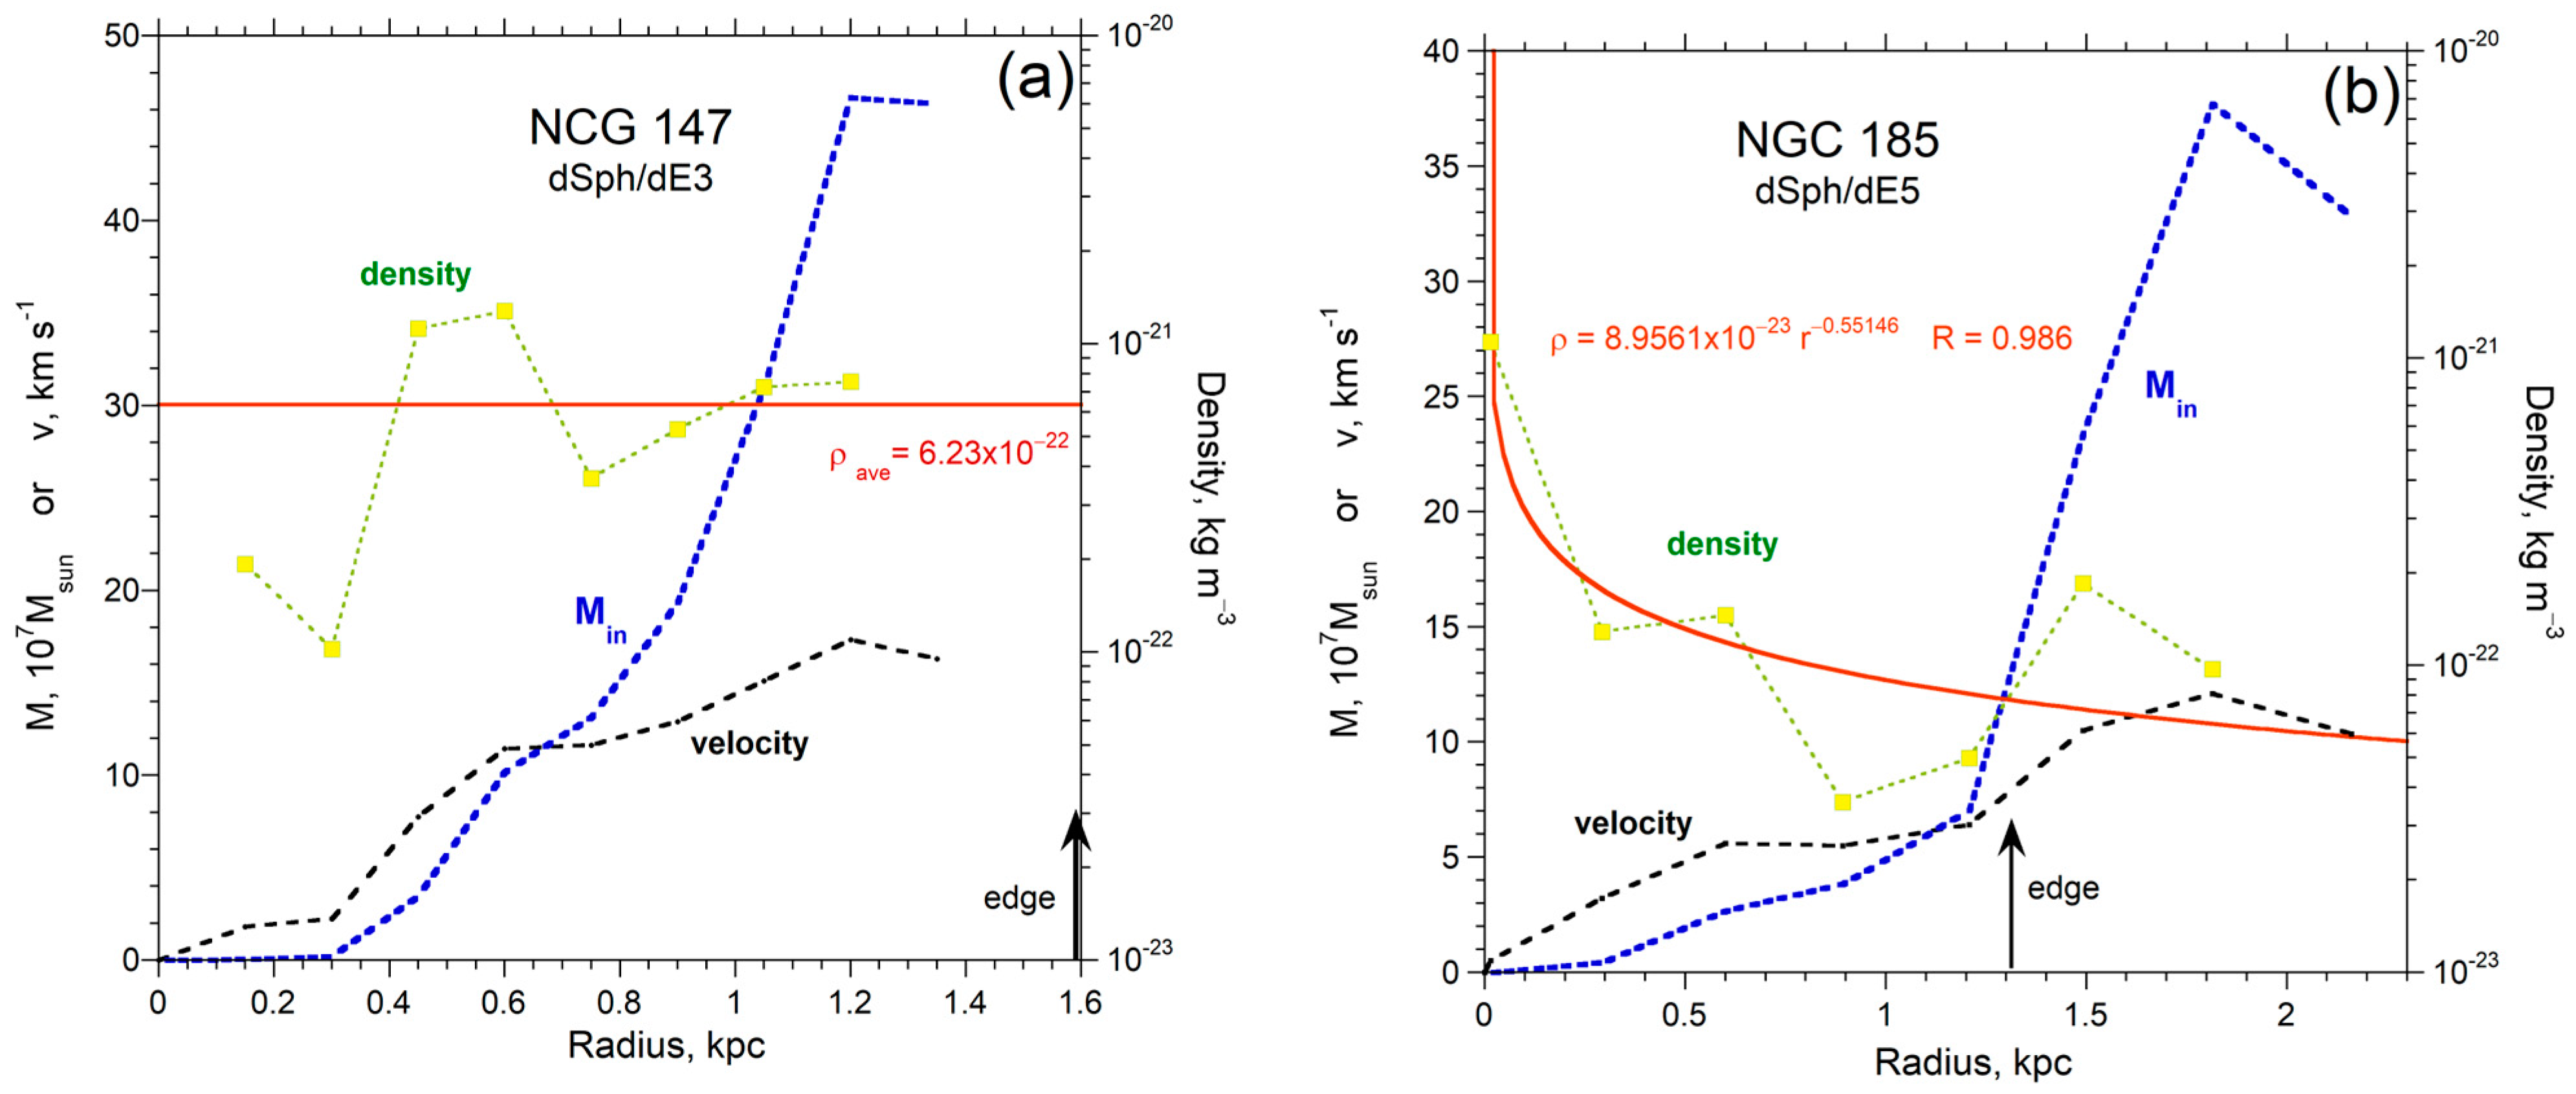
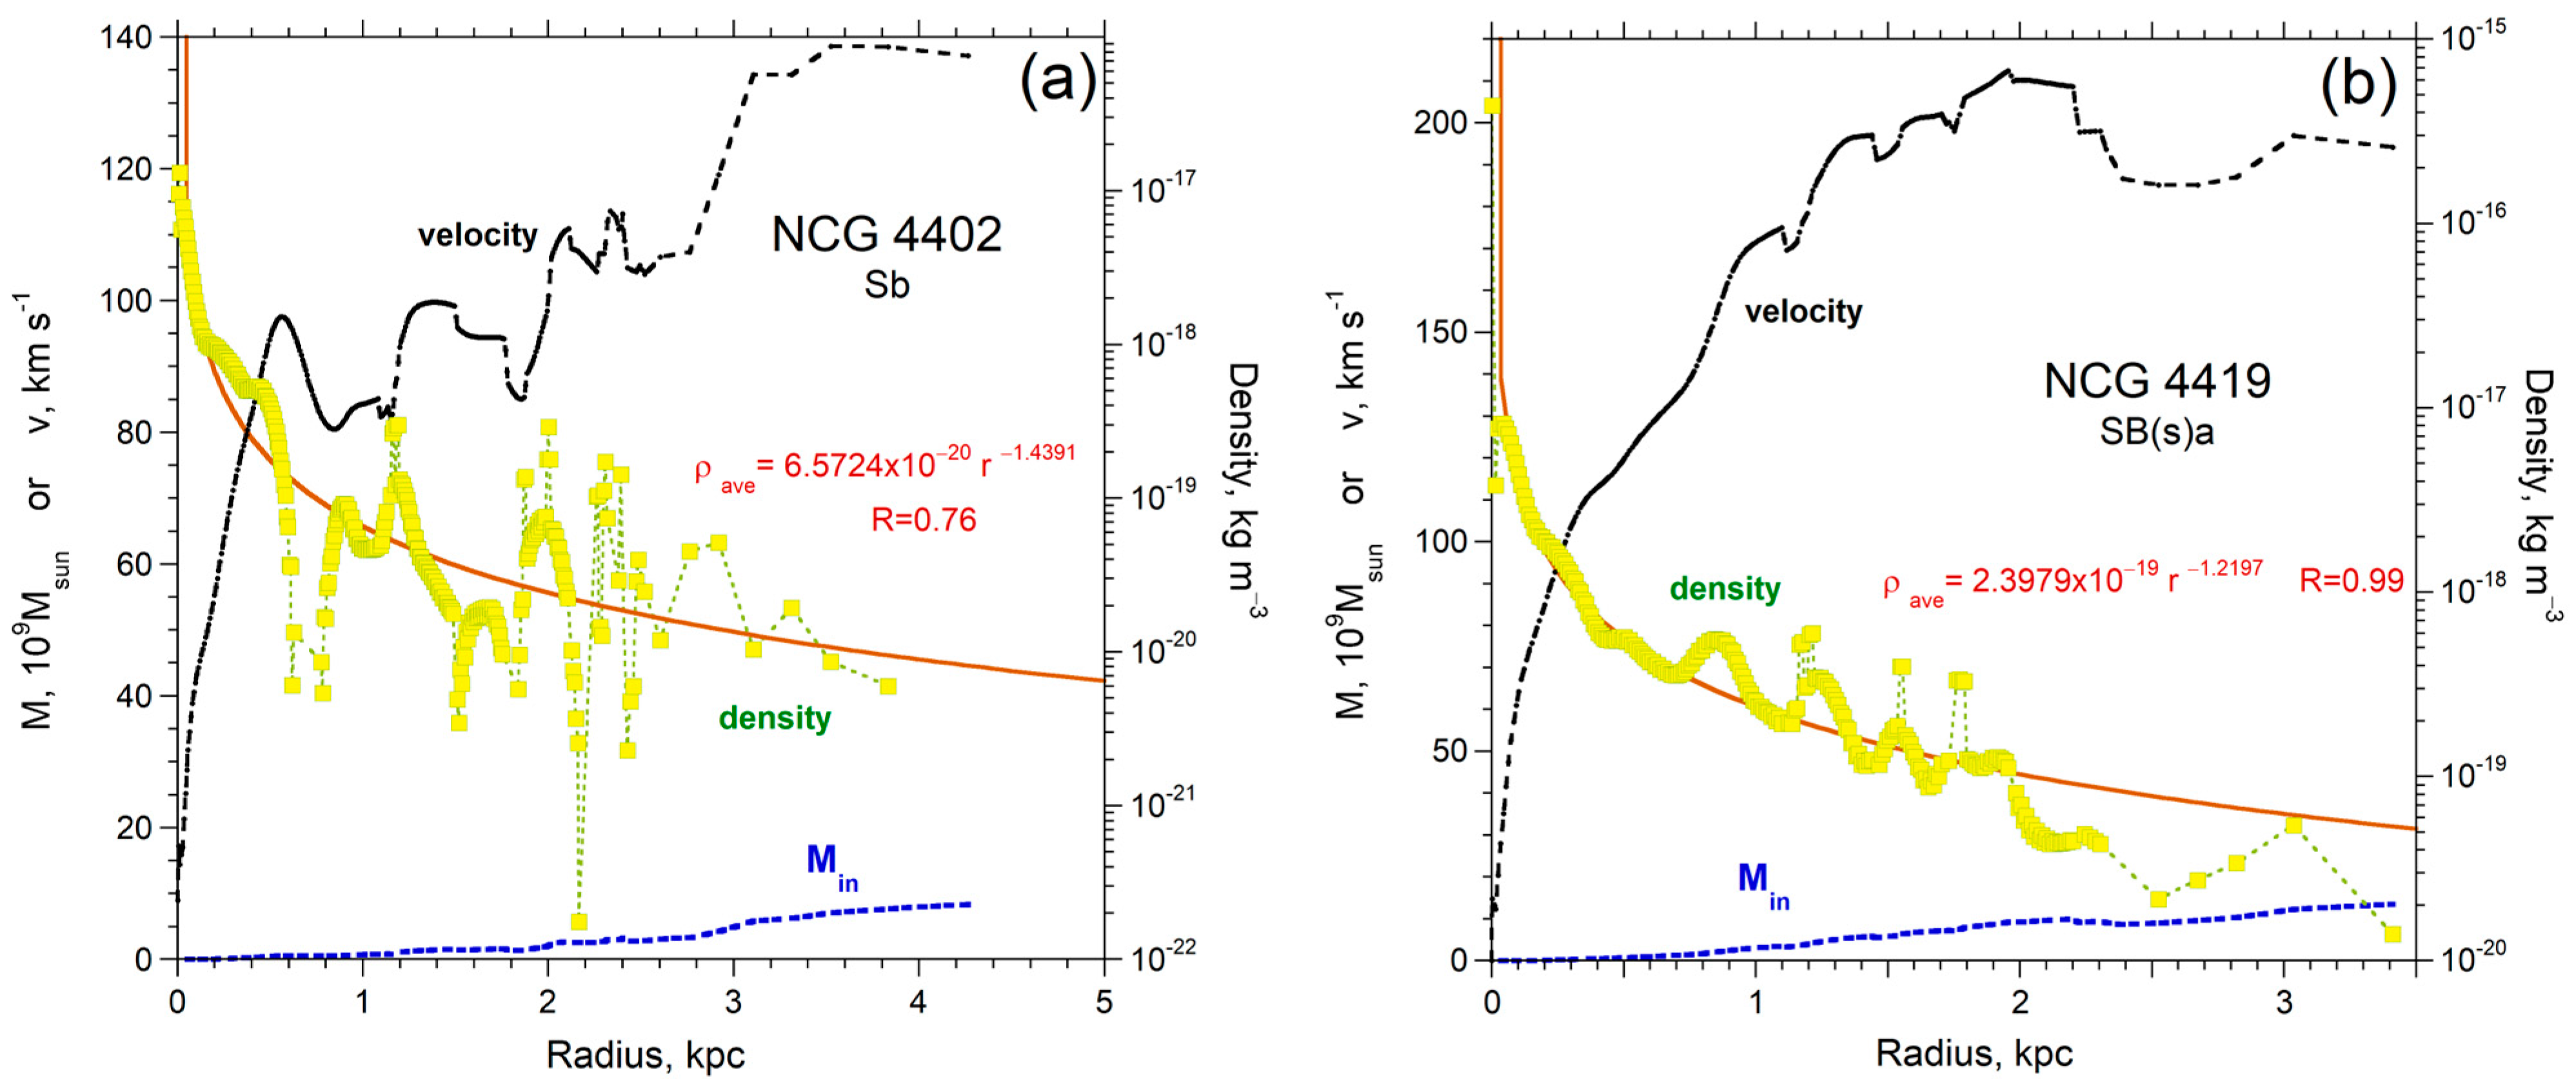
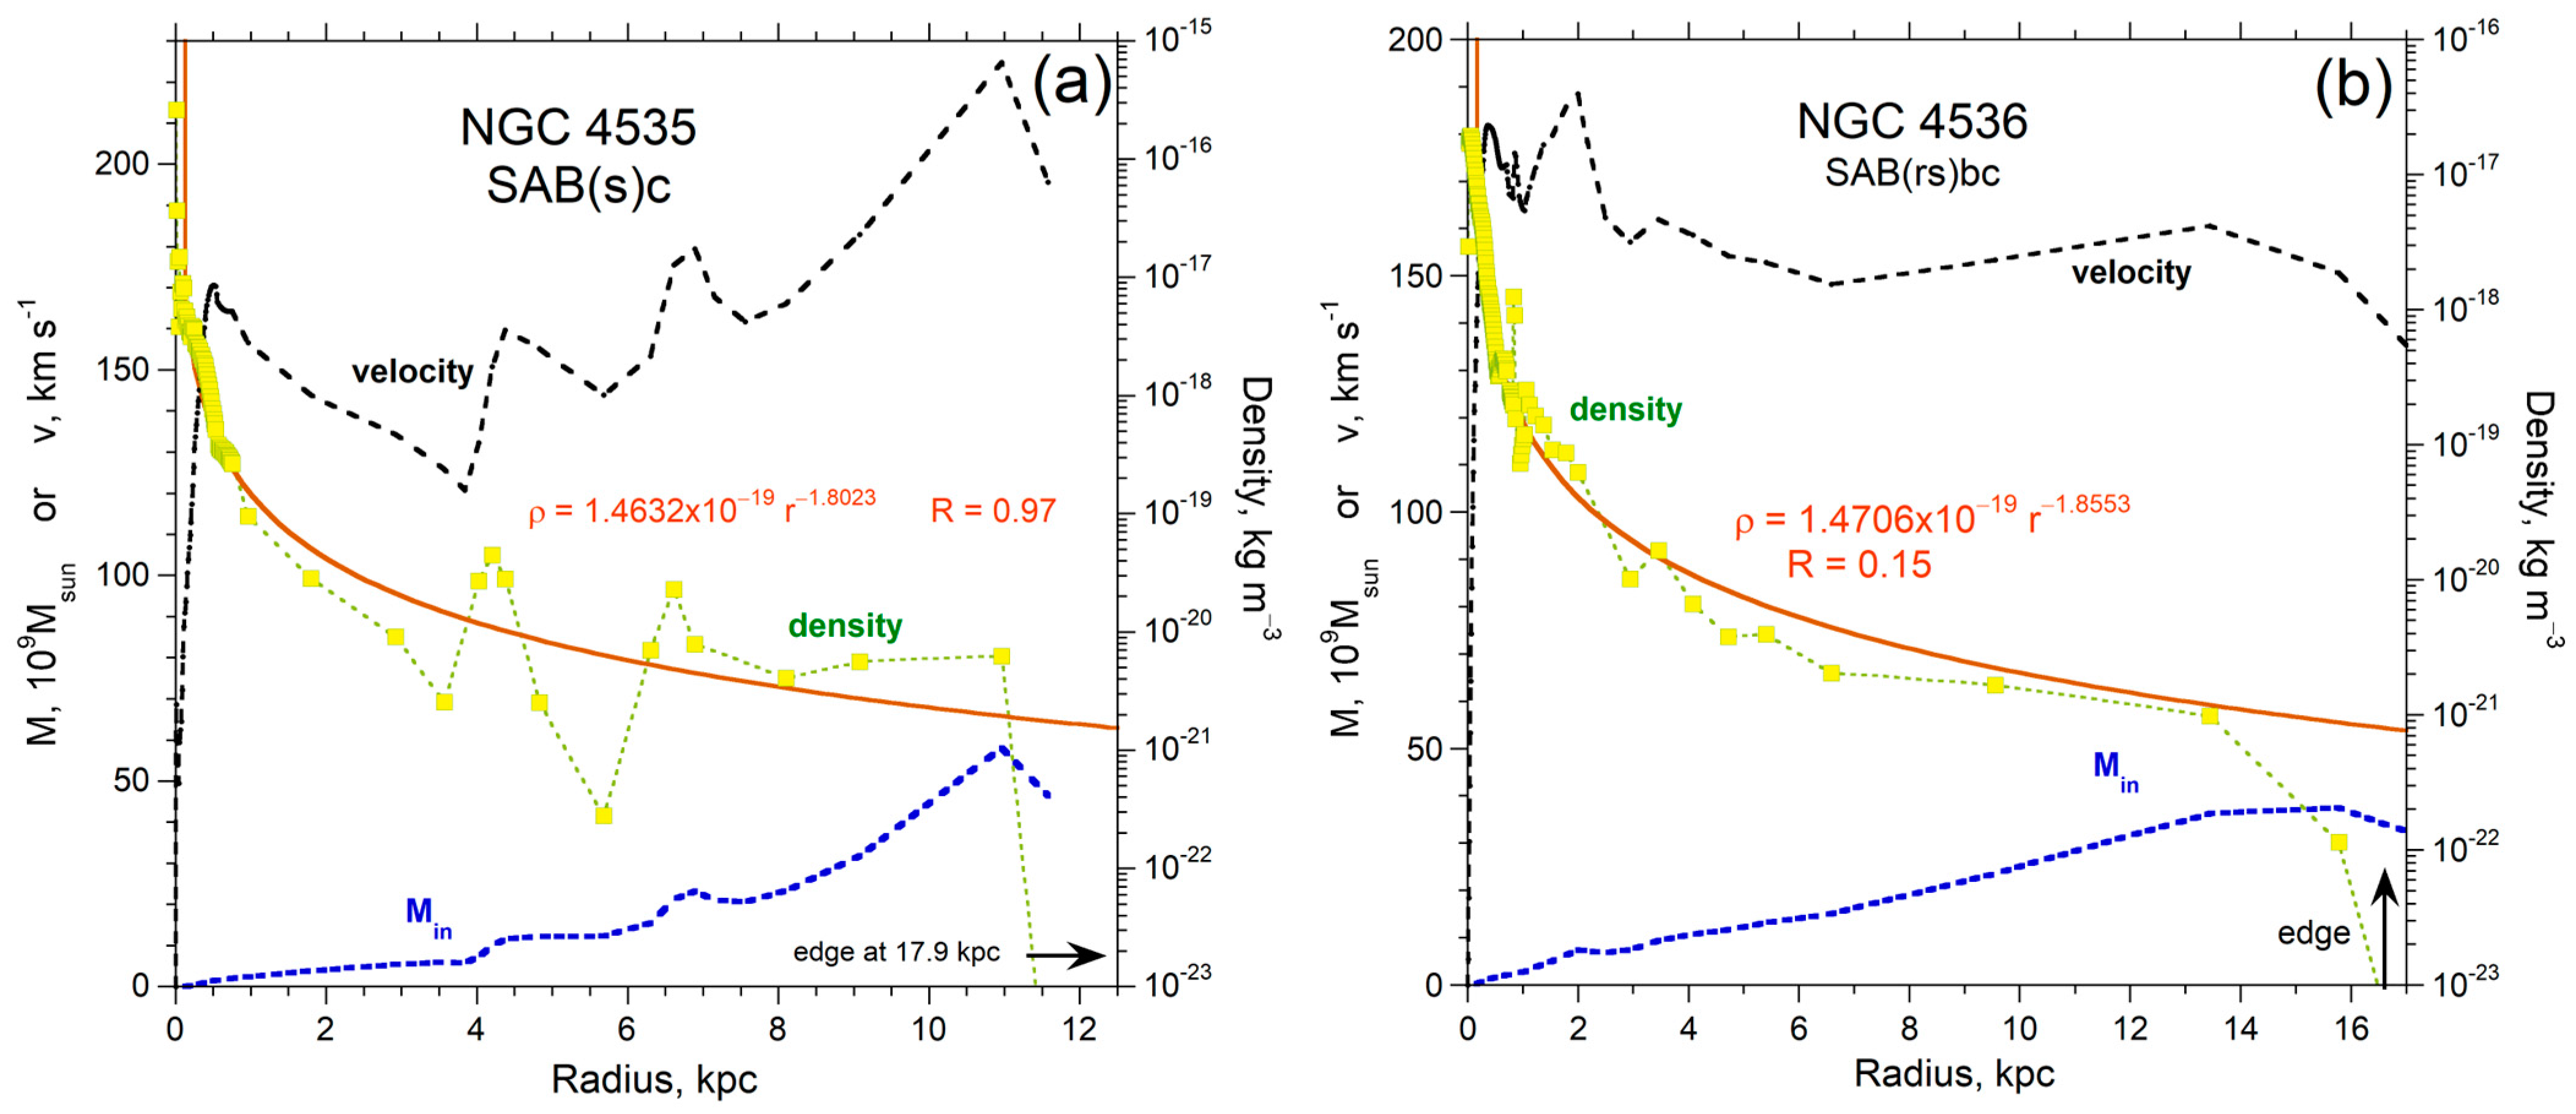
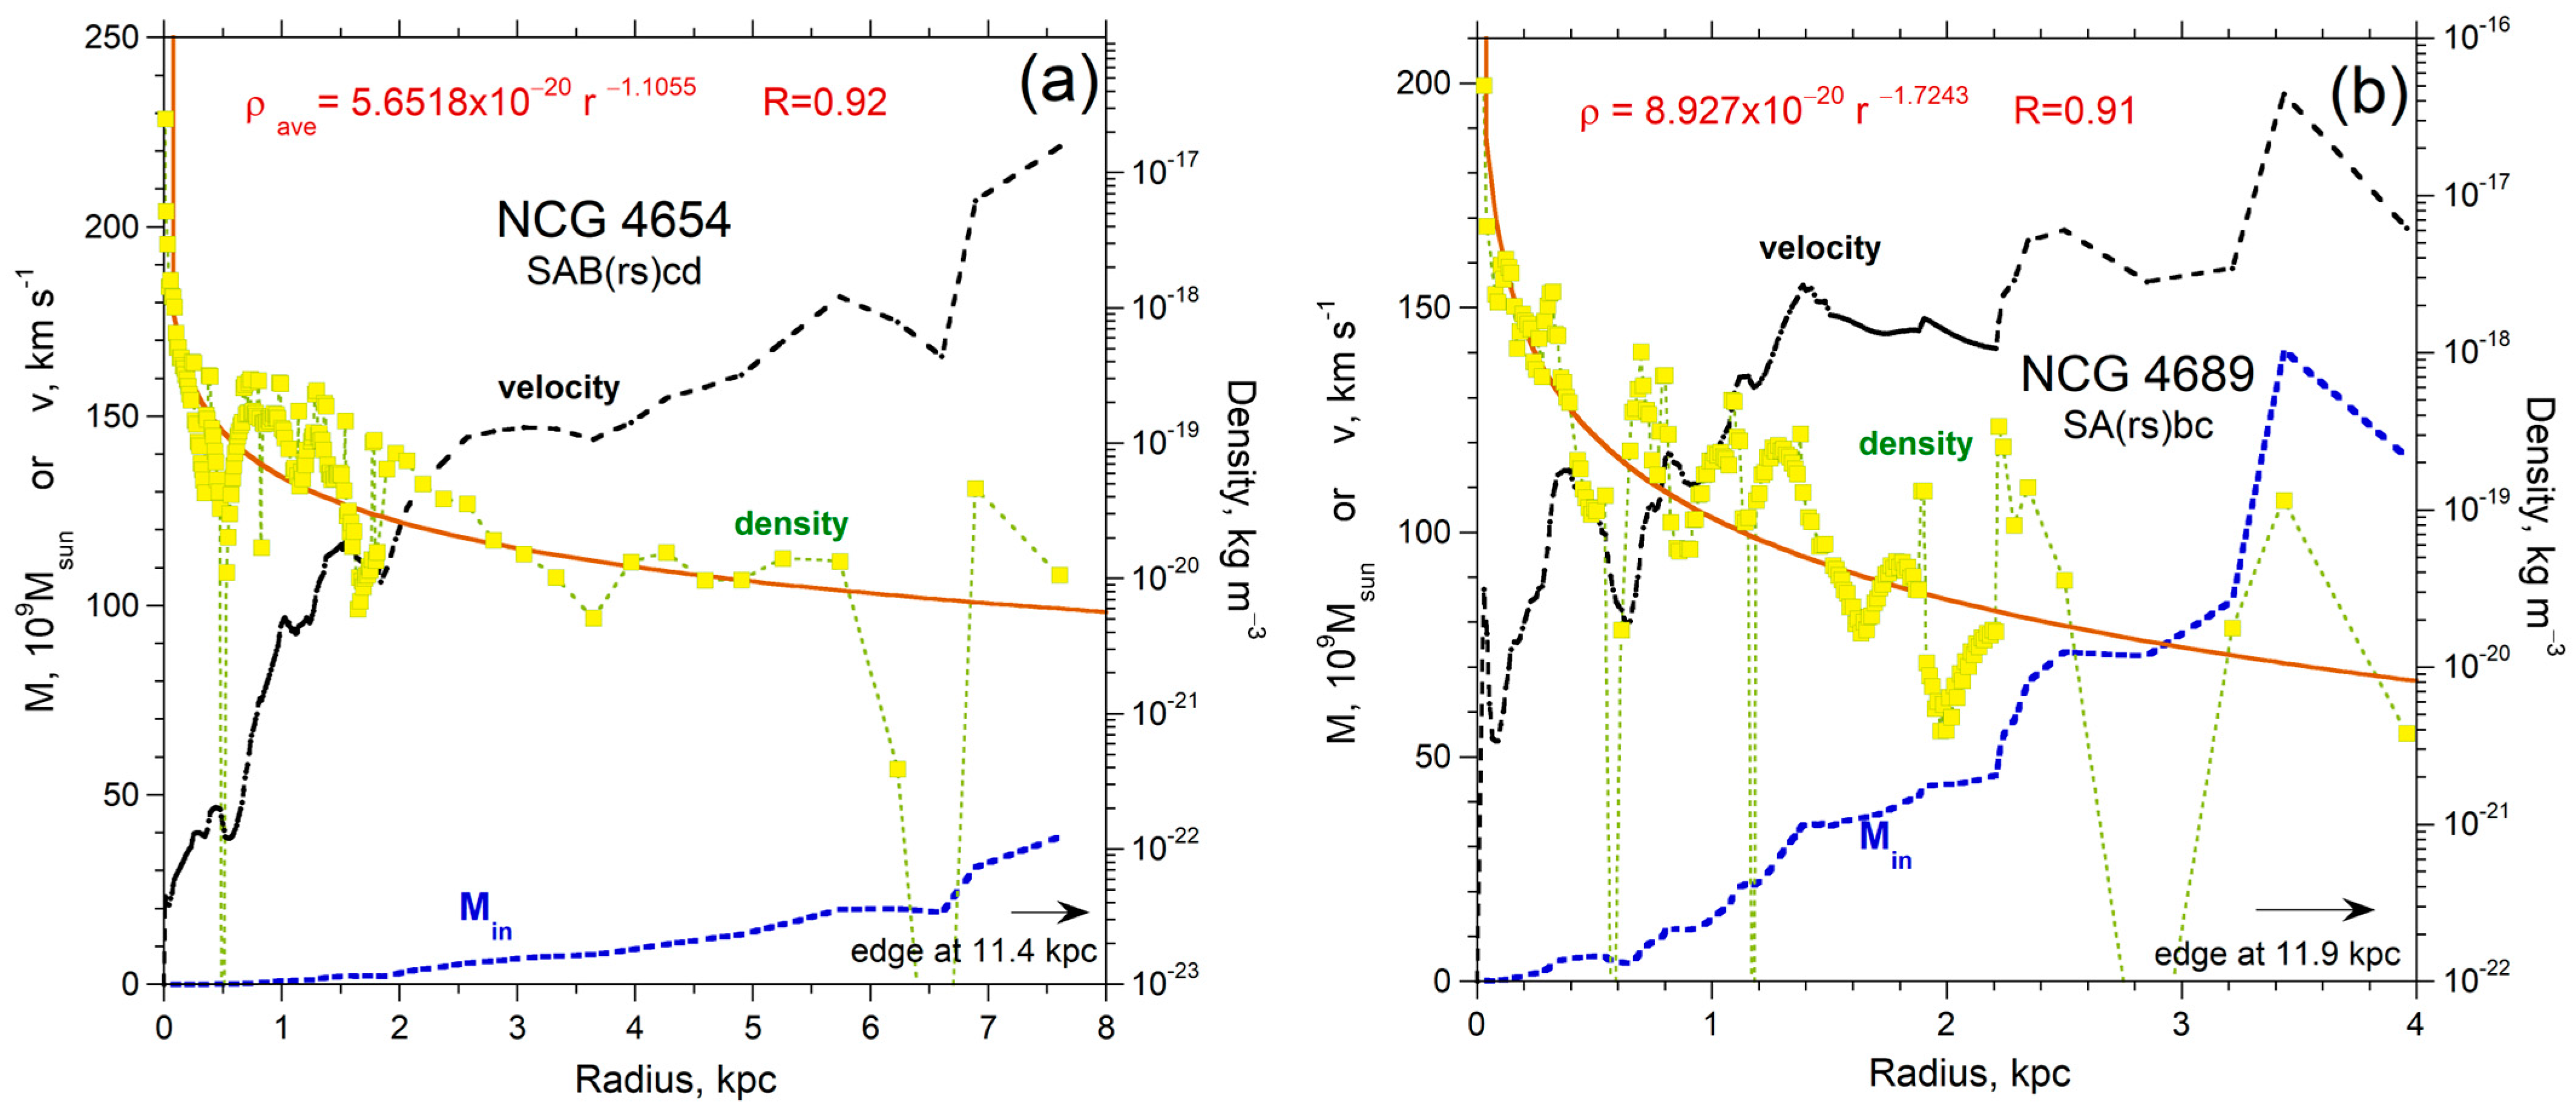
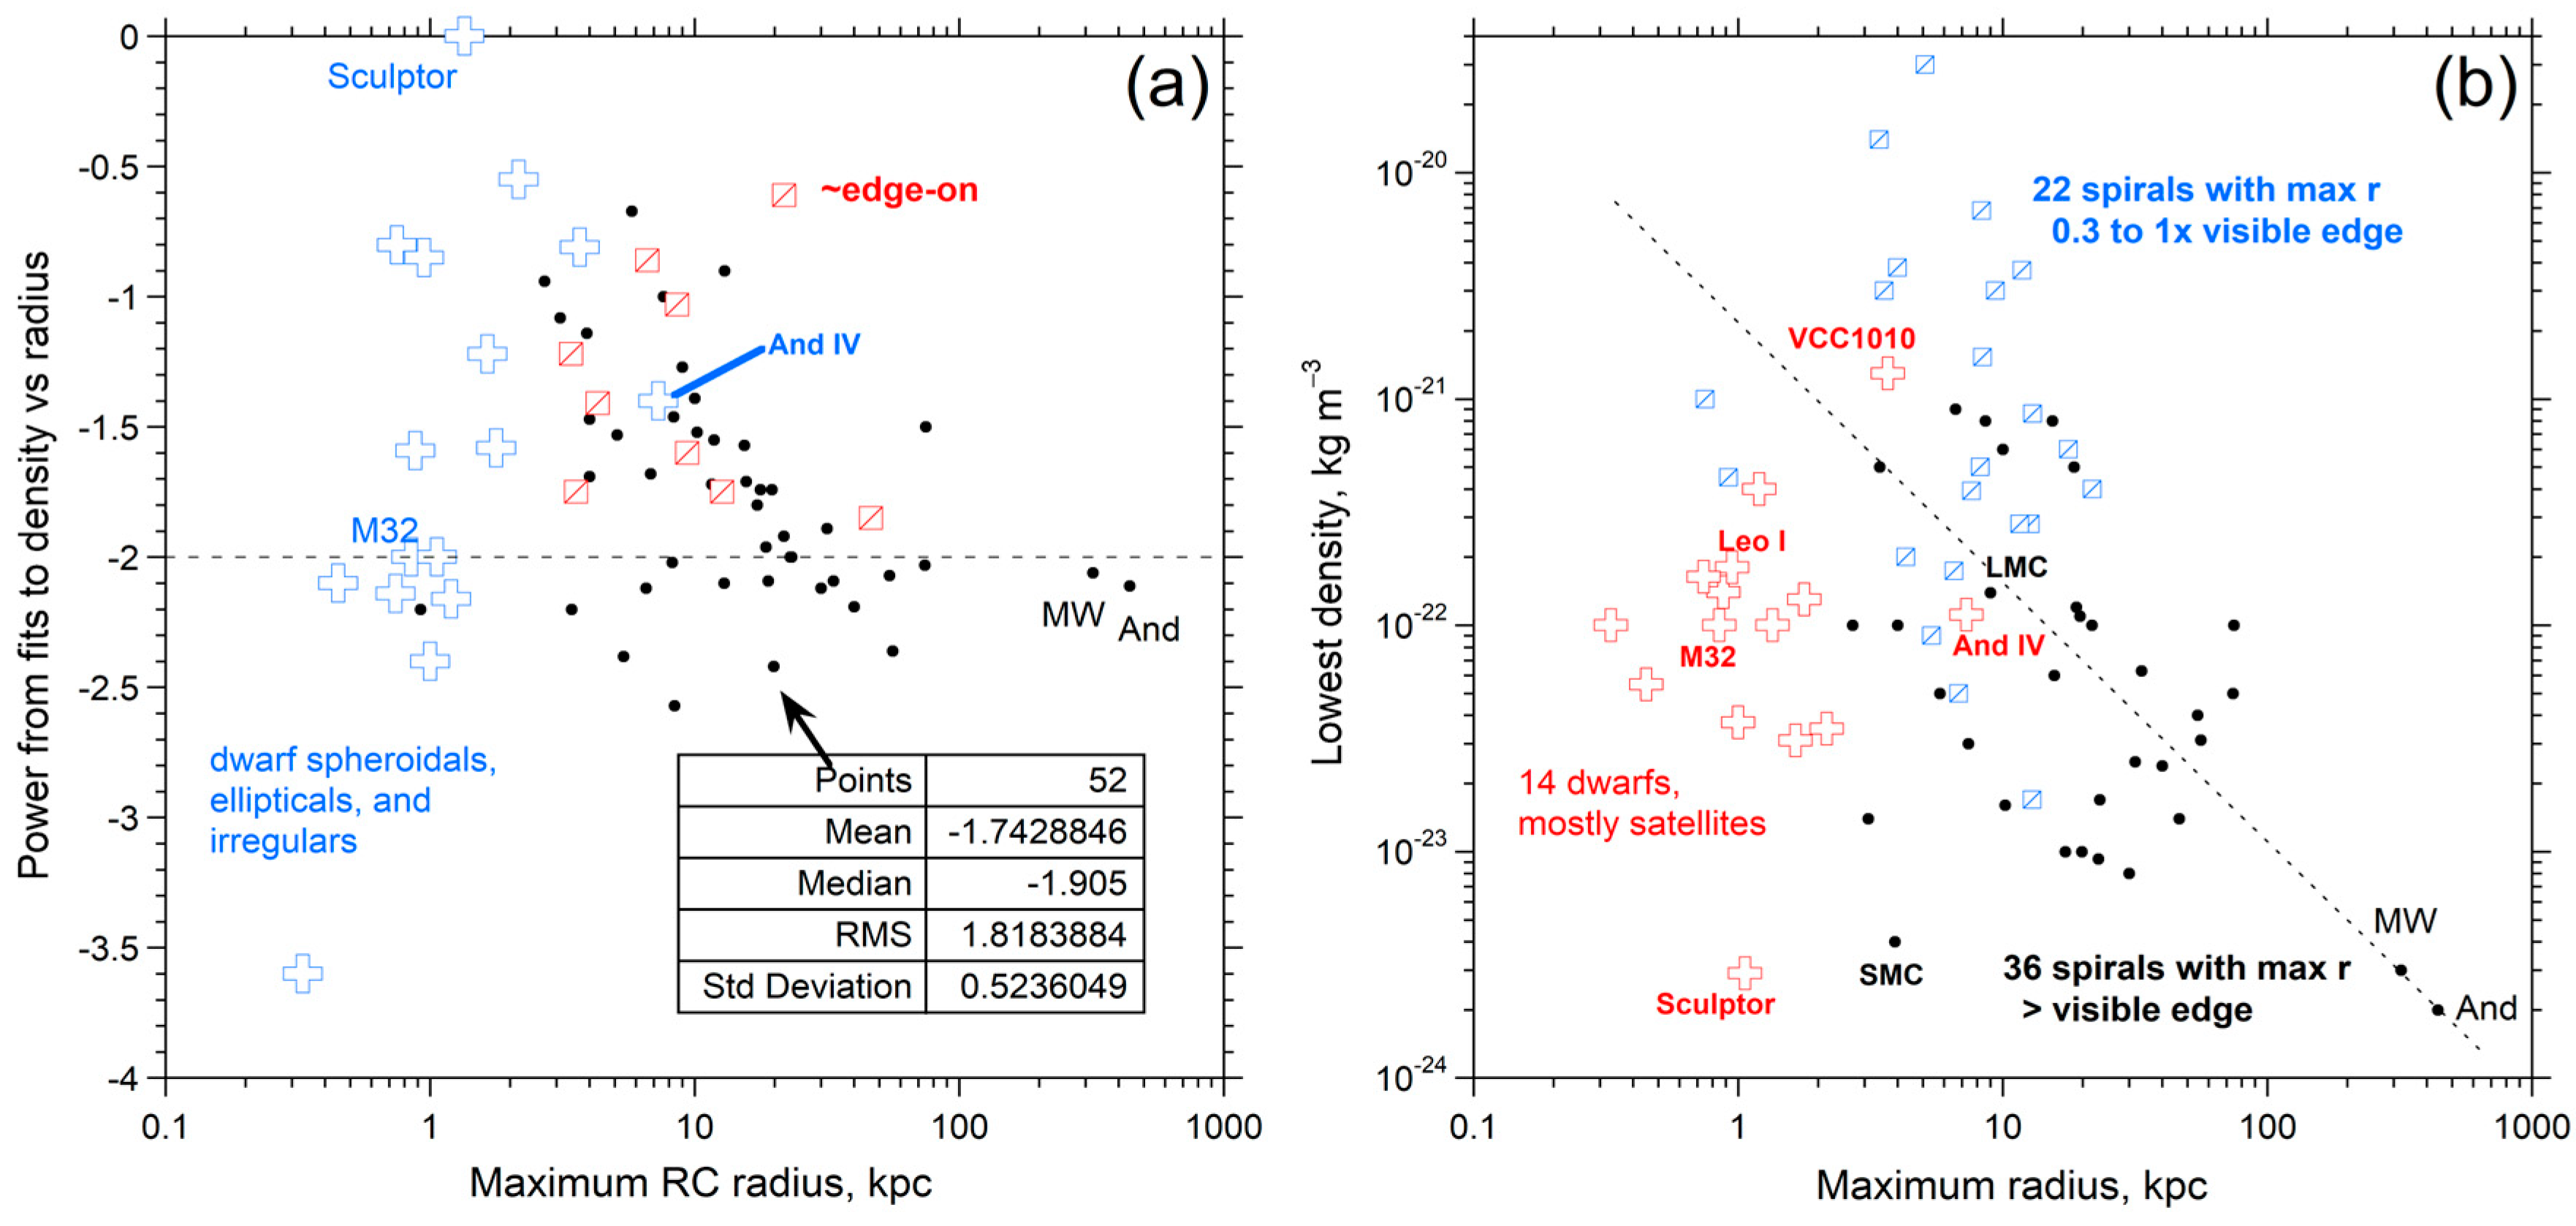
Simple power laws describe ρ(r) for the 72 galaxies probed (Figure 3 and Figure 4, Appendix A, and [38]), most of which are large. The power is equal to −2 or is slightly larger in magnitude for the best-constrained RC (Table A1 and [38], their Table 4); in other words, the density of gravitational mass decreases outward as an inverse square. This dependence also holds for the small, compact elliptical satellite (M32) of Andromeda [71]. Roundish galaxies have a wide range of power laws, including nearly constant density for tiny objects, such as Sculptor (Figure 6). Scatter decreases as the size of the galaxy increases, which results from the nature of least-squares fits and the fact that more points are generally acquired of large galaxies, particularly those nearby, where data quality is best and studies are several.
Another factor influencing RC extractions from Doppler shifts is the inclination of the galactic plane to the line of sight. Nearly edge-on galaxies show considerable scatter in the power law (Figure 6) in part due to difficultly in processing their Doppler measurements. For this reason and others, inclinations of ~40° to 80° are considered optimal [72]. However, for steep inclinations, data collected at small radii include some contributions from material at larger radii. This makes measurements of tangential velocities slightly lower toward the inside than actual values Density calculations are affected because Equation (4) includes the derivative and velocity squared terms. Hence, the power-law fits are least reliable at high inclinations. Importantly, the largest radii measured (the tip of the oblate) is not affected by tilt, which provides accurate determination of the maximum mass inside (Section 2.2.1, Section 2.2.2, and Section 2.2.5).
The best dataset (on Andromeda, Figure 3) and the only other dataset extending to a very large radius (the Milky Way, Figure 4) give nearly identical fits. The average fit from these figures on large galaxies, using units are kg m−3 and kpc, is generalized to
ρ ( r ) = 3 × 10 19 r 2
Equation (5) also reasonably describes the seven other large spirals in our database which have a power near −2.1, and all spirals without high inclinations (inset of Figure 6a). These have an average power of −1.9. This average includes smaller spirals with greater uncertainties in their RC data (Figure 6a). In addition, RC data exist for many large, proximal Messier spirals with luminosity near that of Andromeda, including several in the Virgo Cluster. RC data for eight of these objects (numbers M51, 61, 81, 83, 98, 100, 101, and 106) extend to or beyond the visible edge. For their density fits, the prefactors range from 1.29 × 10⁻¹⁹ to 3.62 × 10⁻¹⁹ kg m−3, and the powers range from −1.74 to −2.42 [38].

2.2.4. Physics Underlying Our ρ(r) Formula

Equation (5) was obtained by applying Equation (4) to measured rotation curves. The basis of Equation (4) is gravitational stability and the Virial Theorem.
Distant from the galactic center, tangential velocities of galactic matter become nearly constant. Thus, in this large region, the ∂v/∂r term in Equation (4) is zero, and the v2/r2 term dominates, making Equation (4) easy to evaluate. Because v is constant, ρ in Equation (4) goes as 1/r2, confirming Equation (5). This integer power is associated with each homeoidal shell at large distance having the same mass. Equation (5) describes a gradual decline in density of a stably rotating galaxy out to infinity, or until the dilute media surrounding the next galaxy is encountered.

2.2.5. Calculated Density at the Visible Edge and of CGM and IGM

Figure 6b, Appendix A figures, and those in [38] point to a rather consistent density of 10−21 kg m−3 at the visible edge. Dwarfs are overall less dense, as compaction under self-gravitation is lower for smaller masses. Independence of this edge density from distance or galaxy size is attributed to luminosity values being associated with a certain density [29]. From averaging the various datasets in Figure 4 and ρ = 10−21 kg m3, redge = 15 kpc for the Milky Way, which gives mass at the edge of 7.5 × 10¹⁰ Msun.
The visible edge is not the terminus of a galaxy. Figure 6b shows that calculated densities towards the outskirts of large spirals are as low as 2 × 10⁻²⁴ kg m−3. Similar values describe the midpoint between Andromeda and the MW, and the lowest densities for the dwarf spheroids. A range of CGM from 10−22 to 10−24 kg m−3 is suggested by satellites of MW (Leo I, Sculptor, the Magellanic clouds) and Andromeda’s closest satellite (M32). On this basis, CGM of other large spirals extends to 10−24 kg m−3.
Figure 6b furthermore suggests that IGM begins at ρ = 10−24 kg m−3. This value describes hydrogen gas ~500 kpc from Andromeda and the Milky Way, where the RC data become erratic (Figure 3 and Figure 4). Equation (5) can be extrapolated to infer ρ at even larger distances from the galactic center.

2.2.6. Validation via Comparison with Direct, Independent Measurements of Baryon Densities

Our values for interior densities compare closely with independently measured baryon density in all appropriate astronomical environments (Table 1). First, our calculated ρ for the average galactic visible edge agrees with independent density estimates of interstellar media (ISM) [73]. Our slightly larger density for the solar neighborhood (Table 1) is consistent with this region being closer to MW center and the data [74,75].
Second, our finding that central densities increase with galaxy size is consistent with behavior exhibited by other self-gravitating entities. Examples are the rocky Earth and our hydrogen-rich Sun.
Third, CGM terminates when density reaches 10−24 kg m−3. This value matches the largest density from the absorption measurements of [76]
Fourth, as summarized in Table 1, applying Equation (5) to the large distance of the Sculptor Wall provides a lower baryon density than the independent observations of [76,77]. Thus, extrapolation of RC data (Figure 3, Figure 4 and Figure 6b) via Equation (5) underestimates the IGM contribution to the baryon inventory. This is discussed further below.
Table 1 verifies that our inverse model provides density of baryons inside and around galaxies with no free parameters. This agreement would not exist if NBDM halos were present. Far from galaxies, our model provides lower density than measurements.

2.2.7. Dependence of Mass, including CGM, on Luminosity

The relationship of mass to luminosity is affected by sampling limitations. The maximum radius sampled during RC measurements differs from the effective radius relevant to magnitude measurements. This difference affects the inferred mass–luminosity proportionality. Figure 7a compares the mass computed from RC data using our inverse model to the luminosity for two cases. One comparison is made at the radius associate with visible light images (typically the 25.0 mag arcsec−2 isophote) and another comparison is made at the largest radius attained in the Doppler studies. For both the complete set of galaxies and for spirals only, the trend for the maximum mass observed has a slope that is ~2.4× the trend for mass obtained from velocity at the visible edge (Figure 7a). This consistency partially results from the statistical correlation of maximum radius to the visible edge r (Figure 5b).
Only RC data for Andromeda are both accurate and include the vast CGM associated with the strong gravitational field of a large spiral. This complete coverage (Table A1; Figure 3 and Figure 7b) provides the dependence of mass residing in the interior plus that of the baryons in CGM on the measured visible luminosity as
M t o t a l M s u n = 40 L L s u n   for   a   large ,   ~ isolated   galaxy   and   its   CGM
A factor of 2.4 describes matter within the visible edge for all galaxies (Figure 7), suggesting that L/Lsun = 3.1 × 10¹⁰ for the Milky Way, were this object viewed from the outside. However, the mass–luminosity ratio for the visible edges of Andromeda and Triangulum suggests L/Lsun = 1.7 × 10¹⁰. We use the latter value for the Milky Way (Table A1), assuming that its neighbors represent the composition (gas vs. stars) of the MW.
Equation (6) represents galaxies that are isolated or are sufficiently separated that their dwarf satellites have distinct orbits about a central body. The separation is ~765 kpc between Andromeda and the MW. Equation (6) is a consequence of the power law dependence of density on radius (Equation (5)) and that CGM extends to many times the visible edge. The great extent of hydrogen gas surrounding the star-rich interiors of spirals, as documented by images (Figure 1), significantly contributes to the baryonic mass of the universe, but was greatly underestimated in the 1999 mass inventory (see Figure 2).
Dwarfs orbiting a large galaxy are bathed in the CGM of the central object. Based on the fit of Figure 7b,
M t o t a l M s u n = 5 L L s u n   for   satellites   or   closely   spaced   galaxies
Equation (7) holds for the typical radius of RC acquisition for these satellites and describes the combination of stars and gas within the fairly dense region that coherently rotates (spins) about the center.
Utility of the trend is illustrated by Andromeda’s satellite M110 (NCG 205) which was not included in Appendix A Table A1 because its velocities are affected by interactions [69]. M110 has an E5(pec) morphology; thus, velocity dispersions were measured, and these were lop-sided. The largest velocity difference from its center of Δv = 52 km s−1, which was measured at r = 2.6 kpc, gives M/Msun = 9 × 10⁸ near the visible edge. This estimate is compatible with the luminosity–mass trends in Figure 7.

2.2.8. Large, Very Distant Galaxies Behave in the Same Manner as Small, Close Galaxies

Ogle et al. [22] obtained RC data for several large and distant galaxies. However, their report provides one rotation curve only. Because 2MFGC 12344 was orientated edge-on, which alters v(r) from intrinsic values (Section 2.2.3), we did not extract Min as a function of radius.
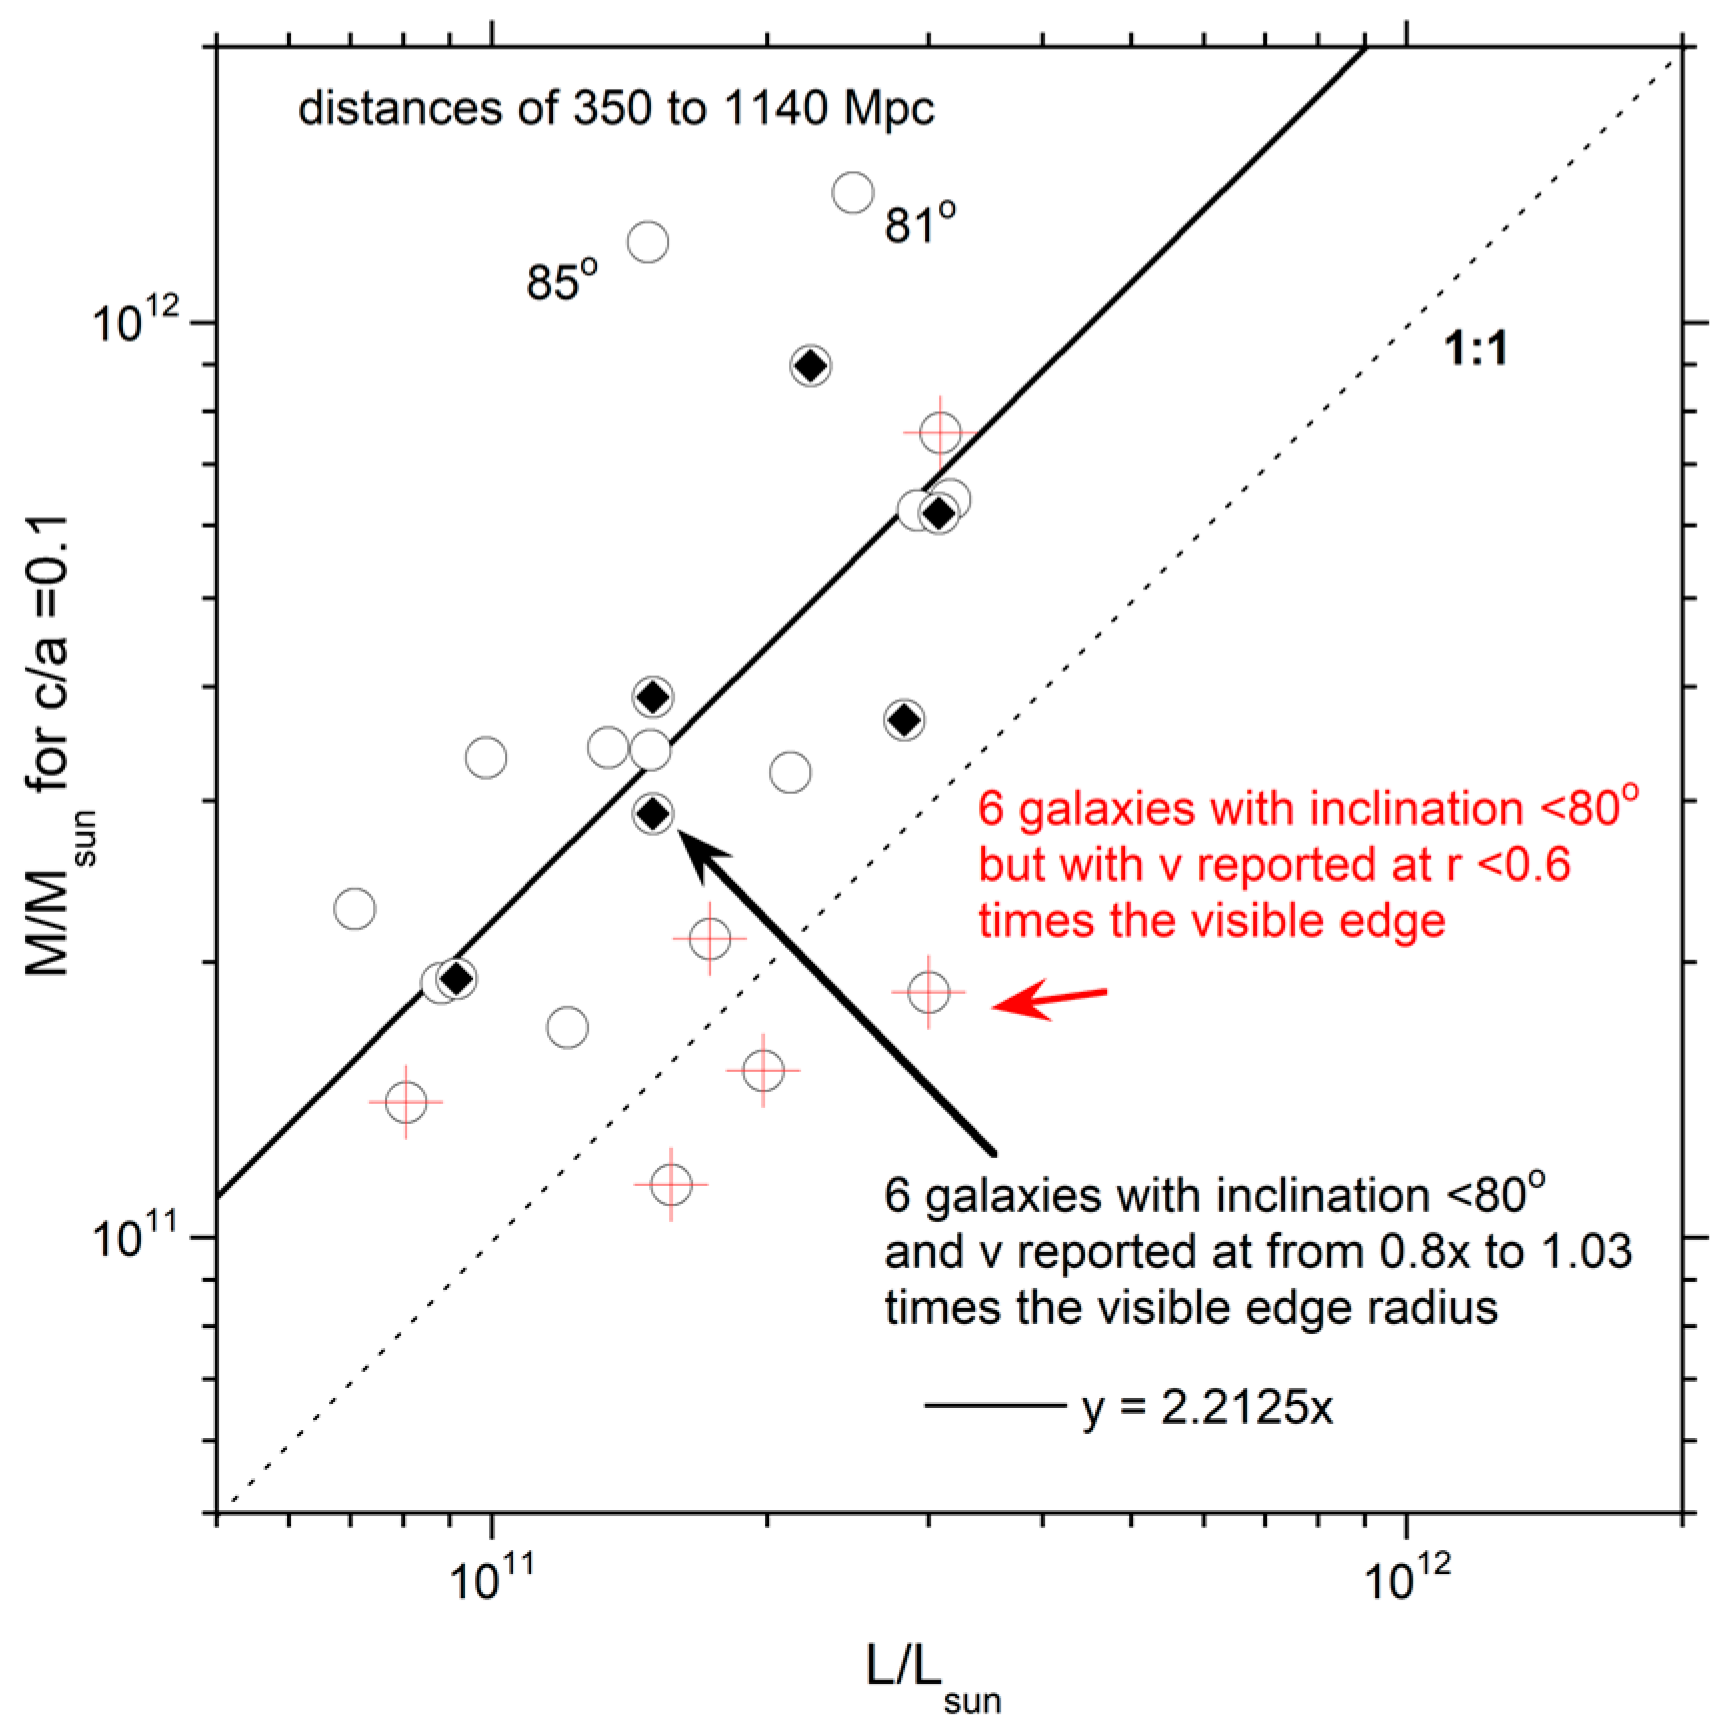
Many of the other galaxies probed by [22] are nearly edge-on. Their tables give the largest velocities and the radius where these were measured, which are rarely as large as the visible edge. Due to these limitations, Equation (3) was used only to provide mass within the specified radius. Figure 8 distinguishes the masses for objects where velocity was obtained close to the visual edge and for an inclination below 80°. The fit to this subset of six galaxies has the same proportionality as the fits in Figure 7a,b for the visible edge mass, within their respective uncertainties.
Although scatter is significant in Figure 8, the close resemblance of these trends to those for smaller spirals located within 80 Mpc (Table 3 in [38]) shows that the results of Section 2.2.1, Section 2.2.2, Section 2.2.3, Section 2.2.4, Section 2.2.5, Section 2.2.6 can be applied to the available data on galactic luminosity and size.

3. Galactic Luminosity Data

For consistent comparisons, luminosity was downloaded from the NED database [26]. Results for very large and very low luminosity were confirmed by manually entering the galaxy identifier. We found few changes from the 2017 download to our 2023 cross-check. Our histograms are similar to previous studies. We diverge from previous work by focusing on how distance affects the minimum luminosity that can be measured.

3.1. Luminosity of Galaxies in the Local Group

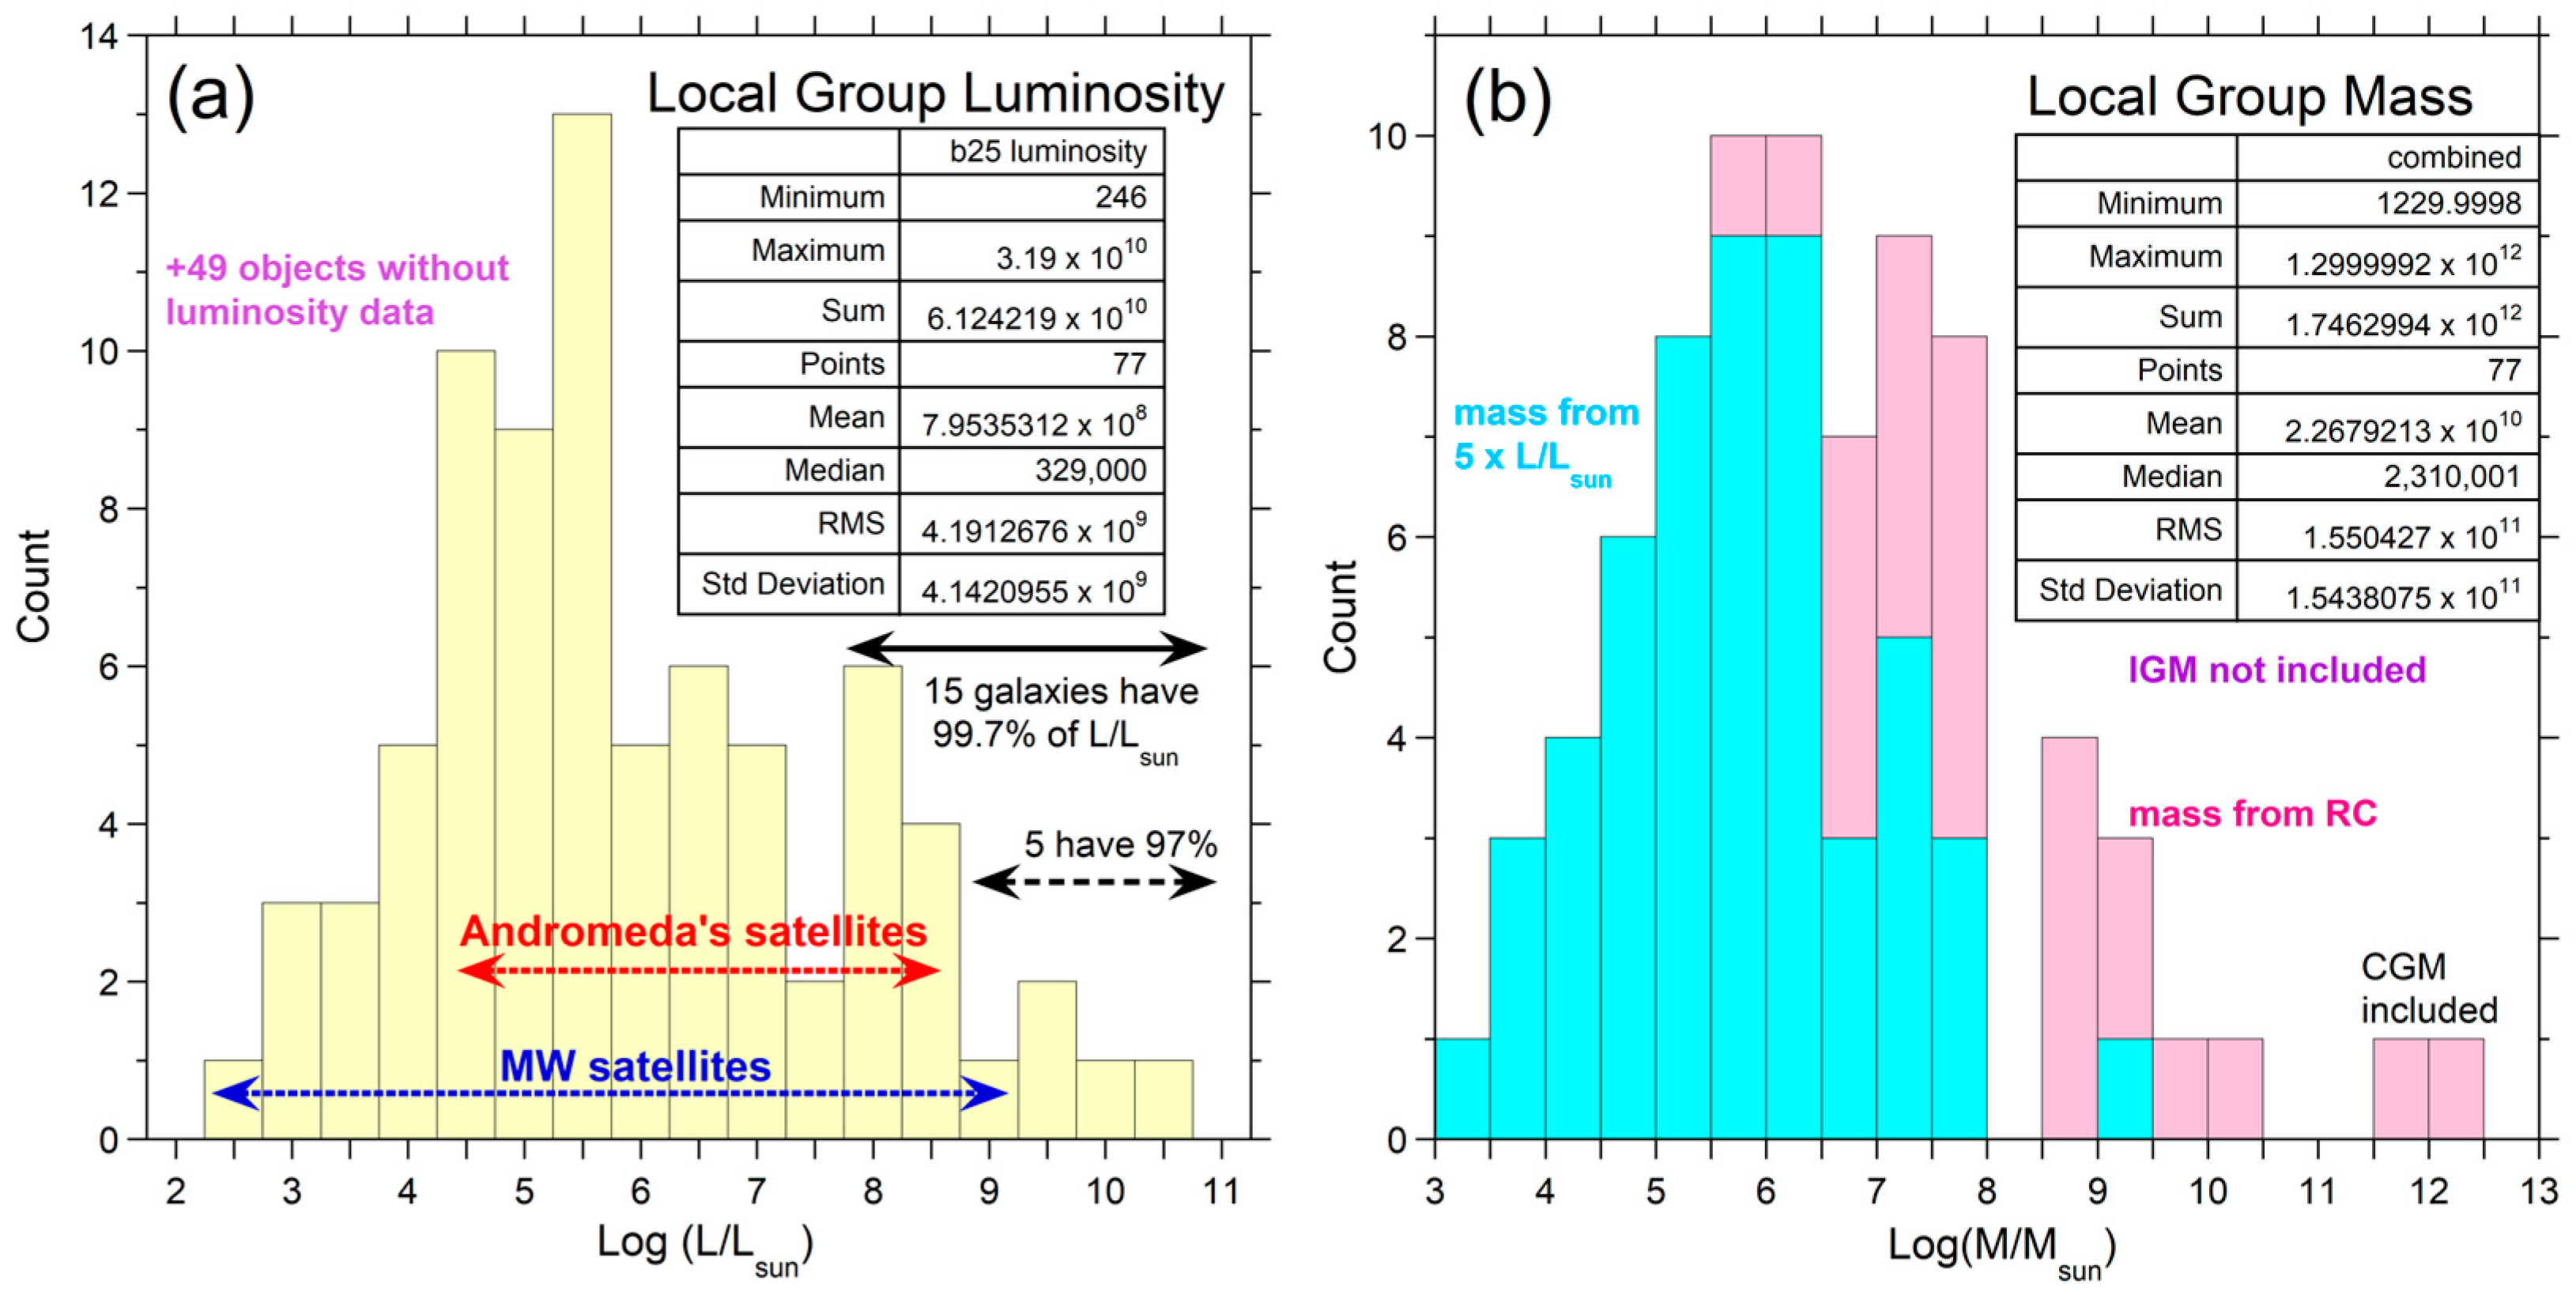
Fully 97% of the luminosity of the local group rests in its five largest spirals: Andromeda, MW, IC10, Triangulum, and the Large Magellanic Cloud (LMC). Figure 9a further shows that 99.7% of the luminosity is derived from this group plus 10 additional objects, which include three satellites of Andromeda, and the Small Magellanic Cloud (SMC) of MW.
Histograms of 77 objects in the LG suggest a log-normal distribution, which arises when normal, Gaussian distributions describe subtypes (e.g., tiny dwarfs vs. modest spirals vs. giants). However, luminosities of 49 additional objects in the LG [20] are not reported in NED. Of these, 8 objects are distant from the MW, 5 are satellites of Andromeda, and the remaining 35 orbit the MW. Due to their small sizes, these 49 objects should contribute inconsequentially to the total luminosity of the LG.
However, of the documented 77 objects in the LG, Andromeda’s satellites occupy a narrower range of L/Lsun than those orbiting the Milky Way (Figure 9a), which suggests that the survey of Andromeda’s satellites is incomplete. If Triangulum orbits Andromeda (currently debated), then the upper limits of satellite ranges are consistent with relative sizes of the central spirals. Comparing the lower limits indicates that Andromeda has more tiny satellites than are currently known. As distance increases, the minimum detectable luminosity must increase. Although small objects contribute negligibly to the total mass of a galactic group, Andromeda could occlude some significant objects with L/Lsun up to 108, similar to its close satellites M32 and NGC 147 (Table A1), which could slightly affect the statistics shown. Possible effects of the detection limit on the mass inventory are covered in Section 4.

3.2. Luminosity of Galaxies in the Virgo Cluster with Comparison to the Local Group

The Virgo Group (VG) contains more than ~1000 galaxies, but most of these are dwarfs for which membership is debated and luminosities are low. The 2023 NED database [26] was interrogated for the 160 largest and most luminous Virgo Cluster (VC) members [78]. The distance to VC members ranges from 14.5 to 18 Mpc; thus, galaxies outside this range, within the uncertainties of measurement, were culled. The number of remaining objects (98) is sufficiently large that incorrect inclusions (or exclusions) have a negligible effect on the total luminosity of the VC (Figure 10). This is true because membership of the largest galaxies (e.g., Messier’s spirals) is well established. Of course, the average luminosity of a group member depends on the number of objects included in the average.
Sequentially summing the value for each bin times the number in each bin of a probability distribution function (PDF: Figure 9a and Figure 10a) yields the corresponding cumulative distribution function (CDF: Figure 10b). At low luminosity, the CDFs follow the expected flat pattern for a log-normal distribution, but the expected flat trend at high luminosity is not observed (Figure 10b). When the total number of galaxies is small, large galaxies are few; hence, each large object exerts a strong influence on the sum.
For comparison, the 1984 estimate of the total VC luminosity is 1.4 × 10¹² L/Lsun [79]. This value is about ½ of ours (Figure 10, inset) because it represents the surface of the cluster facing the observer, whereas summing the luminosities of each galaxy better represents the interior. Summation is appropriate for inferring total mass.

3.3. Luminosity of Near and Far Galaxies

The NED database categorizes galaxies by morphology. We downloaded all data in five categories: ellipticals, lenticulars, plus SA, SAB, and SB spiral classes, which were combined in some of our graphics. Small clusters of galaxies were culled. For the ellipticals, types E/S0 were kept, but S0/E were culled. The converse was applied to the lenticular database to minimize overlap. Galaxies with distances greater than 250 Mpc are not included in the histograms of luminosity, but are investigated in Section 3.4.

3.3.1. Distribution Functions for Redshift-Independent Distances

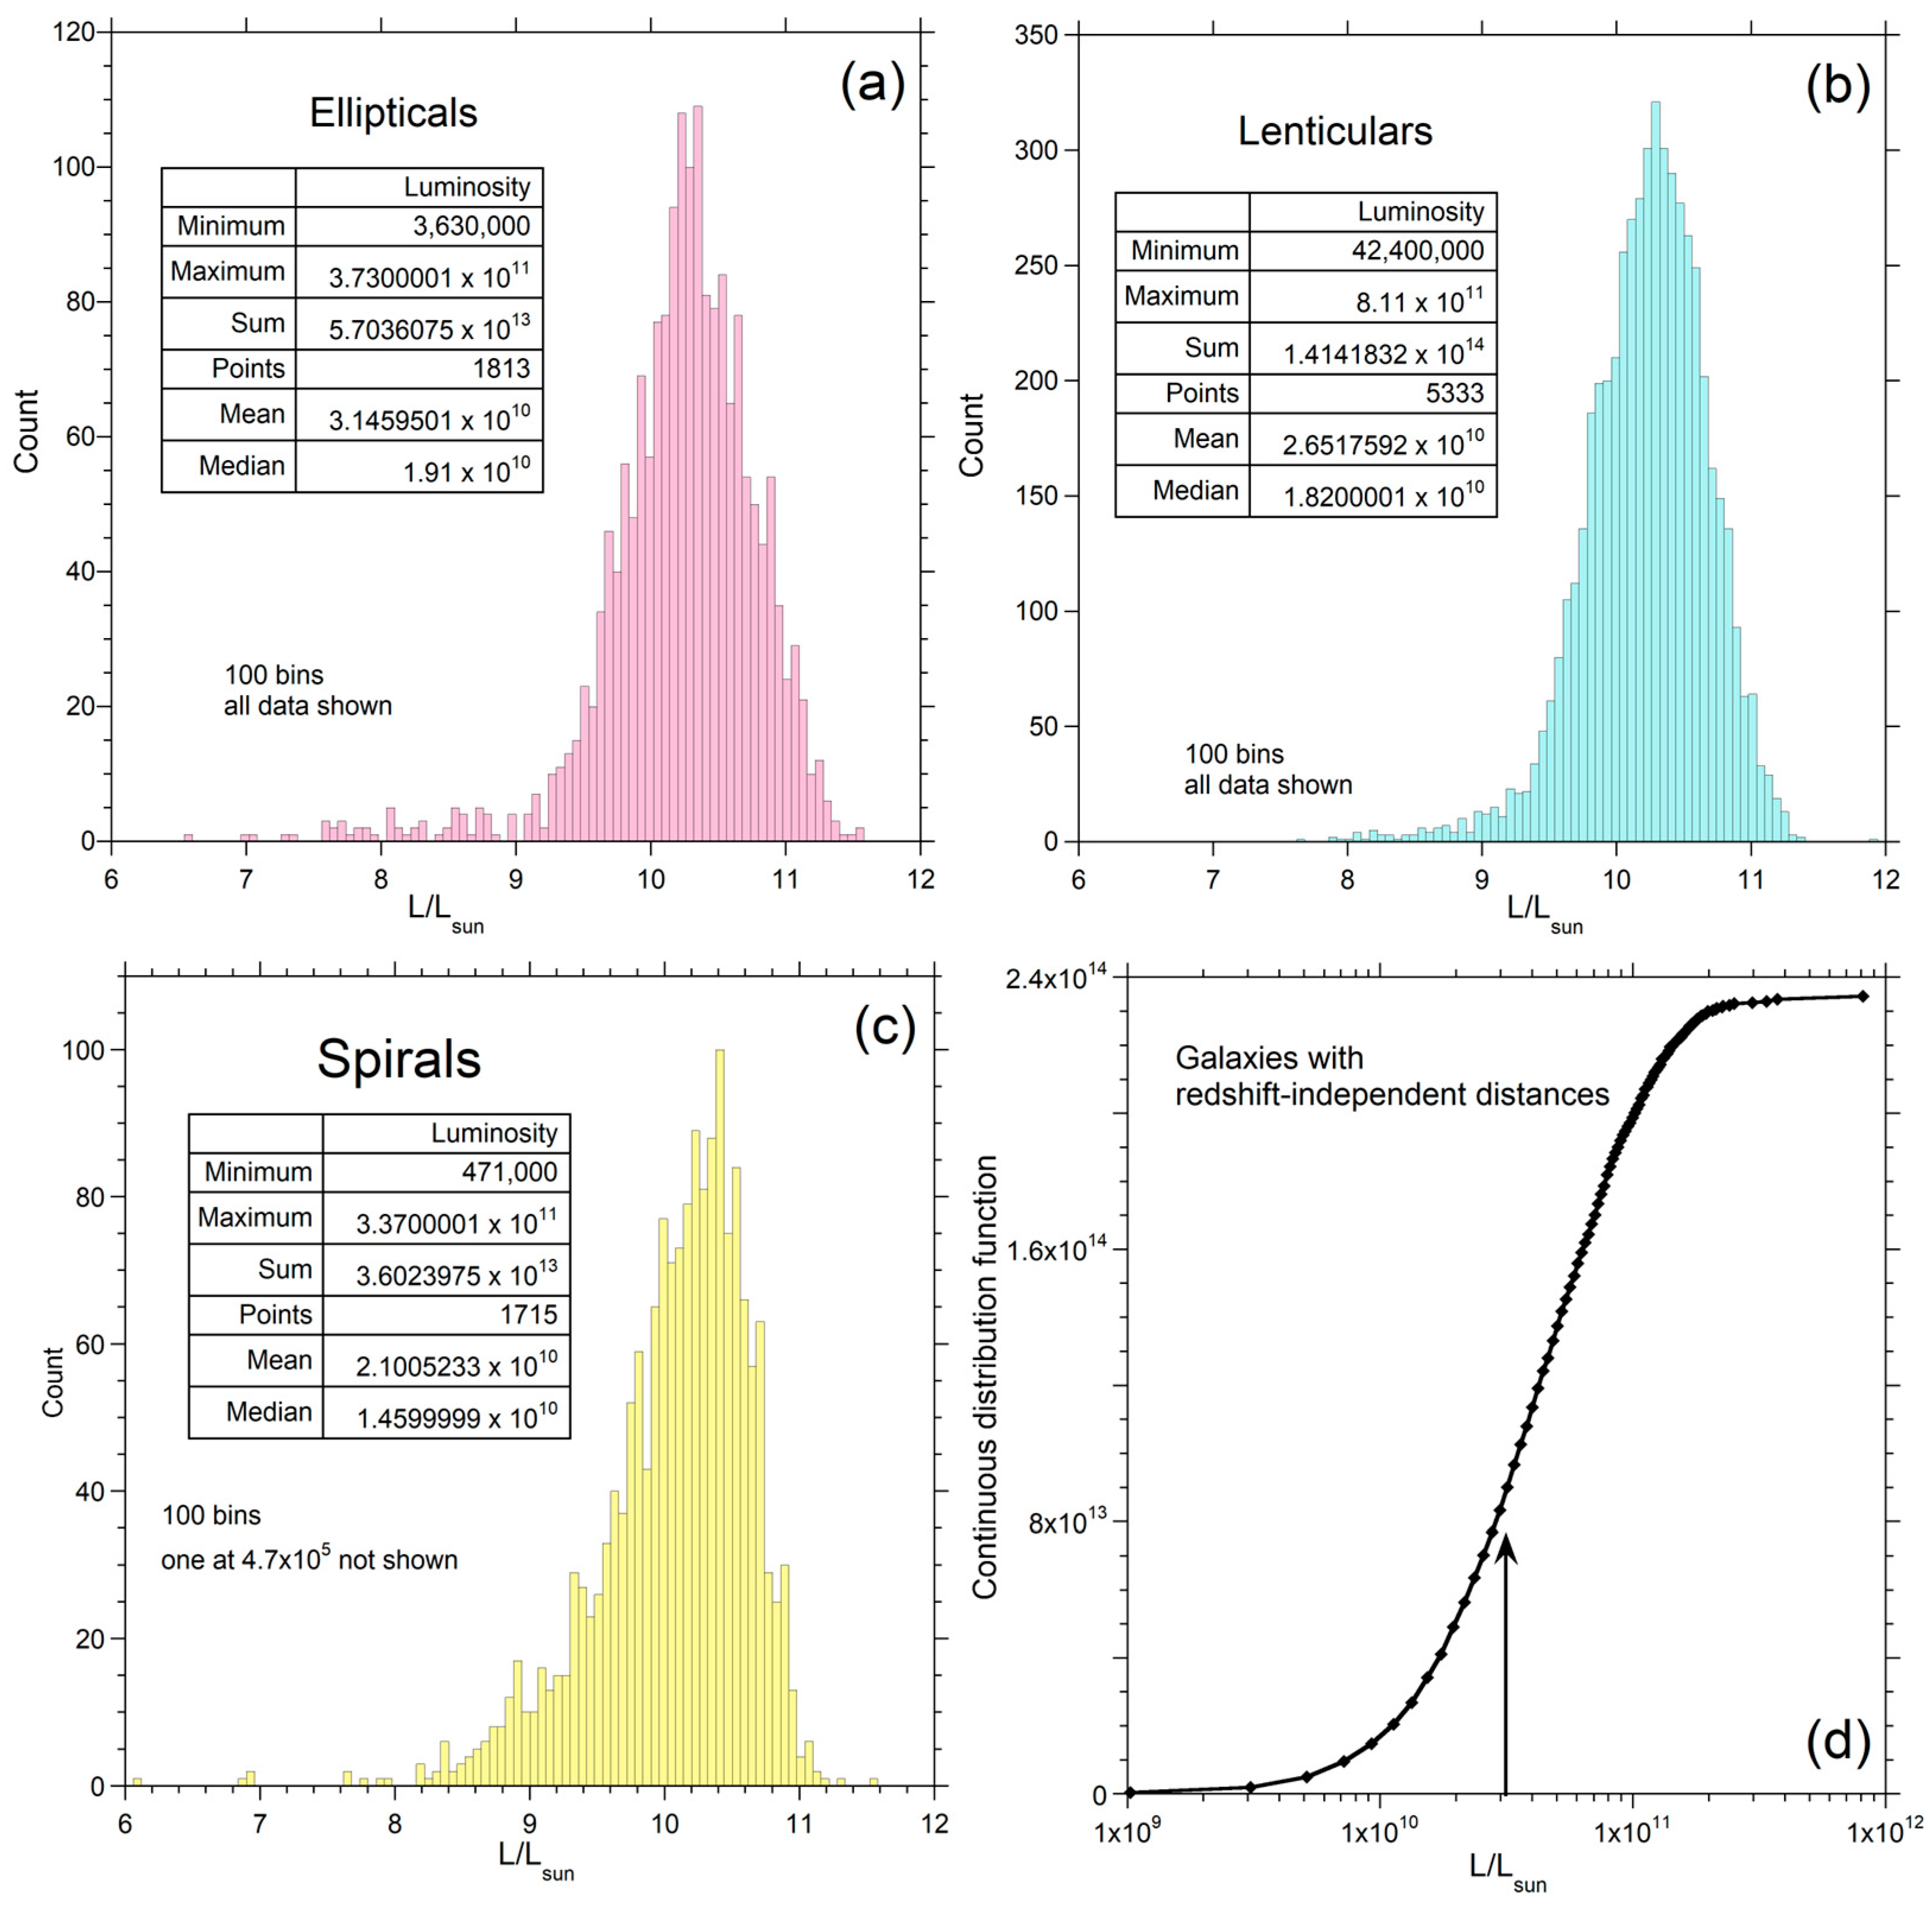
For the redshift-independent distances, the morphological classes differ in number of objects by over a factor of two, yet their histograms cover similar ranges of L/Lsun (Figure 11a–c). The smooth curves indicate that statistical significance was achieved. The shapes of these PDFs signify log-normal distributions, which is obviated by the CDFs for the combined morphologies (Figure 11d).
The smoothest distribution is observed for the most populated morphology (lenticulars). Low luminosities slightly depart from the log-normal distribution, which is attributable to limitations in observing tiny, dim objects. Low L/Lsun values are slightly more populated in the spiral class, which may be due to nearby objects exhibiting diverse appearance in their beautiful images, and to interest in measuring their rotation curves. Greater asymmetry of the PDF for spirals is attributed to tilt because the average spiral is inclined by 45° to the line of observation, which reduces detectable luminosity. Section 3.4 provides further discussion.
The histograms are sufficiently similar that results for the different morphologies will be summed in computing the inventory (Section 4). Furthermore, PDFs of the Local Group (Figure 9) and Virgo Cluster (Figure 10) resemble those obtained over the larger volume within 25 to 30 Mpc (Figure 11), suggesting that all these databases are reasonable approximations to baryonic mass distributions in the universe. Effects of the number of objects, distances, and volumes probed are discussed further below.

3.3.2. Distribution Functions at Larger Distances

For the assemblage of objects within 250 Mpc, PDFs (Figure A11) for the three morphological classes are similar to PDFs for nearby galaxies (Figure 11). A similar appearance also holds for the individual spiral classes, which are distinguished in Figure A11c. PDFs at 50 and 100 Mpc (not shown) are intermediate to those of close (Figure 11) and distant (Figure A11) galaxies.
Figure 12 explores possible morphology effects up to 250 Mpc. The shape of the CDF for ellipticals is less regular than that of lenticulars and spirals. Nonetheless, all morphologies show that ~ ½ the luminosity within 250 Mpc is contained in objects within ~1 to 2 times L/Lsun of Andromeda. Roughly 80% of galactic luminosity is stored in objects with L/Lsun < 8 × 10¹¹. In these three distributions describing a plethora of galaxies, much luminosity is stored in objects best described as near the middle of the range. Our results show that large objects are very important, but do not support the contention of [5] that they control the total.
Importantly, all PDFs and CDFs (here and earlier) omit small galaxies; thus, this commonality is not the source of the different conclusions regarding distribution of luminosity (or mass). Rather, the database with ~1100 members used in the previous inventory was insufficiently large to provide an accurate statistical representation. This is evident in comparing Figure 11, Figure 12, and Figure A11 to Figure 9 and Figure 10 for the densely packed Virgo Cluster and tiny Local Group, which dataset is effectively complete.
The CDFs show that the numerous tiny galaxies contribute little to total luminosity, as recognized above and by [5], which is helpful, as such objects are largely not detectable. However, the average luminosity is affected by distance and number observed, which we probe in detail below.

3.4. Effect of Distance on Galactic Distribution Functions

3.4.1. Dependence of Luminosity of the Objects on Hubble Distance

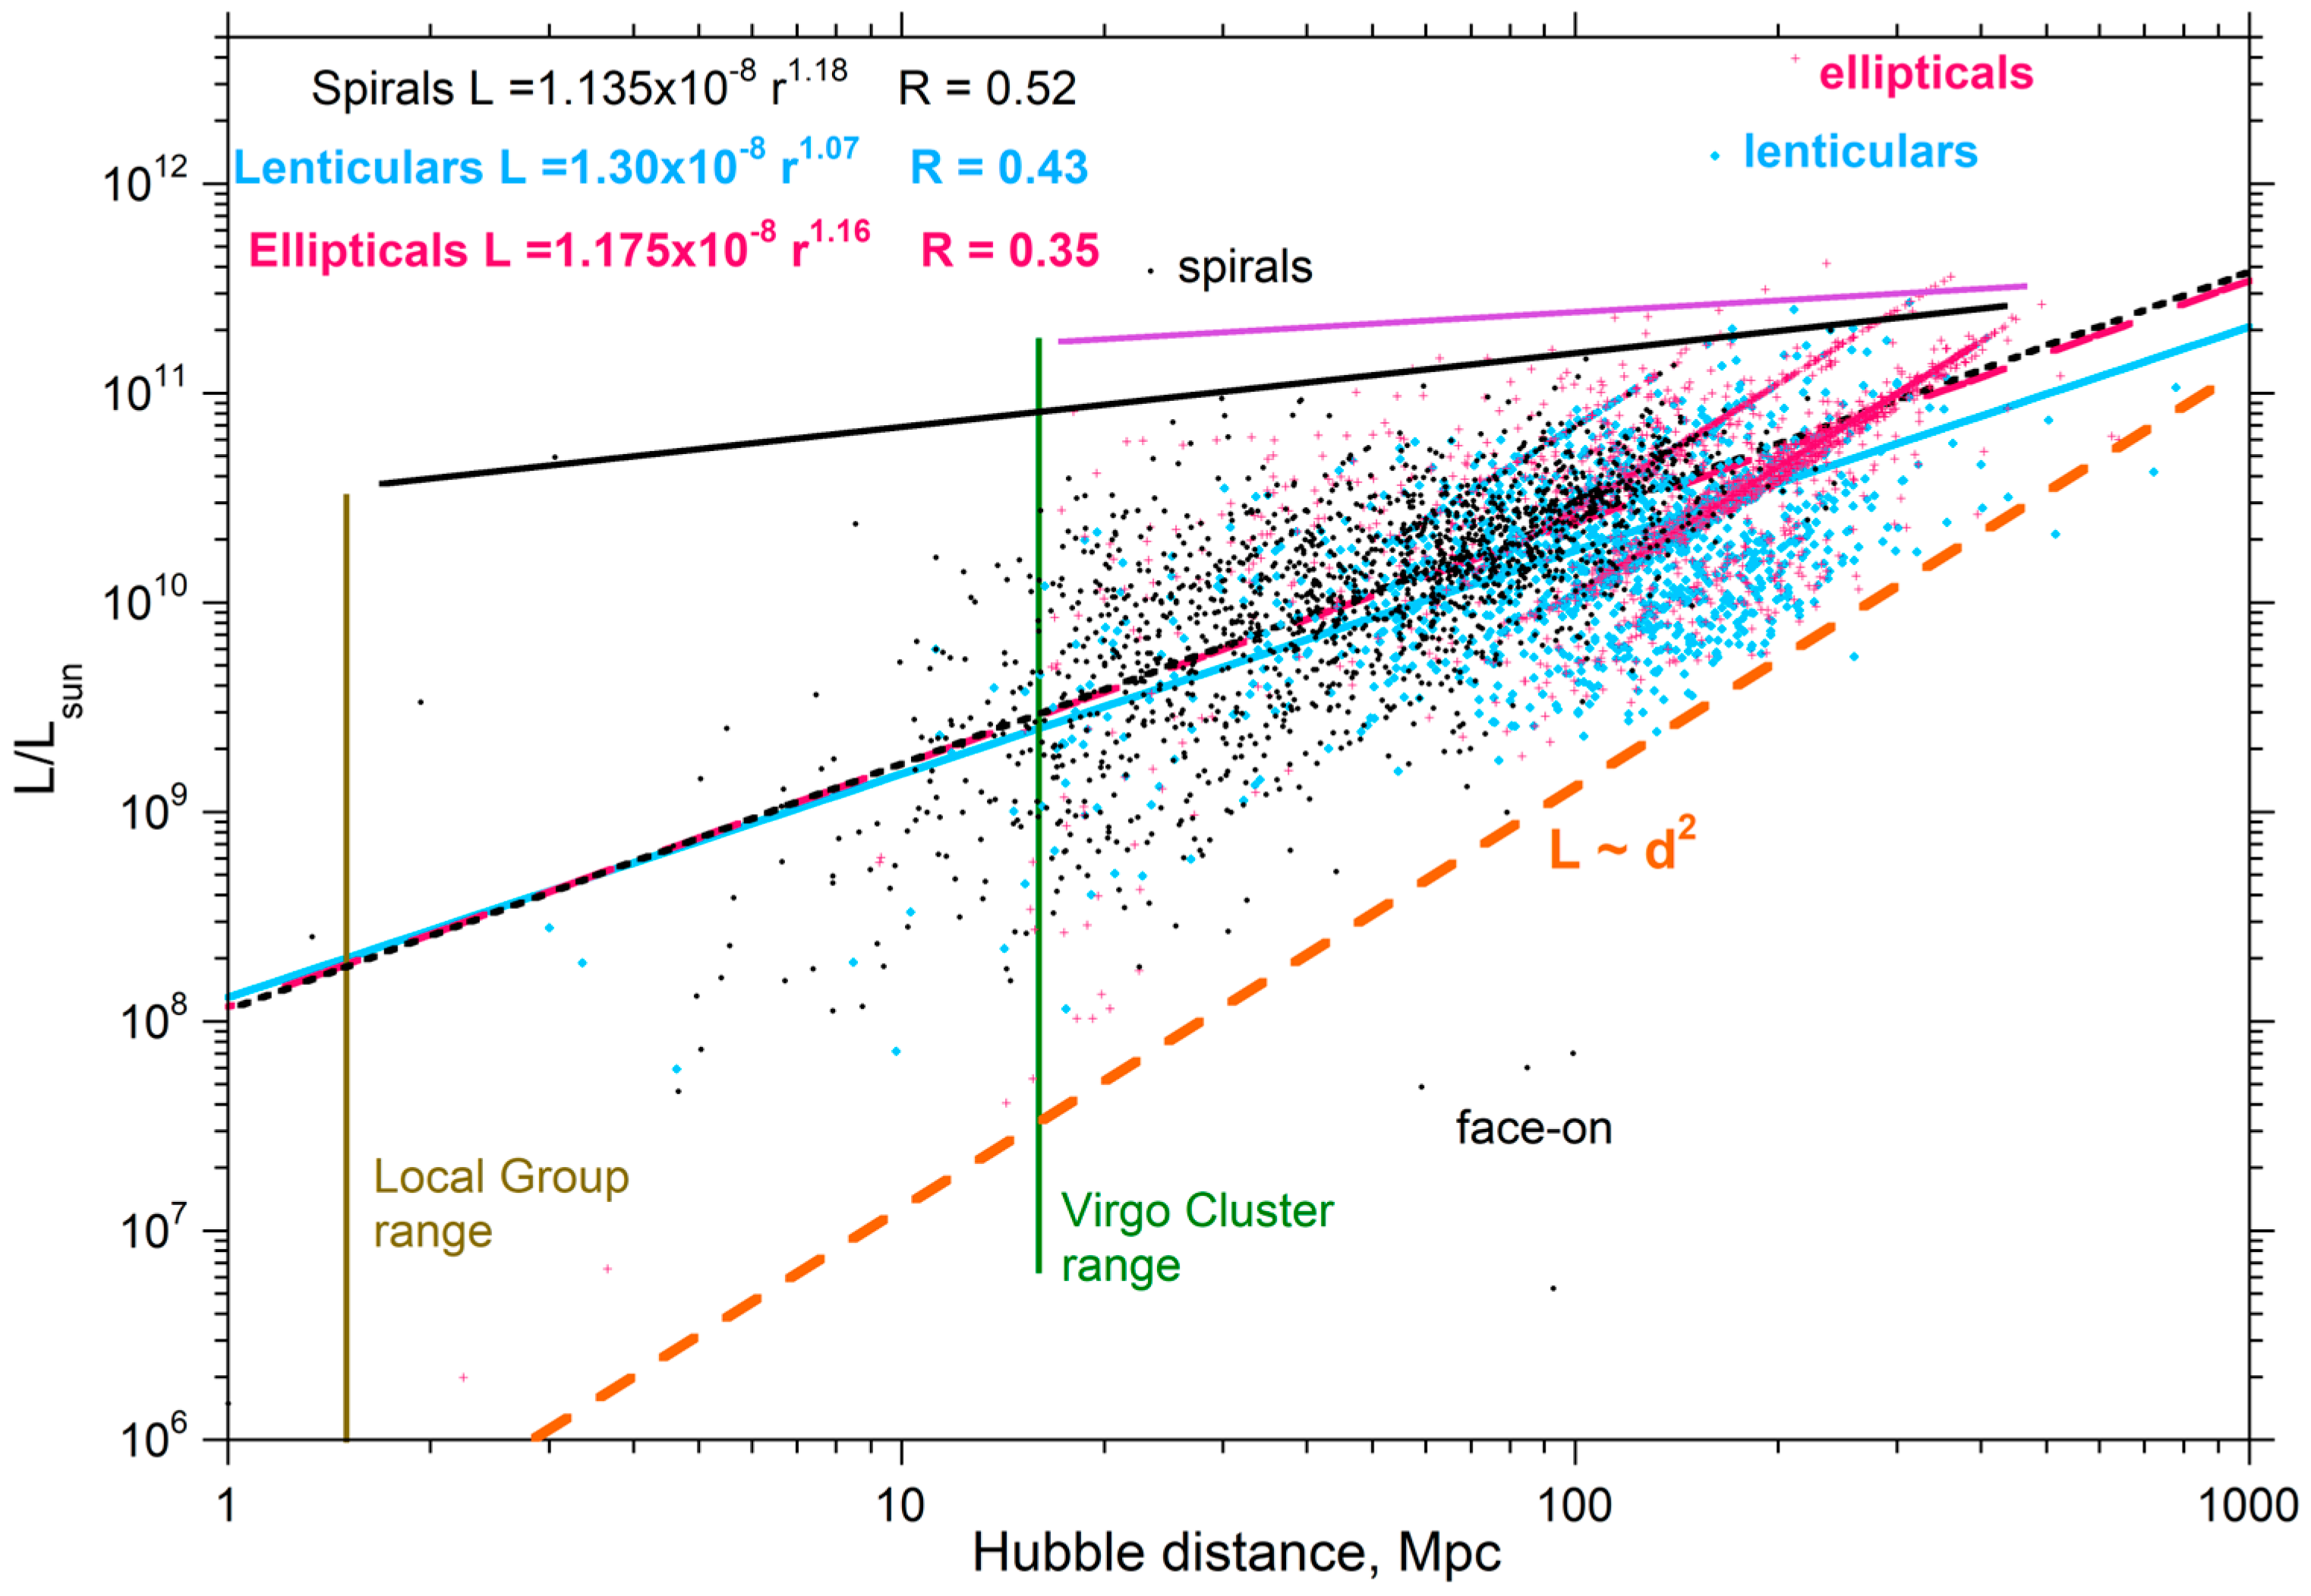
As distance (d) increases, the luminosity and, thus, mass of the galaxies appear to increase (Figure 13). This behavior is not an intrinsic property of the universe, but results from the combined effects of (1) resolution, (2) statistical behavior, and (3) the dependence of the volume sampled on the distance probed, as outlined below.
Resolution limits observing dim objects. Galaxies behave similarly to stars, whereby both effectively become point sources at some large distance. Furthermore, due to scattering of light, which particularly affects the visible region, a minimum luminosity for detection exists. As distance increases, fewer “small” galaxies are observed because both the resolution and the cutoff are fixed by instrumental parameters, whereas the angle subtended by any given size galaxy decreases as 1/d2. This is evident in the cutoff for low luminosity in Figure 13 going as distance squared, and trails where sampling is dense describing parallel trends.
Outliers at low L/Lsun are explained by orientation and shape affecting detection. Spirals are flat; hence, the area viewed depends on orientation. Face-on spirals can, thus, be viewed at greater distance than those with a finite tilt (~45° on average) and edge-on spirals, which present little area. The four spirals (out of 1620) with unusually low luminosity all present face-on, with detectable, star-rich arms, thereby providing confirmation.
Shape also affects what can be observed at large d. Lenticulars are slightly affected by tilt. Due to the link of resolution to shape, ellipticals are observed at slightly greater distances than lenticulars, and both can be observed at substantially greater distance than spirals (Figure 13).
Regarding high L/Lsun, the upper limit concerns sparsely populated tails of the PDFs (Figure 11 and Figure A11) and morphological differences. Figure A11 (large distance) shows that ellipticals have higher L/Lsun than lenticulars, and that both are much more luminous than spirals, whereas close in the difference is small (Figure 11). The eight most luminous galaxies in the Virgo Cluster are ellipticals, and its next six most luminous galaxies consist of two ellipticals, two face-on spirals, and two tilted spirals. If the three labeled galaxies (out of 6811) in Figure 13 are neglected due to statistical insignificance, the uppermost trend, defined by the VC and the densely populated trails ending near 250 Mpc, is flat. This trend is largely defined by the ellipticals, but spirals (black solid line) and lenticulars (not shown) behave similarly. Flat upper limits arise as described below.
As distance increases, a greater volume of the universe is sampled. The increment in distance is a radial increment; hence, the volume of the shells goes as (4/3)πd2Δd. From Equation (5), mass density goes as 1/d2 from a galaxy center, which also holds for a collection of galaxies of similar size in any given volume. Luminous density should behave the same; thus, the maximum luminosity(excluding 3 labelled outliers) is nearly constant. The slight increase in the maximum may be real, but may also be statistical, because samplings at high luminosity are sporadic (Figure 9, Figure 10, Figure 11 and Figure A11).
Average luminosity for all three types increasing with d (Figure 13) is connected with the observation of fewer small galaxies. To further understand this trend, we probe changes in the detected number of galaxies with distance.

3.4.2. Dependence of the Number of Galaxies Observed on Distance

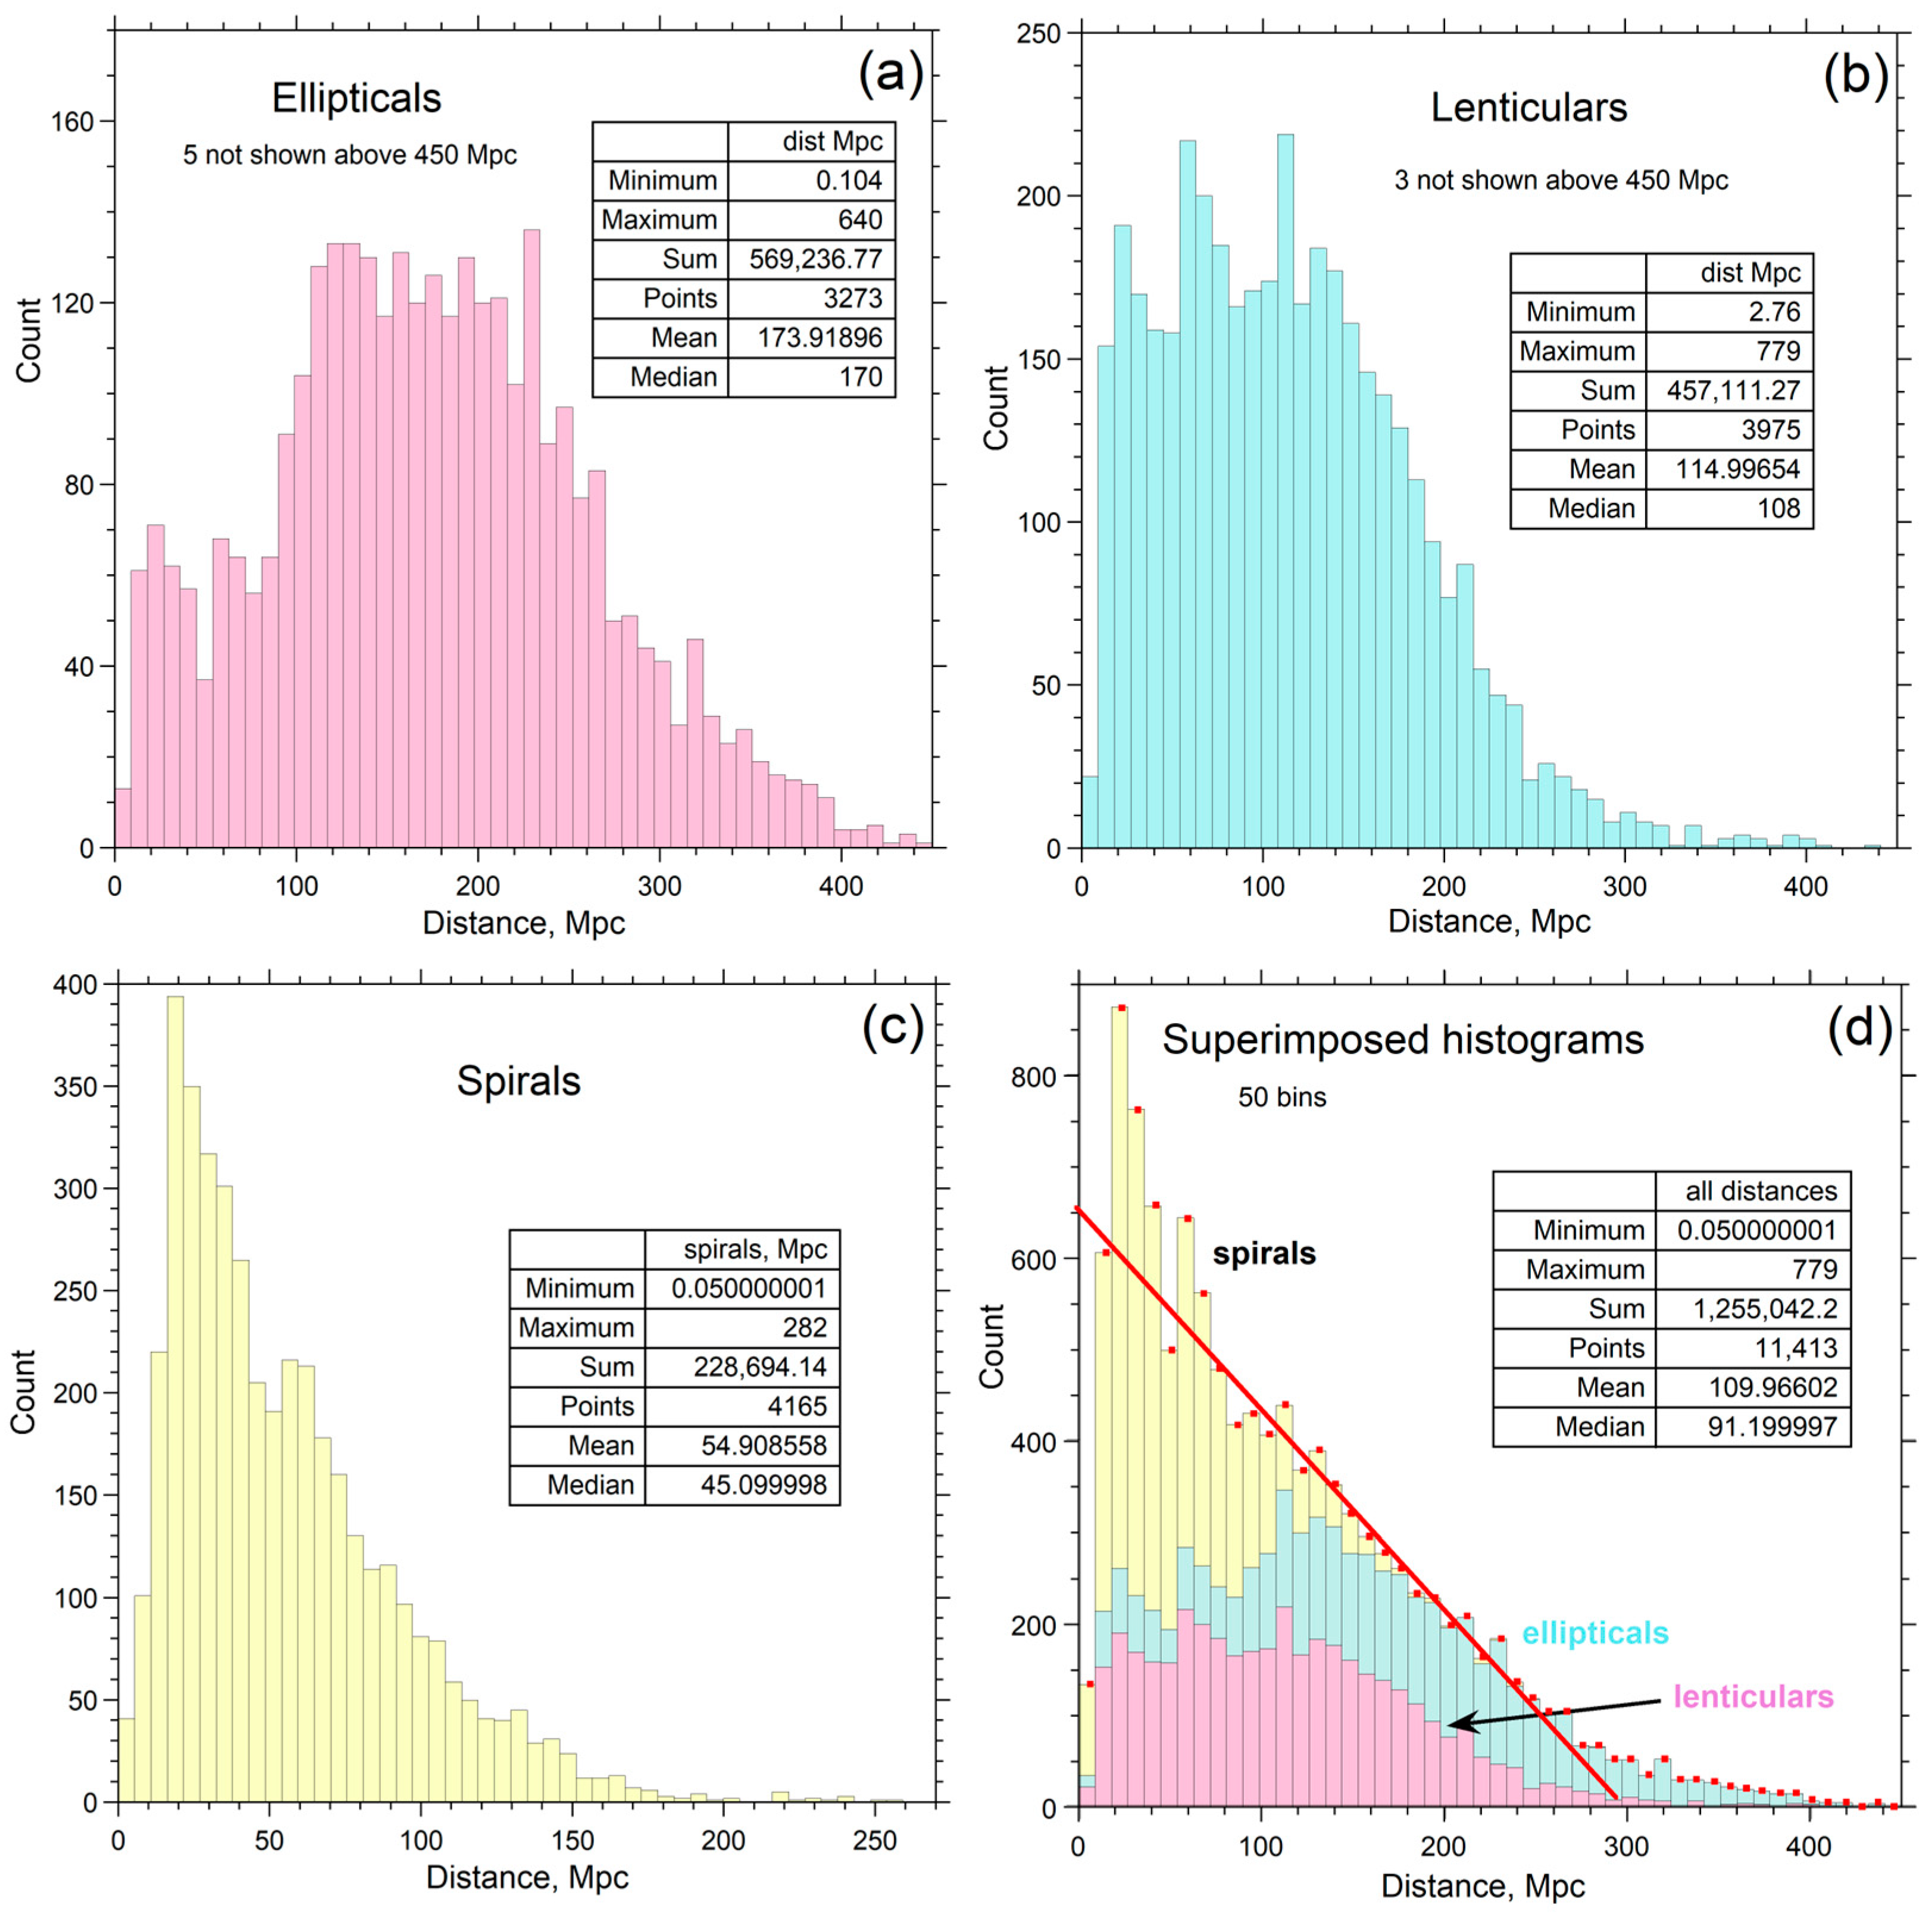
The number galaxies first increases with Hubble distance and then decreases (Figure 14). The number of galaxies is greater than in Figure 13 because Figure 14 includes galaxies for which luminosity was not reported in the visible in the NED database [26].
The increase in object number with d near the origin is largely caused by the expected increase of the volume of space that is sampled. The contrasting decrease in number with d at large d is caused by resolution effects combined with the minimum luminosity required for detection. Trade-offs produce the flat tops for the distributions of both ellipticals and lenticulars (Figure 14a,b). Spirals lack a flat top (Figure 14c). Their number is more strongly attenuated with distance due to tilt affecting the area presented. The total number of objects (Figure 14d) linearly decreases with d over most of the range due to resolution effects dominating and sub-equal numbers of the three morphologies. Consequently, average luminosity increasing with distance (Figure 13) is due to the increase in the number of “missing” small galaxies. Thus, the PDFs change with distance. However, the shape should still be log-normal at any given distance, due to the log-normal distribution being the sum of normal distributions.
Results for the changes in population with distance (Table 2) show that mean galactic luminosity is rather constant, 2.6 × 10¹⁰ L/Lsun, within uncertainty. The variations in L/Lsun in Table 2 are largely due to resolution effects and morphological differences.

4. Gravitationally Derived Estimates of Baryonic Mass in the Universe

This section provides several new, direct estimates of density of baryons in the universe. First, the results of Section 2 on mass in, around, and between galaxies are combined with results in Section 3 on the distribution of galaxies in space. Next, three additional independent estimates of ρ are presented that utilize previous work.

4.1. The Local and Nearby Universe

4.1.1. Concept of a Representative Galaxy

If the number of galaxies in a group is small, the largest members are few but dominate the total luminosity, thus governing the total mass. This situation describes groups with up to ~1000 galaxies, i.e., the LG and VC. For large volumes of space, Andromeda-sized galaxies (or slightly larger) reasonably represent the mean galaxy, if observational limitations are considered in evaluating the PDFs and CDFs of Figure 9, Figure 10, Figure 11, Figure 12 and Figure A11. The statistically significant collections of nearby galaxies, i.e., within 25 to 30 Mpc, which are not greatly affected by the detection minima, clearly have log-normal distributions (Figure 11). These show that 2.63 × 10¹⁰ L/Lsun describes representative galaxies in the local Universe (Table 2). This average and all other values for L/Lsun in Table 2 are similar to Andromeda’s luminosity (3.19 × 10¹⁰ L/Lsun).
Hence, Equations (5) to (7), based on Andromeda’s RC, are used below to assess baryonic density and mass in and around a representative galaxy in the nearby universe. This approach is reasonable because (1) Andromeda is the best-studied object, (2) RC analyses for large spirals in the VC (Section 2.2.3) yielded similar formulae for objects occupying the larger range of 1.8 × 10¹⁰ to 4.5 × 10¹⁰ L/Lsun [38], and (3) given observational data (Table 1) especially on IGM [76,77], this approach sets a lower limit on the mass and density of baryons in the present-day universe.

4.1.2. Density and Number in the Volume Surrounding a Representative Galaxy

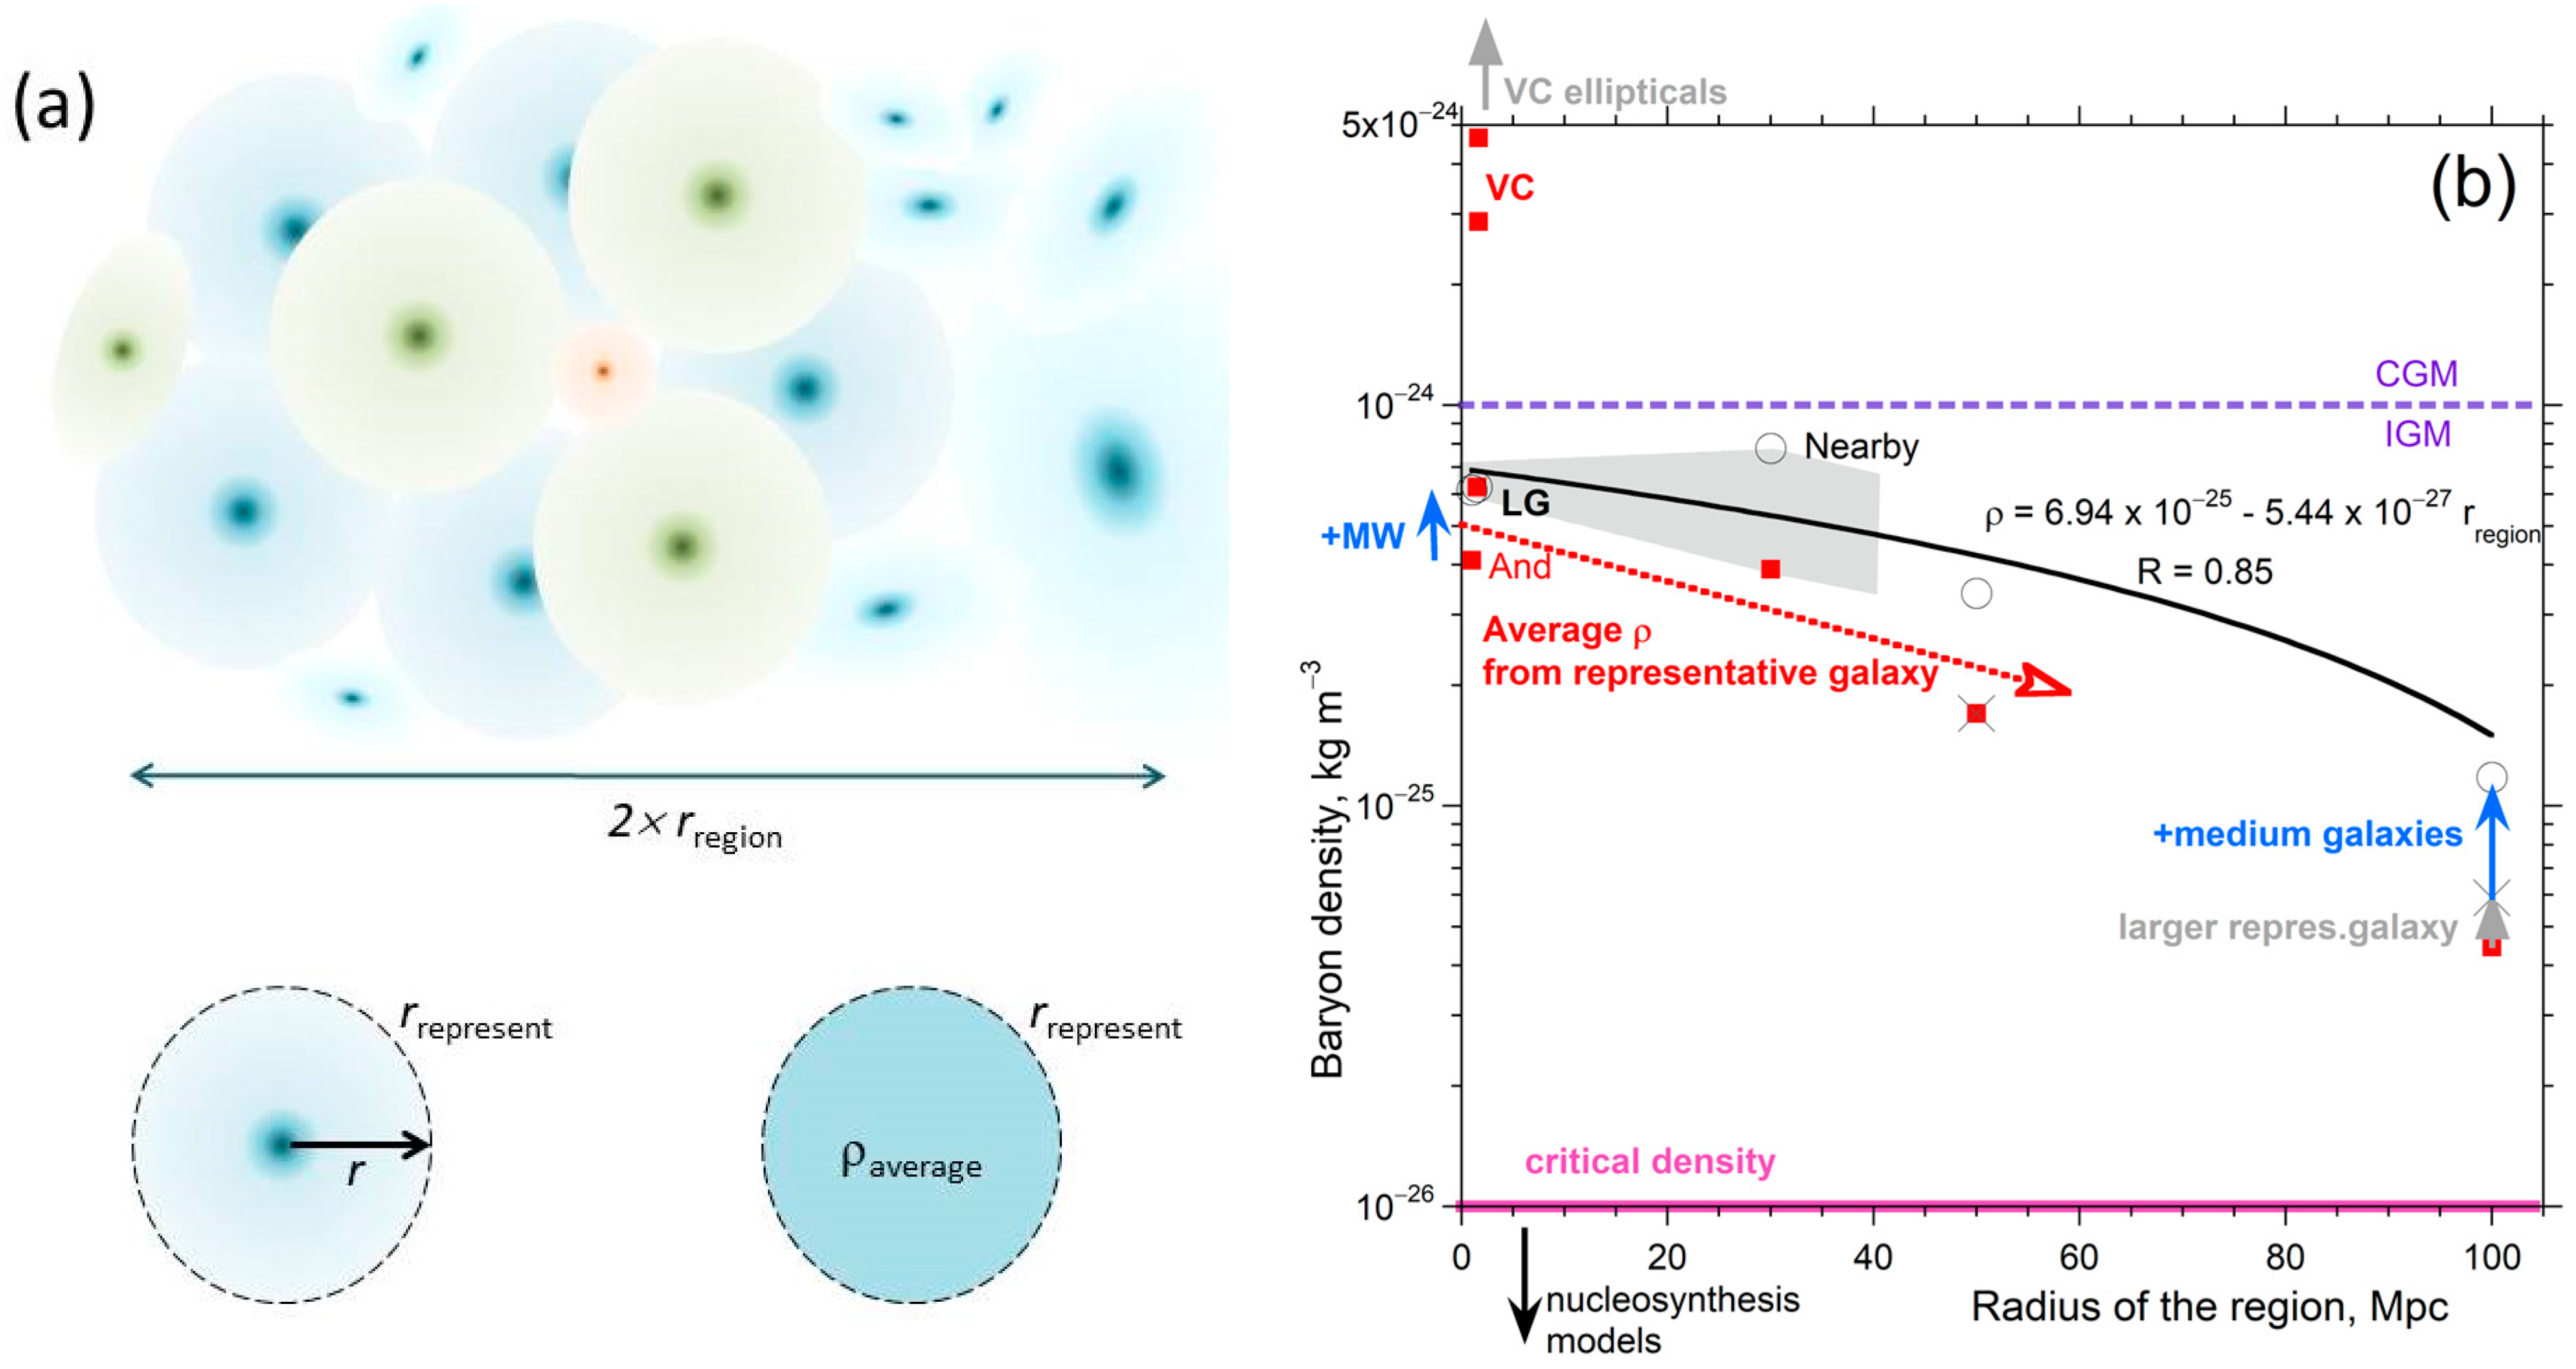
Equation (5) depicts gradation of gas from a representative galaxy first into the immediate surroundings, forming an atmosphere (CGM), and then to great distance, until the next galaxy is encountered, composing IGM. The density of the IGM in surroundings so computed depends on galaxy separation, which defines the volume of IGM associated with each representative galaxy, as illustrated in Figure 15a.
Considering spherical volumes for the galaxy and its surrounding media and close packing, the radius depicting the surroundings of a representative galaxy is
r representative = r region N large 3
where Nlarge is the number of large galaxies in the region with radius rregion: Nlarge is not the total number, because small galaxies fit into the holes between large galaxies (Figure 15a). For simplicity, Equation (8) assumes equal sizes. Small galaxies hidden among large (Figure 15a) is analogous to the geometrical relations in crystal structures that are composed of small cations and large anions (e.g., Si4+ is tetrahedrally coordinated in silicate minerals because it is tiny and fits in the central hole defined by four large O2−).
From Equation (5) for Andromeda and the MW, including their CGM and IGM,
  ρ average = 3 b r representative 2   where   b = 3 × 10 19 kg   kpc 2 / m 3  
The total mass within rrepresentative is
M total = 4 π b r representative
Equation (10) differs from the dependence of mass on r3 expected for constant ρ because density depends on r in Equation (5) and on rrepresentative in Equation (9). Both Equations (5) and (9) describe a limited size range of galaxies, those within ~1–2 times Andromeda’s luminosity or mass (see Appendix A and [38]).
Because constant density is observed at the visible edge, we propose the following modification when the representative galaxy is unlike Andromeda:
ρ average = 3 b r representative 2   ( r edge r edgeAnd ) 2 ;   i . e . ,   ρ average = 3 b r representative 2 ( L representative L Andromeda )
Integrating the left-hand side of Equation (11) from rrepresentative = 0 to redge provides the total mass within the visible area, which result is proportional to redge3. This prediction is nearly met in Figure 5b.
The radius ratio being squared in Equation (11) is a consequence of luminosity being related to area, and that the detection of light requires a minimum density, demonstrated by our inverse model of RC as being 10−21 kg m−3 (Figure A1, Figure A2, Figure A3, Figure A4, Figure A5, Figure A6, Figure A7, Figure A8 and Figure A9). The RHS of Equation (11) is useful and is supported by plotting data tabulated in the Appendix A and by [38]. This trend (not shown) and that in Figure 5b cover many orders of magnitude, suggesting that using Equation (11) to extrapolate to representative galaxies larger than Andromeda is reasonable. Yet, this correction is small, i.e., a factor of 1.4 for the 250 Mpc volume. Table 3 lists ρaverage for the various regions, as shown in Figure 15b.
Importantly, Equations (8) to (11) represent the contribution of a single isolated galaxy to the baryonic mass (IGM, CGM, interior gas, and stars) inside the representative volume. Considering isolated galaxies is reasonable because Andromeda and the MW are closer together than rrepresentative yet have RC similar to isolated galaxies probed in [38]. These computations provide a minimum ρ for several reasons:
  • Neglecting mass concentrations within 1 kpc of galactic centers (and possible central blackholes) would provide a small addition.
  • IGM is underestimated from Equation (5), given the results from [76,77] in Table 1. Furthermore, IGM between neighboring galaxies will blend, giving somewhat higher ρaverage than computed, but blending is difficult to quantify.
  • In contrast, the potentially significant contributions of the smaller galaxies within rrepresentative can be ascertained from the PDFs and CDFs (Section 4.1.2).
  • More importantly, rrepresentative from Equation (8) is overestimated, as this depends on the number observed, which is strongly attenuated as distance increases beyond ~30 Mpc. This is the main reason that ρaverage in Table 3 for large distances is underestimated.
The actual values of rrepresentative as a function of distance are difficult to estimate due to undetected galaxies. Most likely, the space enclosing a representative galaxy at great distance has rrepresentative = 1 to 1.5 Mpc as deduced for galaxies with redshift-independent distances (within ~30 Mpc) and supported by radii of the LG and VC. Consequently, our best estimate for the baryonic density in the present-day universe is 6.2 × 10⁻²⁵ kg m−3 from the LG.

4.1.3. Effect of Small Galaxies and Count on the Average Mass Density

The various regions must be considered individually in accounting for small galaxies. Thus, entries in the right most column of Table 3 are discussed from the top to bottom rows.
The small galaxy contribution is ascertained from the PDFs and CDFs. This additional mass is divided by the volume enclosing the representative galaxy. Because the same volumes as in Equation (9) are considered, densities sum.
The Local Group mass is well constrained (Figure 9b). If MW and Andromeda are both considered as representative, then Equation (9) suffices. If only Andromeda is considered as representative (it has ~4× the mass of the MW), then mathematically dispersing the MW is appropriate, but no further corrections are needed, because the remaining summed mass is tiny. The two approaches agree (Table 3, Figure 15b).
The Virgo Cluster has 4 huge ellipticals, in addition to 21 (mostly) spirals with L similar to Andromeda (Figure 10a). Equation (9) underestimates density, possibly substantially. The best estimate from Equation (9) is ρaverage = 5 × 10⁻²⁴ which counts all galaxies with L > 1010 Lsun. This case accounts for smaller galaxies since those similar to the Milky Way are counted. Similar values are obtained by considering larger mass contributions of the four ellipticals (Table 3). The high density of the Virgo Cluster is unlikely to represent ρ of baryons in the universe, but this exercise confirms that accounting for galaxies similar in mass to the MW is needed for an accurate inventory.
For the larger regions explored using the NED database, resolution limitations reduce the detectable number of galaxies with luminosity similar to that of the MW. Resolution, thus, influences determination of Nlarge and of the volume associated with a representative galaxy.
Within 50 Mpc, spiral galaxies dominate the database, yet spirals are a small fraction of those detected beyond 100 Mpc (Figure 13 and Figure 14d). From the mid-point in the CDF, roughly half of the mass inside rrepresentative is not accounted for. Because Equation (9) is based on the average galaxy for the large volumes, we doubled the average densities from Equation (9) for distances of 30 and 50 Mpc to account for galaxies with sizes similar to the MW (Table 3, Figure 15b).
For galaxies up to the distance of 250 Mpc (Figure 12), the average galaxy has a luminosity 1.3× greater than Andromeda. Within 100 Mpc, this factor is lower (~1.15×); thus, Equation (9)’s contribution is increased by these factors (Figure 15b), along with the adjustment for “missing” galaxies. The estimated ρ (Table 3, rightmost column) at 100 Mpc is still low, but is included in the fit in Figure 15b to gauge uncertainties. From Figure 14, the distance 250 Mpc is severely impacted by “missing” galaxies; hence, the associated estimate in Table 3 is used for comparison only.
Table 4 compares the accurate value for the LG to that of the larger volume described by galaxies with distances measured independent of redshifts, up to 30 Mpc. These agree, within uncertainties.

4.1.4. Baryon Inventory with and without IGM

Although our calculations set a minimum on baryon density (Section 2.2.6 and Section 4.1.2), our values are much larger than previous estimates (Section 1). Because our calculation of the mass of galaxies and their atmospheres (GCM) from their organized rotational motions (Section 2) is the most robust part of our inventory, we now isolate this contribution, as described in the footnote to Table 4, and we list the baryonic density inferred from the stable rotations of galaxies in the rightmost column in Table 4.
Regarding the Local Group, Andromeda and the Milky Way carry virtually all the galactic mass, but this contribution is small compared to the IGM. Larger regions behave likewise. Although IGM is rarified (Equation (5); Table 1), these regions within the representative volume are vast and, thus, store much of the local universe’s baryons.
In addition, models indicate that unconsolidated gas exists as filaments surrounding galaxy clusters and superclusters [85]. Their contribution is not included in Table 4 because it cannot be quantified on the basis of existing observations. Again, we provide the minimum baryon density for the local universe from galactic dynamics.

4.2. Extrapolation of Trends to 1000 Mpc

The trends for resolution, average luminosity, and maximum luminosity (excluding the outliers, which have AGN) in Figure 13 all coalesce near 1000 Mpc to a value of 3 × 10¹¹ L/Lsun. This same value describes measurements near 1000 Mpc (Figure 8).
The number of detected galaxies depends linearly on the regional radius (not shown) yielding 38,400 and an associated rrepresentative = 30 Mpc inside ~1000 Mpc. At great distance, only very large galaxies are seen sporadically, which greatly affects evaluations.
From CDFs (Figure 12), these giant galaxies represent 2% of the detectable luminosity and, thus, ~2% of the detectable mass. The remaining 98% is derived on average by Andromeda-sized galaxies. Thus, Equation (9) provides a reasonable first approximation. From Figure 12, ~100 large galaxies are contained in a volume with radius of 33 Mpc; hence, rrepresentative within 1000 Mpc is actually below 7 Mpc, yielding ρaverage = 1.8 × 10⁻²⁶ kg m−3 (Table 3).
The average observed galaxy near 1000 Mpc appears to be 10× more luminous than Andromeda; thus, the average density should be larger, 1.8 × 10⁻²⁵ kg m−3, given Equation (11). This 10× increase (Table 4) is minimal because a very large number of galaxies with L~109 to 1010 Lsun exist within 7 Mpc of a representative galaxy, but were not accounted for. Again, as distance increases, the minimum size of detection increases while the volume sampled increases; thus, only the high-end PDFs are sampled.
The trend of ρ with distance is consistent (Table 3). However, given the many missing galaxies at great distance, density deduced within 1000 Mpc by extrapolation is greatly underestimated and uncertain; thus, it is not reported in Table 4.

4.3. Galaxy Count Estimates for the Universe

Conselice et al. [80], using an evolutionary model, deduced that 2 × 10¹² galaxies are present within a distance corresponding to redshift of 8, a result that yields a small value for rrepresentative (Table 3). To utilize their count, we need to estimate M or L of their average galaxy. The average was not specified in [80], as the models used for the distribution function of galaxies at various z values incorporate evolutionary models for the size of galaxies. Applying a mass distribution function to the Hubble ultradeep field image gave N = 2.5 × 10¹¹, which, within uncertainties of the models, agrees with previous efforts and their evolutionary calculation [80].
A range of average sizes can be deduced from information in [80]. Star masses in the galaxies were considered to range from 106 to 1012 Msun, with a characteristic mass occupying the narrower range of (0.2 to 4) × 1011 Msun. The ratio M/Msun = L/Lsun was assumed, which neglects gas probed in RC measurements and CGM. From Figure 7a, the span of characteristic star masses used in [80] corresponds to visible edge (gas and star) masses of (0.5 to 8.6) × 1011 Msun. Because Equation (9) holds for visible edge masses within a factor of 2 for Andromeda, i.e., from (0.7 to 1.4) × 1011 Msun, this equation to a first approximation applies to the count in [80], yielding a high density (Table 3).
As discussed above, separation of galaxies is crucial in determining ρ. For an alternative estimate, we consider Figure 9 and Figure 10, which show that the number of galaxies between ~106 and 1010 Msun (visible edge values) in the LG and VC range from ~10 to 30 times the number of large galaxies. Using 1010 Lsun as the division points to 20:1 describing the ratio for the number of small to the number of large galaxies in the estimate of [80]. Thus, Nlarge reduced to ~1011 should be used in Equation (8). This yields larger rrepresentative of 2 Mpc, which is similar to that of the nearby universe and sets a lower limit on density (Table 3 and Table 4).

4.4. Calculation of Universe Mass and Density from an Energy Balance

As pointed out by Criss and Hofmeister [86], the energy binding a test particle to the universe of mass MU, which is its gravitational potential energy, must be equal to the energy associated with its rest mass m0. It follows that
G M U m 0 r U = m 0 c 2
where rU is the effective radius of the universe. Furthermore, rU = c/H, where H is Hubble’s constant, currently taken as 2.3 × 10⁻¹⁸ s−1. Its inverse is the age of the universe in an expansionary model. Combining the above simplifies Equation (12) to
M U = c 3 G H = 1.8 × 10 53 kg
Interestingly, this mass approximates an Avogadro’s number of Suns.
The average density of a gravitational mass requires a volume, which we assume is spherical. The speed of light sets rU for the current assessment of a 13.8 billion year age of the universe. Combining the above gives
ρ = 3 H 2 4 π G   or   H 2 = 4 3 π ρ G
and provides ρ of about 2 × 10⁻²⁶ kg m−3 (Table 4).
Density computed from our energy balance depicts containment of all the universe’s gravitating mass in a spherical volume. However, our value (Table 4) clearly depends on the value of the Hubble constant, which in turn depends on cosmological models that describe an expanding universe.

4.5. Estimates of Critical Density

Critical density can be estimated in several ways.
Equation (14) offers one evaluation of the escape velocity of the Universe, because conversion of the test particle to light permits it to escape the self-gravitating universe from a classical perspective.
If instead, the test particle is considered to attain light speed, escape velocity is reduced from that of Equation (12) by a factor of 2. Using ½moc2 to estimate critical density matches the expansionary calculation (Table 4), which in essence assumes that the edge of the universe is expanding at light speed. The match occurs also because both approaches utilize rU = c/H.
All three estimates interpret redshifts as Doppler shifts. If the Zwicky’s alternative interpretation of tired light is correct, then a different approach is needed to estimate rU, but is beyond the scope of this report.

5. Discussion

5.1. Uncertainties in Our Estimates

5.1.1. Calculations Based on Rotation Curves and the NED Database

Equation (9) is based on rotation curves of Andromeda accurately representing its dynamics. This fit (Figure 3) describes r > 1 kpc, where extraction of tangential velocities is most accurate [29] and is supported by analysis of a wide variety of galaxy types and sizes [38] (see Figure 3, Figure 4 and Figure A1, Figure A2, Figure A3, Figure A4, Figure A5, Figure A6, Figure A7, Figure A8 and Figure A9). Uncertainties in ρ from using Equation (9), or as modified in Equation (11), are negligible compared to those arising from estimating the number of galaxies, which are minima because resolution changing with distance reduces the count, affecting spirals more than the lenticular and elliptical morphologies.
As shown here and previously, small galaxies accompanying those much larger in an assembly hardly affect the total mass in any given volume. Hence, our not counting those with <109 Lsun has a negligible effect. Figure 15a corroborates that N must be based on large galaxies. Figure 13 and Figure 14 show that the population of medium sizes, first those with 109 Lsun, and then those with 1010 Lsun, decreases with distance. The count by 50 Mpc is impacted, and reduction in MW-sized galaxies is significant by 100 Mpc. Hence, densities are increasingly underestimated as distance of the observations increases. Due to the systematic nature of this error (Figure 13 and Figure 14; Table 3), considering the nearby universe is required for accuracy, yielding our best constrained density of 6.2 × 10⁻²⁵ kg m−3 for the LG, which is bracketed by our estimates at ~30 and 50 Mpc (Table 4).
Regarding use of the NED database, our PDFs and CDFs resemble those for galaxies used by Schecter [86], whose 1976 formulation underlies much work, including the 2016 large redshift galactic count [80].
Our distribution functions differ somewhat from those used by Salucci and Persic [5] in their inventory. In part, their number of galaxies is under the count of ~2000 needed for robust statistical analysis. A larger number of galaxies follow log-normal distribution functions (Figure 11), which underlies our construction and results.

5.1.2. Calculation Based on Models of Galaxy Count

Recent evaluation of the number of galaxies in the universe up to what can be observed [80] involves models for the distribution of galaxies and their evolution with time. Accurate counting depends on assumptions underlying the assumed mass functions. Mass functions used by [80] (their Figure 1) depict log(r−3 mag−1) as proportional to log(Mstar). Due to the properties of logarithms, specifically that log(X) requires that X is dimensionless, their graphs actually depict log(M−2) vs. log(M), where the constants are lumped.
  • The curves shown in [80] are consistent with the parabolic form implied by the above dimensional analysis, but their shape is unrelated to any dependence of M on distance.
The difficulty with all such models is that fits of any physical measure of a galaxy cannot be accurately determined at great distance without addressing resolution effects. Thus, N of [80] is model-dependent and affected by resolution. We attempted to address the resolution. Our estimate of Nlarge for the larger galaxies using their model underestimates ρ, while reported N [80] overestimates ρ of the universe (Table 4). If instead their alternate value from Hubble of N = 2.5 × 10¹¹ is considered, the implied density would be ~½ the Universe count in Table 4, which remains compatible with our values.

5.1.3. Energy Balance Calculation and Critical Densities

Uncertainty in the Hubble constant (or equivalently in the age of the Universe) controls the numerical results of Equations (13) and (14). Since the original estimate of Hubble, deduced values of H have decreased by a factor of 10, and H is still changing as the number and quality of observations increase. Because H depends on distance calibrations, this estimate is affected by accuracy of distances determined independently of the redshift. Assessing the uncertainty in H and discussing redshift data are beyond the scope of the present paper.

5.2. Inventoried Density of Baryons in the Universe

5.2.1. Previous Inventories Underestimate Baryon Density

As discussed in Section 1, problems in evaluating IGM density are known and motivated many modeling and absorption studies of IGM. However, recent studies of the baryon inventory [1,2,3,4,5,6,7,8,9,10,11,12,13,14,15,16,17] still fall 30–40% below Big Bang nucleosynthesis values for baryon densities ~3 × 10⁻²⁸ kg m−3 [84].
Importantly, previous inventories did not account for CGM. That of [5] is based on M/Msun = L/Lsun and, thus, largely depicts star mass. Although some have tried to add other contributions (e.g., [6]), neglecting the immense contribution of CGM from Andromeda-sized galaxies to mass and density explains the origin of the low densities in the previous estimates.
The authors of [5] and, thus, [6] assumed that non-baryonic dark matter (NBDM) is a major galactic constituent in multicomponent fits to RC measurements (Section 2). Hence, previous inventories have replaced ISM and CGM with NBDM, via assuming spherical symmetry (Section 1.1.1), while neglecting IGM. Previous inventories improperly account for hydrogen gas in the universe, which is its major constituent.
Other assessments exist. These use the pdf of [87] which does not account for the size of the smallest galaxy that can be observed depending on its distance squared. For example, Yasuda et al. [88] deduced from observations extending to ~100–200 Mpc that luminosity is (2.4 ± 0.6) × 108 Lsun per Mpc3 (where we include the 7% uncertainty in their fitting parameter h). From Table 3, our count and average L are ~20 × 108 Lsun per Mpc3, using data out to 50 MPc, which are insignificantly affected by the minimum L required to detect a galaxy. Because the minimum L increases with distance squared (Figure 13), consistent with the angle subtended (Section 3.4.1), the results of [88] and other previous work greatly underestimated L per volume, thus underestimating baryon density.

5.2.2. Comparison of Our Results to Cosmological Models for Baryons

Cosmological models indicate baryon densities of ρcosmo ~3 × 10⁻²⁸ kg m−3 [84]. Recent modeling studies used 40% larger values [10]. Our inventories give much larger ρ (Table 4). Our energy balance calculation (Section 4.4) is 30-fold lower than the inventories of hydrogen in gas and stars. From the classical viewpoint that the universe’s gravitation is defined by mass, not energy, the energy balance calculation is also an estimate of the critical density. In using Hubble’s constant, this estimate describes an expanding, rather than a gravitationally stable universe. The critical density so obtained is, thus, underestimated.
The other estimate independent of our analysis of galactic mass and luminosity utilized models for the number of galaxies up to z = 8 (Section 4.3). This calculation exceeds ρcosmo even if N is reduced by a factor of ~100 (Table 4). This model-based estimate is uncertain (Section 5.1.2), but supports our gravitational assessments, even if their 10-fold lower count from Hubble images is used (Table 3) and confirms that previous observational inventories [5,6] err.
Our most accurate densities, involving galaxies with distances measured independent of redshifts, exceed Big Bang nucleosynthesis models [84] by a factor of 2000 (Table 4). Given the uncertainties associated with the diverse calculations presented here, this discrepancy is significant.
Lastly, even our calculation of baryon density without IGM (Table 4, right side) exceeds the Big Bang nucleosynthesis estimate. Given the vastness of IGM and gas possibly existing without a connection to galaxies, the universe has far more baryonic matter than the 20 year old surveys deduced.

6. Conclusions and Implications

The current view of a shortage of inventoried baryons in the universe is not due to IGM being hot and its density underestimated, but instead largely rests on a flawed model of galactic rotation, which assumes ad hoc that NBDM halos control galactic dynamics (Section 1). The consequence is a popular multicomponent fitting approach that neither addresses baryons stored in galactic atmospheres (CGM) nor accounts for the vast volumes of space (IGM) with very low density (Section 2 and Section 5.2), and that does not actually need baryonic matter to fit RC data (Section 1.1.1). Moreover, no direct evidence exists for NBDM, despite decades of searching for observational confirmation, as well as independent attempts to find supportive data from high-energy physics experiments [32,33].
Accounting for non-spherical shapes of galaxies in recent analyses of their dynamics yields larger baryon mass associated with galaxies and their surroundings than that incorporated in previous inventories. As shown in three mathematically distinct inverse models of Newtonian forces arising in the non-spherical shapes of galaxies, NBDM is not needed to explain galactic rotation (Section 1.2 and Section 2.2.2). Analytical formulae for the internal gravitational potential associated with the oblate shape provide density of the vast CGM shown in Figure 1 that agrees with independent measures of baryonic ρ, confirming that spirals are surrounded by ordinary non-luminous matter, which is consistent with Zwicky’s circa 1933 proposal.
On the basis of Occam’s razor, the simplest model is most likely correct. All three Newtonian inverse models make no special assumptions about the nature of matter in and around galaxies. These utilize no unconstrained parameters, do not require massive amounts of hypothetical NBDM, and do not require altering Newton’s law of gravity (MOND [34,35]), as variously assumed in the currently popular fitting models. Because the oblate spheroid is the stable gravitational shape of rotating bodies, the single, analytical equation summarized in Section 2 provides the simplest and most direct means of extracting mass from galactic rotation curves. Furthermore, Equation (4) permits extrapolation beyond the limiting radius of measurements. Applying Equation (4) to the extensive RC datasets from the best-studied galaxies (Andromeda, the Milky Way, and many Messier spirals) yielded Equation (5) and, ultimately, our results in Table 4.
On the basis of the scientific method, after Popper, a viable model must be robust against refutation. Failure to detect NBDM almost 50 years after its proposal, despite numerous and expensive observational and experimental efforts, refutes the multicomponent fitting models, as well as the low density of baryons in the universe stemming from these fitting models. In the scientific method, one model cannot be used to prove another; hence, proving that NBDM exists requires detection, not another model.
Our calculations provide densities of baryons in the universe (Table 4) that significantly exceed cosmological estimates for baryons. This result is supported by a calculation based on an estimate of the number of galaxies in the universe, which is independent of RC data. Our energy balance determination of ρ is also independent of RC analysis, but rests on the Hubble constant, thus returning the cosmological critical density. As discussed in Section 4.4 and Section 5.2.2, the critical density is low because an expanding universe, not a gravitationally stable universe, is assumed.
Much effort has been expended to understand expansion suggested by the redshifts. Yet, formation of astronomical objects requires contraction. Diverse length scales pertain to contraction because stars compose galaxies, galaxies compose clusters, and clusters compose super-clusters. Super-clusters may compose the universe. Although much evidence exists for contraction governing the observable universe, great uncertainties accompany exploring great distances and the past, due to resolution effects (Section 3). Our most accurate estimate of baryon density (6.2 × 10⁻²⁵ kg m−3 from our gravitationally based calculations: Table 4) suggests that baryons suffice to slow the expansion. Given the uncertainties, contraction may be possible.
The conflict between uniformitarianism and catastrophism is well known, because creation requires a unique event in time, whereas uniformitarianism requires that processes ongoing today apply to the distant past. Today’s universe could be quasi-steady-state, given limitations in observational data and contraction consistently providing objects on diverse scales over all observable parts of the universe. Evolution is very slow under quasi-steady state. Because galaxies resembling those nearby are observed over immense scales, the beginning is obscured. This conundrum lies at the heart of all creation proposals.

Author Contributions

Conceptualization, A.M.H.; methodology, R.E.C.; luminosity database construction, H.C.; validation, A.M.H. and H.C.; writing—original draft preparation, A.M.H.; writing—review and editing, R.E.C. All authors have read and agreed to the published version of the manuscript.

Funding

This research received no external funding.

Data Availability Statement

All data used are either from previous publications or are publicly available.

Acknowledgments

The authors thank the reviewers for providing critical commentary which led to improving the manuscript.

Conflicts of Interest

The authors declare no conflict of interest.

Appendix A

Additional histograms on luminosity and analyzed rotation curve for different galaxy types from the Local Group and the Virgo Cluster, with a summary table, are shown below. The focus is on the larger galaxies in the LG. A few of these examples were previously published [38]. Fits were used here to reduce the effect of scatter in v(r) on density. Table A1 lists results for LG members examined, and includes new analyses of seven objects, mostly spirals.
Figure A1. Analysis of three RC datasets on Triangulum: (a) mass; (b) density, both vs. radius for c/a = 1/10. RCs from Kam et al. [89] (pink crosses) were used to calculate mass (red diamonds), but not density, due to the scatter. RCs of Sofue [90] (black dashed line) were used to calculate mass (turquoise dotted line) and density (blue dotted line). RCs of Corbelli and Salucci [91] (black points with error bars) were used to calculate mass (medium dashed line) and density (circles and solid line). Agreement is good and the masses extracted are similar. The fit to ρ is over all r of [91]. Modified after Criss and Hofmeister [38], which has a Creative Commons License.
Galaxies 11 00100 g0a1
Figure A2. Smaller galaxies in the LG that are not satellites: (a) spiral near the edge. RC data from Bottema and Pestaña [72]. (b) WLM is unusual due to its isolation in the LG. RC from Leaman et al. [92]. Two fits are shown. Modified after Criss and Hofmeister [38], which has a Creative Commons License.
Galaxies 11 00100 g0a2
Figure A3. Analysis of dwarf satellites in the Local Group, where density was calculated after fitting Min(r), to reduce the effect of scatter in velocity: (a) Fornax, one of the largest dSph orbiting the Milky Way. RCs presented by Salucci et al. [93] were digitized. Original data from Walker et al. [94,95] and Mateo et al. [96]; (b) compact dwarf elliptical M32. RC from Howley et al. [71]. Min ratioed to 106 MSun. Omitting negative densities makes these regions appear to have higher density. Modified after Criss and Hofmeister [38], which has a Creative Commons License.
Galaxies 11 00100 g0a3
Figure A4. Very small galaxies distant from the MW. RC data from two of the four irregulars studied by Oh et al. [97]: (a) IC10. RC curves with widely spaced and scattered velocities requires fitting v to a function of r to best represent density; (b) IC 1613. Although velocities show scatter, points are closely spaced; hence, fits to Min accurately describe density.
Galaxies 11 00100 g0a4
Figure A5. Small galaxies distant from the MW: (a) NGC 6822. RC data from Weldrake et al. [98]; (b) And IV, a small galaxy with low luminosity, which is 7.2 Mpc distant and not a satellite of Andromeda. RC from Karachentsev et al. [99]. For both, density varies rather little with radius and the trend is best represented by exponential decline.
Galaxies 11 00100 g0a5
Figure A6. Largest and smallest satellites of the MW for which RC are available: (a) Large Magellanic Cloud. RC data from Alves and Nelson [100], based on >400 carbons stars; (b) Ursa Minor. RC from [93,94,95,96] (see Figure A3). Widely spaced points require fitting results for mass to best represent the density.
Galaxies 11 00100 g0a6
Figure A7. Two satellites of Andromeda where RC data were determined by Geha et al. [101]: (a) NGC 147. Data are inside the visible edge; (b) NGC 185. Coverage is more extensive, yet density changes little.
Galaxies 11 00100 g0a7
Figure A8. Spirals in the VC for which RC data [23] were determined far inside the visible edge, which is ~8.5 kpc for both): (a) NGC 4402; (b) NGC 4419. With closely spaced points, densities are constrained, but represent inside the objects.
Galaxies 11 00100 g0a8
Figure A9. More spirals in the VC. RC data from Sofue et al. [23]: (a) NGC 4535, determined well inside the visible edge; (b) NGC 4536, where RC data reach the visible edge.
Galaxies 11 00100 g0a9
Figure A10. Spirals in the VC where RC data [23] were determined inside the visible edge: (a) NGC 4654; (b) NGC 4689.
Galaxies 11 00100 g0a10
Table A1. Properties of galaxies in the Local Group extracted from rotation curves, except that morphology, luminosity, and visible edge data were taken from NED.
NameTypeRef.
RC
Lvis
(LSun)
redge
(kpc)
Medge
(MSun)
Density
(kg m−3)
Lowest ρ
(kg m−3)
Powerrmax
(kpc)
Mmax
(MSun)
Milky Way *SBc[64,65]~1.7 × 1010157.5 × 1010~3.0 × 10⁻²⁴−2.06~330~4.5 × 10¹¹
Andromeda *SA(s)b[64]3.19 × 1010231.41 × 10114.29 × 10−222.0 × 10⁻²⁴−2.114401.30 × 1012
Triangulum *SA(s)cd[86,90,91]3.65 × 1099.451.36 × 10101.00 × 10−218.0 × 10⁻²²−1.57152.96 × 1010
NGC 3109 *SB(s)m[72]2.51 × 1086.352.77 × 1099.00 × 10−227.0 × 10⁻²²−0.866.623.08 × 109
Sextans AIBm[102]3.58 × 1071.251.20 × 1086.80 × 10−215.0 × 10⁻²²−2.203.433.64 × 108
Sextans BIBm[102]5.69 × 1071.126.44 × 1078.80 × 10−211.0 × 10⁻²²−1.474.008.26 × 108
WLM *IB(s)m[92]5.83 × 1071.88.00 × 1079.20 × 10−231.4 × 10⁻²³−1.083.19.47 × 107
IC 10IBm[97]5.53 × 1090.755.64 × 1073.00 × 10−211.0 × 10⁻²¹−0.800.747.00 × 108
IC 1613IB(s)m[97]7.06 × 1072.325.80 × 1067.00 × 10−221.0 × 10⁻²²−0.942.77.67 × 107
DDO 210dIrr[97]1.39 × 1070.36.56 × 1051.00 × 10−221.0 × 10⁻²²−3.600.336.56 × 105
DDO 216Im/dSph[97]3.93 × 1071.21.72 × 1074.00 × 10−224.0 × 10⁻²²−2.161.201.72 × 107
NGC 6822IB(s)m[98]1.03 × 1083.326.70 × 1082.00 × 10−215.0 × 10⁻²³−0.675.801.80 × 109
Satellites of the Milky Way
LMCSB(s)m[100]1.31 × 1094.933.10 × 1091.80 × 10−211.39 × 10⁻²²−1.279.007.39 × 109
SMCSB(s)m pec[103]3.95 × 1082.896.77 × 1081.00 × 10−214.0 × 10⁻²⁴−1.143.909.17 × 108
Carina *dSph, dE3[93]2.95 × 1050.453.38 × 1066.50 × 10−221.4 × 10⁻²²−1.590.886.88 × 106
Draco *dSph, Epec[93]2.95 × 1050.603.40 × 1061.00 × 10−211.3 × 10⁻²²−1.581.784.10 × 107
Fornax *dSph, dE4[93]1.30 × 1071.421.20 × 1071.00 × 10−212.0 × 10⁻²³−1.561.651.27 × 107
Leo I *dSph, dE3[93]4.99 × 1060.437.74 × 1061.00 × 10−211.8 × 10⁻²²−0.850.951.26 × 107
Leo IIdSph/dE0[93]4.67 × 1050.4261.53 × 1065.47 × 10−235.47 × 10⁻²³−2.10.451.54 × 106
SculptordSph[93]1.50 × 1060.781.02 × 1072.90 × 10−242.9 × 10⁻²⁴−1.01.067.24 × 106
SextansdSph[93]3.07 × 1051.04.30 × 1063.71 × 10−233.71 × 10⁻²³−2.41.004.30 × 106
Ursa MinordSph/dE[93]1.84 × 1050.424.67 × 1062.87 × 10−221.64 × 10⁻²²−2.10.749.35 × 106
Satellites of Andromeda
M32 *cE2[71]2.61 × 1080.851.5 × 1071.0 × 10−221.0 × 10⁻²²−2.000.851.5 × 107
NGC 147dSph/dE3[101]1.21 × 1081.622.92 × 1071.0 × 10−221.13 × 10⁻²¹−0.552.163.77 × 107
NGC 185dSph/dE5[101]9.27 × 1071.354.57 × 1077.5 × 10−221.20 × 10−2101.354.67 × 107
Small, low surface brightness, extensive RC
And IVdIrr[99]2.08 × 1070.944.21 × 1071.09 × 10−201.11 × 10⁻²²−1.47.31.62 × 109
Virgo Cluster
NGC 4402Sb[23]3.57 × 1098.618.41 × 1094.84 × 10−212.00 × 10⁻²²−1.414.308.41 × 109
NGC 4419SB(s)a8.11 × 1098.771.35 × 10101.40 × 10−201.40 × 10⁻²⁰−1.223.411.35 × 1010
NGC 4535SAB(s)c1.87 × 101017.904.65 × 10102.55 × 10−212.80 × 10⁻²²−1.7211.64.65 × 1010
NGC 4536SAB(rs)bc1.33 × 101016.593.63 × 10105.0 × 10−231.00 × 10⁻²³−1.817.23.76 × 1010
NGC 4654SAB(rs)cd1.27 × 101011.423.90 × 10101.06 × 10−203.92 × 10⁻²²−1.17.603.90 × 1010
NGC 4689SA(rs)bc9.16 × 10911.941.41 × 10101.0 × 10−203.8 × 10⁻²¹−1.694.001.41 × 1010
* Analyzed by [38]. For several of these galaxies, RCs are noisy; therefore, we first calculated Min(r), then fit these results, and then calculated density. Assumed to be 10−21 kg m−3.
Figure A11. Histograms of galactic luminosities downloaded from NED [26], excluding those with Hubble distances >250 Mpc, but including those without reported Hubble distances. A few huge objects are off-scale, but the statistical insets pertain to the entire population: (a) ellipticals; (b) lenticulars, mainly S0 and S0/a types with lesser Sa, Sb, and Sc; (c) spiral types SA, SAB, and SB shown individually; (d) all spirals, shown on a logarithmic x-axis.
Galaxies 11 00100 g0a11

References

  1. Nicastro, F.; Kaastra, J.; Krongold, Y.; Borgani, S.; Branchini, E.; Cen, R.; Dadina, M.; Danforth, C.W.; Elvis, M.; Fiore, F.; et al. Observations of the missing baryons in the warm–hot intergalactic medium. Nature 2018, 558, 406–409. [Google Scholar] [CrossRef] [PubMed]
  2. Shull, J.M.; Smith, B.D.; Danforth, C.W. The baryon census in a multiphase intergalactic medium: 30% of the baryons may still be missing. Astrophys. J. 2012, 759, 23. [Google Scholar] [CrossRef]
  3. Kirkman, D.; Tytler, D.; Suzuki, N.; O’Meara, J.M.; Lubin, D. The cosmological baryon density from the deuterium-to-hydrogen ratio in QSO absorption systems: D/H toward Q1243+3047. Astrophys. J. Suppl. Ser. 2003, 149, 1–28. [Google Scholar] [CrossRef]
  4. Bregman, J.N.; Lloyd-Davies, E.J. X-ray absorption from the Milky Way halo and the local group. Astrophys. J. 2007, 669, 990–1002. [Google Scholar] [CrossRef]
  5. Salucci, P.; Persic, M. The baryonic mass function of spiral galaxies: Clues to galaxy formation. Mon. Not. R. Ast. Soc. 1999, 309, 923–928. [Google Scholar] [CrossRef]
  6. Fukugita, M.; Peebles, P.J. The cosmic energy inventory. Astrophys. J. 2004, 616, 643–668. [Google Scholar] [CrossRef]
  7. Cen, R.; Ostriker, J.P. Where are the baryons? Astrophys. J. 1999, 514, 1. [Google Scholar] [CrossRef]
  8. Davé, R.; Cen, R.; Ostriker, J.P.; Bryan, G.L.; Hernquist, L.; Katz, N.; Weinberg, D.H.; Norman, M.L.; O’Shea, B. Baryons in the warm–hot intergalactic medium. Astrophys. J. 2001, 552, 473–483. [Google Scholar] [CrossRef]
  9. Wijers, N.A.; Schaye, J.; Oppenheimer, B.D. The warm-hot circumgalactic medium around EAGLE-simulation galaxies and its detection prospects with X-ray and UV line absorption. Mon. Not. R. Ast. Soc. 2020, 498, 574–598. [Google Scholar] [CrossRef]
  10. Tuominen, T.; Nevalainen, J.; Tempel, E.; Kuutma, T.; Wijers, N.; Schaye, J.; Heinämäki, P.; Bonamente, M.; Veena, P.G. An EAGLE view of the missing baryons. Astron. Astrophys. 2021, 646, A156. [Google Scholar] [CrossRef]
  11. Zhu, W.; Zhang, F.; Feng, L.L. Profiles of cosmic filaments since z = 4.0 in cosmological hydrodynamical simulation. Astrophys. J. 2021, 920, 2. [Google Scholar] [CrossRef]
  12. Bykov, A.M.; Paerels, F.B.S.; Petrosian, V. Equilibration processes in the warm-hot intergalactic medium. Space Sci. Rev. 2008, 134, 141–153. [Google Scholar] [CrossRef]
  13. Bertone, S.; Schaye, J.; Dolag, K. Numerical Simulations of the Warm-Hot Intergalactic Medium. Space Sci. Rev. 2008, 134, 295–310. [Google Scholar] [CrossRef]
  14. Richter, P.; Paerels, F.B.S.; Kaastra, J.S. FUV and X-Ray absorption in the Warm-Hot Intergalactic Medium. Space Sci. Rev. 2008, 134, 25–49. [Google Scholar] [CrossRef]
  15. Cen, R.; Ostriker, J.P. Where are the baryons? II. Feedback effects. Astrophys. J. 2006, 650, 560–572. [Google Scholar] [CrossRef]
  16. Fresco, A.Y.; P´eroux, C.; Merloni, A.; Hamanowicz, A.; Szakacs, R. Tracing the 107 K warm–hot intergalactic medium with UV absorption lines. Mon. Not. R. Astron. Soc. 2008, 499, 5230–5240. [Google Scholar] [CrossRef]
  17. Reeves, J.; Done, C.; Pounds, K.; Terashima, Y.; Hayashida, K.; Anabuki, N.; Uchino, M.; Turner, M. On why the iron K-shell absorption in AGN is not a signature of the local warm/hot intergalactic medium. Mon. Not. R. Astron. Soc. 2008, 385, L108–L112. [Google Scholar] [CrossRef]
  18. Wiegert, T.; Irwin, J.; Miskolczi, A.; Schmidt, P.; Carolina Mora, S.; Damas-Segovia, A.; Stein, Y.; English, J.; Rand, R.J.; Santistevan, I.; et al. CHANG-ES IV: Radio continuum emission of 35 edge-on galaxies observed with the Karl, G. Jansky very large array in D configuration—Data release 1. Astronom. J. 2015, 150, 81. [Google Scholar] [CrossRef]
  19. Higgs, C.R.; McConnachie, A.W. Solo dwarfs IV: Comparing and contrasting satellite and isolated dwarf galaxies in the Local Group. Mon. Not. R. Astron. Soc. 2008, 506, 2766–2779. [Google Scholar] [CrossRef]
  20. McConnachie, A.W. The observed properties of dwarf galaxies in and around the Local Group. Astronom. J. 2012, 144, 4. [Google Scholar] [CrossRef]
  21. Tsai, C.W.; Eisenhardt, P.R.; Wu, J.; Stern, D.; Assef, R.J.; Blain, A.W.; Bridge, C.R.; Benford, D.J.; Cutri, R.M.; Griffith, R.L.; et al. The most luminous galaxies discovered by WISE. Astrophys. J. 2015, 805, 90. [Google Scholar] [CrossRef]
  22. Ogle, P.M.; Jarrett, T.; Lanz, L.; Cluver, M.; Alatalo, K.; Appleton, P.N.; Mazzarella, J.M. A break in spiral galaxy scaling relations at the upper limit of galaxy mass. Astrophys. J. Lett. 2019, 884, L11. [Google Scholar] [CrossRef]
  23. Sofue, Y.; Koda, J.; Nakanishi, H.; Onodera, S. The Virgo high-resolution CO survey, II. Rotation curves and dynamical mass distributions. Publ. Astron. Soc. Jpn. 2003, 55, 59–74. [Google Scholar] [CrossRef]
  24. Continuum Changes in Nearby Galaxies. Available online: https://www.queensu.ca/changes/ (accessed on 28 December 2022).
  25. Irwin, J.; Beck, R.; Benjamin, R.A.; Dettmar, R.J.; English, J.; Heald, G.; Henriksen, R.N.; Johnson, M.; Krause, M.; Li, J.T.; et al. Continuum Halos in Nearby Galaxies: An EVLA Survey (CHANG-ES). I. Introduction to the Survey. Astronom. J. 2012, 144, 43. [Google Scholar] [CrossRef]
  26. NASA/IPAC. Extragalactic Database. Available online: https://ned.ipac.caltech.edu/ (accessed on 1 February 2020).
  27. Rhee, M.-H. A Physical Basis of the Tully-Fisher Relation. Ph.D. Thesis, University Groningen, Groningen, Germany, 1996. [Google Scholar]
  28. Hoffman, G.L.; Salpeter, E.E.; Farhat, B.; Roos, T.; Williams, H.; Helou, G. Arecibo HI mapping of a large sample of dwarf irregular galaxies. Astrophys. J. Supp. 1996, 105, 269–301. [Google Scholar] [CrossRef]
  29. Hofmeister, A.M.; Criss, R.E. Debated Models for Galactic Rotation Curves: A Review and Mathematical Assessment. Galaxies 2020, 8, 47. [Google Scholar] [CrossRef]
  30. Rubin, V.C.; Ford, W.K. Rotation of the Andromeda nebula from a spectroscopic survey of emission regions. Astrophys. J. 1970, 159, 379–403. [Google Scholar] [CrossRef]
  31. Burbidge, G. On the masses and relative velocities of galaxies. Astrophys. J. 1975, 196, L7–L10. [Google Scholar] [CrossRef]
  32. Ackermann, M.; Albert, A.; Anderson, B.; Baldini, L.; Ballet, J.; Barbiellini, G.; Bastieri, D.; Bechtol, K.; Bellazzini, R.; Bissaldi, E.; et al. Dark matter constraints from observations of 25 Milky Way satellite galaxies with the Fermi Large Area Telescope. Phys. Rev. D 2014, 89, 042001. [Google Scholar] [CrossRef]
  33. Giagu, S. WIMP dark matter searches with the ATLAS detector at the LHC. Front. Phys. 2019, 7, 75. [Google Scholar] [CrossRef]
  34. Milgrom, M. A modification of the Newtonian dynamics as a possible alternative to the hidden mass hypothesis. Astrophys. J. 1983, 270, 365–370. [Google Scholar] [CrossRef]
  35. McGaugh, S.S. A tale of two paradigms, the mutual incommensurability of LCDM and MOND. Can. J. Phys. 2015, 93, 250–259. [Google Scholar] [CrossRef]
  36. Gauss, C.F. Determinatio Attractionis quam in punctum quodvis positionis datae ejus massa per totam orbitam ratione temporis quo singulae partes describuntur esset dispertita. In Werke; Königlichen Gesellschaft der Wissenschaften: Göttingen, Germany, 1866; Volume 3, pp. 331–357. [Google Scholar]
  37. Hill, G.W. The secular perturbations of the planets. Am. J. Math. 1901, 23, 317–336. [Google Scholar] [CrossRef]
  38. Criss, R.E.; Hofmeister, A.M. Density Profiles of 51 Galaxies from Parameter-Free Inverse Models of Their Measured Rotation Curves. Galaxies 2020, 8, 19. [Google Scholar] [CrossRef]
  39. Wang, Q.D.; Nowak, M.A.; Markoff, S.B.; Baganoff, F.K.; Nayakshin, S.; Yuan, F.; Cuadra, J.; Davis, J.; Dexter, J.; Fabian, A.C.; et al. Dissecting X-ray–emitting gas around the center of our galaxy. Science 2013, 341, 981–983. [Google Scholar] [CrossRef]
  40. What Does the Milky Way Weigh? Hubble and Gaia Investigate. Available online: https://www.nasa.gov/feature/goddard/2019/what-does-the-milky-way-weigh-hubble-and-gaia-investigate (accessed on 18 July 2023).
  41. Groetsch, C.W. Inverse Problems: Activities for Undergraduates; Cambridge University Press: Cambridge, UK, 1999. [Google Scholar]
  42. Halliday, D.; Resnick, R. Physics; John Wiley and Sons: New York, NY, USA, 1966. [Google Scholar]
  43. Ibata, R.; Lewis, G.F.; Martin, N.F.; Bellazzini, M.; Correnti, M. Does the Sagittarius stream constrain the Milky Way halo to be triaxial? Astrophys. J. Lett. 2013, 765, L155. [Google Scholar] [CrossRef]
  44. Hofmeister, A.M.; Criss, R.E.; Criss, E.M. Verified solutions for the gravitational attraction to an oblate spheroid: Implications for planet mass and satellite orbits. Planet. Space Sci. 2018, 152, 68–81. [Google Scholar] [CrossRef]
  45. Sipols, A.; Pavlovich, A. Dark matter dogma: A study of 214 galaxies. Galaxies 2020, 8, 36. [Google Scholar] [CrossRef]
  46. Sipols, A.; Pavlovich, A. Surface Brightness Plateau in S4G Galaxies. Galaxies 2020, 8, 48. [Google Scholar] [CrossRef]
  47. Gallo, C.F.; Feng, J.Q. A thin-disk gravitational model for galactic rotation. In Proceedings of the 2nd Crisis Cosmology Conference, Washington, DC, USA, 7–11 September 2009; Volume 413, pp. 289–303. [Google Scholar]
  48. Feng, J.Q.; Gallo, C.F. Mass distribution in rotating thin-disk galaxies according to Newtonian dynamics. Galaxies 2014, 2, 199–222. [Google Scholar] [CrossRef]
  49. Feng, J.Q. Rotating Disk Galaxies without Dark Matter Based on Scientific Reasoning. Galaxies 2020, 8, 9. [Google Scholar] [CrossRef]
  50. Hofmeister, A.M.; Criss, R.E. The physics of galactic spin. Can. J. Phys. 2017, 95, 156–166. [Google Scholar] [CrossRef]
  51. Craig, I.J.D.; Brown, J.C. Inverse Problems in Astronomy; Adam Hilger Ltd.: Bristol, UK, 1986. [Google Scholar]
  52. Criss, R.E.; Hofmeister, A.M. Galactic density and evolution based on the virial theorem, energy minimization, and conservation of angular momentum. Galaxies 2018, 6, 115–135. [Google Scholar] [CrossRef]
  53. Criss, R.E. Analytics of planetary rotation: Improved physics with implications for the shape and super-rotation of Earth’s Core. Earth Sci. Rev. 2019, 192, 471–479. [Google Scholar] [CrossRef]
  54. Kellogg, O.D. Foundations of Potential Theory; Dover Publications: New York, NY, USA, 1953. [Google Scholar]
  55. MacMillan, W.D. The Theory of the Potential; McGraw-Hill: New York, NY, USA, 1930. [Google Scholar]
  56. Moulton, F.R. An Introduction to Celestial Mechanics; MacMillan: New York, NY, USA, 1914. [Google Scholar]
  57. Perek, L. Heterogeneous spheroids with Gaussian and exponential density laws. Bull. Astron. Inst. Czechoslov. 1958, 9, 208–212. [Google Scholar]
  58. Pawlowski, M.S.; Pflamm-Altenburg, J.; Kroupa, P. The VPOS: A vast polar structure of satellite galaxies, globular clusters and streams around the Milky Way. Mon. Not. R. Ast. Soc. 2012, 423, 1109–1126. [Google Scholar] [CrossRef]
  59. Moiseev, A.V.; Smirnova, K.I.; Smirnova, A.A.; Reshetnikov, V.P. A new catalogue of polar-ring galaxies selected from the Sloan Digital Sky Survey. Mon. Not. R. Ast. Soc. 2011, 418, 244–257. [Google Scholar] [CrossRef]
  60. Finkelman, I.; Funes, J.G.; Brosch, N. Polar ring galaxies in the Galaxy Zoo. Mon. Not. Royal Ast. Soc. 2012, 422, 2386–2398. [Google Scholar] [CrossRef]
  61. Khoperskov, S.A.; Moiseev, A.V.; Khoperskov, A.V.; Saburova, A.S. To be or not to be oblate: The shape of the dark matter halo in polar ring galaxies. Mon. Not. R. Ast. Soc. 2014, 441, 2650–2662. [Google Scholar] [CrossRef]
  62. Binney, J.; Tremaine, S. Galactic Dynamics, 2nd ed.; Princeton University Press: Princeton, NJ, USA, 2008. [Google Scholar]
  63. Dankova, T.; Rosensteel, G. Triaxial bifurcations of rapidly rotating spheroids. Am. J. Phys. 1998, 66, 1095–1100. [Google Scholar] [CrossRef]
  64. Sofue, Y. Rotation curve and mass distribution in the galactic center—From black hole to entire galaxy. Pub. Astron. Soc. Jpn. 2013, 65, 118. [Google Scholar] [CrossRef]
  65. Sofue, Y. Dark halos of M 31 and the Milky Way. Publ. Astron. Soc. Jpn. 2015, 67, 759. [Google Scholar] [CrossRef]
  66. Nakanishi, H.; Sakai, N.; Kurayama, T.; Matsuo, M.; Imai, H.; Burns, R.A.; Ozawa, T.; Honma, M.; Shibata, K.; Kawaguchi, N. Outer rotation curve of the Galaxy with VERA. II. Annual parallax and proper motion of the star-forming region IRAS 21379+5106. Pub. Astr. Soc. Jpn. 2015, 67, 68. [Google Scholar] [CrossRef]
  67. Watkins, L.L.; Van Der Marel, R.P.; Sangmo, S.T.; Evans, N.W. Evidence for an intermediate-mass Milky Way from Gaia DR2 halo globular cluster motions. Astrophys. J. 2019, 873, 118. [Google Scholar] [CrossRef]
  68. Romanowsky, A.J.; Douglas, N.G.; Arnaboldi, M.; Kuijken, K.; Merrifield, M.R.; Napolitano, N.R.; Capaccioli, M.; Freeman, K. A dearth of dark matter in ordinary elliptical galaxies. Science 2003, 301, 1696–1698. [Google Scholar] [CrossRef]
  69. Geha, M.; Guhathakurta, P.; Rich, R.M.; Cooper, M.C. Local Group dwarf elliptical galaxies. I. Mapping the dynamics of NGC 205 beyond the tidal radius. Astrophys. J. 2006, 131, 332–342. [Google Scholar] [CrossRef]
  70. Wiegert, T.; English, J. Kinematic classification of non-interacting spiral galaxies. New Astron. 2014, 26, 40–61. [Google Scholar] [CrossRef]
  71. Howley, K.M.; Guhathakurta, P.; van der Marel, R.; Geha, M.; Kalirai, J.; Yniguez, B.; Kirby, E.; Cuillandre, J.-C.; Gilbert, K. Internal stellar kinematics of M32 from the SPLASH survey, dark halo constraints. Astrophys. J. 2013, 765, 65. [Google Scholar] [CrossRef]
  72. Bottema, R.; Pestaña, J.L.G. The distribution of dark and luminous matter inferred from extended rotation curves. Mon. Not. R. Astron. Soc. 2015, 448, 2566–2593. [Google Scholar] [CrossRef]
  73. Ferrière, K. The interstellar environment of our galaxy. Rev. Mod. Phys. 2011, 73, 1031–1066. [Google Scholar] [CrossRef]
  74. LeDrew, G. The real starry sky. J. R. Astron. Soc. Can. 2011, 95, 322–324. [Google Scholar]
  75. Luyten, W.J. A new determination of the luminosity function. Mon. Not. R. Astron. Soc. 1968, 139, 221–224. [Google Scholar] [CrossRef]
  76. Fang, T.; Buote, D.A.; Humphrey, P.J.; Canizares, C.R.; Zappacosta, L.; Maiolino, R.; Tagliaferri, G.; Gastaldello, F. Confirmation of X-ray absorption by warm-hot intergalactic medium in the Sculptor wall. Astrophys. J. 2010, 714, 1715–1724. [Google Scholar] [CrossRef]
  77. Nicastro, F.; Mathur, S.; Elvis, M. Missing baryons and the warm-hot intergalactic medium. Science 2008, 319, 55–57. [Google Scholar] [CrossRef] [PubMed]
  78. The Virgo Cluster. Available online: http://www.atlasoftheuniverse.com/galgrps/vir.html (accessed on 10 January 2023).
  79. Binggeli, B.; Sandage, A.; Tarenghi, M. Studies of the Virgo Cluster. I-Photometry of 109 galaxies near the cluster center to serve as standards. Astron. J. 1984, 89, 64–82. [Google Scholar] [CrossRef]
  80. Conselice, C.J.; Wilkinson, A.; Duncan, K.; Mortlock, A. The evolution of galaxy number density at z < 8 and its implications. Astrophys. J. 2016, 830, 83. [Google Scholar]
  81. Dodelson, S. Modern Cosmology, 2nd ed.; Elsevier: Amsterdam, The Netherlands, 2020. [Google Scholar]
  82. Carroll, B.W.; Ostlie, D.A. An Introduction to Modern Astrophysics, 2nd ed.; Cambridge University Press: Cambridge, UK, 2017; Chapter 29. [Google Scholar]
  83. Friedmann Equations. Available online: https://en.wikipedia.org/wiki/Friedmann_equations#Density_parameter (accessed on 18 July 2023).
  84. Copi, C.J.; Schramm, D.S.; Turner, M.S. Big-Bang Nucleosynthesis and the Baryon Density of the Universe. Science 1995, 267, 192–199. [Google Scholar] [CrossRef]
  85. Galaxy Filaments. Available online: https://en.wikipedia.org/wiki/Galaxy_filament (accessed on 27 July 2023).
  86. Criss, R.E.; Hofmeister, A.M. Thermodynamic Cosmology. Geochim. Cosmochim. Acta 2001, 65, 4077–4085. [Google Scholar] [CrossRef]
  87. Schechter, P. An analytic expression for the luminosity function for galaxies. Astrophys. J. 1976, 203, 297–306. [Google Scholar] [CrossRef]
  88. Yasuda, N.; Fukugita, M.; Narayanan, V.K.; Lupton, R.H.; Strateva, I.; Strauss, M.A.; Ivezić, Ž.; Kim, R.S.J.; Hogg, D.W.; Weinberg, D.H.; et al. Galaxy number counts from the sloan digital sky survey commissioning data. Astron. J. 2001, 122, 1104–1124. [Google Scholar] [CrossRef]
  89. Kam, Z.S.; Carignan, C.; Chemin, L.; Amram, P.; Epinat, B. Kinematics and mass modelling of M33, Hα observations. Mon. Not. R. Astron. Soc. 2015, 449, 4048–4070. [Google Scholar] [CrossRef]
  90. Sofue, Y.; Tutui, Y.; Honma, M.; Tomita, A.; Takamiya, T.; Koda, J.; Takeda, Y. Central rotation curves of spiral galaxies. Astrophys. J. 1999, 523, 136–146. [Google Scholar] [CrossRef]
  91. Corbelli, E.; Salucci, P. The extended rotation curve and the dark matter halo of M33. Mon. Not. R. Ast. Soc. 2000, 311, 441–447. [Google Scholar] [CrossRef]
  92. Leaman, R.; Venn, K.A.; Brooks, A.M.; Battaglia, G.; Cole, A.A.; Ibata, R.A.; Irwin, M.J.; McConnachie, A.W.; Mendel, J.T.; Tolstoy, E. The resolved structure and dynamics of an isolated dwarf galaxy, A VLT and Keck spectroscopic survey of WLM. Astrophys. J. 2012, 750, 33. [Google Scholar] [CrossRef]
  93. Salucci, P.; Wilkinson, M.I.; Walker, M.G.; Gilmore, G.F.; Grebel, E.K.; Koch, A.; Frigerio Martins, C.; Wyse, R.F.G. Dwarf spheroidal galaxy kinematics and spiral galaxy scaling laws. Mon. Not. R. Ast. Soc. 2012, 420, 2034–2041. [Google Scholar] [CrossRef]
  94. Walker, M.G.; Mateo, M.; Olszewski, E.W.; Gnedin, O.Y.; Wang, X.; Sen, B.; Woodroofe, M. Velocity dispersion profiles of seven dwarf spheroidal galaxies. Astrophys. J. 2007, 667, L53–L56. [Google Scholar] [CrossRef]
  95. Walker, M.G.; Mateo, M.; Olszewski, E.W. Stellar velocities in the Carina, Fornax, Sculptor, and Sextans dSph galaxies, data from the Magellan/MMFS survey. Astronom. J. 2009, 137, 3100. [Google Scholar] [CrossRef]
  96. Mateo, M.; Olszewski, E.W.; Walker, M.G. The velocity dispersion profile of the remote dwarf spheroidal galaxy Leo I, A tidal hit and run? Astrophys. J. 2008, 675, 20. [Google Scholar] [CrossRef]
  97. Oh, S.H.; Hunter, D.A.; Brinks, E.; Elmegreen, B.G.; Schruba, A.; Walter, F.; Rupen, M.P.; Young, L.M.; Simpson, C.E.; Johnson, M.C.; et al. High-resolution mass models of dwarf galaxies from LITTLE THINGS. Astronom. J. 2015, 149, 180. [Google Scholar] [CrossRef]
  98. Weldrake, D.T.; De Blok, W.J.; Walter, F. A high-resolution rotation curve of NGC 6822: A test-case for cold dark matter. Mon. Not. R. Astron. Soc. 2003, 340, 12–28. [Google Scholar] [CrossRef]
  99. Karachentsev, I.D.; Chengalur, J.N.; Tully, R.B.; Makarova, L.N.; Sharina, M.E.; Begum, A.; Rizzi, L. Andromeda IV, a solitary gas-rich dwarf galaxy. Astron. Nach. 2016, 337, 306–314. [Google Scholar] [CrossRef]
  100. Alves, D.R.; Nelson, C.A. The rotation curve of the Large Magellanic cloud and the implications for Microlensing. Astrophys. J. 2000, 542, 789. [Google Scholar] [CrossRef]
  101. Geha, M.; Van der Marel, R.P.; Guhathakurta, P.; Gilbert, K.M.; Kalirai, J.; Kirby, E.N. Local Group dwarf elliptical galaxies. II. Stellar kinematics to large radii in NGC 147 and NGC 185. Astrophys. J. 2010, 711, 361–373. [Google Scholar] [CrossRef]
  102. Namumba, B.; Carignan, C.; Passmoor, S. HI observations of Sextans A and B with the SKA pathfinder KAT-7. Mon. Not. R. Astron. Soc. 2018, 478, 487–500. [Google Scholar] [CrossRef]
  103. Di Teodoro, E.M.; McClure-Griffiths, N.M.; Jameson, K.E.; Denes, H.; Dickey, J.M.; Stanimirović, S.; Staveley-Smith, L.; Anderson, C.; Bunton, J.D.; Chippendale, A.; et al. On the dynamics of the Small Magellanic Cloud through high-resolution ASKAP HI observations. Mon. Not. R. Astron. Soc. 2019, 483, 392–406. [Google Scholar] [CrossRef]
Figure 1. Essentially oblate shapes and vast CGM of spiral galaxies: (Left column) visual images of three spirals in the Virgo Cluster, presented at the same scale as the radio contours of each galaxy, shown to the right of each images. RC data exist for NGC 4192 [23], which is ~2× the visual diameter of NCG 4388, and ~1.25× that of NGC 4438, which interacts with a neighbor (not shown); (Middle column) contours in the C-band (centered on 6 cm wavelength), tapered in the ultraviolet for NGC 4192 and 4388; (Right column) contours in the L-band (centered on 20 cm, which depicts hydrogen). Modified after publicly available images in the on-line appendix of the first data release by Wiegert et al. [18]. The CHANG-ES project [24] is described in Irwin et al. 2012 [25].
Galaxies 11 00100 g001
Figure 3. Andromeda. Inverse models showing the effect of varying c/a for an externally probed galaxy with the most extensive RC available. RC compiled from nine studies by Sofue [64], shown in pink, are used to calculate: (a) Min, and (b) density vs. radius. Error bars indicate that uncertainties in v below 40 kpc are ±10%, but are larger and variable at higher r. Labels list the aspect ratios used in the computations. Modified after Criss and Hofmeister [38], which has a Creative Commons License.
Galaxies 11 00100 g003
Figure 4. Milky Way, for which data are gathered from inside the galaxy. Inverse models showing the effect of different data sets, both with c/a = 1/10 and on changing c/a, as labeled. Compiled RC data from Sofue [65] in pink and from Sofue [65] in black are used to calculate (a) Min, and (b) density vs. radius. However, for ρ, the 2013 dataset below r = 0.1 kpc was merged with the 2015 dataset, as indicated. Fits are to r > 0.1 kpc, as our interest is ρ of CGM. Modified after Criss and Hofmeister [38], which has a Creative Commons License. Density of the ISM (10−21 kg m−3) is used to define the visible edge, giving 15 kpc, in view of new data [66,67] giving lower velocities than RC data.
Galaxies 11 00100 g004
Figure 5. Behavior of mass for all 72 galaxies: (a) dependence of the maximum mass determined on the mass calculated at the visible edge, where the edge radius of MW is ascertained from density (Section 2.2.2); (b) dependence the mass at the visible edge (pink squares) on the visible edge radius. The largest radius studied in RC determinations (black diamonds) is roughly proportional to the visible edge radius, a consequence of density depending on size.
Galaxies 11 00100 g005
Figure 6. Density of galaxies and its dependence on the maximum galactic radius explored in RC measurements: (a) dependence of the power law exponents on the maximum radius of the RC acquisitions, based on Equation (4). The inset shows the statistics for the spirals (black dots), excluding those presenting edge-on (red square)and morphologies other than spirals (blue cross); (b) lowest density calculated as a function of the maximum RC radius. Dwarfs (red cross) have low density due to lesser self-contraction. Spiral density decreases with the radius of measurement, due to both size and sampling effects. Black dots show spirals with RC data to larger radii. Blue squares show spirals with RC data close to centers.
Galaxies 11 00100 g006
Figure 7. Dependence of galaxy mass at the visible edge (black squares and dotted line) and at the maximum radius explored in RC measurements (red dots and line) on luminosity. MW was not included because its luminosity is not independently determined: (a) fit to 70 objects. Green diamond = the five galaxies with RC at >3.64× the visible edge. Green line shows the trend of the highest masses for these objects (Andromeda, UGC 3993, and DDO 154). Andromeda IV (aqua square) has extremely low luminosity but a well determined RC (see Appendix A) and, hence, was not included in the fits; (b) spiral galaxies only. Andromeda is indicated due to its extensive RC. UGC 3993 is a lenticular.
Galaxies 11 00100 g007
Figure 8. Trends for distant galaxies. Masses were calculated from velocities and radii tabulated by Ogle el al. [22] using Equation (3). All reported radii lie at or within the visible edge. Luminosities were obtained from [26]. The various symbols show subsets of the data, as labeled. Dotted line shows a 1:1 correspondence of mass to luminosity. Only for J22073122-0729223 were data reported at r reaching the visual edge.
Galaxies 11 00100 g008
Figure 9. Histograms of the well-documented LG members. Membership from [20]. Insets provide statistics: (a) luminosity of 77 objects, as summarized by [26]. Many objects (49) were not measured, indicating small values; (b) mass of these 77 objects. Pink bars show M/Msun from analysis of RC data (Table A1). Blue bars show mass calculated from luminosity. The isolated blue bar describes M110 (see text). Statistics describe the combined datasets. The sum of mass from RC of only 1.745 × 10¹² M/Msun differs negligibly from the sum based on luminosity.
Galaxies 11 00100 g009
Figure 10. Statistics of L/Lsun for galaxies in small volumes of space: (a) probability distribution function of 98 large galaxies (out of ~1100) in the Virgo Cluster. Messier galaxies are labeled. The SB spiral M91 has L/Lsun similar to Andromeda, whereas spirals M98 and M99 have similar L/Lsun to the average of the large galaxies (inset); (b) comparison of cumulative distributions functions of luminosity for the Virgo Cluster to that of the Local Group, obtained by binning their histogram data. Missing luminosity (large squares) is estimated by assuming the small objects have averages of 3 × 10⁷ or 108 L/Lsun.
Galaxies 11 00100 g010
Figure 11. Histograms of galactic luminosities ascertained from redshift-independent distances [26], which places them within 25 to 30 Mpc. The x-axis is logarithmic, but the statistics show the ratios of L/Lsun: (a) ellipticals, including the VC; (b) lenticulars, mainly S0 and S0/a types with lesser Sa, Sb, and Sc; (c) sum of spiral types SA, SAB, and SB, where one small object is not shown for direct comparison to the other panels; (d) running sum of all morphologies. Arrow shows Andromeda’s luminosity, for reference.
Galaxies 11 00100 g011
Figure 12. Running sums of the histogram data shown in Figure A11. All datapoints were included in binning the data. Points show only the populated bins. Lines connect the total masses between bins. The vertical arrow corresponds to a galaxy with the luminosity of Andromeda, provided as a reference marker: (a) ellipticals distributed in 400 bins, which is the maximum number permitted by the graphics program; (b) lenticulars distributed in 400 bins; (c) spiral types SA, SAB, and SB were combined, where 200 bins sufficed to obtain a smooth curve.
Galaxies 11 00100 g012
Figure 13. Dependence of the luminosity of elliptical (2890 pink crosses), spiral (1620 black diamonds), and lenticular galaxies (2371 blue dots) on distances determined from redshifts. Nearby objects with independent distance determinations are not shown; thus, those in the LG and VC are represented by vertical lines show their ranges at an average distance. Labels are placed near the most luminous galaxy of each category, which are statistical outliers (spiral NGC 3169 has a huge bulge; the elliptical and lenticular outliers are AGNs). Dense concentrations of data are best seen for ellipticals, but exist for all types and are parallel to the orange dashed line, which illustrates luminosity of observable objects increasing as distance squared. The violet line describes very bright ellipticals. The black line describes very bright spirals. Fits depict ellipticals (long dashed line), lenticulars (blue line), and spirals (black dashes). The four spirals with unusually low luminosity present face-on.
Galaxies 11 00100 g013
Figure 14. Dependence of the number of galaxies in the NED database [26] on Hubble distance, which omits most of the Virgo Cluster and LG: (a) ellipticals; (b) lenticulars, mainly S0 and S0/a; (c) spiral classes SA, SAB, and SB, which dominates; (d) comparison of all types where the count is the summation. The dots are binned total counts. The red line suggests that a linear decrease describes distances above ~50 Mpc. At very large distances, only large galaxies can be detected.
Galaxies 11 00100 g014
Figure 15. Baryonic density, based on gravitational assessments: (a) schematics illustrating the concept of a representative galaxy in a large cluster of galaxies, where blue galaxies are in the background; green galaxies are closer. Dark colors indicate the star rich interior that grades into CGM and finally into IGM (lighter shades). Very small galaxies (orange color) fit in the “holes” between large galaxies, so their number is not relevant to the count. Variables are defined at the bottom of this panel; (b) calculations of ρ in the nearby universe. The horizontal pink line shows the critical density (see text). The purple line shows ρ the detectable H-gas edge of Andromeda. The black arrow indicates baryon density proposed in Big Bang nucleosynthesis models, which lies below the graph. Red squares = average density from Equation (9). Virgo Cluster estimates are minimal, as its largest galaxies are ellipticals, as indicated by the arrow. The gray X and arrows show the estimated effect of the average galaxy being larger than Andromeda, used as the representative galaxy. Circles and blue arrows show the estimated effect of MW-sized galaxies existing in addition to the representative galaxy. A least-squares fit is shown for the later estimate. The gray area marks regions least impacted by resolution effects.
Galaxies 11 00100 g015
Table 1. Volumetric baryon densities of different astrophysical environments.
DensityReferenceThis Work *
Object or Regionkg m−3 kg m−3Figure No.
Solar neighborhood~3 × 10⁻²¹[74,75]5 × 10⁻²¹Figure 4
Interstellar medium ~10−21[73] †10−21Figure 3 and Figure 4
Circumgalactic medium2 × 10−24 to 5 × 10⁻²⁶[76] ‡10−22 to 10−24Figure 3 and Figure 6b
Intergalactic medium 1.9 × 10⁻²⁸ §Figure 6b §
WHIM absorptions1.7 × 10−26 to 1.7 × 10⁻²⁷[77] §1.9 × 10⁻²⁸ §Figure 6b §
* From inverse models of galactic RC, where n.a. = not applicable. † Ferrière [74] provides 10−4 to 106 atoms per cc for various components in the ISM. ‡ The Sculptor Wall was studied by [76] who state ρ includes GCM. Their highest value agrees with our CGM data, whereas their lower limit greatly exceeds our estimate (to the right) from Equation (5). § Applies Equation (5) to the distance of 127 Mpc for the Sculptor wall of [76] and to upper limit of distances explored by Nicastro et al. [77].
Table 2. Effect of distance on the number and mean luminosity of galaxies compiled in the NED database [26].
CutoffEllipticalsLenticularsSpiralsAll Types
MpcNumberMean L/LsunNumberMean L/LsunNumberMean L/LsunNumberMean L/Lsun
250 *45154.02 × 101075692.73 × 101034741.97 × 101015,5582.93 × 1010
10022103.06 × 101054922.55 × 101031012.17 × 101010,8032.55 × 1010
5019563.04 × 101054832.60 × 101025182.18 × 101099572.58 × 1010
~30 †18133.14 × 101053332.65 × 101017192.69 × 101088652.76 × 1010
* From Figure 11; reduction in the number of small galaxies with distance affects the mean especially for this large volume sampled. † Describes the NED database galaxies without a specified Hubble distance: It includes the VC, which has many large members, which likely influence the average.
Table 3. Calculations of intergalactic media density and gas mass around a galaxy in various regions.
Regionrregion
(Mpc)
Number of Large GalaxiesDatarrepresentative
(Mpc)
ρaverage *
(kg m−3)
Enclosed ρ
(kg m−3)
LG 1.52Figure 91.26.24 × 10−256.24 × 10⁻²⁵
LG1.51Figure 91.54.11 × 10−256.15 × 10⁻²⁵
VC 1.654 (L > 1011 Lsun)Figure 101.0>9 × 10⁻²⁵ §(60 to 1000) × 10−25 %
VC1.6526 (L > 2 × 10¹⁰ Lsun)Figure 100.562.88 × 10−24 #300 × 10−25 %
VC1.6552 (L > 1010 Lsun)Figure 100.444.65 × 10−24 #50 × 10−25
VC dispersed to LG1654(L > 1010 Lsun)as above4.25.0 × 10−261 × 10−25 %
Inside 30 Mpc ‡ ~30 ‡8865Figure 111.53.9 × 10−257.8 × 10⁻²⁵
Inside 50 Mpc509912not shown2.31.7 × 10−253.4 × 10⁻²⁵
Inside 100 Mpc1010,803not shown4.54.5 × 10−261.2 × 10⁻²⁵
Inside 250 Mpc25015,158Figure A11109 × 10−270.34 × 10⁻²⁵ † %
Extrapolated trends1000>384,000Section 4.2<7>1.86 × 10⁻²⁷See Section 4.2
Universe (Z < 0.8)75002 × 1012(L > 106 Lsun)Section 4.30.6–2(2 to 24) × 10−25(2 to 24) × 10−25
* Provides the average using Equation (8) to compute volume and Equation (9) for density. † This increases over the average ρ accounts for the representative galaxies being accompanied by 1–3 objects with sizes like that of the MW. % Accounts for the representative galaxy being more massive than Andromeda in the 100 Mpc and 250 Mpc regions, using Equation (11). ‡ These objects have redshift-independent distances: some are part of the LG or VC. § May be significantly underestimated because RCs of very luminous galaxies are limited to radii within the visible edge. # Represents CGM (not IGM), in agreement with Figure 3 on Andromeda where a 0.4 Mpc distance yields 10−24 kg m−3.
Table 4. Baryonic densities * of the universe from various methods.
Method or RegionBaryon Density
kg m−3
ρ (Neglects IGM) #
kg m−3
Local Group †6.2 × 10−250.042 × 10⁻²⁵
Distance directly determined (<30 Mpc)7.8 × 10−250.034 × 10⁻²⁵
Nearby (<50 Mpc)3.4 × 10−250.01 × 10⁻²⁵
Universe Count ‡(2 to 24) × 10−25~0.5 × 10⁻²⁵
Energy Balance §0.2 × 10⁻²⁵n.a.
Expansionary critical density &0.09 × 10⁻²⁵n.a.
Cosmology models of baryon density0.003 × 10−25n.a.
* The last digit reported for each entry is uncertain. † Best estimate. ‡ Independent of the above, which rests on the model of Conselice et al. [80] (see Section 4.3). § Unrelated to the above for all types of matter (Section 4.4). & Includes all types of matter. Assumes that the escape velocity equals the Hubble constant times the radius of the universe, e.g., [81,82,83] (see Section 4.5). Copi et al. [84] modeled Big Bang nucleosynthesis. Other models use slightly larger values of 0.0042 × 10⁻²⁵ [10]. # Lower limit for a largely gasless universe. This is based on baryon density computed from the mass of galaxies and their CGM divided by the volume of the region. For the LG, masses are from RC data. For the others, the mass is the number of large galaxies in Table 3 times the mass of Andromeda and its CGM (Table A1).
Disclaimer/Publisher’s Note: The statements, opinions and data contained in all publications are solely those of the individual author(s) and contributor(s) and not of MDPI and/or the editor(s). MDPI and/or the editor(s) disclaim responsibility for any injury to people or property resulting from any ideas, methods, instructions or products referred to in the content.