Article

A Study of Interstellar Medium in the Line of Sight of Transient Neutron Star Low-Mass X-ray Binary, MXB 1659-298, by Timing and Spectral Analysis

by
Rabindra Mahato
1,2,*,
Parag Bhattacharya
2,3 and
Monmoyuri Baruah
2
1
Department of Physics, Science College Kokrajhar, Kokrajhar 783370, Assam, India
2
Department of Physics, School of Fundamental and Applied Sciences, Assam Don Bosco University, Guwahati 781017, Assam, India
3
Department of Physics, Rangapara College, Rangapara 784505, Assam, India
*
Author to whom correspondence should be addressed.
Galaxies 2024, 12(4), 41; https://doi.org/10.3390/galaxies12040041
Submission received: 9 May 2024 / Revised: 13 July 2024 / Accepted: 17 July 2024 / Published: 31 July 2024

Abstract

:
This work is dedicated to the study of interstellar medium (ISM) along the line of sight (LOS) of the transient low-mass X-ray binary, MXB 1659-298, capitalizing the high resolving power of XMM-Newton in the soft energy range. We emphasized the analysis of reflection grating spectrometer (RGS) data in the energy range 0.5–2.15 keV, suitable for the study of ISM. The paper includes an explanation of why, in the soft X-ray energy range, only two observations (out of seven) were deemed eligible for analysis. Three absorption lines associated with highly ionized Fe XX (1s22p2-2p2 (3p) 4d), Si XIV (1s2-1s2p), and Mg XI (1s2-1s6p) were identified in the observations, with IDs of 8620701(2001) and 748391601(2015). These new absorption lines and the absorption edge due to the neutral oxygen K edge seen in the spectra validate the multiphase structure of ISM. The predominance of interstellar medium over the ionized absorber is established along the direction of the source. The equivalent hydrogen column density measured is nearly equal to the galactic HI value derived previously. The small value of the ionic column density of Fe, Si, and Mg in the site of the high-temperature region resembles previous findings.

1. Introduction

The introduction of high-resolving-power X-ray spectrometers and the exploration of interstellar medium (ISM) are moving hand in hand, unearthing new information every passing day. The dynamical, diffused, and multiphase interstellar medium is an intrinsic part of the galactic ecosystem, bearing direct evidence of the history of stellar evolution. It consists of very low-density gas (NH ~ 10−3 to 102 cm−3), dust, cosmic radiation, and a magnetic field. The wide variation in temperature starting from 10 K to 106 K categorizes it as a multiphase structure enriched with plenty of metals due to supernova remnants, making it significant enough to study [1]. Although the focused study of ISM is quite new, still, many aspects of ISM have been established to date; for example, we know a lot about constituents of gas in ISM and the column densities of neutral and ionized gases, such as oxygen, magnesium, iron, silicon, nickel, etc. [2,3,4]. An estimation of the gas-to-dust ratio present in ISM (about 0.005–0.01) [5,6] and the constituents of dust has been evaluated by many [3]. Studies have shown that about 90% of Mg, Si, and Fe are mostly locked up in dust grains of the Galactic disc [3,4,7]. By the use of suitable combination models, many authors have calculated the abundance of Mg, Ne, Fe, O, and N. The estimated abundance does not differ significantly between observations, and it is as per expectations, because ISM is stable on short time scales. The authors have also measured the column density of O, Ne, Mg, and Fe with an empirical model and have also estimated the Galactic abundance gradient. Their work played a major role in supporting the idea that ISM has a multiphase structure [4,8,9,10]. In ISM, work by Wilms et al., reported in 2000, is regarded as the most important work [11]. Numerous authors have reported the existence of high ionization absorption lines of ions, such as O VII, O VIII, and Ne VIII to Ne X in ISM in the high-energy transmission grating spectrometer (HETGS) spectra of the low-mass X-ray binary (LMXB) Cyg 2 [1,9,12,13,14]. Thus, high-resolution X-ray spectroscopy has evolved as a very effective tool to probe the multiphase structure of ISM through the analysis of the absorption lines and edges in the X-ray spectra of LMXB sources. Blue shift was employed by a good number of authors as a means of verifying whether the detected absorption lines originated locally or in the interstellar medium [1,10,12,15]. Today, we know various procedures via which we can establish that absorption detected in the spectra is caused by ISM [16].

NS LMXB MXB 1659-298

X-ray binaries have turned out to be a suitable source for the study of ISM due to their location behind a sizeable amount of mass. It is evident that LMXBs with values of NH ~ 0.1–0.5 × 1022 cm−2 are suitable for the study of ISM [3,4]. For this study, we have chosen a transient neutron star (NS) LMXB source, MXB 1659-298 (RA: 17 h 02 m 06 s and Dec: −29°56′44″), which shows eclipsing, dipping, and also type I X-ray bursts. This is the only source apart from EXO 0748-676 which exhibits both dipping and eclipsing together [17]. Since its discovery in the year 1976 by Lewin et al., it remained in a quiescent state for ~21 years, and it started bursting again in the year 1999 [18,19]. It is located 7 degrees away from the Galactic plane with a high inclination angle of 73 to 78 degrees [17,20]. It is at a distance of 9 ± 2 for hydrogen-rich and 12 ± 3 kpc for helium-rich companion stars, respectively [21]. While it is uncommon for a single LMXB to be associated with both hydrogen-rich and helium-rich companion stars, LMXBs can have different types of companion stars over time or in different observational states. The type of companion star can vary based on its evolutionary stage, mass loss history, and interactions with compact objects, and this is somewhat unusual for MXB 1659-298. The orbital period of the source was calculated recently in the year 2018 by R. Iaria et al. as ~7.1161099 h, which is quite similar to what was found by Cominsky and Wood in the years 1984 and 1988, and also by Jain et al. in the year 2017 [22,23,24,25]. Jain et al. presented this source, with a slight variation in name, as MXB 1658-298. This is the same source and can be confirmed by reviewing the observation history mentioned in the literature, looking into their coordinates, observational properties, etc. This source has been studied many a time by different authors [26,27,28,29]. The studies published in the years 2001 and 2004 by L. Sidoli et al., and also by Trigo et al. in the year 2006, detected absorption lines O VIII 1s-2p, 18.95 Å, 1s-3p, 16.00 Å, and 1s-4p, 15.21 Å. They also detected Ne X 1s-2p transition at 12.15 Å in the soft energy range [19,26,27,28]. They claimed that the absorptions observed in the spectra were due to ionized absorbing plasma present all around the source in a cylindrical geometry with an axis perpendicular to the accretion disc. The absorption lines Fe XXV and Fe XXVI were detected in the soft state only. R. Iaria et al., in the year 2019, also detected a clear signature of an absorption edge at 0.54 keV along with the O VIII line at 0.654 keV and the Ne X line close to 1.022 keV [29]. Both G. Ponti et al. and R. Iaria et al. in the year 2019 pointed out that ISM could be the cause of the origin of the absorption line observed in part of the spectra of MXB 1659-298 [20,29]. Studies carried out with MXB 1659-298 as the X-ray emitting source reveal that due to the high inclination of the source, the chances of obtaining a large change in the value of equivalent hydrogen column density (NH) are high. In this study, our focus was to study soft absorption lines detected in the spectra obtained from data recorded with a reflection grating spectrometer (RGS) of XMM-Newton observations and to find out the cause of the origin of these lines from the best-fit parameters obtained after modelling. Further attempts have been made to estimate the ionic column density of the most abundant elements in the line of sight (LOS) of the source. We analyzed the X-ray spectra in the energy range 0.5 to 2.15 keV and found that obscuring column density is due to both the interstellar medium as well as due to the presence of an ionized absorber surrounding the source. Since nothing was found to be mentioned in the literature as to why, in spite of seven observations available, only two observations were preferred for analysis in most of the work, and we aimed to analyze all the observations one by one and to determine the reason behind this.

2. Materials and Methods

Archives of large datasets recorded with high-resolution telescopes onboard space observatories like Chandra and XMM-Newton provide ample opportunity to study ISM and thereby obtain a more in-depth and elaborate picture of it. Launching these observatories with high-resolution tools has significantly strengthened the field of high-resolution X-ray spectroscopy. In this study, we specifically used the data recorded by reflection grating spectrometers (RGSs) of the XMM-Newton observatory [30,31,32,33] to exploit the advantages of its higher effective area in the 0.33 keV to 2.5 keV energy range, superior photon accumulation capacity, and moderate spectral resolution with high throughput. The high resolution (the spectral resolution of the first-order RGS is 0.06–0.07 Å) of the RGS compared to the EPIC makes it particularly suitable for studying narrow absorptions.

2.1. Observations

The XMM-Newton observatory has observed the X-ray binary MXB 1659-298 on seven occasions since 2000. As found in the literature, most of the studies [20,26,29] were carried out with observations 8620701 and 748391601 recorded in the years 2001 and 2015, respectively. The literature provides no explanation for why the remaining observations have not been previously analyzed. Also, as most of the studies employed the EPIC-PN data, and since detailed studies with RGS data are scarce, an attempt to analyze all the RGS data available is made in this study. A detailed timing and spectral analysis of all the observations (see Table 1) of this source were analyzed. Table 1 below has a detailed outline of effective exposure duration in sec and net count rate of each observation.

2.2. Data Reduction

We used the science analysis system (SAS) 19.0.1 of the XMM-Newton, applying the latest calibrations for extracting and analyzing the RGS data. For spectral analysis, we used Xspec 12.11.1 (X-ray spectrum analysis software) for spectrum processing [34]. During all the observations, the reflection grating spectrometer [30] was in standard spectroscopy mode. To obtain calibrated photon events, spectra, and response matrices, the RGS data were processed using SAS threads up to ‘rgsproc’ with default parameters. The event lists thus obtained were free from bad pixels, as the filtering option is enabled by default. Additionally, the option keep cool = No was chosen to remove single columns and hot pixels. For our analysis, we considered the dip, eclipse, and burst-filtered persistent emission spectra from the years 2001 and 2015, as described in Section 3.2.

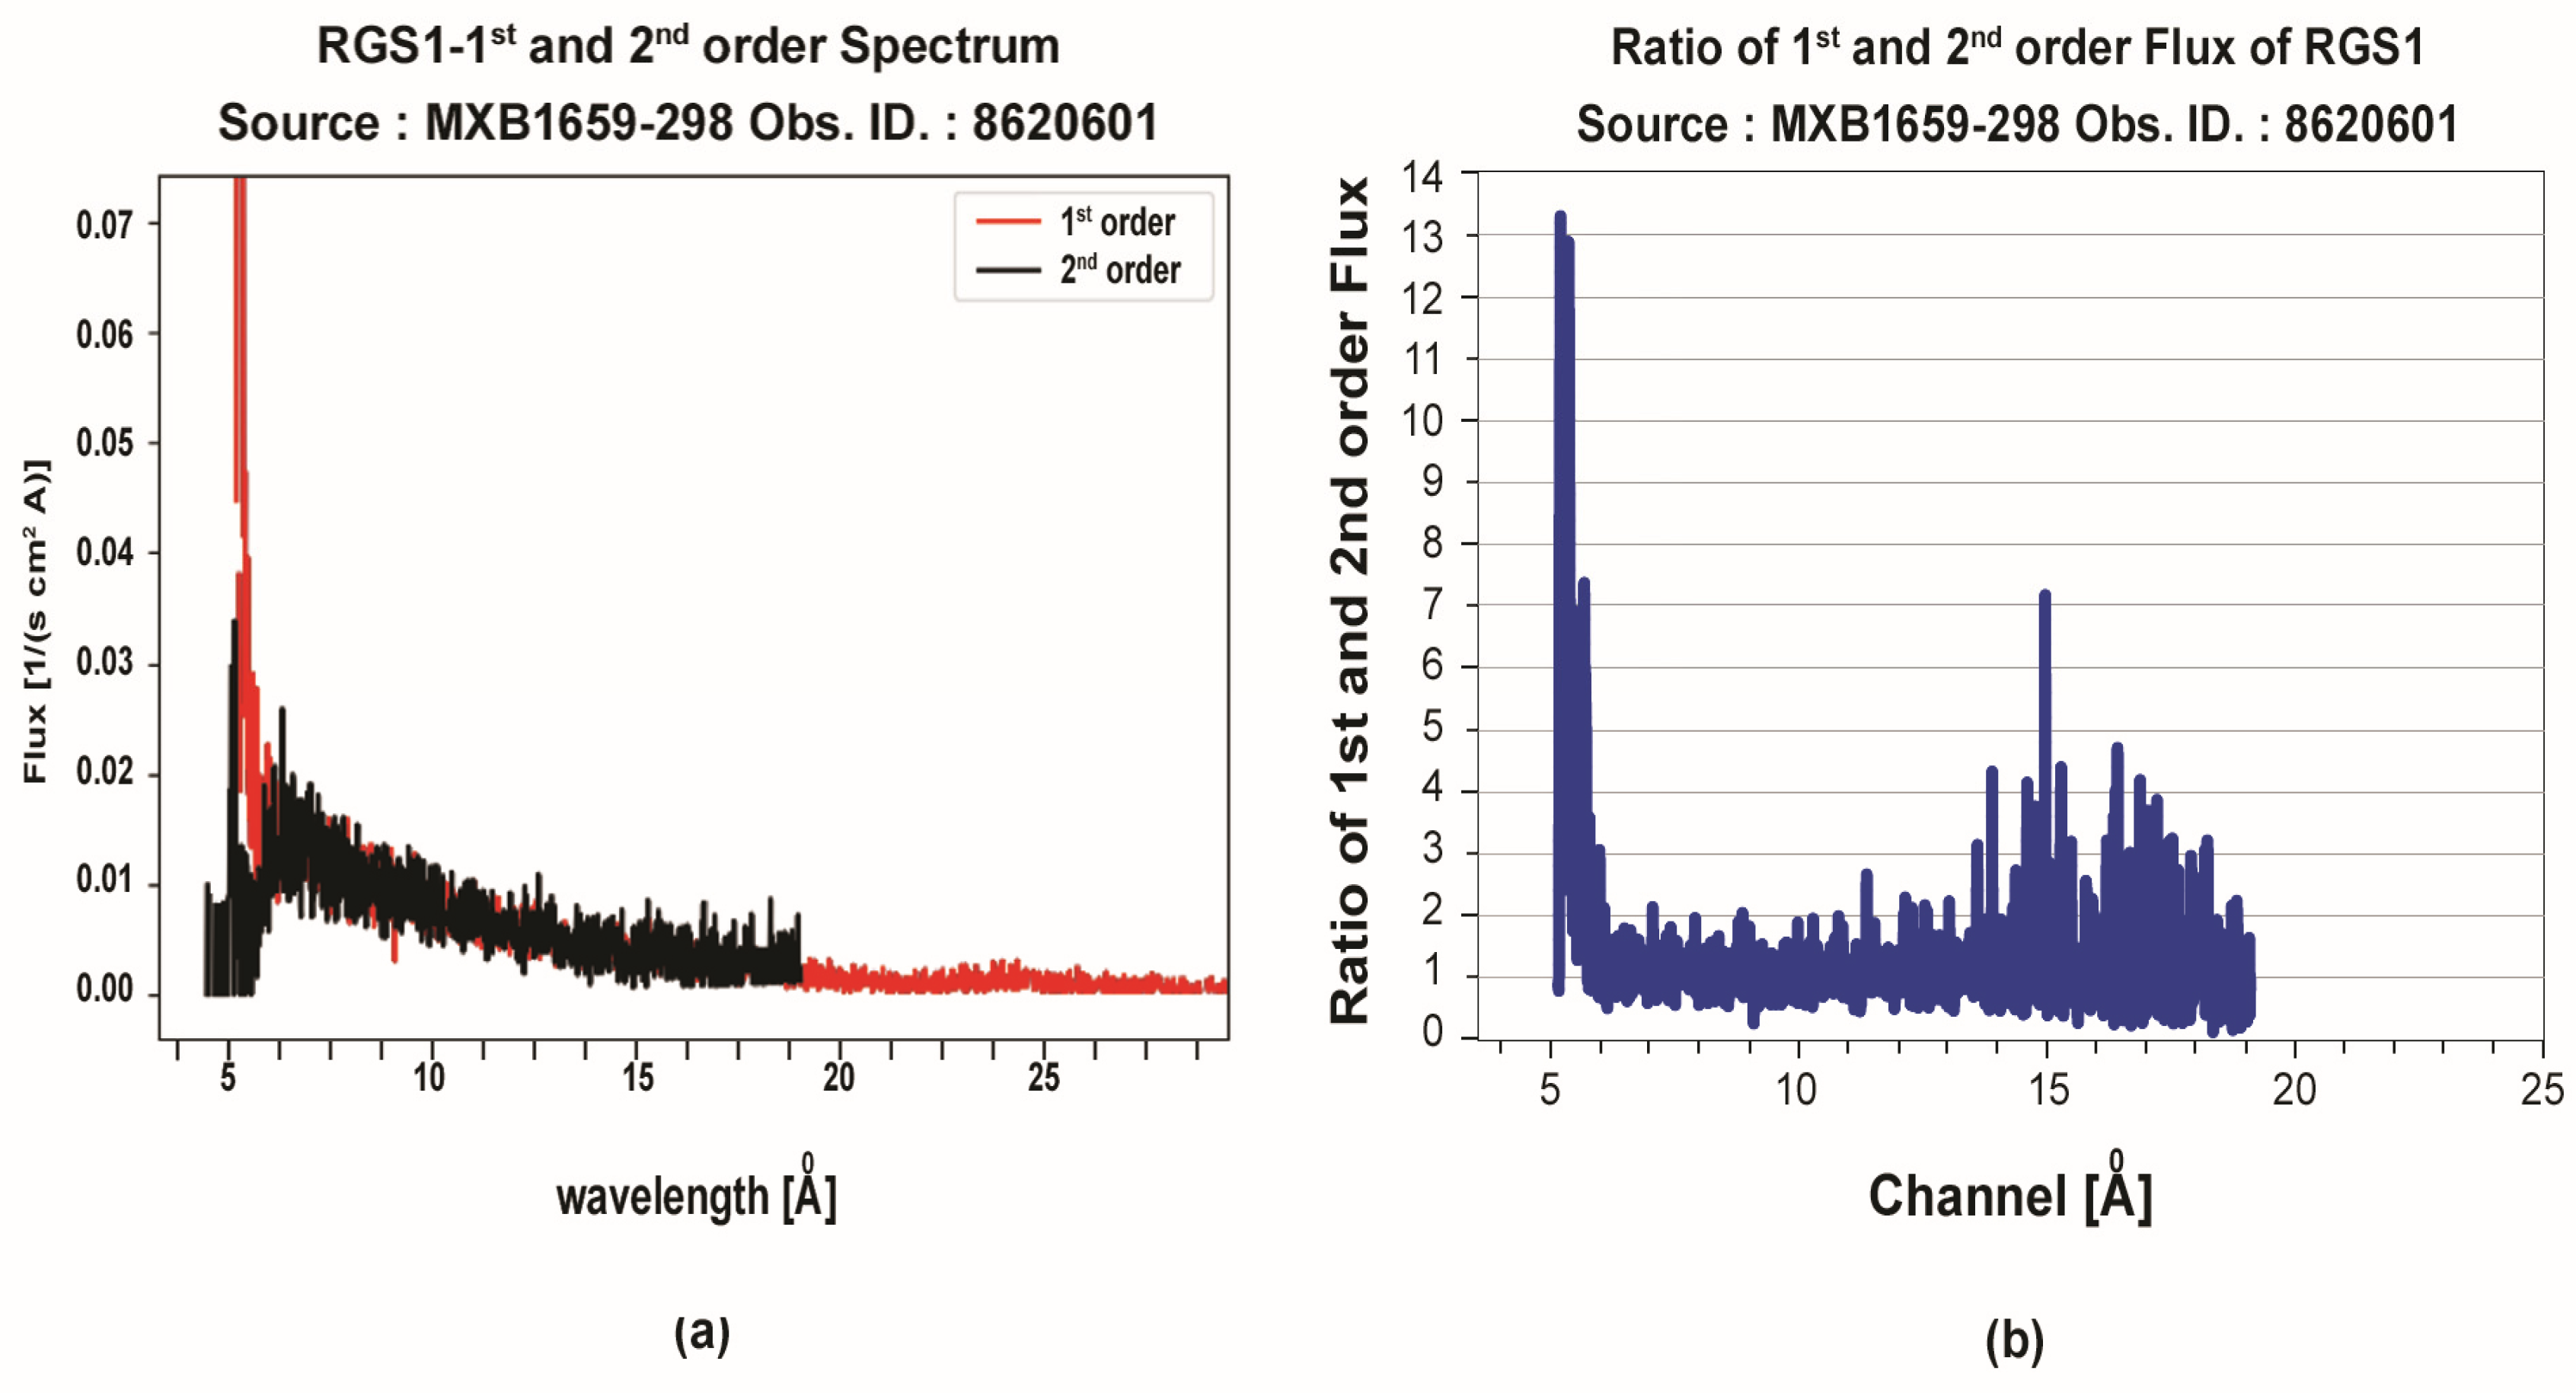
2.3. Data Validation

It is desirable to estimate if the spectra suffer from any pile-up to avoid analyzing an artificially modified spectrum, which would lead to a vague measure of the equivalent width of the absorption line. There is also the probability of migration of data to a higher order due to the accumulation of data. For the estimation of pile-up, we followed the method described in the Cor de Vries document1 and the work published by Cackett et al. in the year 2008, as the procedure described here yields better pile-up check results than the technique in SAS threads [35]. Additionally, we concentrated just on RGS1 data because their use of double nodes reduces the chances of pile-up. Using the SAS command ‘rgsfluxer’ with default parameters, distinct first-order and second-order fluxed files were produced and plotted together for comparison to check pile-up. Additionally, a second curve is also plotted with the ratio of these fluxes against wavelength; a ratio value near one implies pile-up-free data. Figure 1, shown below, is an indicator to choose a dataset suitable for further analysis, and we find that data recorded in the years 2000, 2001, and 2015 are partly affected by pile-up. Thus, to avoid the effect of data piling in these observations, we ignored energy below 0.5 keV and above 2.2 keV.

3. Timing and Spectral Analysis

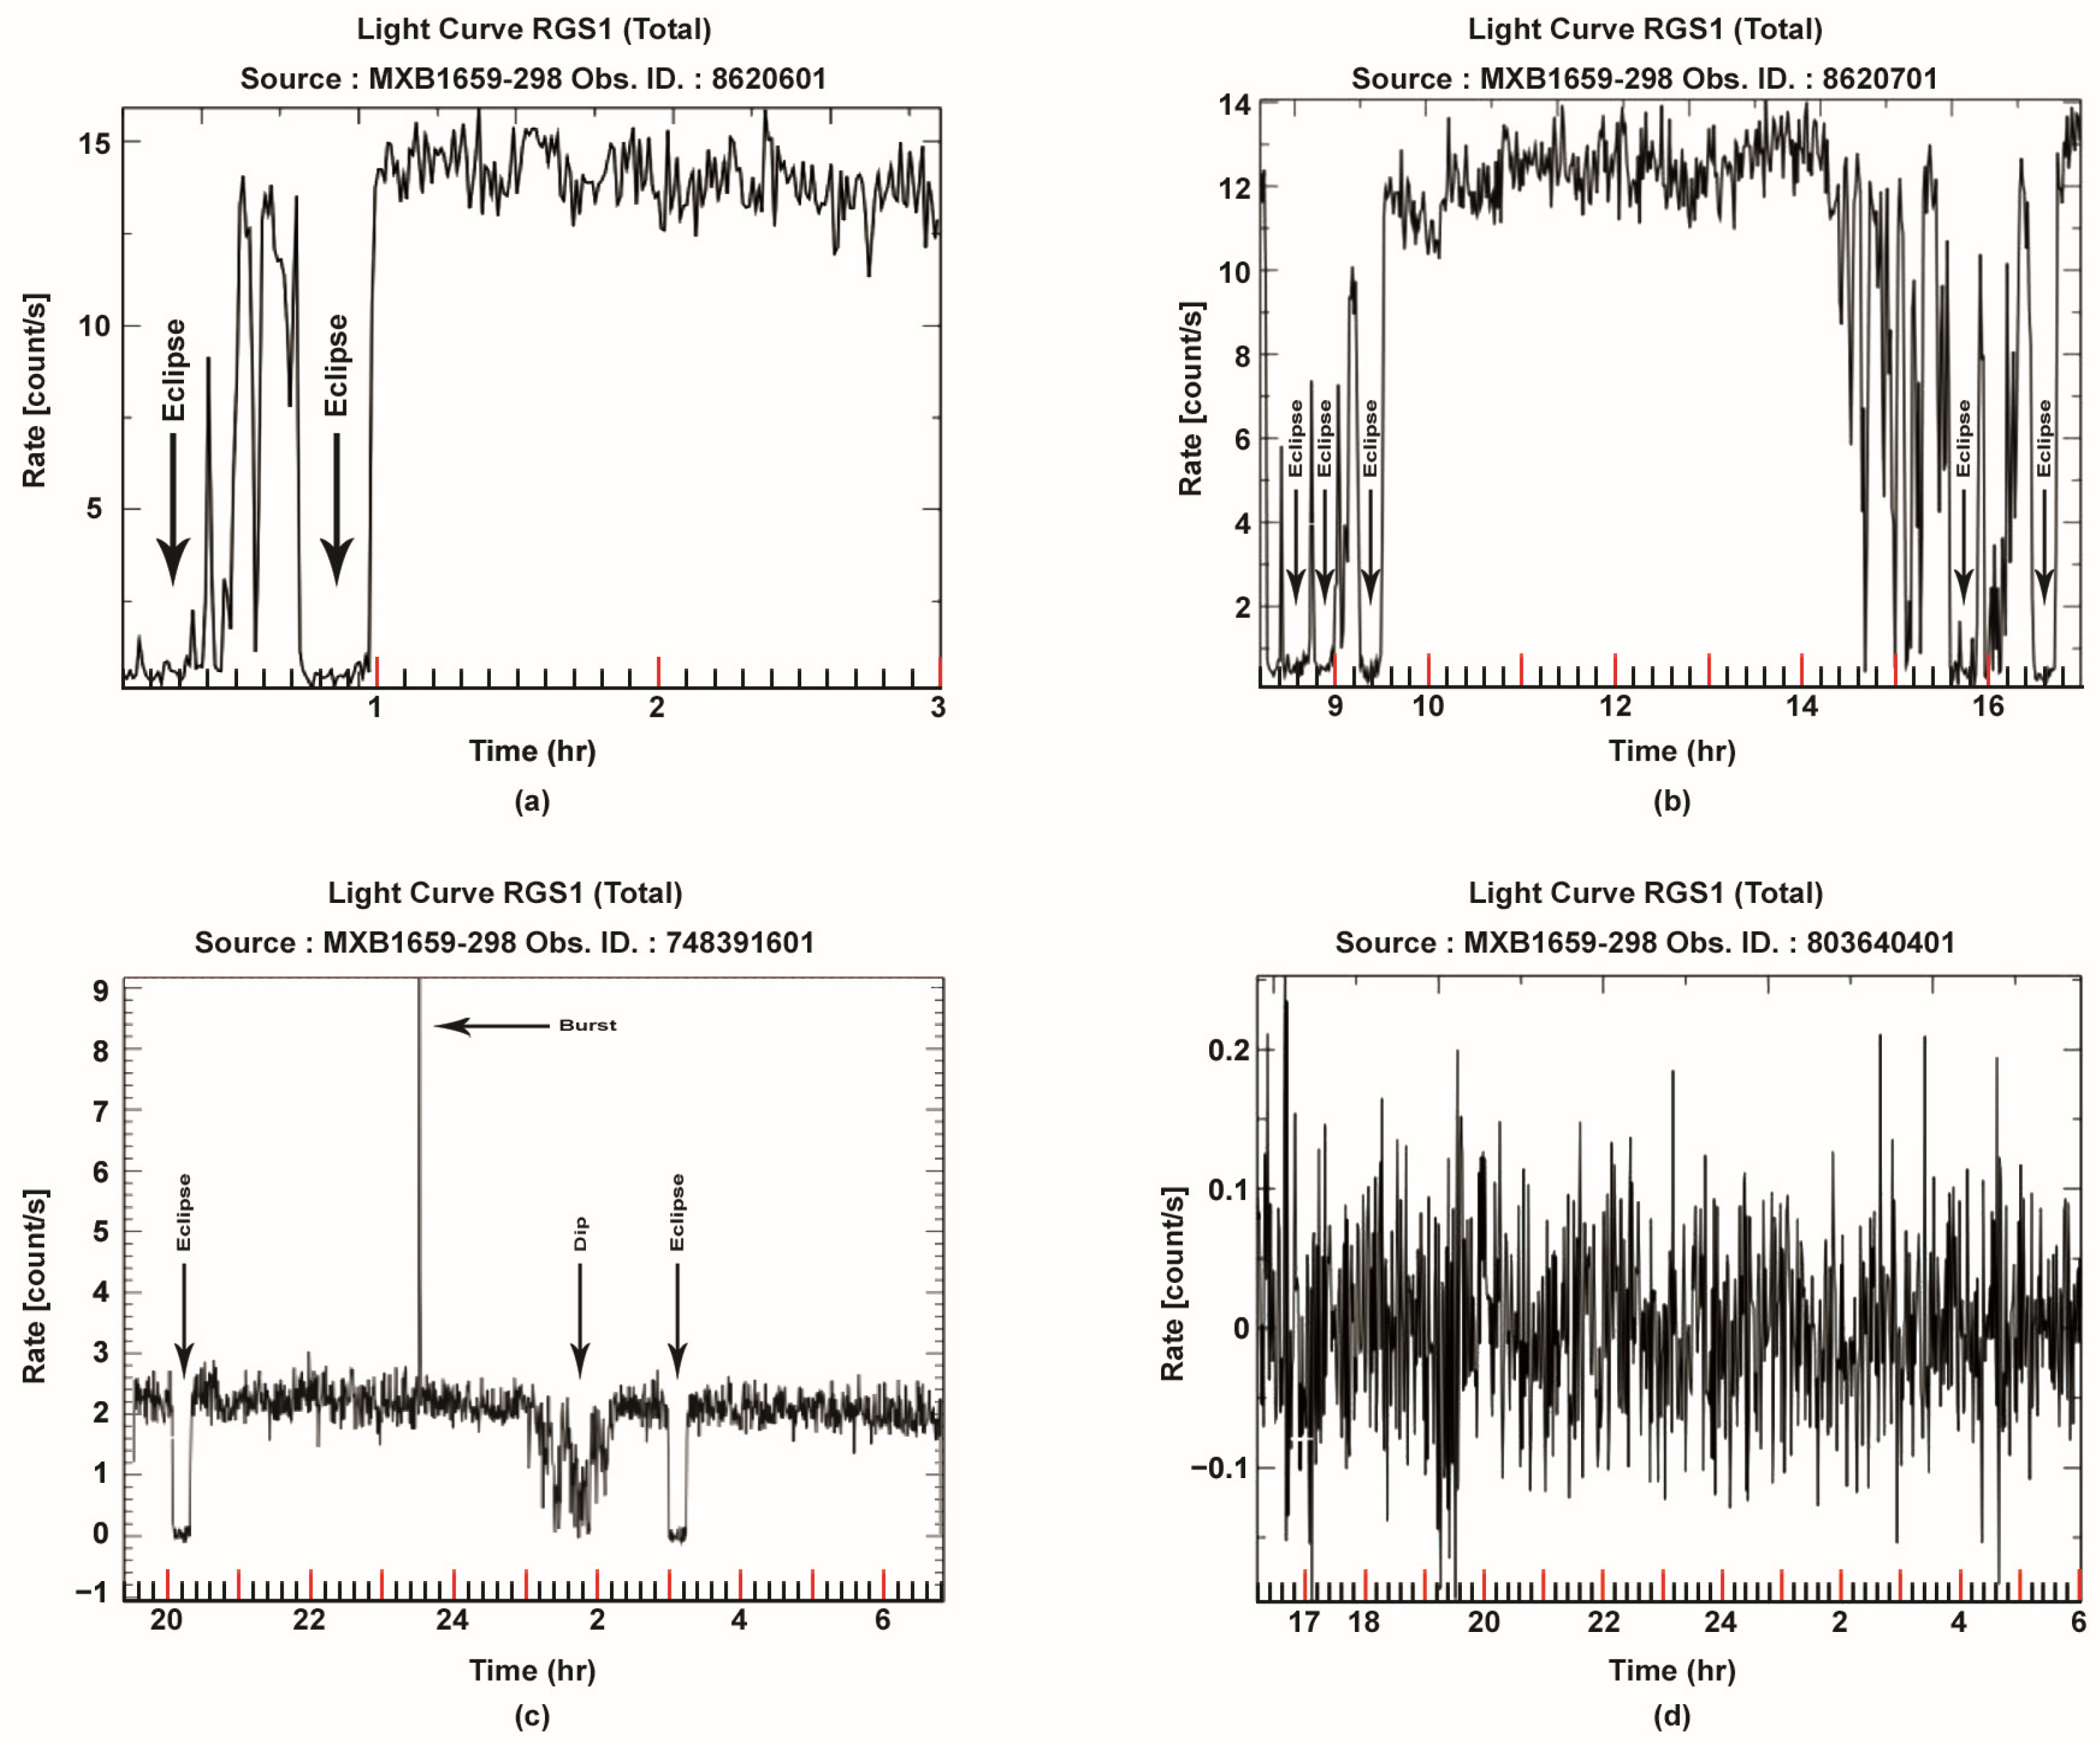
3.1. X-ray Light curve

As the primary aim of this work was to trace out absorption due to ISM, it was crucial to eliminate the influence of factors like dipping, eclipsing, etc. This was particularly important, the dipping phenomenon significantly modifies the X-ray spectrum below 4 keV [28]. Additionally, no clear-cut answer could be found in any previous papers [20,26,29] as to why most studies focused only on data recorded in the years 2001 and 2015, neglecting several other available observations. Thus, the rate curve of each observation was produced using the SAS task ‘rgslccorr’ with eventlists and srclists produced by the SAS task ‘rgsproc’. The bin size was chosen to be 60 s. We primarily obtained two distinctly separate types of light curves. The curves shown in Figure 2a–c are from observations performed in the year 2000 (Obs. ID 8620601), 2001 (Obs. ID 8620701), and 2015 (Obs. ID 748391601), respectively. These curves clearly show the presence of dipping, bursts, and eclipsing. On the other hand, the light curves of the remaining observations were similar to the curve shown in Figure 2d. We also plotted the soft and hard light curves for each case, as carried out by Trigo et al., and obtained similar results [36]. The light curve displayed in the paper is from the 2001 observation. The outcomes are almost the same, except that we primarily used the RGS data, while the previous plots were obtained using EPIC-PN data.
The plot displayed in Figure 2a is from the year 2000 and Figure 2c is from the year 2015, which were not discussed earlier. In these light curves, we can also see eclipsing and dipping activity. Thus, before spectrum analysis, we can now remove the dipping, eclipsing, and burst activity from the data by generating Good Time Interval (GTI) files and rerunning the SAS task ‘rgsproc’.
The light curves of observation IDs 153190101, 225580201, 803640301, and 803640401 are quite similar to the light curve shown in Figure 2d. As seen in Figure 2d, the count rate swings between positive and negative values. This might be due to the dominance of background data. If the background is a bit high and the source does not look particularly bright in soft X-rays, once we obtain a background-subtracted light curve, the count rate might become negative at some point, indicating that it is background-dominated. We plotted the light curve of CCD 9 of each of the above observations to ascertain our claim.
Discernibly, Figure 3a–d indicate that observations are highly dominated by background data. These data may be produced by a variety of sources, such as cosmic X-ray background, instrumental noise, or other astrophysical sources within the field of view. We can further clarify this by looking into the photon counts recorded in respective CCDs of RGS1, as presented in Table 2.
Since the data are already background-dominated, they are not suitable for spectral analysis. Therefore, we continued our analysis only with observations recorded in the years 2001 and 2015, specifically observation IDs 8620701 and 748391601.

3.2. Spectral Analysis

Since the observations preferred for spectral analysis (2001 and 2015) contained multiple dipping, eclipsing, and burst activities, we filtered the corresponding times by generating good time interval (GTI) files using the task ‘tabgtigen’. We reprocessed the data again with ‘rgsproc’, by filtering them with GTI to remove the dips, eclipses, and bursts present. The continuum thus derived was used further for spectral analysis. Narrow absorption lines have been preserved throughout the study by utilizing the group pulse height amplitude (GRPPHA) utility of science analysis software (SAS), which helps to combine adjacent channels to increase the signal-to-noise ratio (SNR) in each group. For this, each RGS spectrum was binned by a factor of 2 (two) (i.e., 1/3 of FWHM). The bin size is now 0.02 Å [3]. To analyze our high-resolution, low-binned data, we employed Cash statistics [37], which provides upper bounds and uncertainties for each parameter at a 90% confidence level. The values of absorption cross-sections were assessed from the literature of Verner et al. published in the year 1996, and Wilms et al.’s work was followed for abundance evaluation [11,38]. To model the interstellar absorption, we utilized the Tuibingen–Boulder ISM absorption model (Tbabs) in Xspec2. This model computes the total of the X-ray absorption cross-sections from ISM in the form of gas, grain, or molecule. Throughout the analysis, the parameter NH was left to account for variable-absorbing material near the source and galactic absorption due to neutral hydrogen within the Tbabs model. We searched for any instrumental features surrounding the observed absorption lines. The technique outlined in Cabot et al. was applied to determine if faulty pixelation caused the absorptions. SAS task rgsbackmodel’s background templates were utilized to confirm that absorptions were not due to background noise [39]. Therefore, ISM may be the source of absorption lines.

3.2.1. (0.45–2.15) keV Persistent Spectrum of Observation ID 8620701

The dataset (Observation ID 8620701) recorded by the RGS1 instrument of XMM-Newton between UTC 08:06:19 and 16:48:10 on 20 February 2001, with a total duration of approximately 8.4 h and a count rate of 2.789 ± 0.009 s−1 for an exposure time of 30.59 kiloseconds (Ks) was made free of eclipse, burst, and dipping activity. The effect of pile-up was also investigated and the energies below 0.45 keV and above 2.15 keV were excluded from the data to eliminate the possibility of data piling.
We first tried to fit the continuum 0.45–2.15 keV RGS1 spectrum of MXB 1659-298 with a simple powerlaw3 component (an additive model in Xspec, suitable to accommodate energy components originating from the accretion disc’s corona) absorbed by neutral interstellar matter using a multiplicative model, Tbabs. This is akin to the methodology employed by R. Iaria et al. [29]. Powerlaw spectra are characteristic of non-thermal emission processes, such as synchrotron radiation and inverse Compton scattering, common in high-energy astrophysical environments. We left the photon index parameter of this model to vary independently during fit because the low index value becomes confusing to comprehend if the power law’s index is linked to a Comptonized spectrum [16]. This yields a fit having a reduced χ2 value close to 1.26. Large residuals are evident close to 0.5 keV and also at energies like 1.35 and 2.0 keV. The residual seen at 0.54 keV is caused by the k edge of neutral oxygen [40]. The same oxygen edge was reported by C. Pinto et al. in the year 2013 for various other LMXBs, such as GX 9 + 9, GS 1826-238. Similarly, E. Costantini et al. also reported a neutral K edge of oxygen when analyzing the RGS data of the LMXB 4U 1820-30 in 2012 [41]. The other residuals seen in the spectra could be due to absorption lines.
To improve the fit of the residuals, we added a black body radiation (bbodyrad4) component followed by a multiplicative component zxipcf5 available in Xspec. The bbodyrad component mimics the thermal emission of soft X-rays originating from the neutron Star (NS) or the innermost part of the accretion disc. This component has two parameters: blackbody temperature (kTbb) in keV and its normalization, which helps us to estimate the temperature of the emitting region. The reduced χ2 value after adding this component is 1.24. The inclusion of the bbodyrad component is statistically significant, with an F-test statistic of 27.4046. However, residuals are still visible around 1.2 to 2.1 keV (see Figure 4). Inspired by previous works on this source, we too added a partial covering ionized absorption component, zxipcf, to account for the residuals seen in panel 3 (from the bottom) of Figure 4. This addition resulted in further improvement to the fit [20,26,29].
The zxipcf model stands for “XSTAR X-ray absorption by a partially covered photoionized absorber”. This model accounts for both the photoelectric absorption and the ionized absorption features such as absorption edges and lines. The zxipcf model in Xspec is used to describe X-ray spectra that have been absorbed by partially ionized material. Assuming that the photoionized absorber has a micro turbulent velocity of 200 km s−1, this component replicates the absorption from photoionized materials irradiated by a powerlaw source with spectral index Γ = 2.2. This component is parameterized by NH, which accounts for the equivalent hydrogen column density associated with the ionized absorber, including contributions from both neutral and ionized hydrogen atoms present in the ionized absorber. log(ξ)IA measures the degree of ionization of the absorbing material fIA, which indicates the fraction of the source covered by the absorber, and Z denotes redshift of the source and was fixed to zero. The F-test statistic value of 9.26 indicates that the addition of component zxipcf was statistically significant. The residuals were further reduced, as seen in the fourth panel of Figure 4. The reduced χ2 value is now 1.2.
To fit the negative residuals present between 1.15 and 1.25 keV and close to 2 keV, Gaussian components were used. In this process, the normalization parameter was kept negative while the rest of the parameters were left free. This improves the reduced χ2 value to 1.15. The residuals were found to be associated with the absorption lines at 1.21 keV and 2.01 keV and are now adjusted. The value of equivalent hydrogen column density due to ionized absorber appears to be ~58% less than that of the equivalent hydrogen column density in the ISM (see Table 3). The value of the covering fraction close to 1 suggests that a large part of the source is surrounded by the absorber. This result is significantly different than the previously obtained value of equivalent hydrogen column density associated with the ionized absorber (2.68 ± 1.8) × 1022 cm−2 with Log(ξ)IA value (4.27 ± 0.11) and covering factor equal to 0.92. Therefore, the best-fit model for this observation becomes Tbabs*zxipcf (bbodyrad + powerlaw) along with the Gaussian models to accommodate negative residuals.

3.2.2. (0.5–2.1) keV Persistent Spectrum of Observation ID 748391601

When we plot data of RGS1, we find that the SNR of data below 0.5 and above 2.1 is small. Thus, we ignored data below 0.5 keV and above 2.1 keV to prevent grossly misleading results. We started data fitting with a simple intrinsic powerlaw model to account for direct emission, followed by Tbabs to account for the photoelectric absorption due to the interstellar matter present in the LOS. The addition of the Tbabs component significantly improves the residuals, and the combination of models fits well, with χ2/d.o.f (=2195/1277) decreasing from 1.7 to (=1477/1276) 1.15. The F-test probability of chance improvement was very small, i.e., 7.64 × 10−122, justifying the addition of the component. As seen in panel 3 of Figure 4b, residuals are evident between 1.6 and 1.7 keV. We tried to fit the spectra with the bbodyrad component and zxipcf component one after another, as found suitable in dealing with residuals in the last observation. But here, in this case, the bbodyrad component turns out to be insensitive when fitting the data. On the other hand, the addition of zxipcf does not improve the residuals as expected. This leads to the impression that the residual could be due to the presence of an absorption line.
We then tried to fit the data with a Gaussian component, having parameters Line Energy (LineE), Line width (Sigma), and Normalization (norm), which represent the energy of the most prevalent photons in the line, the line’s breadth or dispersion around the central energy, and intensity of the spectral line, respectively. The values of the parameters of the Gaussian component are chosen as LineE = 1.71 keV, sigma= 0.01, and normalization is kept negative. The residuals disappeared, signifying the presence of an absorption line at 1.721 keV. The addition of the Gaussian component changes the value of χ2/d.o.f to 1.12 (=1422/1269), while the F-test probability obtained was 3.17 × 10⁻⁸. We do notice an absorption edge at 0.54 keV due to the K edge of neutral oxygen and at 0.871 keV due to O VIII [42]. Thus, the best-fit model for observation ID 748391601 becomes Tbabs*powerlaw, along with the Gaussian to fit the absorption line. We obtained a value of equivalent hydrogen column density ( 0.179 0.049 + 0.037 ) × 1022 atom cm−2, which is quite close to the value Galactic HI along LOS of this source.

4. Result and Discussion

We have analyzed and modelled the continuum spectra of the LMXB, MXB 1659-298, collected during the 2001 and 2015 outbursts. We utilized the RGS1 data for both analyses. We examined the 0.45–2.1 keV first-order spectra to constrain the NH in the direction of the source and to search for the signature of narrow absorption and emission features. To avoid potential piling and calibration uncertainty due to the Au K edge at 2.2 keV [29], we restricted our observations to this energy range. Although we initially considered all the observations, we found that the observations recorded in the years 2003, 2005, and 2017 are background-dominated and thus not suitable for spectrum analysis in the soft X-ray energy range or ISM study. Additionally, the literature mentions that much of the data obtained in the year 2000 were not correctly transmitted to the XMM-Newton centre at Vilspa, so these data were also rejected [26].
We found that the composition of material along LOS during the two observations was slightly different. The spectra of 2001 fit well with components bbodyrad and zxipcf along with Tbabs and powerlaw. A similar type of finding in the case of the 2001 observation was reported by many authors as well [20,26,29]. In the case of the 2015 observation, emission from the surface of the neutron star and the presence of ionized gases along LOS, as well as the addition of zxipcf, turned out to be statistically insignificant. The best-fit continuum in the analysis of the 2001 observation yields two NH values (see Table 3). The NH parameter given by model component Tbabs gives the equivalent hydrogen column density of neutral hydrogen atoms associated with the ISM, while the NH parameter given by model component zxipcf includes contributions from both neutral and ionized hydrogen atoms, indicating that the gas has a certain degree of ionization. We obtained the value equivalent hydrogen column density associated with ISM (NH ISM) ranging within (0.206–0.509) × 1022 atoms cm−2 with the addition of the continuum. Contrary to that, the analysis of 2015 data gives an NH ISM value of 0.179 × 10²² atoms cm−2. MXB 1659-298 is a well-studied LMXB, and several studies have measured NH ISM along its line of sight. Its value typically ranges up to about 0.3 × 10²² atoms cm−2, as shown in examples by G. Ponti et al. (NH ISM = 0.242–0.33 × 10²² atoms cm−2), L. Sidoli et al. (NH ISM = 0.2–0.3 × 10²² atoms cm−2), and R. Iaria et al. (NH ISM = 0.282–0.320 × 10²² atoms cm−2) [20,26,29]. Although the 0.509 × 10²² atoms cm−2 value is higher than the typical reported values for MXB 1659-298, it is within the realm of possibility. The variation seen might be due to the choice of the continuum, likely because the curvature as the measure in the X-ray above 25 Å takes into account the contribution from HI and HII, and the presence of a local absorber [4]. The value of NH  ( 0.296 0.112 + 0.237 ) × 1022 atom cm−2 associated with the local ionized absorber surrounding the source, as found in the 2001 data analysis, is appreciably less than the previously determined values for the corresponding logξ value ~ 2.46 [20,29]. It is around 50% less compared to what has previously been determined. The ionized absorber, although of low density, covers nearly the entire source with a covering factor of 0.99.
The value of equivalent hydrogen column density associated with ISM found in the 2015 data analysis NH ISM  ( 0.179 0.049 + 0.037 ) × 1022 atoms cm−2 is quite lower than the 2001 data and very close to the galactic HI value 0.18 × 10²² atom cm−2 calculated by Dickey and Lockman in the year 1990 [43]. This finding aligns with our assumption that the LOS towards the source is dominated by ISM, a moderate amount of local ionized absorber surrounding the source with moderate ionization.
We detected two absorption lines at 1.219 and 2.06 keV due to ions Fe XX and Si XIV in the observation from 2001, while one more absorption line due to Mg XI at 1.72 keV was detected in the 2015 observation (see Figure 5). The RGS data from 2001 were also analyzed by R. Iaria et al. in 2019, who detected two absorption lines O VIII and Ne X with best-fit continuum Tbabs*powerlaw, and categorically mentioned that the absorption lines seen in the spectra are due to ISM [29]. The Mg XI line in the 2015 spectra, as detected in our analysis, is with the same continuum.
The Si XIV line was also reported by G. Ponti et al. in 2019 [20]. In the same work, they tentatively detected Mg XI, but could not constrain the wavelength accurately. Additionally, they identified 60 absorption lines in soft states using XMM-Newton’s EPIC-PN data and Chandra’s HETG data. Heavily ionized gas is typically found in collisional ionization equilibrium [4], while the absorption edges arise from photoelectric absorption of neutral atoms [41].
One of the aims of our analysis was to determine absorption column densities of abundant elements Mg, Si, and Fe. The column density can be obtained directly from edge depth, or it can be derived using Spitzer Jr. L. relation; we used the latter method [44]. We understand that, in principle, the choice of continuum components may affect the estimate of the equivalent hydrogen column density, but as the other ionic column densities are estimated through narrow absorption lines, which do not depend on the continuum, they may be well constrained even though the data belong to two different states. The necessary values of oscillator strength were adopted from Verner et al.’s paper and the values of equivalent width (eqwidth) were derived by us [38]. We obtained the eqwidth of Fe XX, Si XIV, and Mg XI as 20.03 × 10⁻¹³ eV, 110.21 × 10⁻¹³ eV, and 42.23 × 10⁻¹³ eV, respectively. The column density against wavelength 10.12 × 10⁻⁸ cm, 6.18 × 10⁻⁸ cm, and 7.22 × 10⁻⁸ cm, is displayed in Table 4.

5. Conclusions

We have systematically analyzed all seven XMM-Newton RGS observations of LMXB MXB 1659-298. However, only data from 2001 and 2015 were suitable for spectral analysis and study of ISM due to background dominance in the other observations.
During the analysis of 2001 data, we found that the source is surrounded by a local moderately ionized absorber (logξ ~ 2.46) of moderate density (NH  ( 0.296 0.112 + 0.237 ) × 1022 atom cm−2). This validates previous findings [20,26,29] but the values obtained in our analysis are nearly 50 percent less than before, which may be due to the choice of the best-fit continuum. At the same time, we noticed that the best-fit continuum also yields equivalent column density associated with ISM of 0.509 × 10²² atoms cm−2, nearly 2 times higher than the previously measured values in the range (0.2–0.33) × 1022 atoms cm−2 [20,29]. This observed variation is probably due to reasons such as the choice of a continuum, the presence of an ionized absorber, and because the X-ray above 25 Å takes into account the contribution from HI and HII.
Contrary to this, the analysis of 2015 data indicates an absence of any ionized absorber in the LOS of the source. However, the NH ISM value obtained was ( 0.179 0.049 + 0.037 ) × 1022 atoms cm−2 (which is nearly equal to the Galactic HI value), which becomes the basis of our claim of the presence of ISM in the LOS of the source.
Furthermore, the presence of the K edge of neutral oxygen at 0.54 keV (23.1 Å) and the O VIII K edge at 0.87 keV supports the multiphase nature of the ISM [4,29].
During the spectrum analysis, we significantly detected three absorption lines, namely Fe XX, Si XIV, and Mg XI, with transition levels 1s22p2-2p2(3p)4d, 1s2-1s2p, and 1s2-1s6p, respectively. Among these, the Si XIV line was previously reported by G. Ponti et al. in 2019 using EPIC-PN data [20]. The absorption edge due to the K edge of neutral oxygen could also be seen in the fitted spectra.
Although we can ascribe the origin of Mg XI to the ISM, the origin of absorption lines Fe XX and Si XIV may be the ionized absorber occulting the source.
Due to limitations in the best-fit model components, we were unable to measure the Doppler shifts of the absorption lines. This is a powerful technique for mapping the interstellar medium by revealing the velocity structure, spatial distribution, and physical properties of the gas.

Author Contributions

Conceptualization, R.M. and M.B.; methodology, R.M. and M.B.; software, R.M. and P.B.; supervision, M.B.; visualization, R.M.; formal analysis: R.M., P.B. and M.B.; writing—original draft, R.M.; writing—review and editing, R.M., P.B. and M.B. All authors have read and agreed to the published version of the manuscript.

Funding

This research received no external funding.

Data Availability Statement

Publicly available datasets were analyzed in this study. These data can be found here: [https://heasarc.gsfc.nasa.gov/cgi-bin/W3Browse/w3browse.pl, accessed on 20 April 2022].

Acknowledgments

We are thankful to the anonymous referee for their useful and detailed comments, which helped us to improve the work immensely. We used data from the public archive of XMM-Newton (Heasarc), provided by the European Space Agency, and we are thankful to them. We are thankful to the XMM-helpdesk of the European Space Agency for always guiding us with prompt and focused suggestions.

Conflicts of Interest

The authors declare no conflicts of interest.

Abbreviations

NSLMXBNeutron Star Low Mass X-ray Binary
RGSReflection Grating Spectrometer
EPIC-PNEuropean Photon Imaging Camera-PN
ISMInterstellar Medium
LOSLine of Sight
TbabsTuibingen–Boulder ISM absorption model
HETGSHigh Energy Transmission Grating Spectrometer

Notes

1
2
3
4
5
6
7

References

  1. Yao, Y.; Wang, Q.D. X-Ray absorption line spectroscopy of the galactic hot interstellar medium. Astrophys. J. 2005, 624, 751. [Google Scholar] [CrossRef]
  2. Juett, A.M.; Schulz, N.S.; Chakrabarty, D. High-resolution X-ray spectroscopy of the interstellar medium: Structure at the oxygen absorption edge. Astrophys. J. 2004, 612, 308. [Google Scholar] [CrossRef]
  3. Pinto, C.; Kaastra, J.S.; Costantini, E.; Verbunt, F. High-resolution X-ray spectroscopy of the interstellar medium-XMM-Newton observation of the LMXB GS 1826-238. Astron. Astrophys. 2010, 521, A79. [Google Scholar] [CrossRef]
  4. Pinto, C.; Kaastra, J.S.; Costantini, E.; De Vries, C. Interstellar medium composition through X-ray spectroscopy of low-mass X-ray binaries. Astron. Astrophys. 2013, 551, A25. [Google Scholar] [CrossRef]
  5. Kim, S.H.; Martin, P.G. On the dust-to-gas ratio and large particles in the interstellar medium. Astrophys. J. 1996, 462, 296–308. [Google Scholar] [CrossRef]
  6. Frisch, P.C.; Slavin, J.D. The chemical composition and gas-to-dust mass ratio of nearby interstellar matter. Astrophys. J. 2003, 594, 844. [Google Scholar] [CrossRef]
  7. Jenkins, E.B. A unified representation of gas-phase element depletions in the interstellar medium. Astrophys. J. 2009, 700, 1299. [Google Scholar] [CrossRef]
  8. Kaastra, J.S.; De Vries, C.P.; Costantini, E.; Den Herder, J.W.A. Effective area calibration of the reflection grating spectrometers of XMM-Newton-I. X-ray spectroscopy of the Crab nebula. Astron. Astrophys. 2009, 497, 291–310. [Google Scholar] [CrossRef]
  9. Yao, Y.; Schulz, N.S.; Gu, M.F.; Nowak, M.A.; Canizares, C.R. High-resolution X-ray spectroscopy of the multiphase interstellar medium toward Cyg X-2. Astrophys. J. 2009, 696, 1418. [Google Scholar] [CrossRef]
  10. Juett, A.M.; Schulz, N.S.; Chakrabarty, D.; Gorczyca, T.W. High-resolution X-ray spectroscopy of the interstellar medium. II. Neon and iron absorption edges. Astrophys. J. 2006, 648, 1066. [Google Scholar] [CrossRef]
  11. Wilms, J.; Allen, A.; McCray, R. On the absorption of X-rays in the interstellar medium. Astrophys. J. 2000, 542, 914. [Google Scholar] [CrossRef]
  12. Ueda, Y.; Murakami, H.; Yamaoka, K.; Dotani, T.; Ebisawa, K. Chandra high-resolution spectroscopy of the absorption-line features in the low-mass X-ray binary GX 13 + 1. Astrophys. J. 2004, 609, 325. [Google Scholar] [CrossRef]
  13. Ueda, Y.; Mitsuda, K.; Murakami, H.; Matsushita, K. Study of the galactic interstellar medium from high-resolution X-ray spectroscopy: X-ray absorption fine structure and abundances of O, Mg, Si, S, and Fe. Astrophys. J. 2005, 620, 274. [Google Scholar] [CrossRef]
  14. Yao, Y.; Wang, Q.D. X-ray absorption spectroscopy of the multiphase interstellar medium: Oxygen and neon abundances. Astrophys. J. 2006, 641, 930. [Google Scholar] [CrossRef]
  15. Cackett, E.M.; Miller, J.M.; Raymond, J.; Homan, J.; Van Der Klis, M.; Méndez, M.; Steeghs, D.; Wijnands, R. Investigating the Nature of Absorption Lines in the Chandra X-Ray Spectra of the Neutron Star Binary 4U 1820-30. Astrophys. J. 2008, 677, 1233. [Google Scholar] [CrossRef]
  16. Mahato, R.; Baruah, M. A Comprehensive Study of Soft X-ray Absorption Features in GX 13 + 1 Using XMM-Newton Observations. Galaxies 2023, 11, 106. [Google Scholar] [CrossRef]
  17. Parmar, A.N.; White, N.E.; Giommi, P.; Gottwald, M. The discovery of 3.8 hour periodic intensity dips and eclipses from the transient low-mass X-ray binary EXO 0748-676. Astrophys. J. 1986, 308 Pt 1, 199–212. [Google Scholar] [CrossRef]
  18. Lewin, W.H.G.; Hoffman, J.A.; Doty, J.; Hearn, D.R.; Clark, G.W.; Jernigan, J.G.; Li, F.K.; McClintock, J.E.; Richardson, J. Discovery of X-ray bursts from several sources near the galactic centre. Mon. Not. R. Astron. Soc. 1976, 177, 83P–92P. [Google Scholar] [CrossRef]
  19. Sidoli, L.; Parmar, A.N.; Oosterbroek, T.; Boirin, L. Recent XMM-Newton results on iron absorption lines in low mass X-ray binaries. In Frontier Objects in Astrophysics and Particle Physics; Societa Italiana di Fisica (SIF): Bologna, Italy, 2003; p. 341. [Google Scholar]
  20. Ponti, G.; Bianchi, S.; De Marco, B.; Bahramian, A.; Degenaar, N.; Heinke, C.O. Evolution of the disc atmosphere in the X-ray binary MXB 16591-298, during its 2015–17 outburst. Mon. Not. R. Astron. Soc. 2019, 487, 858–870. [Google Scholar]
  21. Galloway, D.K.; Muno, M.P.; Hartman, J.M.; Psaltis, D.; Chakrabarty, D. Thermonuclear (Type I) X-ray bursts observed by the Rossi X-ray timing explorer. Astrophys. J. Suppl. Ser. 2008, 179, 360. [Google Scholar] [CrossRef]
  22. Iaria, R.; Gambino, A.F.; Di Salvo, T.; Burderi, L.; Matranga, M.; Riggio, A.; Sanna, A.; Scarano, F.; D’Aì, A. A possible solution of the puzzling variation of the orbital period of MXB 1659-298. Mon. Not. R. Astron. Soc. 2018, 473, 3490–3499. [Google Scholar] [CrossRef]
  23. Cominsky, L.R.; Wood, K.S. Discovery of a 7.1 hour period and eclipses from MXB 1659-29. Astrophys. J. 1984, 283 Pt 1, 765–773. [Google Scholar] [CrossRef]
  24. Cominsky, L.R.; Wood, K.S. Further observations of the eclipsing X-ray burst source MXB 1659-29. Astrophys. J. 1989, 337 Pt 1, 485–493. [Google Scholar] [CrossRef]
  25. Jain, C.; Paul, B.; Sharma, R.; Jaleel, A.; Dutta, A. Indication of a massive circumbinary planet orbiting the low-mass X-ray binary MXB 1658-298. Mon. Not. R. Astron. Soc. Lett. 2017, 468, L118–L122. [Google Scholar] [CrossRef]
  26. Sidoli, L.; Oosterbroek, T.; Parmar, A.N.; Lumb, D.; Erd, C. An XMM-Newton study of the X-ray binary MXB 1659-298 and the discovery of narrow X-ray absorption lines. Astron. Astrophys. 2001, 379, 540–550. [Google Scholar] [CrossRef]
  27. Sidoli, L.; Parmar, A.N.; Oosterbroek, T. Discovery of absorption lines in Low Mass X-ray Binaries: MXB 1659-298 and GX 13 + 1. Mem. Soc. Astron. Ital. 2004, 75, 480. [Google Scholar]
  28. Trigo, M.D.; Parmar, A.N.; Boirin, L.; Méndez, M.; Kaastra, J.S. Spectral changes during dipping in low-mass X-ray binaries due to highly-ionized absorbers. Astron. Astrophys. 2006, 445, 179–195. [Google Scholar] [CrossRef]
  29. Iaria, R.; Mazzola, S.M.; Bassi, T.; Gambino, A.F.; Marino, A.; Di Salvo, T.; Sanna, A.; Riggio, A.; Burderi, L.; d’Amico, N. Broadband spectral analysis of MXB 1659-298 in its soft and hard state. Astron. Astrophys. 2019, 630, A138. [Google Scholar] [CrossRef]
  30. Den Herder, J.W.; Brinkman, A.C.; Kahn, S.M.; Branduardi-Raymont, G.; Thomsen, K.; Aarts, H.; Audard, M.; Bixler, J.V.; den Boggende, A.J.; Cottam, J.; et al. The reflection grating spectrometer on board XMM-Newton. Astron. Astrophys. 2001, 365, L7–L17. [Google Scholar] [CrossRef]
  31. Jansen, F.; Lumb, D.; Altieri, B.; Clavel, J.; Ehle, M.; Erd, C.; Gabriel, C.; Guainazzi, M.; Gondoin, P.; Much, R.; et al. XMM-Newton observatory-I. The spacecraft and operations. Astron. Astrophys. 2001, 365, L1–L6. [Google Scholar] [CrossRef]
  32. Strüder, L.; Briel, U.; Dennerl, K.; Hartmann, R.; Kendziorra, E.; Meidinger, N.; Pfeffermann, E.; Reppin, C.; Aschenbach, B.; Bornemann, W.; et al. The European photon imaging camera on XMM-Newton: The pn-CCD camera. Astron. Astrophys. 2001, 365, L18–L26. [Google Scholar] [CrossRef]
  33. Turner, M.J.; Abbey, A.; Arnaud, M.; Balasini, M.; Barbera, M.; Belsole, E.; Bennie, P.J.; Bernard, J.P.; Bignami, G.F.; Boer, M.; et al. The European photon imaging camera on XMM-Newton: The MOS cameras. Astron. Astrophys. 2001, 365, L27–L35. [Google Scholar] [CrossRef]
  34. Arnaud, K.A. XSPEC: The first ten years. In Astronomical Data Analysis Software and Systems V; ASP Conference Series; Jacoby, G.H., Barnes, J., Eds.; Astronomical Society of the Pacific: San Francisco, CA, USA, 1996; Volume 101, p. 17. [Google Scholar]
  35. Cackett, E.M.; Miller, J.M.; Bhattacharyya, S.; Grindlay, J.E.; Homan, J.; Van Der Klis, M.; Miller, M.C.; Strohmayer, T.E.; Wijnands, R. Relativistic iron emission lines in neutron star low-mass X-ray binaries as probes of neutron star radii. Astrophys. J. 2008, 674, 415. [Google Scholar] [CrossRef]
  36. Trigo, M.D.; Sidoli, L.; Boirin, L.; Parmar, A.N. XMM-Newton observations of GX 13 + 1: Correlation between photoionised absorption and broad line emission. Astron. Astrophys. 2012, 543, A50. [Google Scholar] [CrossRef]
  37. Cash, W. Parameter estimation in astronomy through application of the likelihood ratio. Astrophys. J. 1979, 228 Pt 1, 939–947. [Google Scholar] [CrossRef]
  38. Verner, D.A.; Ferland, G.J.; Korista, K.T.; Yakovlev, D.G. Atomic data for astrophysics. II. New analytic fits for photoionization cross sections of atoms and ions. arXiv 1996, arXiv:astro-ph/9601009. [Google Scholar] [CrossRef]
  39. Cabot, S.H.; Wang, Q.D.; Yao, Y. XMM–Newton/Reflection Grating Spectrometer detection of the missing interstellar O vii Kα absorption line in the spectrum of Cyg X-2. Mon. Not. R. Astron. Soc. 2013, 431, 511–519. [Google Scholar] [CrossRef]
  40. De Vries, C.P.; Den Herder, J.W.; Kaastra, J.S.; Paerels, F.B.; Den Boggende, A.J.; Rasmussen, A.P. The interstellar oxygen-K absorption edge as observed by XMM-Newton-Separation of instrumental and interstellar components. Astron. Astrophys. 2003, 404, 959–967. [Google Scholar] [CrossRef]
  41. Costantini, E.; Pinto, C.; Kaastra, J.S.; Freyberg, M.J.; Kuiper, L.; Méndez, M.; de Vries, C.P.; Waters, L.B.F.M. XMM-Newton observation of 4U 1820-30-Broad band spectrum and the contribution of the cold interstellar medium. Astron. Astrophys. 2012, 539, A32. [Google Scholar] [CrossRef]
  42. Gambino, A.F.; Iaria, R.; Di Salvo, T.; Mazzola, S.M.; Marino, A.; Burderi, L.; Riggio, A.; Sanna, A.; d’Amico, N. Spectral analysis of the dipping LMXB system XB 1916-053. Astron. Astrophys. 2019, 625, A92. [Google Scholar] [CrossRef]
  43. Dickey, J.M.; Lockman, F.J. HI in the Galaxy. Annu. Rev. Astron. Astrophys. 1990, 28, 215–259. [Google Scholar] [CrossRef]
  44. Spitzer, L., Jr. Physical Processes in the Interstellar Medium; John Wiley & Sons: Hoboken, NJ, USA, 2008. [Google Scholar]
Figure 1. Figures to check the X-ray loading of data. (a) The plot of 1st-order flux overlaid on 2nd-order flux of RGS1, Obs. ID 8620601. (b) Ratio of 1st- and 2nd-order flux of RGS1 data, Obs. ID 8620601.
Galaxies 12 00041 g001
Figure 2. Light curve of energy range 0.3–2.5 keV with data recorded in RGS1 showing the occurrence of dip, eclipse, and burst activity. Bin time 60 s. Time is in hours since the start of the respective observations. (a) Obs. ID 8620601, start time 00:08:06 UTC of 22 March 2000; (b) Obs. ID 8620701, start time 08:06:19 UTC of 20 February 2001; (c) Obs. ID 748391601, start time 19:18:10 UTC of 26 September 2015; and (d) Obs. ID 803640401, start time 16:07:58 UTC on 21 August 2017.
Galaxies 12 00041 g002
Figure 3. Light curve of CCD-9 in energy range 0.3–2.5 keV with data recorded in RGS1. Bin time 60 s. Time is in hours since the start of the respective observations. (a) Obs. ID 8620601, start time 00:08:06 UTC of 22 March 2000; (b) Obs. ID 8620701, start time 08:06:19 UTC of 20 February 2001; (c) Obs. ID 748391601, start time 19:18:10 UTC of 26 September 2015; and (d) Obs. ID 803640401, start time 16:07:58 UTC on 21 August 2017.
Galaxies 12 00041 g003
Figure 4. The RGS1 1st-order best-fit unfolded spectra of persistent emission and changing residuals with the addition of components one after another. (a) Observation ID. 8620701 in the energy range (0.45–2.15) keV and (b) Observation ID 748391601 in the energy range (0.50–2.1) keV.
Galaxies 12 00041 g004
Figure 5. The RGS1 1st-order best-fit unfolded spectra showing the absorption lines and edges in the region around the narrow absorption features, (a) Fe XX absorption line detected in observation ID 8620701, (b) Si XIV absorption line detected in observation ID 8620701, and (c) Mg XI absorption line detected in observation ID 748391601.
Galaxies 12 00041 g005
Table 1. Observation log of MXB 1659-298 recorded in XMM-Newton (Instrument: RGS1).
Obs. No.Obs. IDExposure Date
(YYYY-MM-DD)
and TIME (HH:MM:SS)
Exposure Duration RGS1 (s)Effective Exposure
RGS1 (s)
Net Count Rate
(cts/s)
186206012000-03-22, 00:08:0610,42270415.090 ± 0.028
286207012001-02-20, 08:06:1931,31130,5902.789 ± 0.009
3 *1531901012003-03-13, 14:39:5283,16782,400−0.001 ± 0.002
4 *2255802012005-03-19, 12:05:2759,10458,440−0.010 ± 0.002
57483916012015-09-26, 19:18:1641,81036,6500.6755 ± 0.0046
6 *8036403012017-03-23, 06:06:2042,90742,7700.0049 ± 0.0014
7 *8036404012017-08-21, 16:07:5850,20850,050−0.0021 ± 0.0014
* Not suitable for spectral analysis since RGS data are heavily dominated by background flux.
Table 2. Source and background counts recorded per CCD for obs. ID 748391601 and 803640401.
CCD No.Observation ID 748391601
Date: 26-09-2015
(Source Counts Dominated)
Observation ID 803640401
Date: 21-08-2017
(Background Counts Dominated)
RGS1RGS1
Source CountsBackground CountsSource CountsBackground Counts
CCD 1827451391743
CCD 2189510168591486
CCD 33191566372625
CCD 45260630393670
CCD 57502665461623
CCD 610,052680442616
CCD 7----
CCD 89118409398426
CCD 93758191500407
Table 3. Best fit results of obs. ID 8620701 and 748391601.
ModelParameterUnitObs. ID 8620701 (2001)Obs. ID 743917601 (2015)
TbabsNHX 1022 atoms cm−2 0.509 0.137 + 0.147 0.179 0.049 + 0.037
PowerlawΓ 3.934 1.041 + 1.637 1.909 0.199 + 0.172
normph/keV/cm2/s at 1 keV 0.007 0.034 + 0.041 0.027 0.001 + 0.003
BbodyradkTbbkeV 0.727 0.089 + 0.091
norm 148.611 42.27 + 82.58
ZxipcfNHX 1022 atoms cm−2 0.296 0.112 + 0.237
Log(ξ)IA 2.464 0.085 + 0.119
fIA 0.990 0.305
Gaussian1LineEkeV 1.219 0.003 + 0.004 1.721 0.257 + 0.031
SigmakeV 0.002 0.003 + 0.004 0.007 0.007 + 0.058
Norm 0.0002 ± 0.00007 0.00004 0.00002 + 0.00004
Element Fe XXMg XI
EWeV 2.49 1.309 + 1.008 −5.55 ± 0.004
Gaussian 2LineEkeV 2.016 0.013 + 0.011
SigmakeV 0.001 0.011 + 0.015
Norm 0.0006 0.0003 + 0.0002
Element Si XIV
EWeV 13.67 7.024 + 6.077
χ2/d.o.f1.151.12
Table 4. Derived ionic column density using Spitzer Jr. L. (1978) formula connecting equivalent width, oscillator strength, and wavelength of the detected ionized elements.
Obs. IDIonTransition LevelsEqwidth
×10−13 eV
Wavelength
×10−8 cm
Oscillator Strength (Verner et al., 1996 [38])Ni
×1016 Atom cm−2
Atomic Database Used for Identification
8620701Fe XX1s22p2-2p2(3p)4d20.03210.121.90 × 10−10.116Chianti6 and Apec7
8620701Si XIV1s2-1s2p110.2176.18042.77 × 10−11.20Apec
748391601Mg XI1s2-1s6p42.2367.22471.53 × 10−25.97Chianti and Apec
Disclaimer/Publisher’s Note: The statements, opinions and data contained in all publications are solely those of the individual author(s) and contributor(s) and not of MDPI and/or the editor(s). MDPI and/or the editor(s) disclaim responsibility for any injury to people or property resulting from any ideas, methods, instructions or products referred to in the content.

