Abstract
The results of observations of the object Th4-4 in 1970–2024 showed that during this period the object went through several stages, when its characteristics corresponded to different classes of objects: Be star, symbiotic star and planetary nebula. Currently, the object appears to be a low-excitation planetary nebula.
1. Introduction
Many emission objects of different origins have similar spectra. This creates confusion in their classification. Options for misclassification are discussed below. By definition, a symbiotic object consists of a hot star (white dwarf, neutron star or main sequence star) and a late-type giant. Accordingly, the criterion of symbiotic nature is a spectrum that combines the characteristics of both components. In practice, many stars are for a long time considered to be ordinary red giants or emission-line stars, until ultraviolet observations reveal the presence of a “hot” continuum and highly ionized emission lines (SU Lyn, FG Ser) [1,2]. Sometimes only a sudden flash of an object reveals its true symbiotic nature (CH Cyg, BX Mon) [3,4].
The classification of planetary nebulae (PN) is also imperfect, and many members of the Catalogue of Planetary Nebulae turned out to be objects of another type. A distinctive feature of a planetary nebula is its origin. These objects are formed after the separation of the outer layers of the atmosphere from a star on the asymptotic red giant branch. The interaction between a high-density slow wind and a low-density fast wind forms observable shapes of PN. The stellar remnant turns into a central source of ionization of an envelope. Spectra of planetary nebulae of different excitation degrees depend on the temperature of a central star. But similar spectra are sometimes found in symbiotic stars, compact HII regions, emission-line galaxies and diffuse nebulae. All of these objects can be classified as PN, although they are not PN [5,6]. As a result, among 1563 planetary nebulae discovered by 1986, more than 200 turned out to be misclassified objects [7]. We encountered the problem of classifying emission-line objects during the analysis of observational results of Th4-4.
2. Equipment and Methods of Observation
The program of spectral observations of emission-line objects (Seyfert galaxies, PN and symbiotic stars) began at the Fesenkov Astrophysical Institute of the Republic of Kazakhstan (FAI) in 1969. It was stimulated using a new diffraction spectrograph put in operation. It was designed and manufactured at the FAI and equipped with the three-cascade image-tube UM-92. The new spectrograph had a set of diffraction gratings and camera lenses for observations in different wavelength regions. The total available spectral range was 3700–7500 Å. Spectrograms were obtained with a linear dispersion of 30–150 A/mm, depending on the problem to be solved. The image from the output window of the image-tube was registered on a Kodak-type photographic emulsion, the resolution of which was 100–140 line pairs/mm. A lamp with Ar–He–Ne lines was used for wavelength calibration. Detailed descriptions of the spectrograph and methods of observations are given in [8]. The new device made it possible to obtain spectra of faint objects up to 18m on the telescope AZT-8 (D = 70 cm). The main disadvantage of using an image-tube is the lengthy and labor-intensive procedure for processing negatives. Furthermore, in the region of underexposure of the characteristic curve, the errors in the intensity values of weak lines could reach 50%. The processing of spectrograms obtained with an image-tube is described in [8].
The spectrograph was upgraded in 2001, the image-tube was replaced by a CCD camera ST-8 (1530 × 1020), and then after 2017, by a CCD camera STT-3200 (2184 × 1472). The modern spectrograms are obtained in two wavelength ranges: 4400–5200 Å and 6300–7300 Å with a dispersion of 1.0 Å/pixel. For the entrance slit of the spectrograph 7″–10″, the resolution is 1200–900 in two spectral ranges, correspondingly. Spectra of standard stars from [9], obtained just before or after the target, were used for the flux calibration. Obtained data were reduced in the standard way: dark subtraction and flat fielding. All results were corrected for atmospheric extinction and spectral sensitivity of equipment. In 2020–2023, three spectrograms were obtained at the 1.5 m telescope AZT-20 of FAI. Its innovative spectrograph was equipped with the Volume Phase Holographic Gratings and CCD camera EMCCD. All observations were provided in weather conditions suitable for flux calibration. Typical seeing for AZT-8 was 2–3 arcsec in 1970–1990, and later, 4–5 arcsec. For AZT-20, seeing is 1–2 arcsec.
Photometric observations were initially conducted at the telescope AZT-8 with the same spectrograph. In the photometric mode, a special device was installed instead of the entrance slit. It projected a section of the sky with a target onto the photocathode of image-tube [8]. The processing of images obtained with the image-tube is described in [10].
Since 2016, optical photometry has been carried out at the 1 m telescope Carl Zeiss-Jena, located at Tien Shan Observatory (TShAO) of FAI. It is equipped with the CCD camera Alta F16M (4096 × 4096. 9 μm) and a set of BVRc filters. The field of view (FOV) is 20′ × 20′ and the pixel scale is 0″.38 pix−1. Nearby field stars with the known BVRc magnitudes are used as standards for differential photometry. All images are biased, dark-subtracted and flat-field-corrected. Additional observations of 40 standard stars from [11] have been carried out to obtain the equations for converting instrumental values of the stellar magnitudes to the standard Johnson system.
3. Results
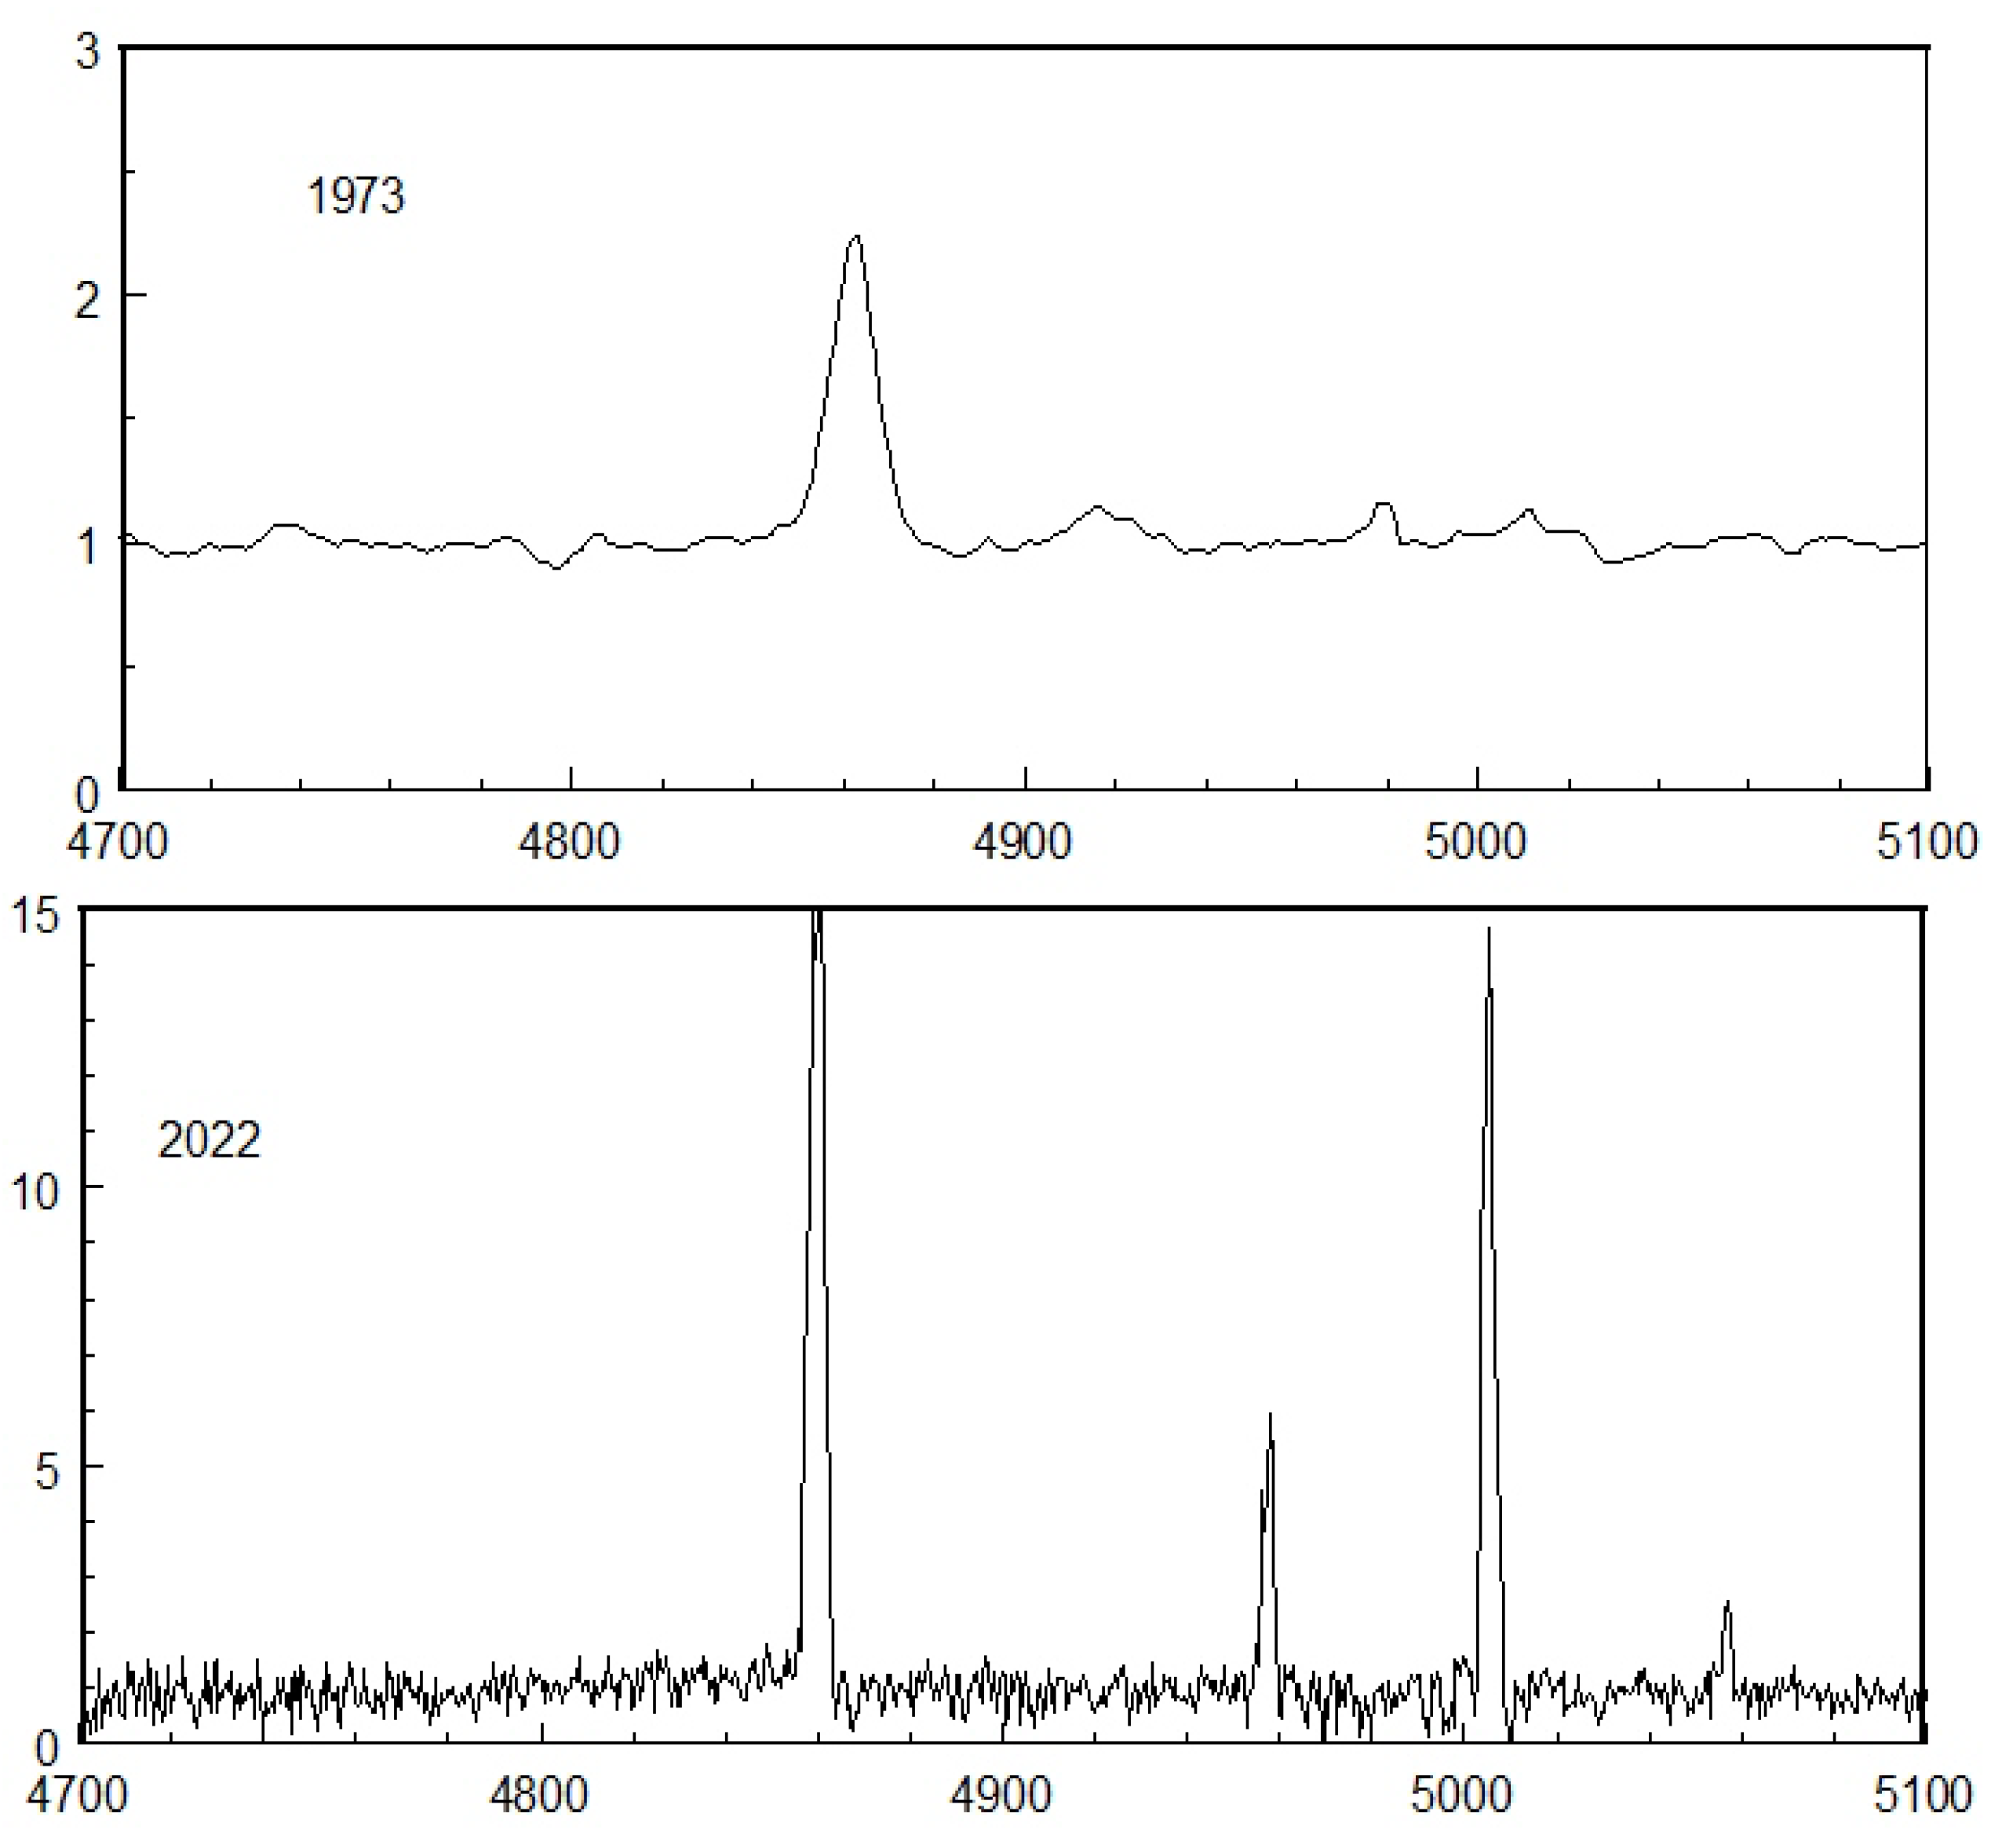
The object Th4-4 = V*4141Sgr = PK 008 + 3.2 with coordinates RA(2000.0) = 17h50m.4; D(2000.0) = −19°54′ was discovered as a planetary nebula in 1964 [12] and was included in the Catalogue [13] as a possible PN. On the O-print of the Palomar Sky Survey (1950), the object’s brightness was mpg = 15m.3 ± 0.5. At that time, its integral magnitude in the R filter was 13m.7 [13]. Our first spectroscopic observations of the object began in 1970. The spectrum showed the broad emission lines of HI and the weak emission FeI and FeII lines, superimposed on a strong continuum [10] (Figure 1). After correction for the instrumental profile [14], the FWHM of the line Hα was 5.5 ± 0.2 Å and wings were extended up to ±14 Å. The effective temperature of the central star obtained using the Zanstra (HI) method was T* = 22,000 ± 500 K. Thus, in 1970–1973, the effective temperature of Th4-4 and its spectrum were similar to the characteristics of peculiar Be stars [15,16]. At that moment, the nature of the object seemed clear, and it was forgotten for about 10 years.
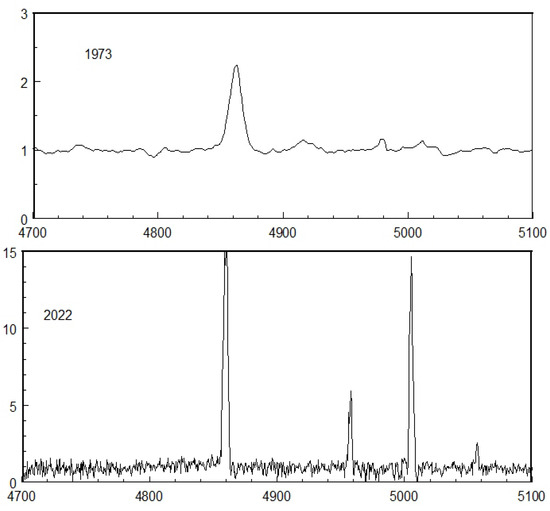
Figure 1.
Fragments of spectrograms obtained in different years. Axis X-wavelengths in Å, axis Y-emission fluxes normalized to the continuum level.
Later, in 1984, emission lines HeII and [OIII] were discovered in the spectrum of Th4-4 [17], and it received a new status. The object was included in the list of “symbiotic” or “possible symbiotic” stars [18,19], because the authors found a late-type continuum and molecular bands combined with a set of high-excitation emission lines in the spectrum of Th4-4. Estimates of physical parameters: T(HI) = 35,000; T(OIII) = 55,000 were obtained in [19]. The review by Belczynski [20] provided a classification of the object: S-type symbiotic with the cold component of the mid M class.
The next series of observations began in 1988. It turned out that the brightness of the object decreased by almost 2m in comparison with data from the 1970s (Figure 1 and Figure 2 and Table 1). The spectrum of the object showed emissions of HI, HeI, 5876, 6678, 7065 Å, [OIII], 4959 Å, 5007 Å and a faint line of [NII], 6583 Å. The level of the continuum was very low. The spectrum of the object was similar to that of a low-excitation planetary nebula [21,22]. Further observations showed that the emission lines of HI, [OIII] and HeI gradually weakened (Figure 3 and Figure 4), and [NII], 6583 Å line disappeared.
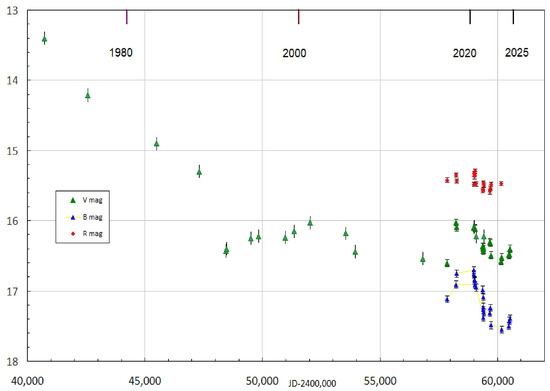
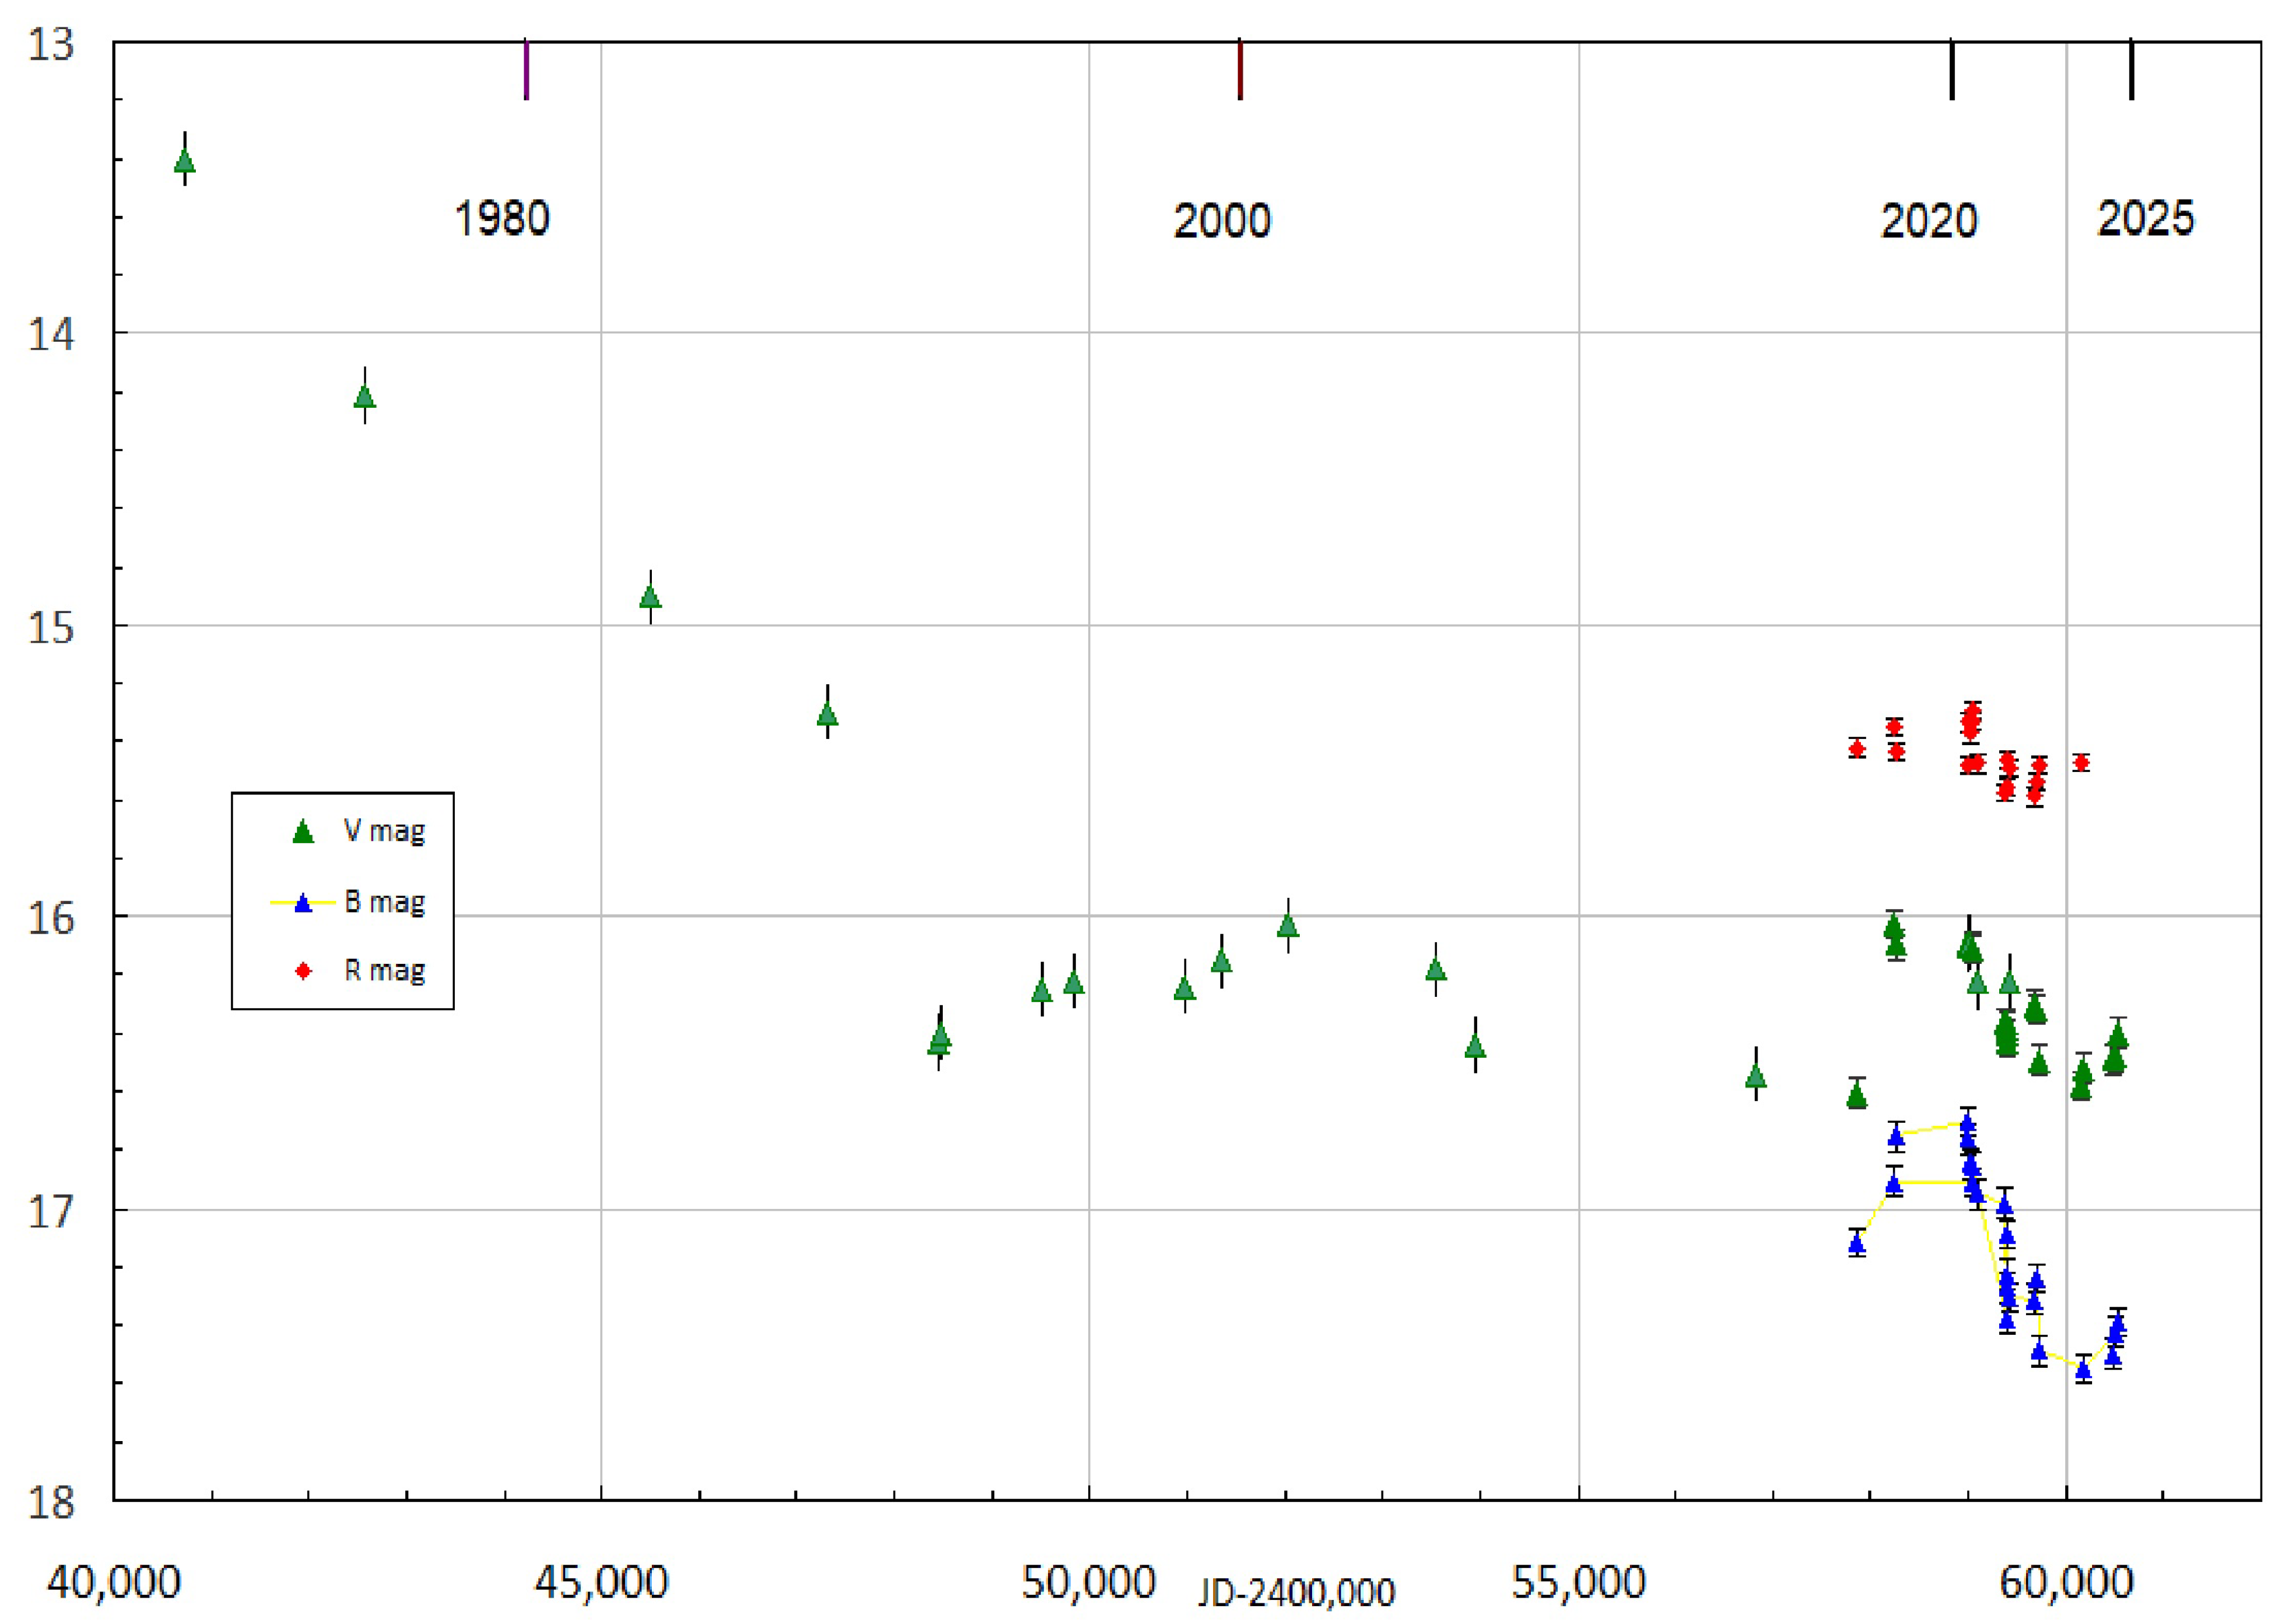
Figure 2.
The light curve of Th4-4 in the B, V and R filters.

Table 1.
Results of photometry of Th4-4.
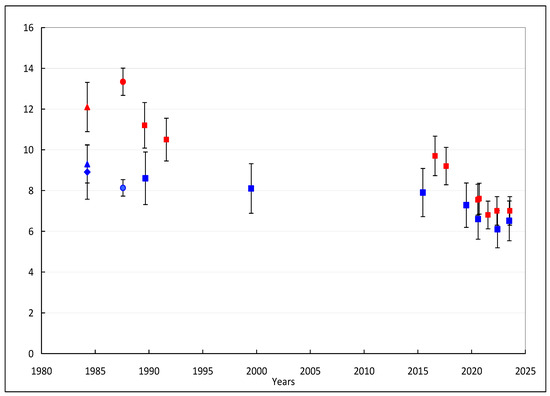
Figure 3.
Fluxes in the Hβ line on a scale of 10−14 erg/cm2 s (blue signs) and fluxes in the Hα on a scale of 10−13 erg/cm2 s (red signs). Circles and triangles indicate values from the works [17,19,22]. Squares correspond to FAI data.
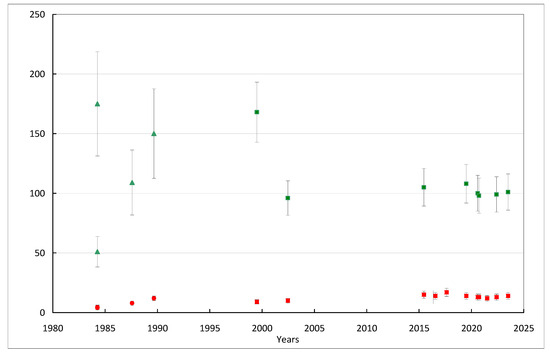
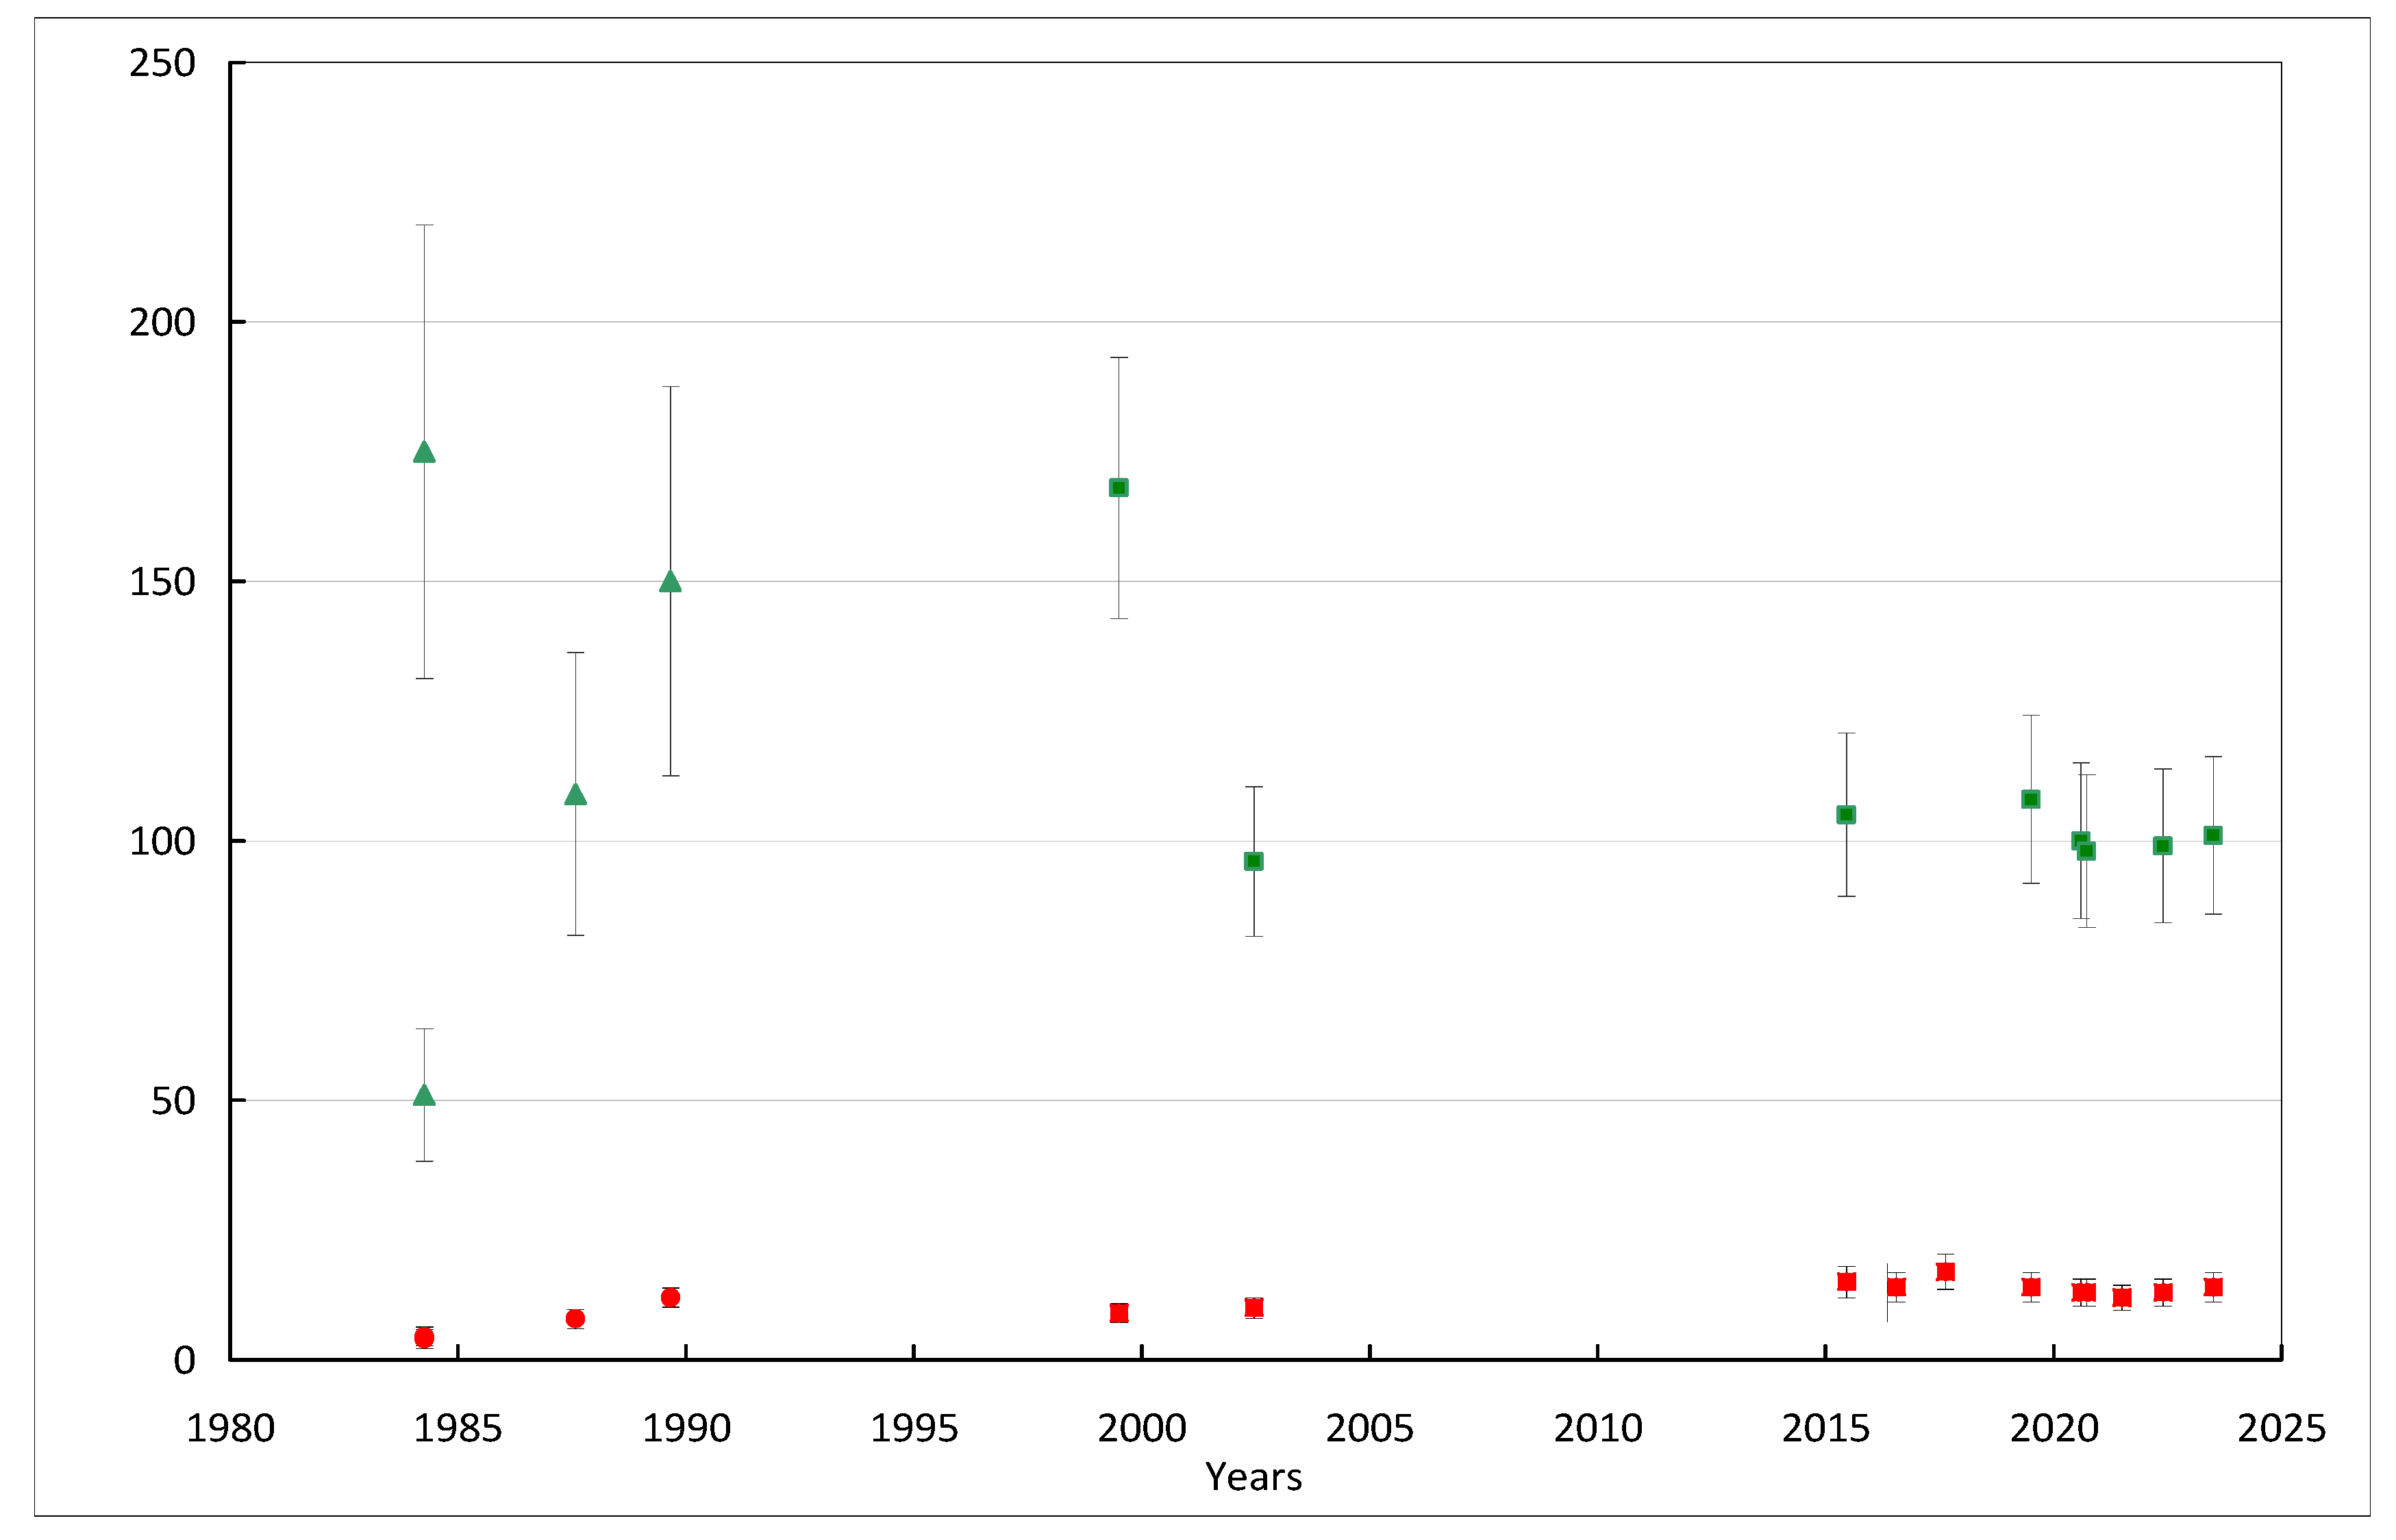
Figure 4.
Relative intensities of emission lines [OIII], 5007 Å normalized to the scale I(Hβ) = 100 (green signs) and I(HeI), 6678 Å, normalized to I(Hα) = 300 (red signs). Circles and triangles indicate values from the works [17,19,22,23]. Squares correspond to FAI data.
Table 2 contains the fluxes of Hβ, Hα and the relative intensities for the other emission lines, normalized to I(Hβ) = 100 and to I(Hα) = 300. When determining the Balmer decrement for Ne = 106 cm−3 [23], data from the papers [24,25,26] were used. As a result, the values of I(Hα)/I(Hβ) = 3.0 and C(Hβ) = 2.0 ± 0.3 were adopted. Interstellar absorption towards Th4-4, E(B-V) = 0m.23 ± 0.07 [27], almost an order of magnitude less than the absorption determined from the spectra: E(B-V) = 1m.2 ± 0.1. Thus, absorption is mainly formed in the object itself, most likely in the outer neutral zones of the nebula.
Table 2.
Fluxes and dereddened intensities of emission lines in the spectrum of Th4-4.
4. Discussion
So, Th4-4 was observed in three different states, and their characteristics corresponded to different types of objects. At the first stage (Be star), the spectrum contained the broad HI emissions superimposed on a powerful continuum. At the second stage (1984–1987) (a symbiotic object), signs of a late star and high excitation lines [NeIII], NIII, HeII, [OIII] appeared in the spectrum, and the stellar temperature increased to 55,000 K [OIII]. Finally, after a long break in observations, the object appeared as a low-excitation planetary nebula.
Over 20 years (1971–1991), the brightness of the object Th4-4 in the V filter weakened by 3m and dropped down to ~16.m5. This low level generally remains to this day. The light curve (Figure 2) shows two local increases in brightness, in 2000 and 2018 by ~0m.5 each.
We have analyzed the results obtained for Th4-4 in terms of its symbiotic nature. The hot star may be a white dwarf (?); the cool mass loss component probably belongs to the mid M class [20] with a temperature of 3635 K [28]. In 1970 –1973, the hot star was hidden inside a dense gaseous shell. Such a shell could have formed due to excess power in the red giant’s stellar wind or as a result of a flash of the hot star, releasing a large cloud of gas and dust. Similar spectra are observed in some symbiotic objects [29,30]. For example, in the spectrum of the eruptive symbiotic star PU Vul at the end of the so-called “F-supergiant phase,” only the Hβ, Ha and [FeII] emission lines remained against the background of a strong continuum.
Later, in 1975–1984, this shell left the star. It is unknown whether this process was explosive or slow; we observed only the result: the hot star and a dense shell of ionized gas—an analog of the so-called “nebular phase” in symbiotic novae. The source of ionizing radiation may be nuclear reactions on the surface of the white dwarf or an accretion disk around it. The first variant is preferable for some symbiotic stars [19]. An increase in the effective temperature of a hot star during the transition from one stage to another was accompanied by a decrease in the object’s brightness (ΔV~2m). Subsequently, the weakening of brightness continued along with a decrease in the emission line fluxes (Figure 2, Figure 3 and Figure 4). The reason for the decrease in the object’s brightness could be a slowdown in nuclear reactions on the surface of the white dwarf or a decrease in the power of the red giant’s stellar wind. In any case, there was a reduction of the ionized zone and a weakening of the emission-line fluxes.
5. Conclusions
So, it can be assumed, with some reservations and stretches, that Th4-4 is still a symbiotic object, and possibly eruptive symbiotic. Perhaps, in 1970–1973, we observed the state after the outburst, when the ejected substance created an expanded pseudo-photosphere around the star. Then, the nebular stage began, during which the radiation from the hot component had ionized the red giant’s wind. In 1984, the object’s luminosity was 1000 Lsun [19], but this value was determined after a significant reduction in brightness (ΔV~2m). The luminosity of the object changed and it is likely that it is responsible for the further variations in the object. For the last 4–5 years, the brightness of Th4-4, as well as its emission spectrum, has been at a low level. This condition may last indefinitely. It is a pity that we were unable to observe the transition between the first and second stages of the Th4-4, but maybe this process will be repeated in the future.
Author Contributions
Conceptualization, methodology, L.K. and E.D.; spectral observations, L.K., E.D. and M.K.; photometric observations, I.R.; processing of observational data, E.D., L.K., S.S. and G.A.; analysis of results, L.K. and E.D.; writing—review and editing, L.K. and E.D.; supervision, L.K. All authors have read and agreed to the published version of the manuscript.
Funding
This research was funded by the Science Committee of the Ministry of Education and Science of the Republic of Kazakhstan (Grant No. AP19676713) (Grant No. BR20280974) and (Grant No. BR24992759).
Data Availability Statement
The presented observational data, as well as the original spectrograms, can be found in the archives of the Fesenkov Astrophysical Institute or on its website.
Conflicts of Interest
The authors declare no conflicts of interest.
References
- Iłkiewicz, K.; Mikołajewska, J.; Scaringi, S.; Teyssier, F.; Stoyanov, K.; Fratta, M. SU Lyn-a transient symbiotic star. Mon. Not. R. Astron. Soc. 2022, 510, 2707. [Google Scholar] [CrossRef]
- Murset, U.; Dumm, T.; Isenegger, S.; Nussbaumer, H.; Schild, H.; Schmid, H.M.; Schmutz, W. High resolution spectroscopy of symbiotic stars⋆ V. Orbital and stellar parameters for FG Ser (AS296). Astron. Astrophys. 2000, 353, 952. [Google Scholar]
- Leedjavr, L.; Mikolajewski, M. The peculiar symbiotic star CH Cygni: Variability and nature of the hot component. ASP Conf. Ser. 2000, 204, 351. [Google Scholar]
- Dumm, T.; Murset, M.; Nussbaumer, H.; Schild, H.; Schmid, H.M.; Schmutz, W.; Shore, S.N. High resolution spectroscopy of symbiotic stars⋆ IV. BX Monocerotis: Orbital and stellar parameters. Astron. Astrophys. 1998, 336, 637. [Google Scholar]
- Kohoutek, L. VizeR Online Data Catalog: New and Misclassified Panetary Nebuae. Astron. Nachrichten 1997, 318, 35. [Google Scholar] [CrossRef]
- Zijlstra, A.; Pottasch, S.; Bignell, C. Misclassified planetary nebulae. Astron. Astrophys. Suppl. Ser. 1990, 82, 273. [Google Scholar]
- Acker, A. Planetary nebula: Phenomenon or object? Some classificatiion probles. In Comptes Rendus sur les Journees de Strasbourg; Observatoire de Strasbourg: Strasbourg, France, 1986; Volume 8, pp. 1–23. [Google Scholar]
- Denissyuk, E.K. Spectrograph for Faint Objects: The Device and the Main Results of Observations. Astron. Astrophys. Trans. 2003, 22, 175–189. [Google Scholar] [CrossRef]
- Kharitonov, A.; Tereschenko, V.; Knyzeva, L. Spectrophotometric Catalog of Stars; Almaty, Kazakh University: Almaty, Republic of Kazakhstan, 2011. [Google Scholar]
- Kondratjeva, L. Spectroscopic and photometric variability of the planetary nebula Th 4-4. Sov. Astron. Lett. 1989, 15, 29–32. [Google Scholar]
- Landolt, A. UBVRI Photometric Standard Stars around the Sky at +50 deg Declination. Astron. J. 2013, 146, 131. [Google Scholar] [CrossRef]
- The, P.S. Eleven New Planetary Nebulae; Contr. from the Bosscha Observ. Lembang: Lembang, Indonesia, 1964; Volume 28. [Google Scholar]
- Perek, L.; Kohoutek, L. Catalogue of Galactic Planetary Nebulae; Publication House Czechoslovak Academy of Sciences: Prague, Czech Republic, 1967. [Google Scholar]
- Bracewell, R. Simple Graphical Method of Correcting for Instrumental Broadening. J. Opt. Soc. Am. 1955, 45, 873. [Google Scholar] [CrossRef]
- Kondrat’eva, L. Two emission objects with the broad emission lines. Tr. Astrofiz. Inst. 1975, 25, 23. [Google Scholar]
- Allen, D.; Swings, J. The spectra of peculiar Be stars with infrared excesses. Astron. Astrophys. 1976, 47, 293–302. [Google Scholar]
- Acker, A.; Raytchev, B.; Koeppen, J.; Stenholm, B. An extensive study of planetary nebulae in the galactic bulge. I. Spectrophotometric data. Astron. Astrophys. Suppl. Ser. 1991, 89, 237. [Google Scholar]
- Allen, D. A Catalogue of symbiotic stars. Proc. Astron Soc. Aust. 1984, 5, 369–384. [Google Scholar] [CrossRef]
- Mikolajewska, J.; Acker, A.; Stenholm, B. Spectrophotoetric study of southern symbiotic stars. Astron. Astrophys. 1997, 327, 191–198. [Google Scholar]
- Belczynski, K.; Mikolajewska, J.; Munari, U.; Ivison, R.J.; Friedjung, M. Catalogue of symbiotic stars. Astron. Astrophys. Suppl. Ser. 2000, 146, 407. [Google Scholar] [CrossRef]
- Kondrat’eva, L. Rapid evolutionary changes in the spectrum of Th4-4. Astron. Lett. 1993, 39, 330. [Google Scholar]
- Gutierrez-Moreno, A.; Moreno, H.; Corrtes, G. Observations of Five Suspected Symbiotic stars. Publ. Astron. Soc. Pac. 1992, 104, 1187–1992. [Google Scholar] [CrossRef]
- Luna, G.; Costa, R.L. Nebular abundances of southern symbiotic stars. Astron. Astrophys. 2005, 435, 1087–1097. [Google Scholar] [CrossRef]
- Brocklehurst, M. Calculation of level populations or the low levels of hydrogenic ions in gaseous nebulae. Mon. Not. R. Astron. Soc. 1971, 153, 471. [Google Scholar] [CrossRef]
- Netzer, H. Physical conditions in active nuclei-I. The Balmer decrement. Mon. Not. R. Astron. Soc. 1975, 171, 395. [Google Scholar] [CrossRef]
- Dong, X.; Wang, T.; Wang, J.; Yuan, W.; Zhou, H.; Dai Hand Kai Zhang, K. Broad-line Balmer decrements in blue active galactic nuclei. Mon. Not. R. Astron. Soc. 2008, 383, 581. [Google Scholar] [CrossRef]
- Guo, H.L.; Chen, B.Q.; Yuan, H.B.; Huang, Y.; Liu, D.Z.; Yang, Y.; Liu, X.W. Three-dimensional Distribution of the Interstellar Dust in the Milky Way. Astrophys. J. 2021, 906, 47. [Google Scholar] [CrossRef]
- Mowlavi, N.; Lecoeur-Taibi, I.; Lebzelter, T.; Rimoldin, L.; Lorenz, D.; Audard, M.; De Ridder, J.; Eyer, L.; Guy, L.P.; Holl, B. Gaia Data Release 2. The first Gaia catalogue of long-period variable candidates. Astron. Astrophys. 2018, 618A, 58. [Google Scholar] [CrossRef]
- Vogel, M.; Nussbaumer, H. PU Vulpeculae : The outburst of a symbiotic nova. Astron. Astrophys. 1992, 259, 525. [Google Scholar]
- C’uneo, V.; Kenyon, S.; G’omez, M.; Chochol, D.; Shugarov, S.; Kolotilov, E. An illumination effect and eccentric orbit for symbiotic binary PU Vul revealed by 32 yr of optical spectroscopy. Mon. Not. R. Astron. Soc. 2018, 479, 2728. [Google Scholar]

Disclaimer/Publisher’s Note: The statements, opinions and data contained in all publications are solely those of the individual author(s) and contributor(s) and not of MDPI and/or the editor(s). MDPI and/or the editor(s) disclaim responsibility for any injury to people or property resulting from any ideas, methods, instructions or products referred to in the content. |
© 2025 by the authors. Licensee MDPI, Basel, Switzerland. This article is an open access article distributed under the terms and conditions of the Creative Commons Attribution (CC BY) license (https://creativecommons.org/licenses/by/4.0/).