Abstract
A new spectroscopic study of HR 4049, a post-AGB star in a binary system, based on échelle spectra taken between 2019 and 2025 with the 0.81 m telescope of the Three College Observatory (North Carolina, USA) at a resolution of R ≈ 12,000 is reported. A cross-correlation analysis of 73 spectra of a single C i multiplet in the 4760–4780 Å range yielded the following orbital parameters: the orbital period days, eccentricity , argument of periastron , epoch of periastron , heliocentric systemic radial velocity km s−1, and semi-amplitude of the radial velocity curve km s−1. Phase-dependent variations of the Hα line profile indicate dynamic processes in the circumstellar environment. The luminosity of HR 4049 was refined using the Gaia EDR3 parallax ( mas), corresponding to a distance of pc, and the average visual magnitude in the brightest state ( mag). The derived luminosity, , suggests an initial mass of 3.0–4.0 . Analysis of the mass function and most probable orbital inclinations (60°–75°) leads to current masses of for the primary and – for the secondary component. The results confirm the system’s long-term orbital stability and provide further insights for future research into the nature of post-AGB binaries.
1. Introduction
Post-AGB stars represent an intermediate evolutionary stage between the asymptotic giant branch (AGB) and the planetary nebula phase, marking a critical phase in the late evolution of low- and intermediate-mass stars (≤8 ). At the post-AGB stage, the star has a dense and hot core with temperatures ranging from 30,000 to 200,000 K [1], primarily composed of carbon and oxygen. This core is surrounded by a circumstellar envelope formed from material ejected during the AGB phase.
One of the most intriguing post-AGB stars is HR 4049 (HD 89353, AG Ant). It has a relatively high effective temperature of Teff ≈ K [2], which distinguishes it from most other post-AGB stars with similar chemical compositions. This higher temperature makes the object especially challenging to study because weak spectral lines restrict the number of features available for a detailed abundance analysis. In addition, HR 4049 exhibits an extreme photospheric iron deficiency with [Fe/H] dex [3] and shows a significant excess of radiation in the IR and a deficiency in the UV region, which is attributed to dust formed from the material lost by the star during the AGB phase [4].
Previous spectroscopic studies of HR 4049 detected radial velocity (RV) variations with a period of 429–430 days [2], which placed it in a close binary system with a secondary component undetected spectroscopically [4]. Mass estimates, assuming an inner disk radius of AU, suggest a total system mass of , with the primary’s mass around and the secondary’s mass approximately [5]. The likely companion is an M–star on the main sequence, having an estimated Teff of 3500 K and a radius of [2]. The orbit of the primary component appears to be compact, with a projected semi-major axis of 0.6 .
The presence of a long-lived circumbinary disk, showing a distinct bright ring with no evident substructure, further supports this scenario [6]. Notably, a double-peaked Hα profile follows the RV variations of the photospheric lines, suggesting the presence of a possible accretion disk [7]. Interactions between the primary component and the circumbinary disk can lead to significant effects, such as the depletion of volatile elements from the primary’s atmosphere [8].
The primary goal of this study was to recalculate the orbital parameters of HR 4049 based on new data to verify the results of previous studies and investigate potential changes in the system’s orbit that might indicate additional dynamic processes or interactions. The RV data were analyzed to refine the orbital period and other orbital parameters, including the systemic velocity (), the argument of periastron (), the orbital eccentricity (e), the semi-amplitude (K), and the time of periastron passage (T0). The updated values provide improved constraints on the orbital configuration and fundamental parameters of this post-AGB binary system.
2. Observations and Data Reduction
For this analysis, we used 73 spectra obtained between 2019 and 2025. All observations were conducted with the 0.81 m telescope of the Three College Observatory (TCO) located in central North Carolina. The telescope is equipped with an échelle spectrograph from Shelyak Instruments 1 and an ATIK–460EX detector (2749 × 2199 pixels, pixel size 4.54 μm × 4.54 μm). This setup provides a resolving power of R∼12,000 over the wavelength range 3800–7900 Å without gaps between its 31 spectral orders.
The TCO spectrograph provides a high signal-to-noise ratio (S/N) across its operating range. In the wavelength region of interest (4500–5500 Å), the S/N can reach up to ∼300. It typically ranges from 150 to 200 around the Hα line. Wavelength calibration is based on identifying 800–1000 comparison lines in ThAr spectra, with a typical scatter of 0.03 Å, corresponding to an RV accuracy of about 300 m s−1. Such precision allows for detecting RV variations down to a few km s−1.
HR 4049 (Declination −29°) is a low target for TCO (latitude ∼36° North) and was usually observed at altitudes between 20° and 26°. Nevertheless, the star’s image was always stable due to typically low winds and turbulence near the ground at the site. Average exposure times were from 40 to 60 min. Each spectrum was produced by summing up 4–6 individual 10–15-min exposures. RV standard stars were observed every night at different altitudes. No systematic effects in the wavelength calibration for low-altitude stars have been found. The same observational approach has been employed in other observing programs at TCO, such as those that target classical Be stars [9] and objects exhibiting the B[e] phenomenon [10].
All spectra were reduced using standard procedures in the IRAF échelle package, including bias subtraction, flat-field correction, and optimal extraction of échelle orders. After extraction, each order was normalized to the local continuum to minimize large-scale intensity variations from instrumental effects. All computations were performed on a multicore, multiprocessor server at the Laboratory of Astrophysics of the Al-Farabi Kazakh National University 2.
3. Methods
3.1. Cross-Correlation
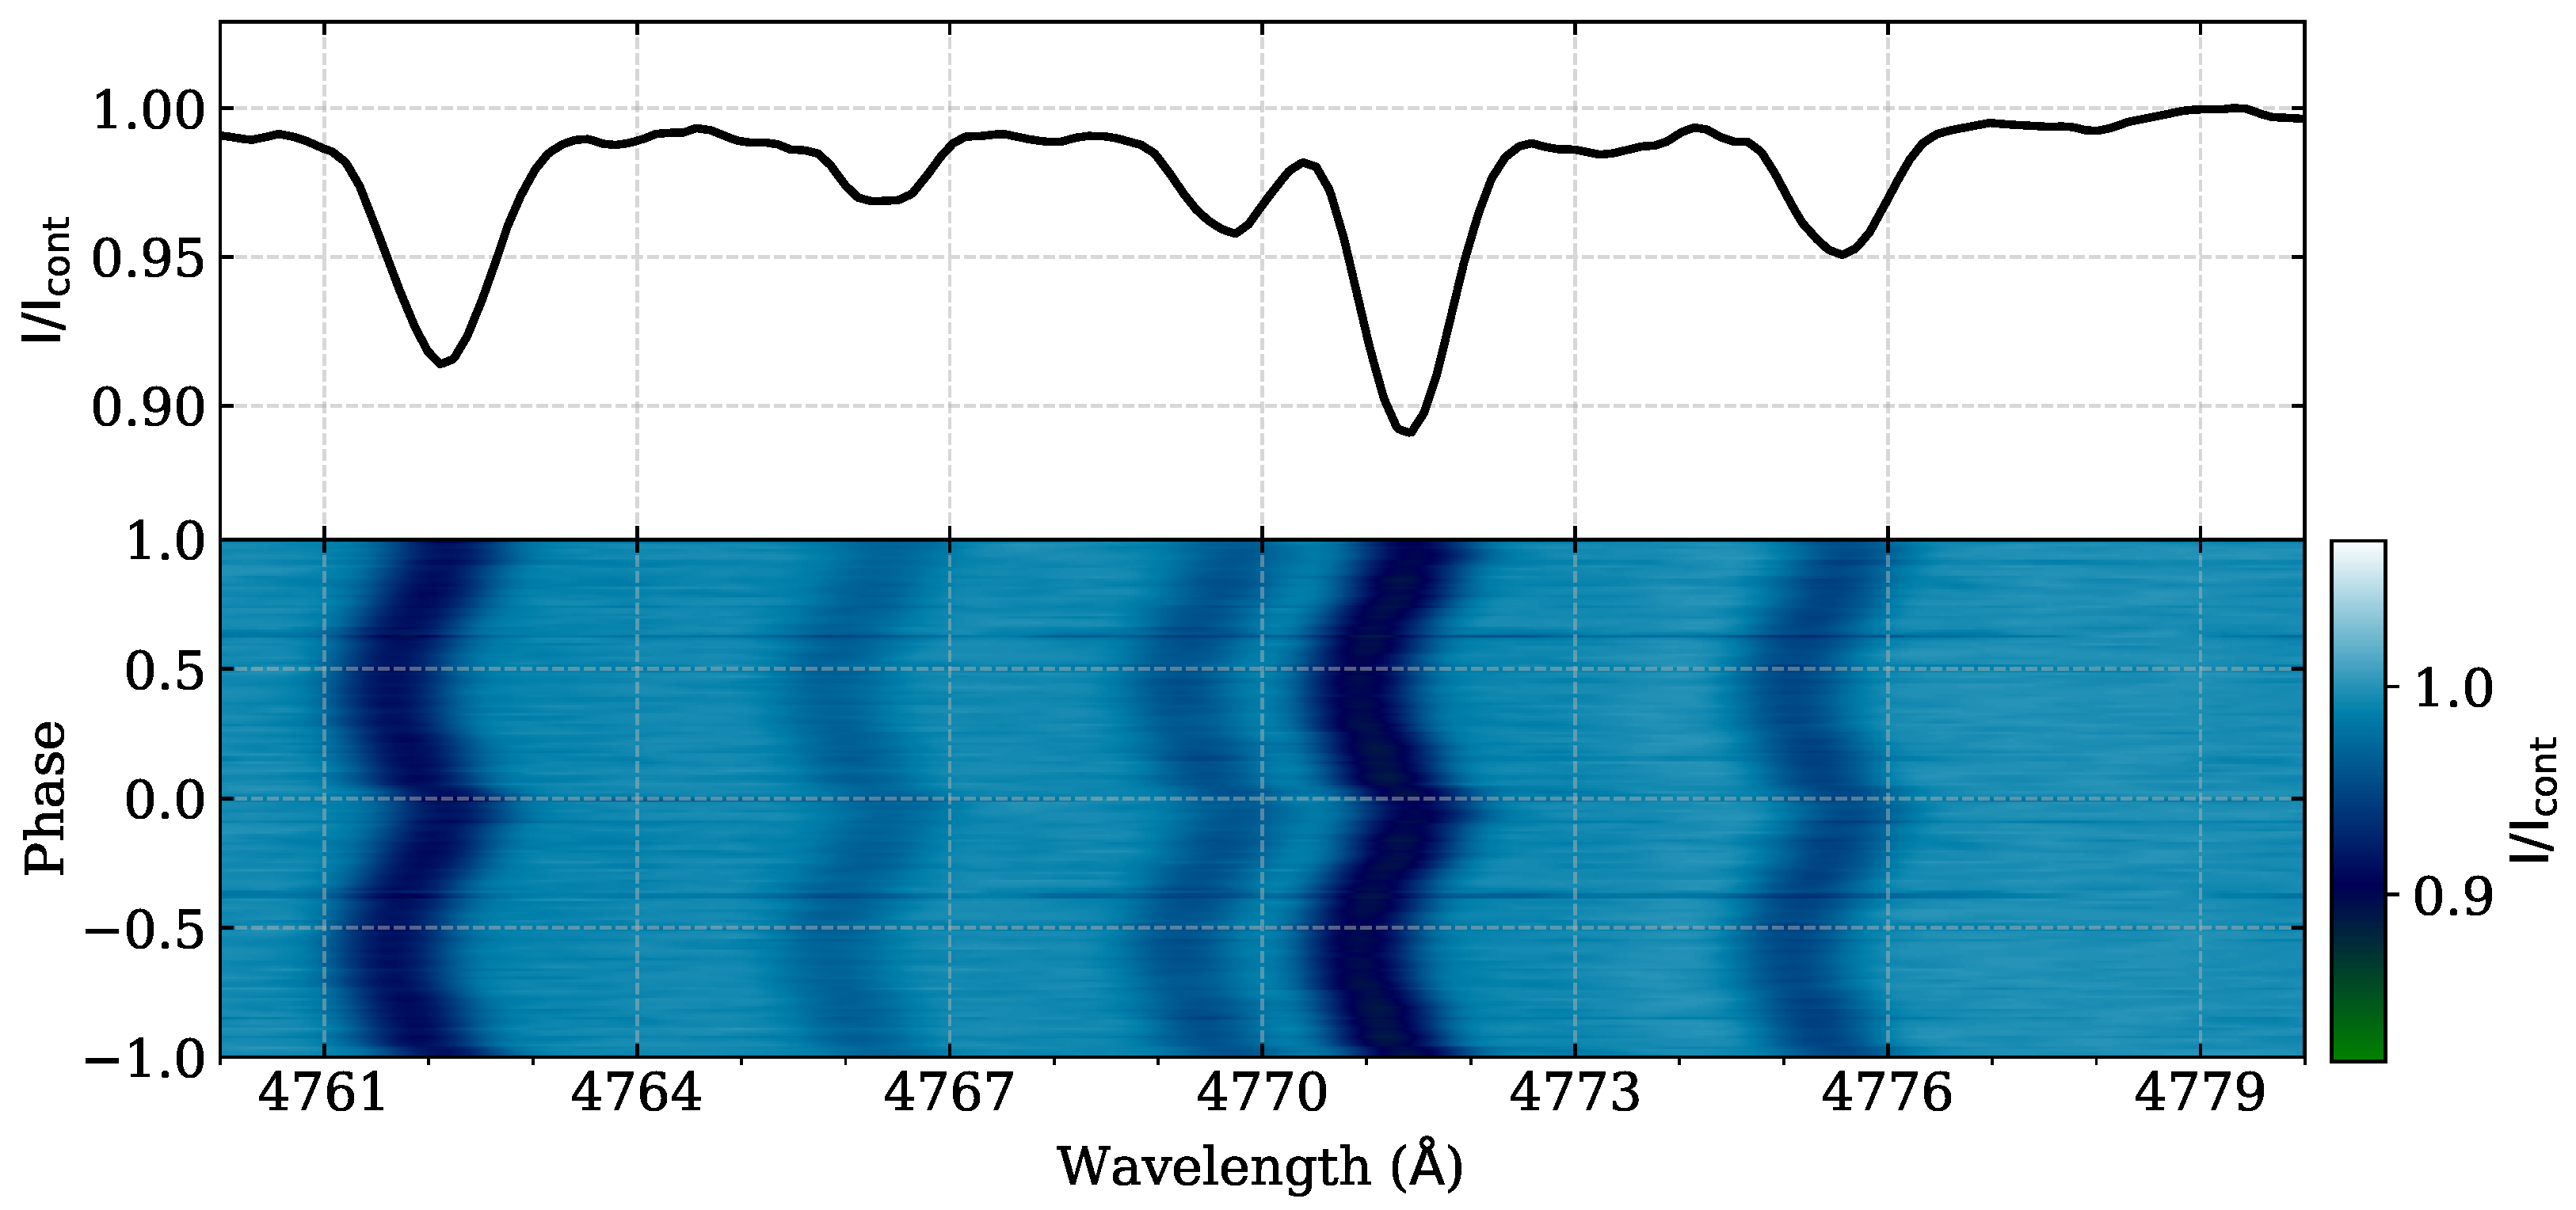
RV values were measured using a cross-correlation method implemented in the rvsao package IRAF. RVSAO 2.0 is the latest version of the software designed to determine apparent RV from observed spectral shifts [11]. Its primary task, XCSAO, cross-correlates the Fourier transform of an object’s spectra with respect to the Fourier transforms of a template spectrum, thereby yielding both the RV and its associated uncertainty. We chose one of our high-S/N spectra as the reference template. Specifically, the cross-correlation was carried out in the 4760–4780 Å interval (Figure 1), focusing on the five neutral carbon lines of the multiplet number 6 that offer clean profiles suitable for precise Doppler measurements.
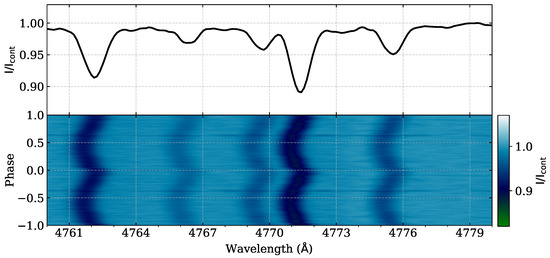
Figure 1.
Cross -correlation of the spectrum of HR 4049 in the range 4760–4780 Å, focusing on the neutral carbon multiplet.
Once the RV were determined, the Lomb–Scargle method was employed to search for periodic signals in the data. This method is particularly well suited for unevenly sampled time series, a common scenario in astronomical observations. In contrast to the classical discrete Fourier transform, the Lomb–Scargle approach properly accommodates irregular spacing of measurements by fitting sinusoids to the data in the least-squares sense [12,13].
The core output of the algorithm is the Lomb–Scargle periodogram, which estimates the power at different frequencies. The frequency at which the periodogram reaches its peak is typically taken to be the fundamental period present in the dataset. A key advantage of this method is its ability to derive statistically robust estimates of periodicity, even when the dataset partially samples the orbital cycle or when noise is substantial. By decomposing the time series into sinusoidal components, the Lomb–Scargle approach isolates significant periodic behavior and discards spurious fluctuations.
In our application to the RV data, this procedure allowed us to identify the system’s dominant periodic signal and refine the orbital period. The periodogram analysis also provides insight into secondary peaks or aliases that can arise from sparse sampling, enabling a more confident assignment of the true period. Consequently, the Lomb–Scargle method proved crucial for obtaining a reliable orbital solution under observational constraints such as weather, telescope scheduling, and limited baseline coverage.
3.2. Orbital Parameters
To analyze the orbital parameters of HR 4049, we developed a specialized Python 3.11.5 code that processes RV measurements taken at various epochs. The code uses NumPy 1.26.4 (numerical Python) for numerical operations, Pandas 2.0.3 (the Python Data Analysis Library) for handling and processing tabular data, Matplotlib 3.8.4 (the Matplotlib Library) for data visualization, and scipy.optimize 1.13.0 (an optimization module from SciPy) for model fitting. Its main goal is to construct the RV curve and derive the orbital parameters of the binary system.
As an initial step, the RV data (consisting of observation times in HJD, measured RV values, and their uncertainties; see Table 1) were loaded and preprocessed. This involved removing outliers, correcting for data inconsistencies, and, where necessary, interpolating over missing values. Afterward, the refined data were used to model the orbital curve.

Table 1.
Radial velocities for HR 4049 from the CI lines.
The elliptical orbit of HR 4049 was modeled, including eccentricity (e) and argument of periastron (), to achieve the best fit to the observed RV curve. We applied nonlinear minimization algorithms from scipy.optimize 1.13.0 to fit the model.
A crucial component of our code is sinusoidal fitting with error minimization, carried out via the Markov Chain Monte Carlo (MCMC) method. This approach generates multiple subsamples for each parameter, allowing us to derive their most probable values along with realistic statistical uncertainties [14]. We used the emcee 3.1.4 (affine-invariant MCMC ensemble sampler) library to implement the MCMC method and estimated key orbital parameters, such as the orbital period (P), the systemic RV (), and the RV semi-amplitude (K). By maximizing the posterior probability, obtained from prior constraints combined with a likelihood function based on the observed data, the code produces a best-fit RV curve that closely matches the measurements.
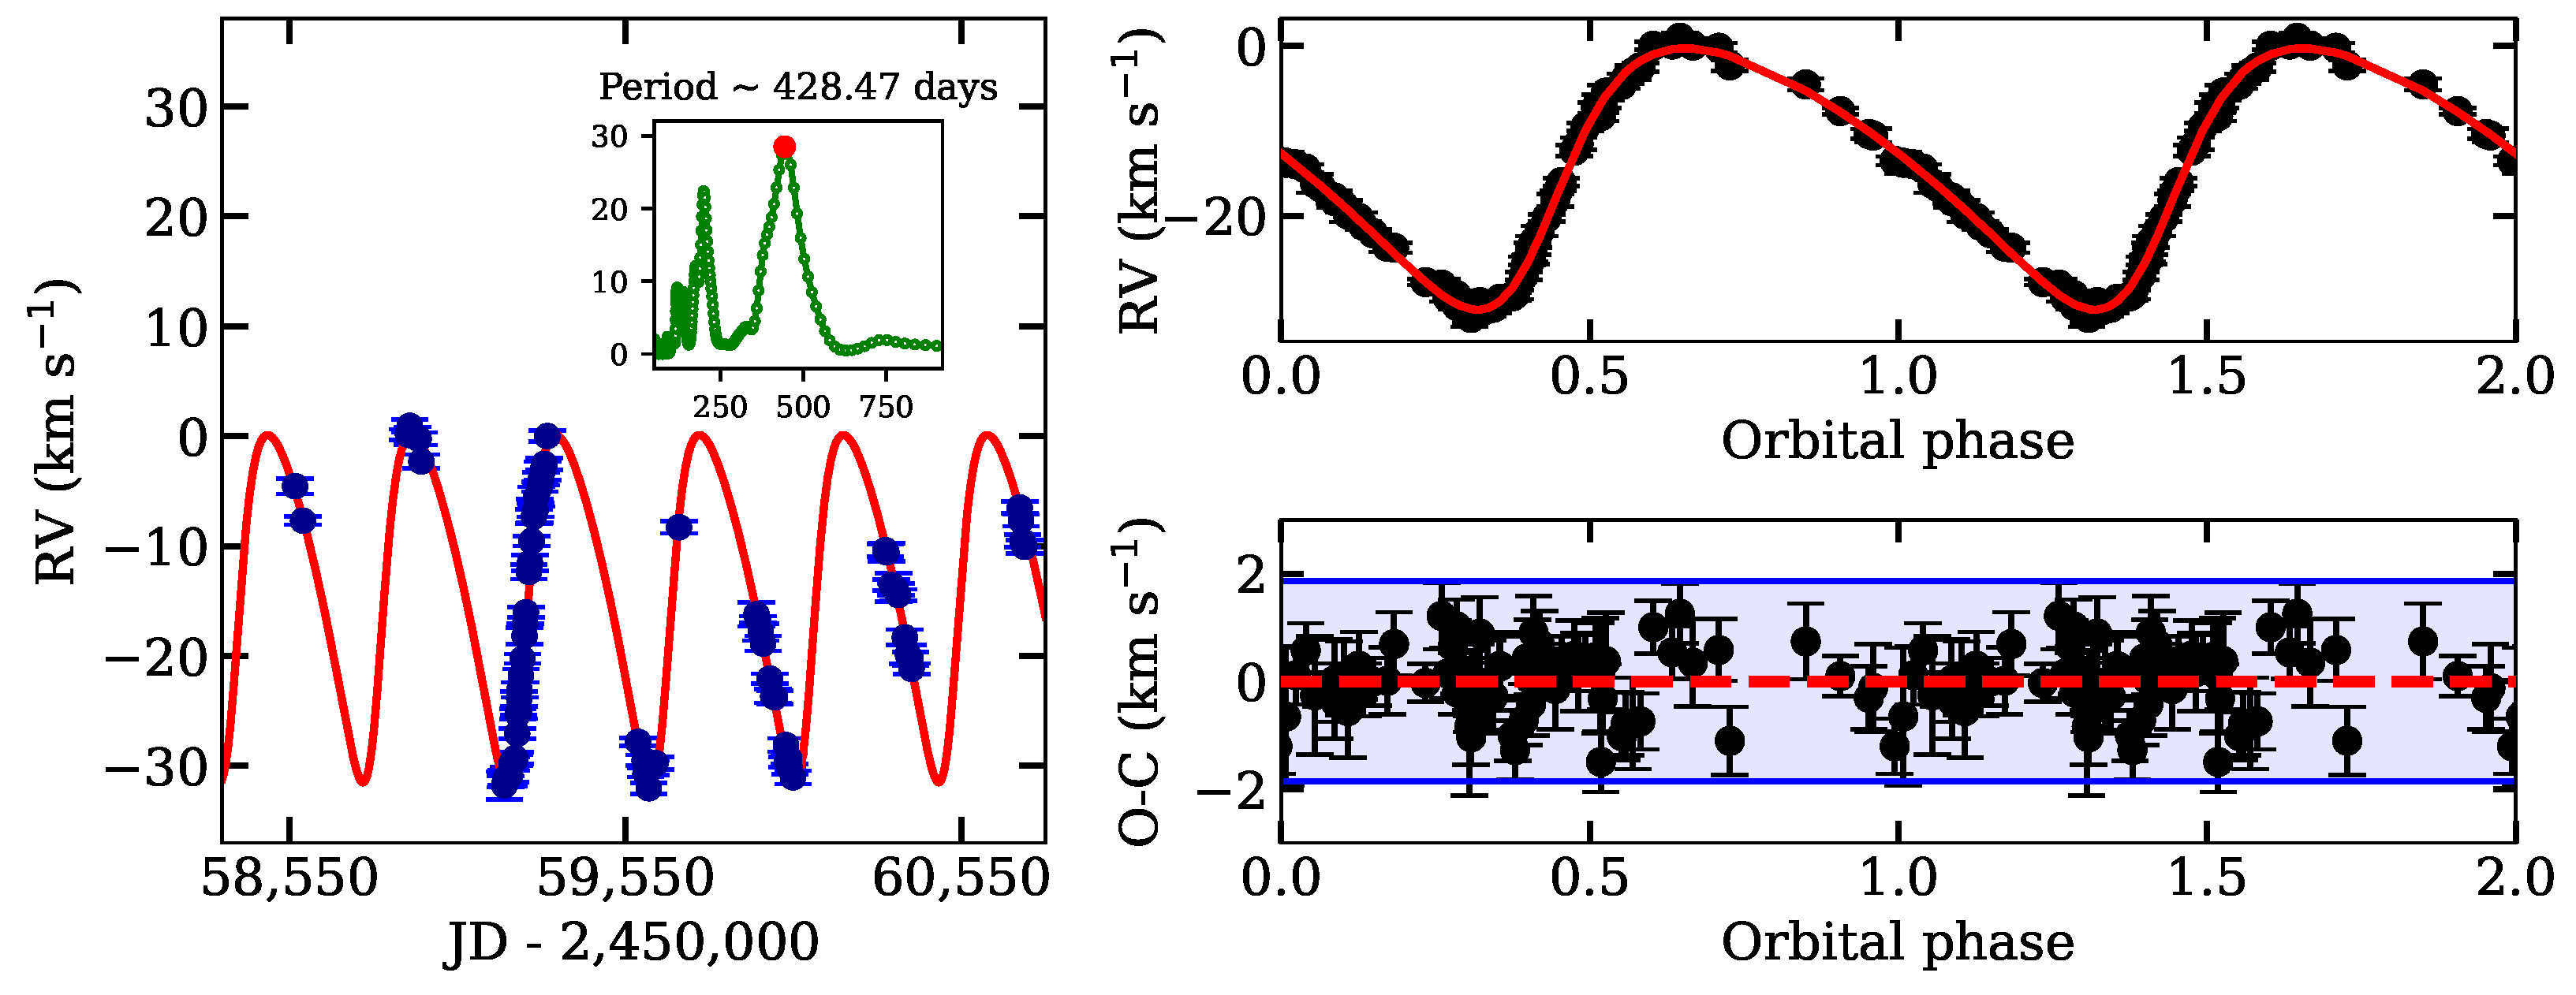
For an initial guess of the system’s parameters, we examined the RV curve (Figure 2) to estimate the semi-amplitude K (the maximum deviation from zero velocity), which reflects the star’s maximal RV relative to the observer. The asymmetric shape of the curve indicated a non-zero eccentricity e. Moreover, phase analysis provided a preliminary estimate of the argument of periastron () with respect to the chosen phase origin. These approximate values served as initial conditions for our numerical orbital models and were then refined through the detailed fitting described above. In this way, we obtained a robust set of orbital parameters, laying the groundwork for further analyses of HR 4049’s dynamical properties.
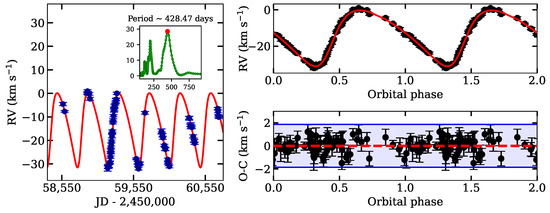
Figure 2.
RV variations based on five lines: the neutral carbon (C i) multiplet lines (number 6). (Left) RV measurements in the heliocentric frame as a function of HJD. The red line represents the best-fit Keplerian orbital solution. The inset shows the periodogram, indicating a detected period of 428.47 days. (Top right) RV curve folded with the best-fit orbital period. The red line represents the best-fit Keplerian model. (Bottom right) Residuals from the fit with ±3 margins.
4. Results
In this study, we performed a detailed spectroscopic analysis of the post-AGB object HR 4049. As part of our investigation, we recalculated the orbital parameters of the system. The orbital analysis of HR 4049 was conducted using the cross-correlation method, with the RV measurements summarized in Table 1. Furthermore, based on the RV data, we constructed an RV curve using the method described in Section 3.1 (Figure 2). The updated orbital parameters presented in Table 2 provide a refined orbital solution, which slightly improves upon previous results and further supports the conclusion regarding the system’s long-term stability.
Table 2.
Comparison of orbital parameters.
While recalculating the orbital parameters, we discovered notable variability in the Hα emission line, which showed significant fluctuations in both intensity and profile shape throughout the observation period (Figure 3). However, the underlying causes of this variability were not explored in detail in the present study. Although the exact mechanisms driving these variations remain unclear, our results confirm the presence of dynamic activity in the circumstellar environment. These findings underscore the need for further investigations to elucidate the nature of these fluctuations.
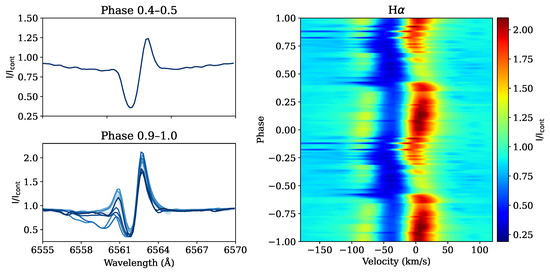
Figure 3.
Hα emission line variations as a function of the orbital phase. (Left) Phase-averaged line profiles for selected orbital phases. The blue curves correspond to observations obtained on different dates. (Right) Dynamic spectrum showing phase-dependent changes in the Hα line.
The variability of the Hα emission line in HR 4049 has been previously studied [16,17] and found to be closely linked to the system’s orbital motion. The Hα profile is characterized by a double-peaked emission with a central depression at an RV of −7.5 km s−1 relative to the systemic velocity. The emission originates outside of the primary’s orbit but remains gravitationally bound to it, with intensity varying from a maximum at an inferior conjunction to a minimum at a superior conjunction. Two main hypotheses have been proposed to explain this variability: (1) the emission arises from the outer layers of the primary star’s extended atmosphere as a result of chromospheric activity, or (2) it reflects off the inner region of a circumbinary disk. These periodic variations in the Hα emission are driven by differential reddening toward the emitting region and the stellar continuum.
The observed features are reminiscent of early-type T-Tauri stars such as SU Aur, where similar processes involving accretion disks and stellar winds have been identified [2]. The difference in the escape velocity, 70 km s−1 for HR 4049 vs. 511 km s−1 for SU Aur, suggests that these processes are scaled by the different gravitational environments of these systems. Similar observations of phase-dependent variations in emission lines, including Hα, in binary systems have been discussed in [9].
We can also re-evaluate the fundamental parameters and the evolutionary state of HR 4049 using recent results on its distance and interstellar extinction in its direction.
There are a few estimates of the luminosity of HR 4049 in the literature. For instance, Vickers et al. [18] derived from the spectral energy distribution (SED) fitting using K, while Oudmaijer et al. [19] list using the Gaia EDR3 parallax and = 10,500 K that corresponds to an old estimate of its spectral type of B9 that is still listed in SIMBAD but does not correctly represent the object’s because of the peculiarity of its atmospheric abundances.
Our luminosity estimate is based on the visual magnitude at the brightest state during the orbital cycle, which ranges from to mag [17,20,21]. According to a study of the UV variability [22], the brightness of HR 4049 at this state is virtually unaffected by the circumstellar extinction. Therefore, we adopted an average value of mag.
The presence of weak diffuse interstellar bands in the spectrum of HR 4049 (e.g., EW (5780 Å) = 0.04 Å) is consistent with the maximum line-of-sight extinction estimated in [23], where mag for this direction. Using this information along with the Gaia EDR3 parallax (0.71 ± 0.10 mas; [24]) and adopting a bolometric correction mag for the assumed K from [25], we calculated a luminosity of HR 4049 of .
At the same time, a different estimate of the total extinction, mag, which corresponds to mag, was derived by [15] from the SED fitting. This result leads to a slightly higher luminosity of . Despite the variation in the extinction estimates, the difference in the luminosity values has only a minor impact on the derived stellar mass, which remains consistent within the uncertainties. A close coincidence of our estimate with that from [19] is probably due to a different visual brightness and extinction used by these authors.
With the average of the above luminosity estimates, we placed HR 4049 on the Hertzsprung–Russell diagram and compared its position with the post-AGB evolutionary tracks from [1] (Figure 4). Its location on the diagram indicates that it is in the post-AGB phase and, according to theoretical models, is expected to evolve toward higher temperatures while maintaining nearly constant luminosity. The star most closely follows the evolutionary track of an object with an initial mass in the range of 3.0–4.0 . Although an alternative estimate of ∼1.0 has also been reported [17], this value is based on the radius for stars published by Schönberner [26] with a set of parameters ( K, ), which corresponds to a post-AGB star with an initial mass of approximately 1 .
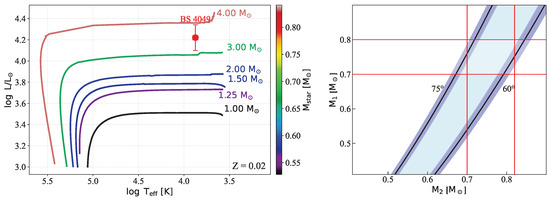
Figure 4.
(Left) Hertzsprung–Russell diagram. Colored lines represent evolutionary tracks for stars with different initial masses at a metallicity of . The color bar on the right indicates the current mass along each track. The red symbol marks the position of HR 4049, with error bars corresponding to uncertainties in and . (Right) Mass function. The red horizontal lines indicate the primary component mass with its uncertainty (). The red vertical lines show the secondary component masses corresponding to the inclination angles of 60° and 75° (black curves).The light blue region illustrates how the component masses vary with inclination, and the dark bands around the curves indicate the uncertainty in the mass function.
Our results further support an initial mass of ≈ 3.0–4.0 for the primary component. This is consistent with its derived luminosity and effective temperature, matching theoretical post-AGB tracks for stars in this mass range [27,28]. According to these models, such stars undergo a substantial mass loss during the late AGB phase, leaving behind a final core of ∼0.605–0.836 [27].
The final core mass depends on the efficiency of the mass loss and the intensity and duration of thermal pulses during the late AGB. More robust outflows lead to lower core masses, which in turn affect how quickly the star evolves through the post-AGB stage and becomes a white dwarf. Stars in this mass regime typically traverse the post-AGB phase relatively rapidly, which explains the lack of an extended ionized envelope around the object.
Although HR 4049 exhibits an extremely low iron abundance in its photosphere, with [Fe/H] dex, we adopt evolutionary tracks corresponding to solar metallicity () in this study. This choice is motivated by the understanding that such severe iron depletion is limited to the outer atmospheric layers and is most likely the result of selective re-accretion processes. These processes efficiently remove refractory elements like iron while leaving lighter, more volatile elements at levels close to solar. Since evolutionary models are concerned with the global properties and long-term evolution of the entire star, governed by its overall chemical composition rather than just surface abundances, assuming solar metallicity () provides a reasonable approximation.
The mass function was calculated based on our orbital solution (Table 2). Following [29], we adopted an orbital inclination of , derived from the variations of the disk optical depth at different orbital phases. Assuming this inclination and a primary component mass of , determined from the Hertzsprung–Russell diagram (Figure 4), we calculated the secondary component mass as using the standard mass function formula.
To account for possible observational biases, particularly the obscuration by the circumbinary disk, we also considered a higher inclination of [15]. In that scenario, the masses are and . The large difference in between and highlights how strongly mass estimates depend on the orbital inclination. Adopting a larger inclination thus yields a more conservative lower limit for the component masses.
The derived mass range of is compatible with theoretical post-AGB models for stars initially in the – range. Given the secondary’s mass of –, it might be a low-mass main-sequence star or a white dwarf. In [3], estimates of the secondary component mass are presented. Assuming a primary component mass of , typical for a post-AGB star at high Galactic latitudes, and a mass function of , the authors provide secondary component mass estimates ranging from to for an inclination between and , with a preference for the lower values.
5. Discussion and Conclusions
These new observations, collected during a long-term monitoring campaign of HR 4049, form a novel dataset for studying this post-AGB star. Independent measurements also show good agreement with earlier published values, confirming both the consistency and reliability of our results. Notably, the recalculated orbital parameters were derived via a cross-correlation analysis of RV data, an approach not previously employed for this specific system.
By incorporating the updated parallax from the latest Gaia EDR3, we recalculated the star’s luminosity, obtaining an average value of . This refined value enables more precise placement of HR 4049 on the Hertzsprung–Russell diagram, further confirming its post-AGB evolutionary status.
We also updated the system’s mass function based on the new orbital parameters, which allowed us to estimate the individual component masses. Furthermore, by constructing evolutionary tracks, we estimated both the system’s initial mass and the remnant mass of the primary star, then used these values to derive a mass estimate for the secondary. These calculations provide fresh insights into the evolutionary history of the system and its components, contributing to a more comprehensive understanding of mass distribution in binary post-AGB stars.
Interestingly, HR 4049 is not the only system showing significant Hα variability: a similar effect is observed in BD + 46°442 [30], where the Hα profile evolves with orbital phase. Specifically, a strong double-peaked emission appears at an inferior conjunction (), whereas at a superior conjunction (), the line exhibits a P Cygni-like profile with a broad, blue-shifted absorption down to about −400 km s−1. That study proposes a high-velocity jet or an outflow triggered by mass accretion onto the secondary companion, supported by a central absorption component unrelated to the primary’s RV curve, thus pointing to a circumcompanion disk. Comparable phase-dependent changes in the Hα profile of HR 4049 suggest a similar mechanism involving accretion and mass loss could be at work.
Our results make it possible to refine the orbital parameters of the HR 4049 system and improve the accuracy of their determination. In particular, the orbital period we obtained differs from the previous estimates by less than 0.5%, which is likely due to the use of a method not previously applied to this system: we analyzed only one multiplet of neutral carbon lines. Unlike previous studies that considered various spectral features, this focused approach might have contributed to an increased precision of the orbital parameters.
This further supports the stability of the system’s orbital configuration over long timescales. Nevertheless, further observations with a high spectral resolution and time monitoring remain essential for studying the complex interactions of the stellar wind, possible jets, and disk dynamics, which are likely responsible for the observed variability of the Hα profile.
Thus, our study complements previous works on the HR 4049 system by presenting refined orbital parameters and new mass estimates for both components. These findings confirm the long-term stability of the orbit of HR 4049. Continued monitoring of the Hα profile will help to better understand the nature of post-AGB binary systems and the processes that drive their dynamics.
Author Contributions
Observations, A.S.M., S.D. and A.N.A.; Data reduction, A.S.M.; Data analysis, S.T.N., N.L.V. and A.S.M.; Software A.S.M. and N.L.V.; Writing—original draft preparation S.T.N., N.L.V. and A.S.M.; Writing—review and editing S.T.N., N.L.V., A.S.M., S.D., A.A.K., B.S.Y. and A.T.A. All authors have read and agreed to the published version of the manuscript.
Funding
This research was funded by the Science Committee of the Ministry of Education and Science of the Republic of Kazakhstan (Grant No. AP19175392).
Data Availability Statement
The TCO spectra are available on request via email at a_mirosh@uncg.edu.
Acknowledgments
This research has made use of the SIMBAD database, operated at CDS, Strasbourg, France; SAO/NASA ADS, ASAS, and Gaia data products. This paper is partly based on observations obtained at the 0.81 m of the Three College Observatory (North Carolina, USA). A.M. acknowledges technical support from Dan Gray (Sidereal Technology Company), Joshua Haislip (University of North Carolina Chapel Hill), and Mike Shelton (University of North Carolina Greensboro), as well as funding from the UNCG College of Arts and Sciences and Department of Physics and Astronomy.
Conflicts of Interest
The authors declare no conflicts of interest.
Abbreviations
The following abbreviations are used in this manuscript:
| RV | radial velocity |
| R | spectral resolving power |
| TCO | Three College Observatory |
| SED | spectral energy distribution |
| IRAF | Image Reduction and Analysis Facility |
Notes
| 1 | Shelyak Instruments: https://www.shelyak.com (accessed on 18 February 2025). |
| 2 | Research Center “Data Science in Astrophysics”: https://astro.kaznu.info/Computingcluster.html (accessed on 18 February 2025). |
References
- Miller Bertolami, M.M. New models for the evolution of post-asymptotic giant branch stars and central stars of planetary nebulae. Astron. Astrophys. 2016, 588, A25. [Google Scholar] [CrossRef]
- Bakker, E.J.; Lambert, D.L.; Van Winckel, H.; McCarthy, J.K.; Waelkens, C.; Gonzalez, G. Spectral variability of the binary HR 4049. Astron. Astrophys. 1998, 336, 263–275. [Google Scholar] [CrossRef]
- Van Winckel, H.; Waelkens, C.; Waters, L.B.F.M. The extremely iron-deficient “Post-AGB” stars and binaries. Astron. Astrophys. 1995, 293, L25–L28. Available online: https://ui.adsabs.harvard.edu/abs/1995A&A...293L..25V (accessed on 18 February 2025).
- Acke, B.; Degroote, P.; Lombaert, R.; de Vries, B.L.; Smolders, K.; Verhoelst, T.; Lagadec, E.; Gielen, C.; Van Winckel, H.; Waelkens, C. Amorphous carbon in the disk around the post-AGB binary HR 4049. Discerning dust species with featureless opacity curves. Astron. Astrophys. 2013, 551, A76. [Google Scholar] [CrossRef]
- Malek, S.E.; Cami, J. The Gas-rich Circumbinary Disk of HR 4049. II. A Detailed Study of the Near-infrared Spectrum. Astrophys. J. 2014, 794, 113. [Google Scholar] [CrossRef]
- Andrych, K.; Kamath, D.; Kluska, J.; Van Winckel, H.; Ertel, S.; Corporaal, A. Second-generation protoplanetary discs around evolved binaries: A high-resolution polarimetric view with SPHERE/IRDIS. Mon. Not. R. Astron. Soc. 2023, 524, 4168. [Google Scholar] [CrossRef]
- Gorlova, N.; Van Winckel, H.; Gielen, C.; Raskin, G.; Prins, S.; Pessemier, W.; Waelkens, C.; Frémat, Y.; Hensberge, H.; Dumortier, L.; et al. Time-resolved spectroscopy of BD + 46°442: Gas streams and jet creation in a newly discovered evolved binary with a disk. Astron. Astrophys. 2012, 542, A27. [Google Scholar] [CrossRef]
- Oomen, G.M.; Van Winckel, H.; Pols, O.; Nelemans, G. Modelling depletion by re-accretion of gas from a dusty disc in post-AGB stars. Astron. Astrophys. 2019, 629, A49. [Google Scholar] [CrossRef]
- Miroshnichenko, A.S.; Chari, R.; Danford, S.; Prendergast, P.; Aarnio, A.N.; Andronov, I.L.; Chinarova, L.L.; Lytle, A.; Amantayeva, A.; Gabitova, I.A.; et al. Searching for Phase-Locked Variations of the Emission-Line Profiles in Binary Be Stars. Galaxies 2023, 11, 83. [Google Scholar] [CrossRef]
- Miroshnichenko, A.S.; Zharikov, S.V.; Manset, N.; Khokhlov, S.A.; Nodyarov, A.S.; Klochkova, V.G.; Danford, S.; Kuratova, A.K.; Mennickent, R.; Chojnowski, S.D.; et al. Recent Progress in Finding Binary Systems with the B[e] Phenomenon. Galaxies 2023, 11, 36. [Google Scholar] [CrossRef]
- Mink, J.D.; Kurtz, M. RVSAO 2.0: Digital Redshifts and Radial Velocities. Publ. Astron. Soc. Pac. 1998, 110, 934. [Google Scholar] [CrossRef]
- Scargle, J.D. Studies in Astronomical Time Series Analysis. II. Statistical Aspects of Spectral Analysis of Unevenly Spaced Data. Astrophys. J. 1982, 263, 835–853. [Google Scholar] [CrossRef]
- VanderPlas, J.T. Understanding the Lomb–Scargle Periodogram. Astrophys. J. Suppl. Ser. 2018, 236, 16. [Google Scholar] [CrossRef]
- Foreman-Mackey, D.; Hogg, D.W.; Lang, D.; Goodman, J. emcee: The MCMC Hammer. Publ. Astron. Soc. Pac. 2013, 125, 306. [Google Scholar] [CrossRef]
- Oomen, G.M.; Van Winckel, H.; Pols, O.; Nelemans, G.; Escorza, A.; Manick, R.; Kamath, D.; Waelkens, C. Orbital properties of binary post-AGB stars. Astron. Astrophys. 2018, 620, A85. [Google Scholar] [CrossRef]
- Trams, N.R.; Waters, L.B.F.M.; Waelkens, C.; Lamers, H.J.G.L.M.; van der Veen, W.E.C.J. The effect of mass loss on the evolution of low-mass post-AGB stars. Astron. Astrophys. 1989, 218, L1–L4. Available online: https://ui.adsabs.harvard.edu/abs/1989A&A...218L...1T (accessed on 18 February 2025).
- Waelkens, C.; Lamers, H.J.G.L.M.; Waters, L.B.F.M.; Rufener, F.; Trams, N.R.; Le Bertre, T.; Ferlet, R.; Vidal-Madjar, A. Variability of the post-AGB star HR 4049: Dust obscuration in a binary system. Astron. Astrophys. 1991, 242, 433. Available online: https://ui.adsabs.harvard.edu/abs/1991A&A...242..433W (accessed on 18 February 2025).
- Vickers, S.B.; Frew, D.J.; Parker, Q.A.; Bojičić, I.S. New light on Galactic post-asymptotic giant branch stars—I: First distance catalogue. MNRAS 2015, 447, 1673–1691. [Google Scholar] [CrossRef]
- Oudmaijer, R.D.; Jones, E.R.M.; Vioque, M. A census of post-AGB stars in Gaia DR3: Evidence for a substantial population of Galactic post-RGB stars. MNRAS 2022, 516, L61–L65. [Google Scholar] [CrossRef]
- Rufener, F.; Bartholdi, P. List of 333 variable microvariable or suspected variable stars detected in the Geneva photometry. Astron. Astrophys. 1982, 48, 503–511. Available online: https://ui.adsabs.harvard.edu/abs/1982A&AS...48..503R (accessed on 18 February 2025).
- Lake, R. Photoelectric magnitudes and colours for bright southern stars (sixth list). Mon. Notes Astron. Soc. South. Afr. (MNASSA) 1965, 24, 41. Available online: https://journals.co.za/doi/pdf/10.10520/AJA00248266_953 (accessed on 18 February 2025).
- Monier, R.; Parthasarathy, M. The ultraviolet variations of the post-AGB star HD 89353. Astron. Astrophys. 1999, 341, 117–120. Available online: https://ui.adsabs.harvard.edu/abs/1999A&A...341..117M (accessed on 18 February 2025).
- Green, G.M.; Schlafly, E.F.; Zucker, C.; Speagle, J.S.; Finkbeiner, D.P. A 3D Dust Map Based on Gaia, Pan-STARRS 1 and 2MASS. Astrophys. J. 2019, 887, 93. [Google Scholar] [CrossRef]
- Bailer-Jones, C.A.L.; Rybizki, J.; Fouesneau, M.; Demleitner, M.; Andrae, R. Estimating Distances from Parallaxes. V. Geometric and Photogeometric Distances to 1.47 Billion Stars in Gaia Early Data Release 3. Astron. J. 2021, 161, 147. [Google Scholar] [CrossRef]
- Pecaut, M.J.; Mamajek, E.E. Intrinsic Colors, Temperatures, and Bolometric Corrections of Pre-Main-Sequence Stars. Astrophys. J. Suppl. Ser. 2013, 208, 9. [Google Scholar] [CrossRef]
- Schoenberner, D. Late stages of stellar evolution. II—Mass loss and the transition of asymptotic giant branch stars into hot remnants. Astrophys. J. 1983, 272, 708–714. Available online: https://ui.adsabs.harvard.edu/abs/1983ApJ...272..708S (accessed on 18 February 2025). [CrossRef]
- Blöcker, T. Stellar evolution of low- and intermediate-mass stars. II. Post-AGB evolution. Astron. Astrophys. 1995, 299, 755. Available online: https://ui.adsabs.harvard.edu/abs/1995A&A...299..755B (accessed on 18 February 2025).
- Van Winckel, H. Post-AGB Stars. Annu. Rev. Astron. Astrophys. 2003, 41, 391–427. [Google Scholar] [CrossRef]
- Dominik, C.; Dullemond, C.P.; Cami, J.; van Winckel, H. The dust disk of HR 4049. Another brick in the wall. Astron. Astrophys. 2003, 397, 595–609. [Google Scholar] [CrossRef]
- Bollen, D.; Van Winckel, H.; Kamath, D. Jet creation in post-AGB binaries: The circum-companion accretion disk around BD + 46°442. Astron. Astrophys. 2017, 607, A60. [Google Scholar] [CrossRef]


Disclaimer/Publisher’s Note: The statements, opinions and data contained in all publications are solely those of the individual author(s) and contributor(s) and not of MDPI and/or the editor(s). MDPI and/or the editor(s) disclaim responsibility for any injury to people or property resulting from any ideas, methods, instructions or products referred to in the content. |
© 2025 by the authors. Licensee MDPI, Basel, Switzerland. This article is an open access article distributed under the terms and conditions of the Creative Commons Attribution (CC BY) license (https://creativecommons.org/licenses/by/4.0/).