Article

Advanced LIGO Laser Systems for O3 and Future Observation Runs

1
Max Planck Institute for Gravitational Physics (Albert Einstein Institute) and Institute for Gravitational Physics, Leibniz University Hannover, Callinstrasse 38, D-30167 Hannover, Germany
2
SUPA, University of Glasgow, Glasgow G12 8QQ, UK
3
OzGrav, University of Western Australia, Crawley 6009, Australia
4
neoLASE GmbH, Hollerithallee 17, 30419 Hannover, Germany
5
LIGO, Massachusetts Institute of Technology, Cambridge, MA 02139, USA
6
LIGO Livingston Observatory, Livingston, LA 70754, USA
7
LIGO Laboratory, California Institute of Technology, Pasadena, CA 91125, USA
8
California Institute of Technology, Pasadena, CA 91125, USA
9
LIGO Hanford Observatory, Richland, WA 99352, USA
*
Author to whom correspondence should be addressed.
Galaxies 2020, 8(4), 84; https://doi.org/10.3390/galaxies8040084
Submission received: 29 October 2020 / Revised: 27 November 2020 / Accepted: 3 December 2020 / Published: 8 December 2020
(This article belongs to the Special Issue Gravitational Wave Detectors)

Abstract

:
The advanced LIGO gravitational wave detectors need high power laser sources with excellent beam quality and low-noise behavior. We present a pre-stabilized laser system with 70 W of output power that was used in the third observing run of the advanced LIGO detectors. Furthermore, the prototype of a 140 W pre-stabilized laser system for future use in the LIGO observatories is described and characterized.

1. Introduction

The advanced LIGO (aLIGO) gravitational wave detectors [1] are the most sensitive laser interferometers in the world. Built as Michelson interferometers with arm lengths of several kilometers, they can detect gravitational waves that cause arm length changes below 10 19 m . The sensitivity of these detectors is determined by several parameters, such as the laser power, the interferometer arm length, mirror quality and seismic isolation.
Crucial parts in these interferometers are the laser systems and their stabilization. The requirement on the laser system is given by its influence on the detector’s sensitivity. At high frequencies, the detector’s sensitivity is limited by photon shot noise that couples with 1 / P ; hence, a high laser power P is needed. The aLIGO gravitational wave detectors are operated with the so called DC readout [2]. That means that the output sensor always detects a small amount of laser power. Thus, laser power noise couples directly with the interferometer readout and has to be as low as possible. Additionally, pointing noise leaks into the interferometer output due to misalignment on the modecleaners and the beam splitter. Laser frequency noise couples whenever the arms are not of equal length or the Fabry Pérot cavities in the interferometer arms are asymmetric [3]. The mode purity of the laser beam that is sent to the interferometer determines the power inside the interferometer and the shot noise on length and alignment sensors. Thus, the mode purity, by means the TEM 00 mode content of the beam, has to be as high as possible. This is typically achieved by spatial beam filtering via a pre-modecleaner [4] and an input modecleaner [5], but to preserve as much power from the initial laser beam as possible, good mode quality should be provided from the beginning. The combination of a high power laser beam with high spatial beam quality and stability is needed to operate a gravitational wave detector with high sensitivity.
In the first section of this paper we present the layout and performance of the pre-stabilized laser system (PSL) that was used in the last observing run of aLIGO (O3). This laser system operated at an output power of 70 W and a wavelength of 1064 n m . It consisted of components that were installed already for the two first aLIGO observation runs [6], with the addition of a new laser power amplifier [7].
The second section is devoted to the PSL that will be used for the next observing run (O4). The O4 system will deliver twice the output power of the O3 system with a new amplification layout. The pre-stabilization components will basically stay the same, but modifications to the intensity stabilization electronics will be made. A first prototype of this system was assembled during O3 and this paper presents the results of its characterization.
The O4 laser system section will be followed by a summary and an outlook towards possible laser configurations for further upgrades of the aLIGO detectors at the end of this paper.

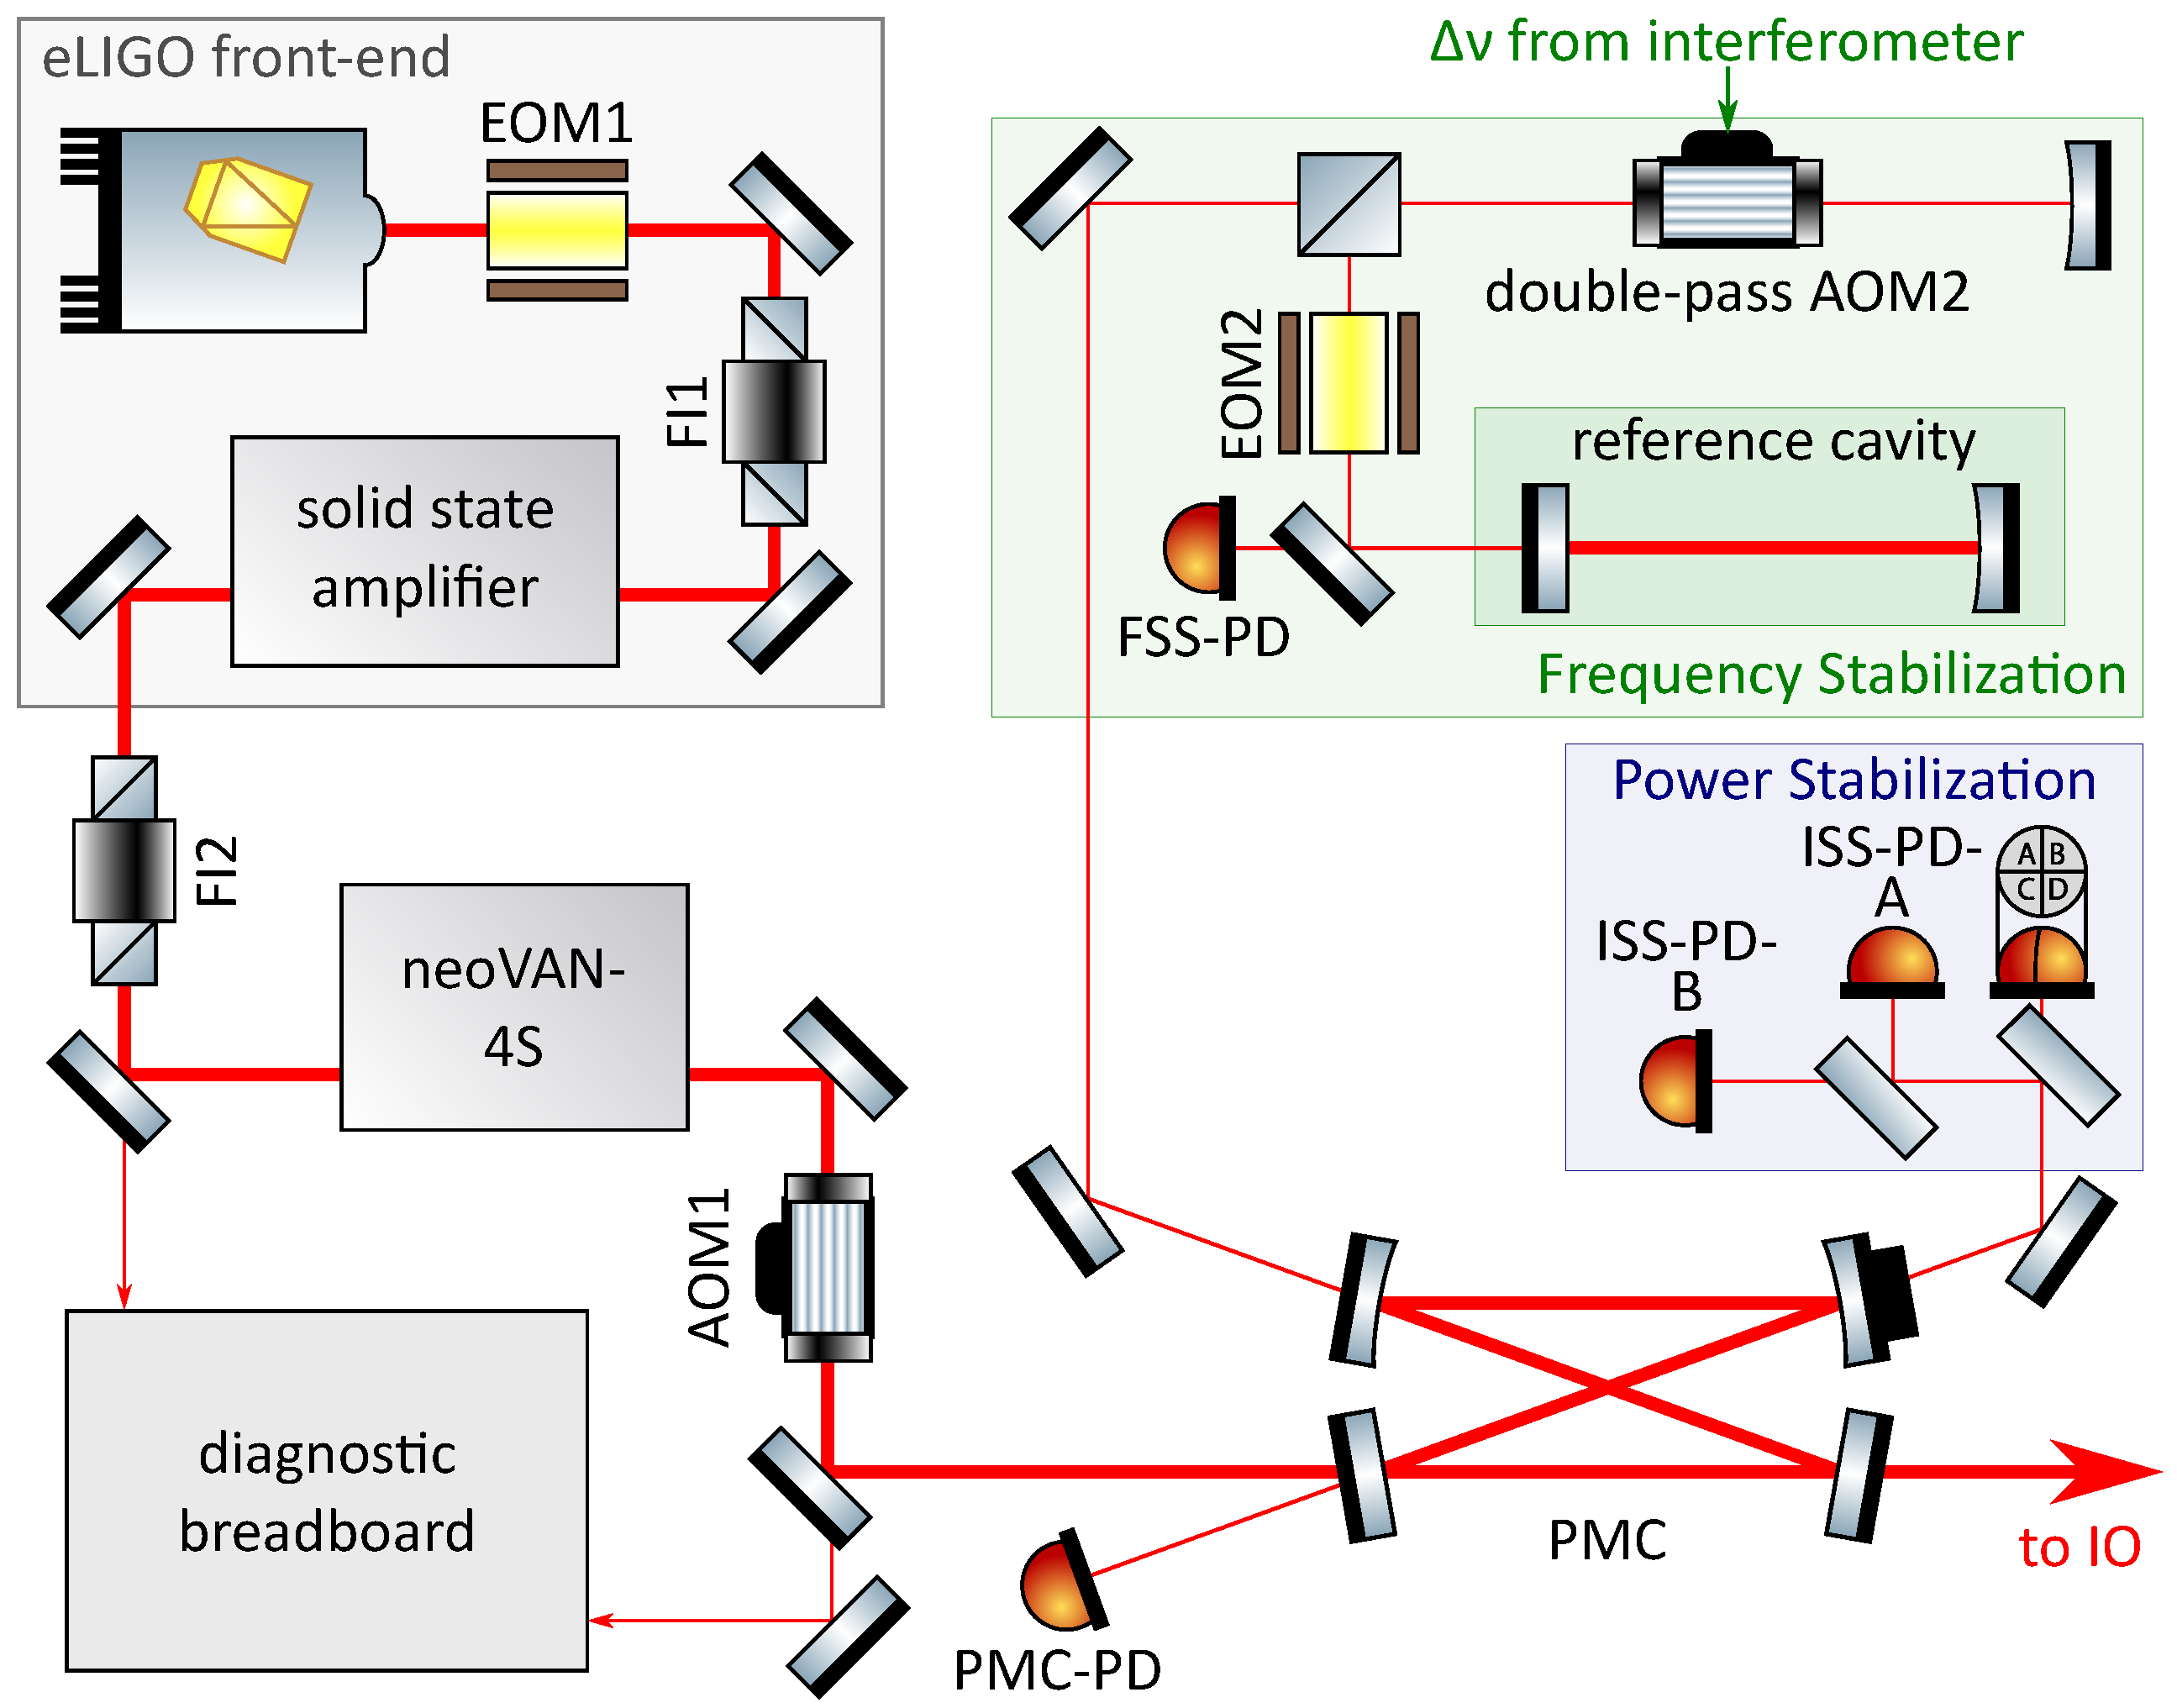
2. Pre-Stabilized Laser System in O3

The original laser power requirement to reach the aLIGO design sensitivity was 180 W at a wavelength of 1064 n m before spatial filtering by the modecleaners [8]. The pre-stabilized laser system that was designed to fulfill that requirement is described in [6]. It was based on a high power oscillator (HPO) configuration [9], which was seeded by a non-planar ring oscillator laser (NPRO) [10] amplified to 35 W by a medium power solid state amplifier [11]. The combination of the NPRO and a medium power amplifier was designed for and already used in the enhanced LIGO (eLIGO) interferometers [12] and will be referred to as the front-end. The HPO consisted of four neodymium doped crystals as the active medium, arranged in an injection-locked ring oscillator configuration. High power pump diodes had to be used to achieve the desired output power. Thus, water cooling with high turbulent flow and big tubes was necessary. Pointing noise and beam size fluctuations caused by vibrations from this cooling had an unexpectedly high negative influence on the interferometer [13]. Based on this and the high maintenance associated with the HPO, it was decided to replace the injection-locked oscillator with a much simpler single-pass solid state amplifier which required less water cooling flow. This amplifier was integrated and tested in an aLIGO PSL reference environment at the Albert Einstein Institute (AEI) in Hannover, Germany, before installation at the LIGO observatories [7].
In the first part of this section we will describe the optical configuration of the aLIGO O3 laser system based on these amplifiers. This is followed by a characterization of the system and its performance during the O3 observation run.

2.1. Layout

The aLIGO PSL for O3 consisted of components that were already used in earlier observation runs combined with a new amplification module. In Figure 1a simplified layout of the laser system, including the important parts for the pre-stabilization and characterization, is shown. For the seed system an eLIGO front-end was used [11]. This consists of a 2 W NPRO laser which seeds a solid state amplifier consisting of four sequentially arranged water-cooled Nd:YVO 4 crystals that are pumped with fiber coupled pump-diodes at a wavelength of 808 n m . An electro-optic modulator (EOM1) and a Faraday isolator (FI1) were installed between the NPRO and the medium power amplifier. The front-end delivered a maximal output power of 35 W that was sent through a second Faraday isolator (FI2) which protected the front-end laser from back scattered and back reflected light.
A small fraction of the front-end light transmitted by FI2 was injected into a diagnostic breadboard (DBB) [14,15]. This is a fully automated diagnostic system developed to measure the relative power noise (RPN), frequency noise, relative beam pointing noise and higher order mode (HOM) content of a laser beam. It is based on a three mirror cavity which can be stabilized to the incident laser beam’s frequency via a dither locking scheme. The complex combination of the amplitude spectral densities (ASD) of the control signal and the error signal of this feedback control loop can be calculated to derive the frequency noise of the laser beam. For that the control signal is calibrated via the PZT response and the error signal via the DBB resonator’s free spectral range. The PZT response, including a compensation of the PZT non-linearity, was derived by an analysis of the HOM spacing for different PZT voltages. By scanning the cavity length and measuring the power in transmission of the cavity, a modescan measurement can be performed that gives information about the HOM content normalized by the TEM 00 eigenmode of the cavity. Automatic alignment of the incoming beam to the cavity eigenmode is achieved by a differential wave front sensing scheme [16]. To implement the automatic alignment system, two piezo-electrically actuated mirrors and two quadrant photodiodes (QPD) are integrated into the DBB. The error and control signal ASDs of the auto-alignment feedback control loops represent the relative beam pointing noise of the incoming laser beam. A fraction of the laser beam that is injected to the DBB cavity is used to measure the relative power noise of the beam.
The front-end output was used to seed a neoVAN-4S solid state amplifier built by the company neoLASE in Hannover, Germany [7]. This amplifier is similar to the one in the front-end and consists of four Nd:YVO 4 crystals in series which are pumped with fiber coupled pump diodes at a wavelength of 808 n m . The neoVAN-4S head and diodes are water-cooled and the amplifier delivered an output power of 70 W .
The amplified laser beam was sent through an acousto-optic modulator (AOM1) to the bowtie pre-modecleaner (PMC) which acts as a filter for the spatial beam profile and pointing noise of the laser beam. Furthermore, the PMC filters power noise in the radio frequency range. The PMC that was used at the Livingston site was the same as the one used in earlier observation runs [4]. In Hanford the all-bolted PMC, in which the mirrors are held in place mechanically rather than using glue, was installed for O3. This change was made in efforts to eliminate contamination of the PMC mirrors that was observed with some of the glued PMCs and to facilitate replacing mirrors, when necessary [17]. Investigations revealed that the annular PZT transducer that was glued to one of the mirrors to control the cavity length was a key contributor to the increasing optical loss. Ultra-high vacuum versions using low-outgassing materials are used for the all-bolted PMCs, and no increase in the optical losses has been observed to date. The filtered beam was then sent to the input optics subsystem (IO) [5].
The two low power output beams of the PMC were used for the frequency and power pre-stabilization of the main laser beam. The frequency was pre-stabilized to the same reference cavity that was used for the original LIGO PSL. The reference cavity is a monolithic, linear, fused silica resonator that is located inside an ultra-high vacuum chamber with a pressure below 10 6 Pa . It has a length of 203 m m , a finesse of 11 , 500 and is suspended by a single pendulum stage supported by a passive vibration isolation stack. The laser beam was frequency stabilized to this ultra stable cavity via the Pound–Drever–Hall locking scheme [18]. The required phase modulation side bands were generated by EOM2. The FSS-PD photodiode signal was used to generate the control loop’s error signal. The control signal produced by the feedback control electronics was then sent to a piezoelectric element attached to the NPRO laser crystal, the NPRO crystal temperature control and to EOM1. The complete frequency stabilization loop of the gravitational wave detector consisted of more layers with the long interferometer arms as the final frequency reference. The double-passed AOM2 was used to add a variable frequency offset to the beam sent to the reference cavity. A feedback control based variation of this offset allows to match the laser frequency to the interferometer’s modecleaner resonance without changing the reference cavity length.
To pre-stabilize the laser’s power, a set of in-loop and out-of-loop photodiodes (ISS-PD-A and ISS-PD-B) and a QPD were installed in the second low power output port of the PMC. The in-loop photodiode sensed the laser power, which was then compared to an electronic reference value and amplified in the power stabilization electronics. The resulting control signal was sent to AOM1, which actuated the laser power. AOM1 required an offset to enable an actuation towards higher and lower laser powers. The complete power stabilization system contained a second loop which used an additional photodiode at the interferometer’s input modecleaner output as in-loop sensor and fed back the control signal to the first loop’s error point.
The pre-stabilized laser systems were the same for both aLIGO gravitational wave detectors. The laser system was located in an acoustically isolated laser room and could be remotely operated via the LIGO control and data system (CDS) [19]. All front-end and neoVAN-4S pump diodes and power supplies were located in another room to prevent electromagnetic interference between the diode drivers and the sensitive electronics located in or close to the laser room. The electronics for the DBB, the PMC and the power stabilization as well as the frequency stabilization CDS interface were located outside but close to the laser room. Only the table top frequency stabilization servo (TTFSS) was located in the laser room, to keep the distance to the actuators and with that the cable lengths as short as possible. The water chiller for the front-end diodes and amplifier, and the neoVAN-4S amplifier, diodes and electronics was situated in the additional distant room to decrease the coupling between the laser system and vibrations, acoustic noise and air flow generated by the chiller.
The laser power that finally was sent to the interferometer was adjusted with a half wave plate followed by two thin film polarizers. The unit was part of the input optics subsystem and installed as one of the last components in the laser room.

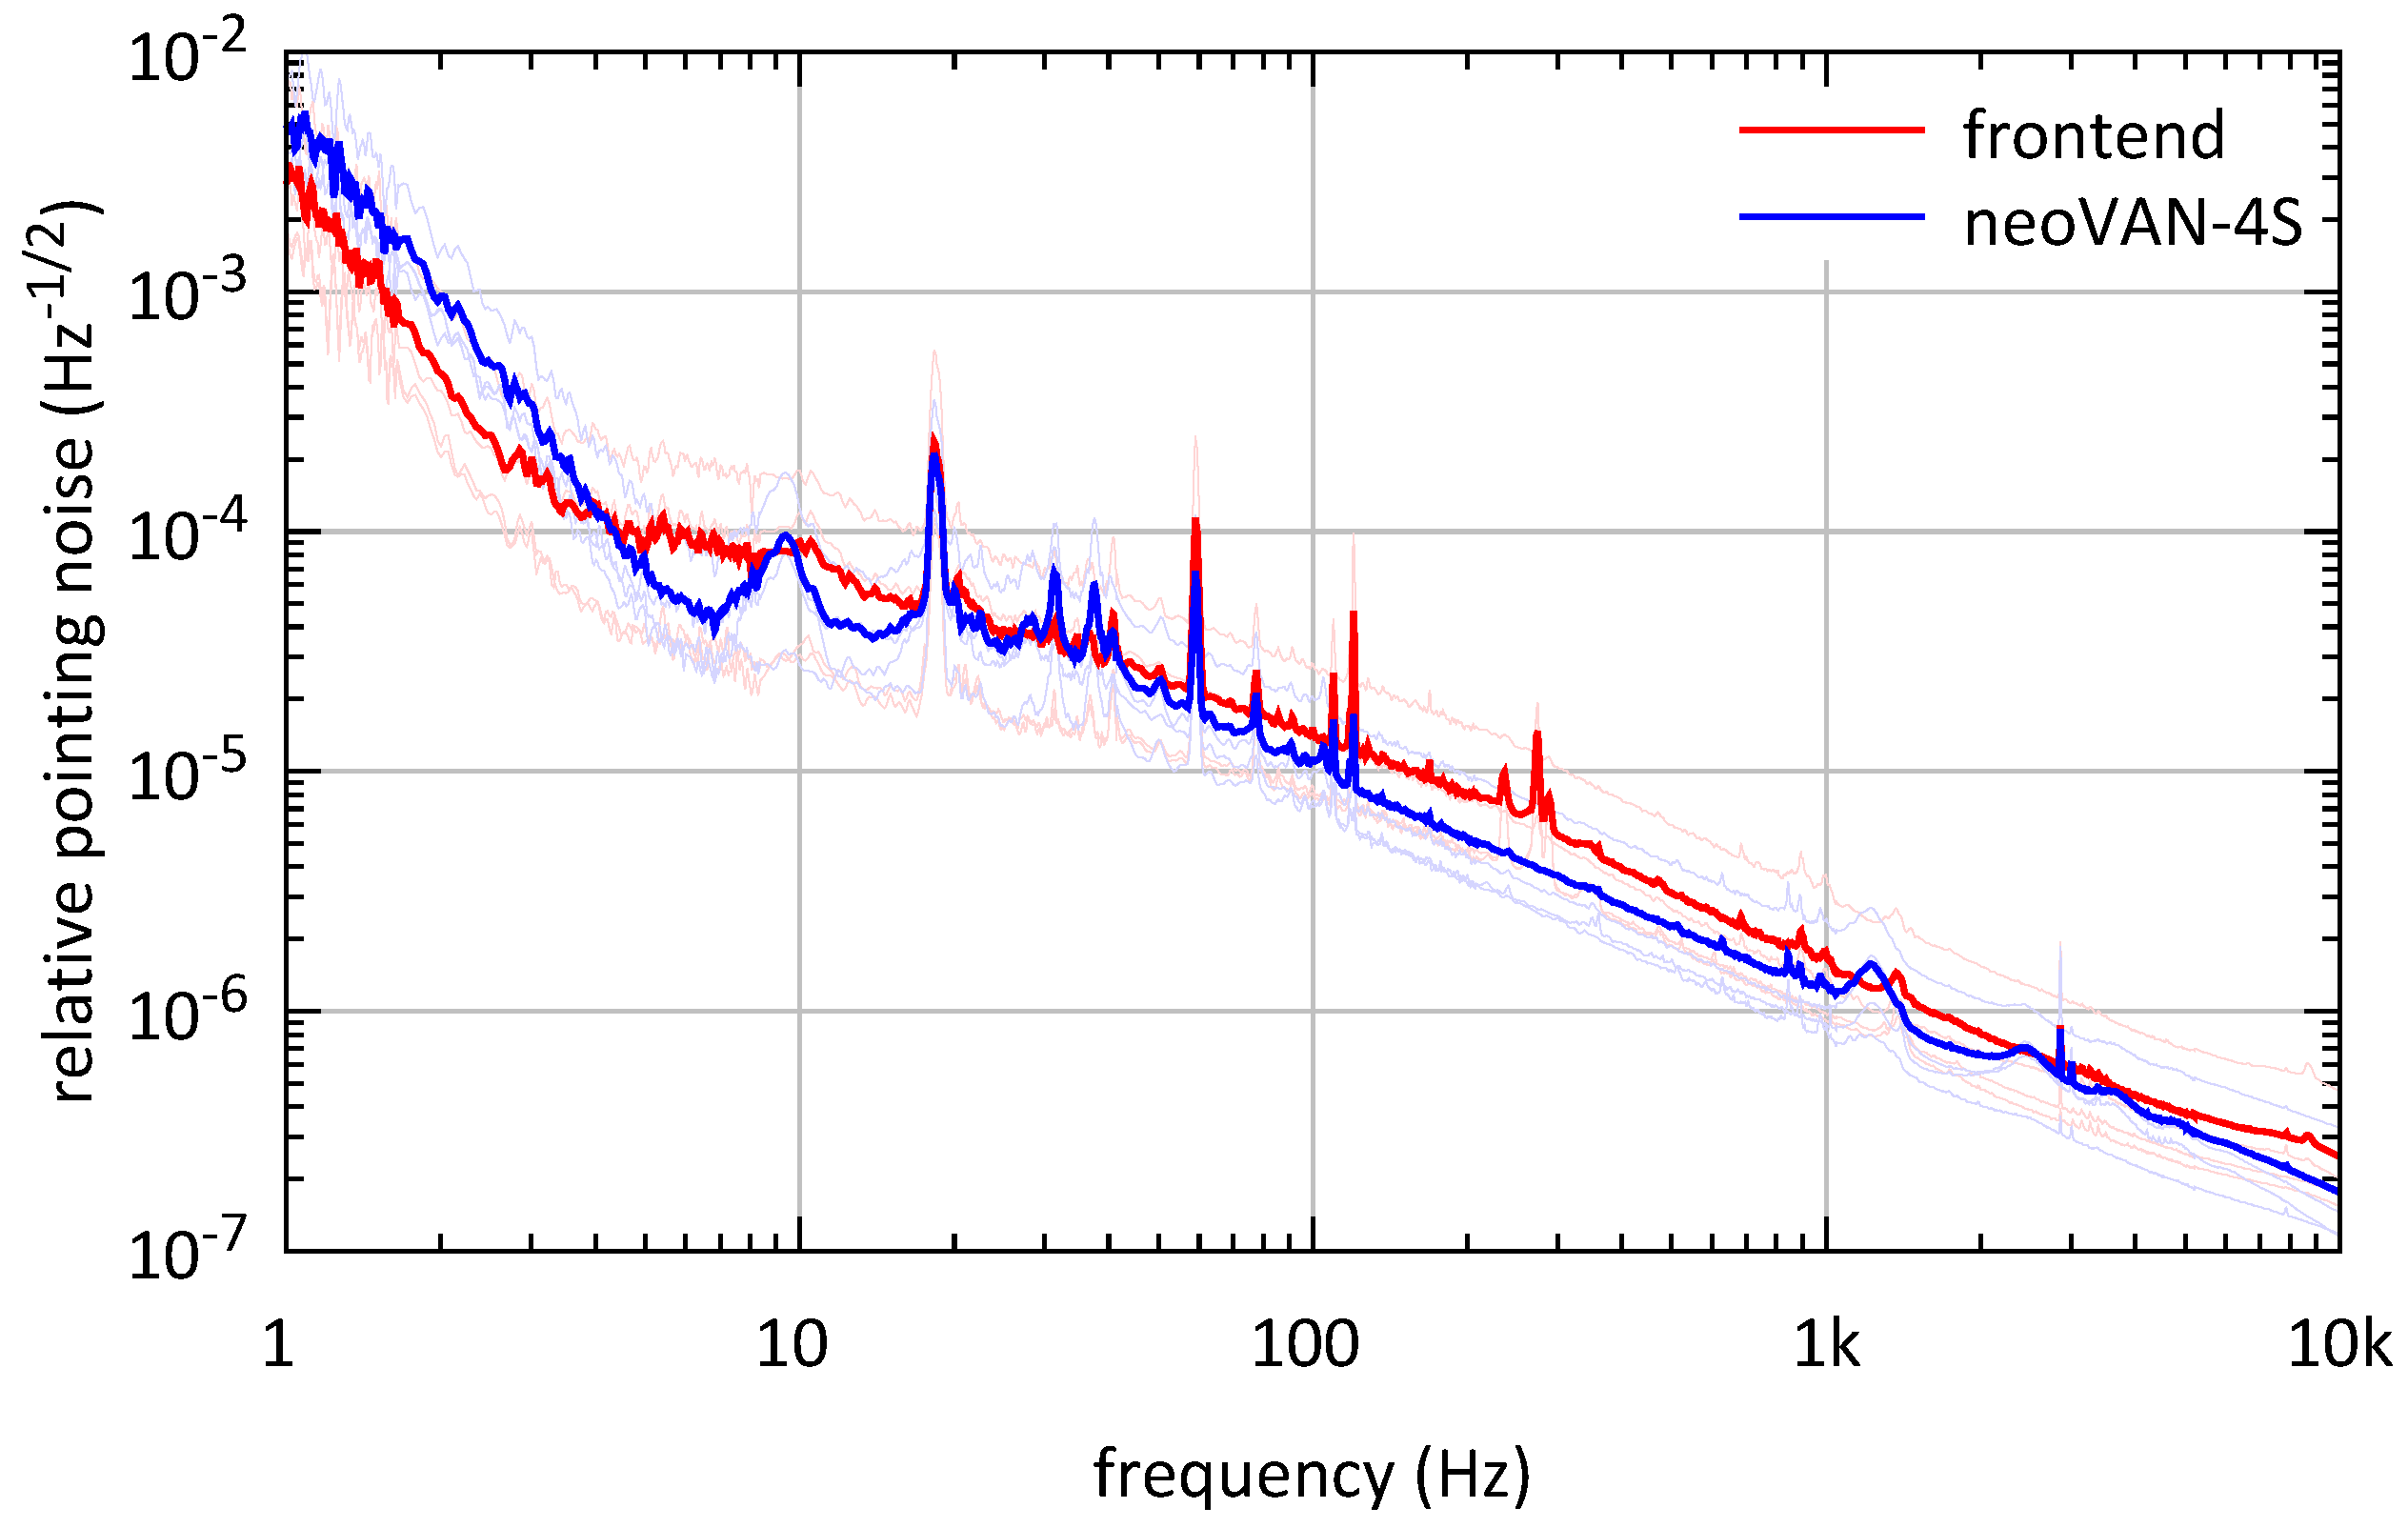
2.2. Characterization and Performance during O3

A detailed description and characterization of a neoVAN-4S amplifier integrated in an aLIGO laser reference system at the Albert Einstein Institute in Hannover (AEI) can be found in [7].
Here we present a set of DBB measurements that characterize the aLIGO O3 laser system in Livingston, Louisiana, and a long term power trend measured in Hanford, Washington.
Figure 2 shows modescan measurements of the front-end beam and the output of the neoVAN-4S amplifier. The peaks at zero and at one free spectral range (FSR) of the non-degenerated cavity are the TEM 00 peaks. The contributions of all higher order mode peaks in between the two TEM 00 peaks sum up to the laser beam’s higher order mode content. The HOM content calculated this way must be understood as an upper limit for the laser beam’s mode mismatch compared to a perfect TEM 00 mode, as alignment and mode matching errors and imperfections of the DBB cavity’s eigenmode contribute to this number as well.
The most prominent peak in both modescans is the one at about 0.3 FSR. This peak represents the second-order TEM modes and can thus be explained by a mode matching error or astigmatism in the laser beam. Fourth-order TEM modes are represented by the peak at 0.62 FSR. A mode matching based small decrease in the second-order mode peak achieved by a change of the mode matching lenses often leads to an increase in the fourth-order mode peak, as can be seen between the two measurements. The peak at 0.65 FSR represents the TEM 10 mode. Its increase on the output of the neoVAN-4S amplifier is due to a slight misalignment of the beam to the DBB. An increase in all the small higher-order mode peaks leads to an increased HOM content on the output of the neoVAN-4S amplifier.
The HOM content measured for the beam coming from the front-end is <5.7% and the one for the beam amplified by the neoVAN-4S amplifier is <6.2%. This corresponds to about 66 W in the TEM 00 mode.
The RPN measured at the output of the front-end and the RPN of the neoVAN-4S amplifier are shown in Figure 3. The RPN measured at the neoVAN-4S amplifier’s output is about four times higher than the front-end beam’s RPN. This measurement fits expectations generated from the configuration tested at the AEI. The RPN of the amplified beam is a result of the uncorrelated sum from the seed’s and the pump diode’s noise contributions. The noise contribution of the pump diodes was affected by the high noise of their power supplies as already reported in [7].
Relative beam pointing measurements of the front-end beam and the neoVAN-4S amplifier’s output are shown in Figure 4. Each curve represents the mean of four measurements, one for each alignment degree of freedom; they are depicted in lighter versions of the same color. The first two degrees of freedom for the relative beam pointing measurement are here defined as the lateral shift between the measured beam and the reference beam, in this case the DBB cavity’s eigenmode, at the location of the Gaussian beam waist normalized by the waist radius δ x / w 0 in vertical and horizontal directions. The other two degrees of freedom are defined by a tilt between the measured beam and the same reference beam normalized by the divergence angle of the Gaussian beam δ α / θ D , also in vertical and horizontal directions. The two curves shown in Figure 4 are very close to each other, which means that no additional pointing is generated by the neoVAN-4S amplifier. As already mentioned, coupling of pointing noise from the PSL to the interferometer, due to the water-cooling needed for the HPO, was a problem before O3. In [13] it is stated that high resonances between 250 Hz and 800 Hz in the pointing noise were coupled to the interferometers’ sensitivity before O3 and that the pointing noise was no longer limiting after the HPO was substituted by the neoVAN-4S in O3.
In order to not miss a gravitational wave event during the observation run, the aLIGO PSL had to be constantly operational. Figure 5 shows an hourly sampled power trend over the time of O3 measured in PMC transmission at the LIGO site in Hanford. The PSL operated unattended reliably during the year-long observing run with only a small drop in output power from 55 W to 52 W . This can be most probably explained by small alignment drifts in the optics that guided the front-end beam to the neoVAN-4S amplifier. The imperfect alignment caused an increase in the neoVAN-4S amplifier beam’s HOM content, which was filtered out by the PMC and reduced the power in PMC transmission. Steps in the plot are due to realignment to the PMC, changes in the power offset for the power stabilization system and optimizations in the pump diode powers and temperatures for both amplifiers. As the interferometer operated with significantly less than the full PSL output power, the observation run was not interrupted to improve the alignment between the front-end laser and the neoVAN-4S amplifier.

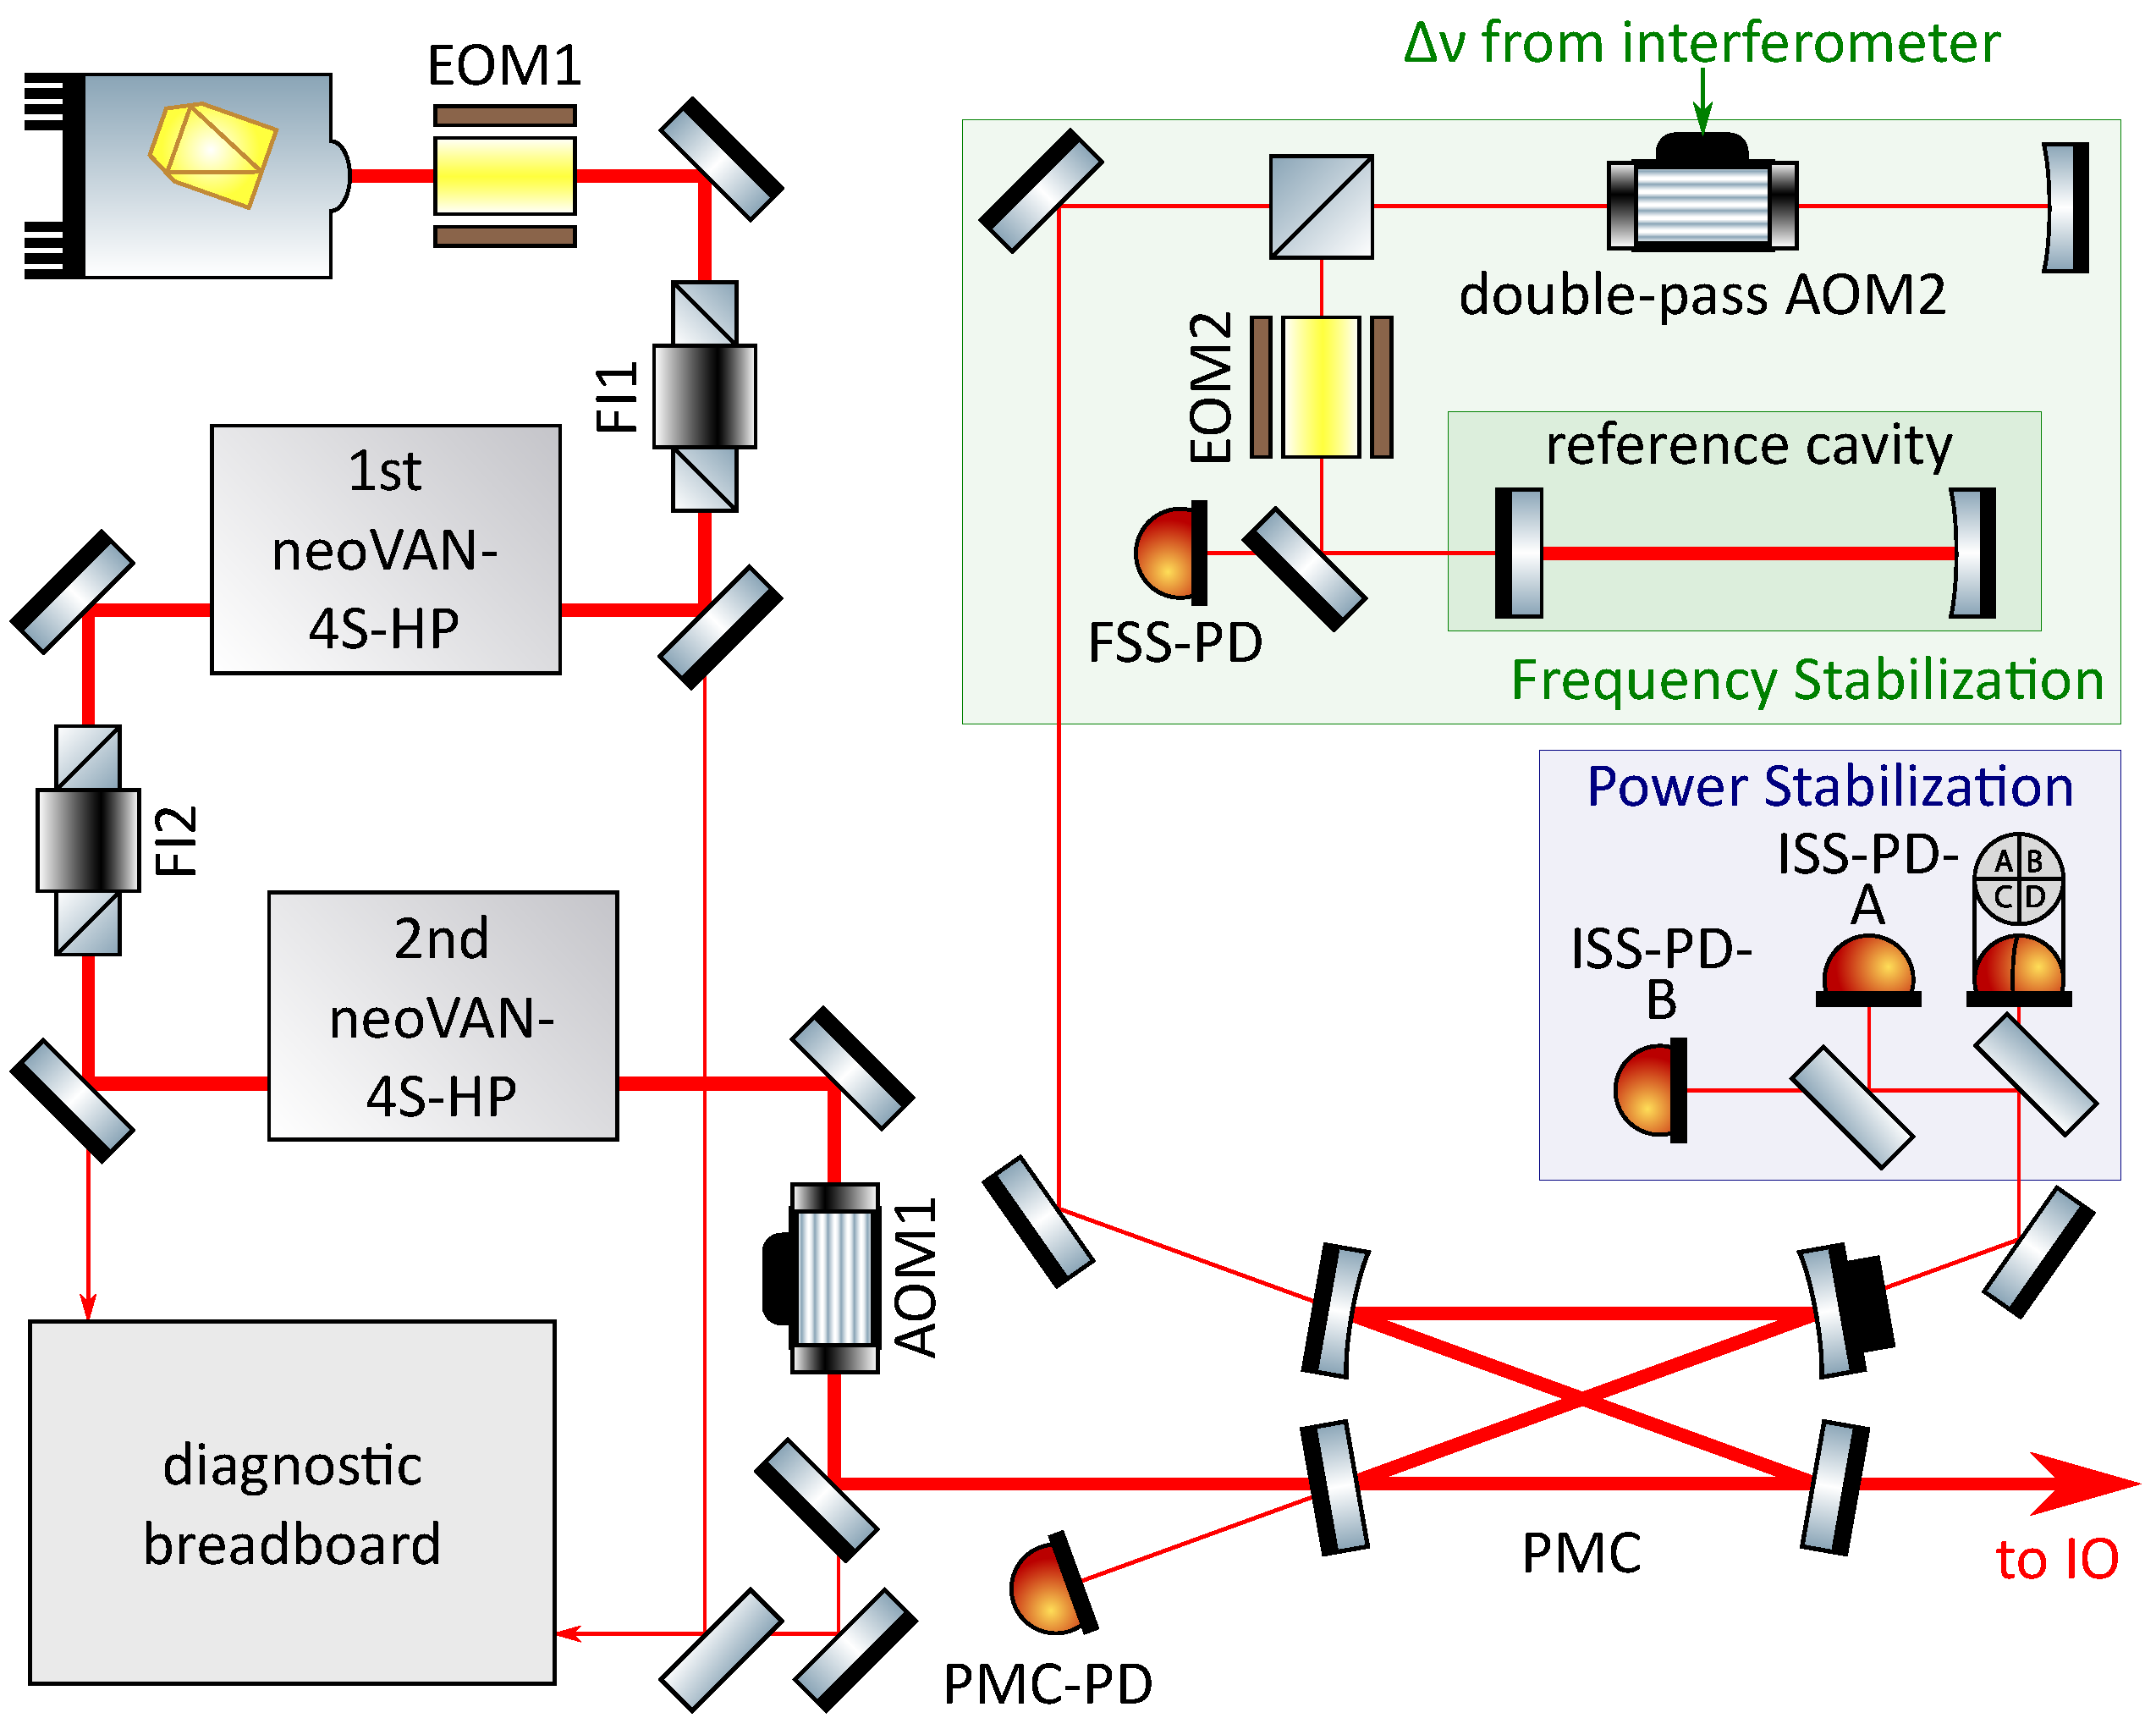
3. Pre-Stabilized Laser System for O4

In this section we will describe the pre-stabilized laser system that will be used for the next aLIGO observing run (O4). As mentioned in Section 2, a 180 W laser beam with a wavelength of 1064 n m injected to the PMC was assumed to calculate the aLIGO design sensitivity. The PSL that was used for O3 delivered 70 W before modecleaning. This was enough laser power for O3, but higher power levels will be required for the coming observing runs. Hence, a new system based on sequential neoVAN-4S-HP solid state amplifiers, similar to the one presented in [20], was developed. This O4 laser system was designed to deliver an output power of 140 W before modecleaning, which brings it closer to the aLIGO design value.
In the first part of this section we will point out the changes in the experimental layout compared to the O3 PSL, which will be followed by a characterization of the O4 PSL prototype, performed in the Test and Training facility at the aLIGO Livingston site.

3.1. Layout

The layout that will be used for O4 is presented in Figure 6. The seed laser source of the first amplification stage is still a 2 W NPRO laser at a wavelength of 1064 n m . Its laser beam is then sent through an EOM (EOM1) for sideband generation and phase actuation and a Faraday isolator (FI1) to protect the NPRO from back reflections and back scattering. The laser beam transmitted by FI1 is amplified by the first neoVAN-4S-HP amplifier. This amplifier is the high power version of the neoVAN-4S. To reach a higher amplification, the four Nd:YVO 4 crystals are optimized for a pump wavelength of 878 n m associated with a smaller quantum defect in the amplification process. Pump diodes at this wavelength with higher output power compared to the 808 n m pump diodes are used. 70 W of output power from the first neoVAN-4S-HP amplifier was achieved with the prototype system presented in this paper.
The amplified laser beam is sent through FI2 and amplified by the second neoVAN-4S-HP amplifier to 140 W . This design is based on a successful test of a single and two sequential neoVAN-4S-HP amplifiers at the AEI [7,20].
Similarly to the O3 laser system, a DBB is used for beam characterization. A small fraction of the NPRO beam and the beams amplified by the first and the second neoVAN-4S-HP amplifiers are sent to the DBB. Electrically-actuated shutters will be used here to control which beam is analyzed by the DBB. This arrangement will allow a remote laser characterization while the gravitational wave detectors are running.
The output from the second neoVAN-4S-HP amplifier is sent through AOM1 to the all-bolted PMC that was already installed for O3 in Hanford, as described in Section 2. The two PMC low power output ports will be used for the frequency and power stabilization of the laser beam, in the same sensor configuration as described in Section 2 for the O3 system. The frequency pre-stabilization for the O4 system will be the same as for the O3 system described in Section 2.
A current shunt actuator similar to the one demonstrated in [7] is integrated in the neoVAN-4S-HP amplifiers. This current shunt allows direct modulation of the pump light and thus the neoVAN-4S-HP amplifier’s output power. Hence, the current shunt could replace AOM1 as the actuator for the power stabilization. This would bring the advantage of eliminating AOM1 as a transmissive optical device in the high power beam path [21]. On the other hand, changes in the diode current could also lead to changes in the beam parameters, especially the RPN and HOM content. Both options, the current shunt and the AOM were tested in the Test and Training facility with similar results. For now it is decided to use the AOM as the O4 baseline actuator, as it showed a slightly better low frequency behavior compared to the current shunt, and it has shown its reliability during prior observing runs.

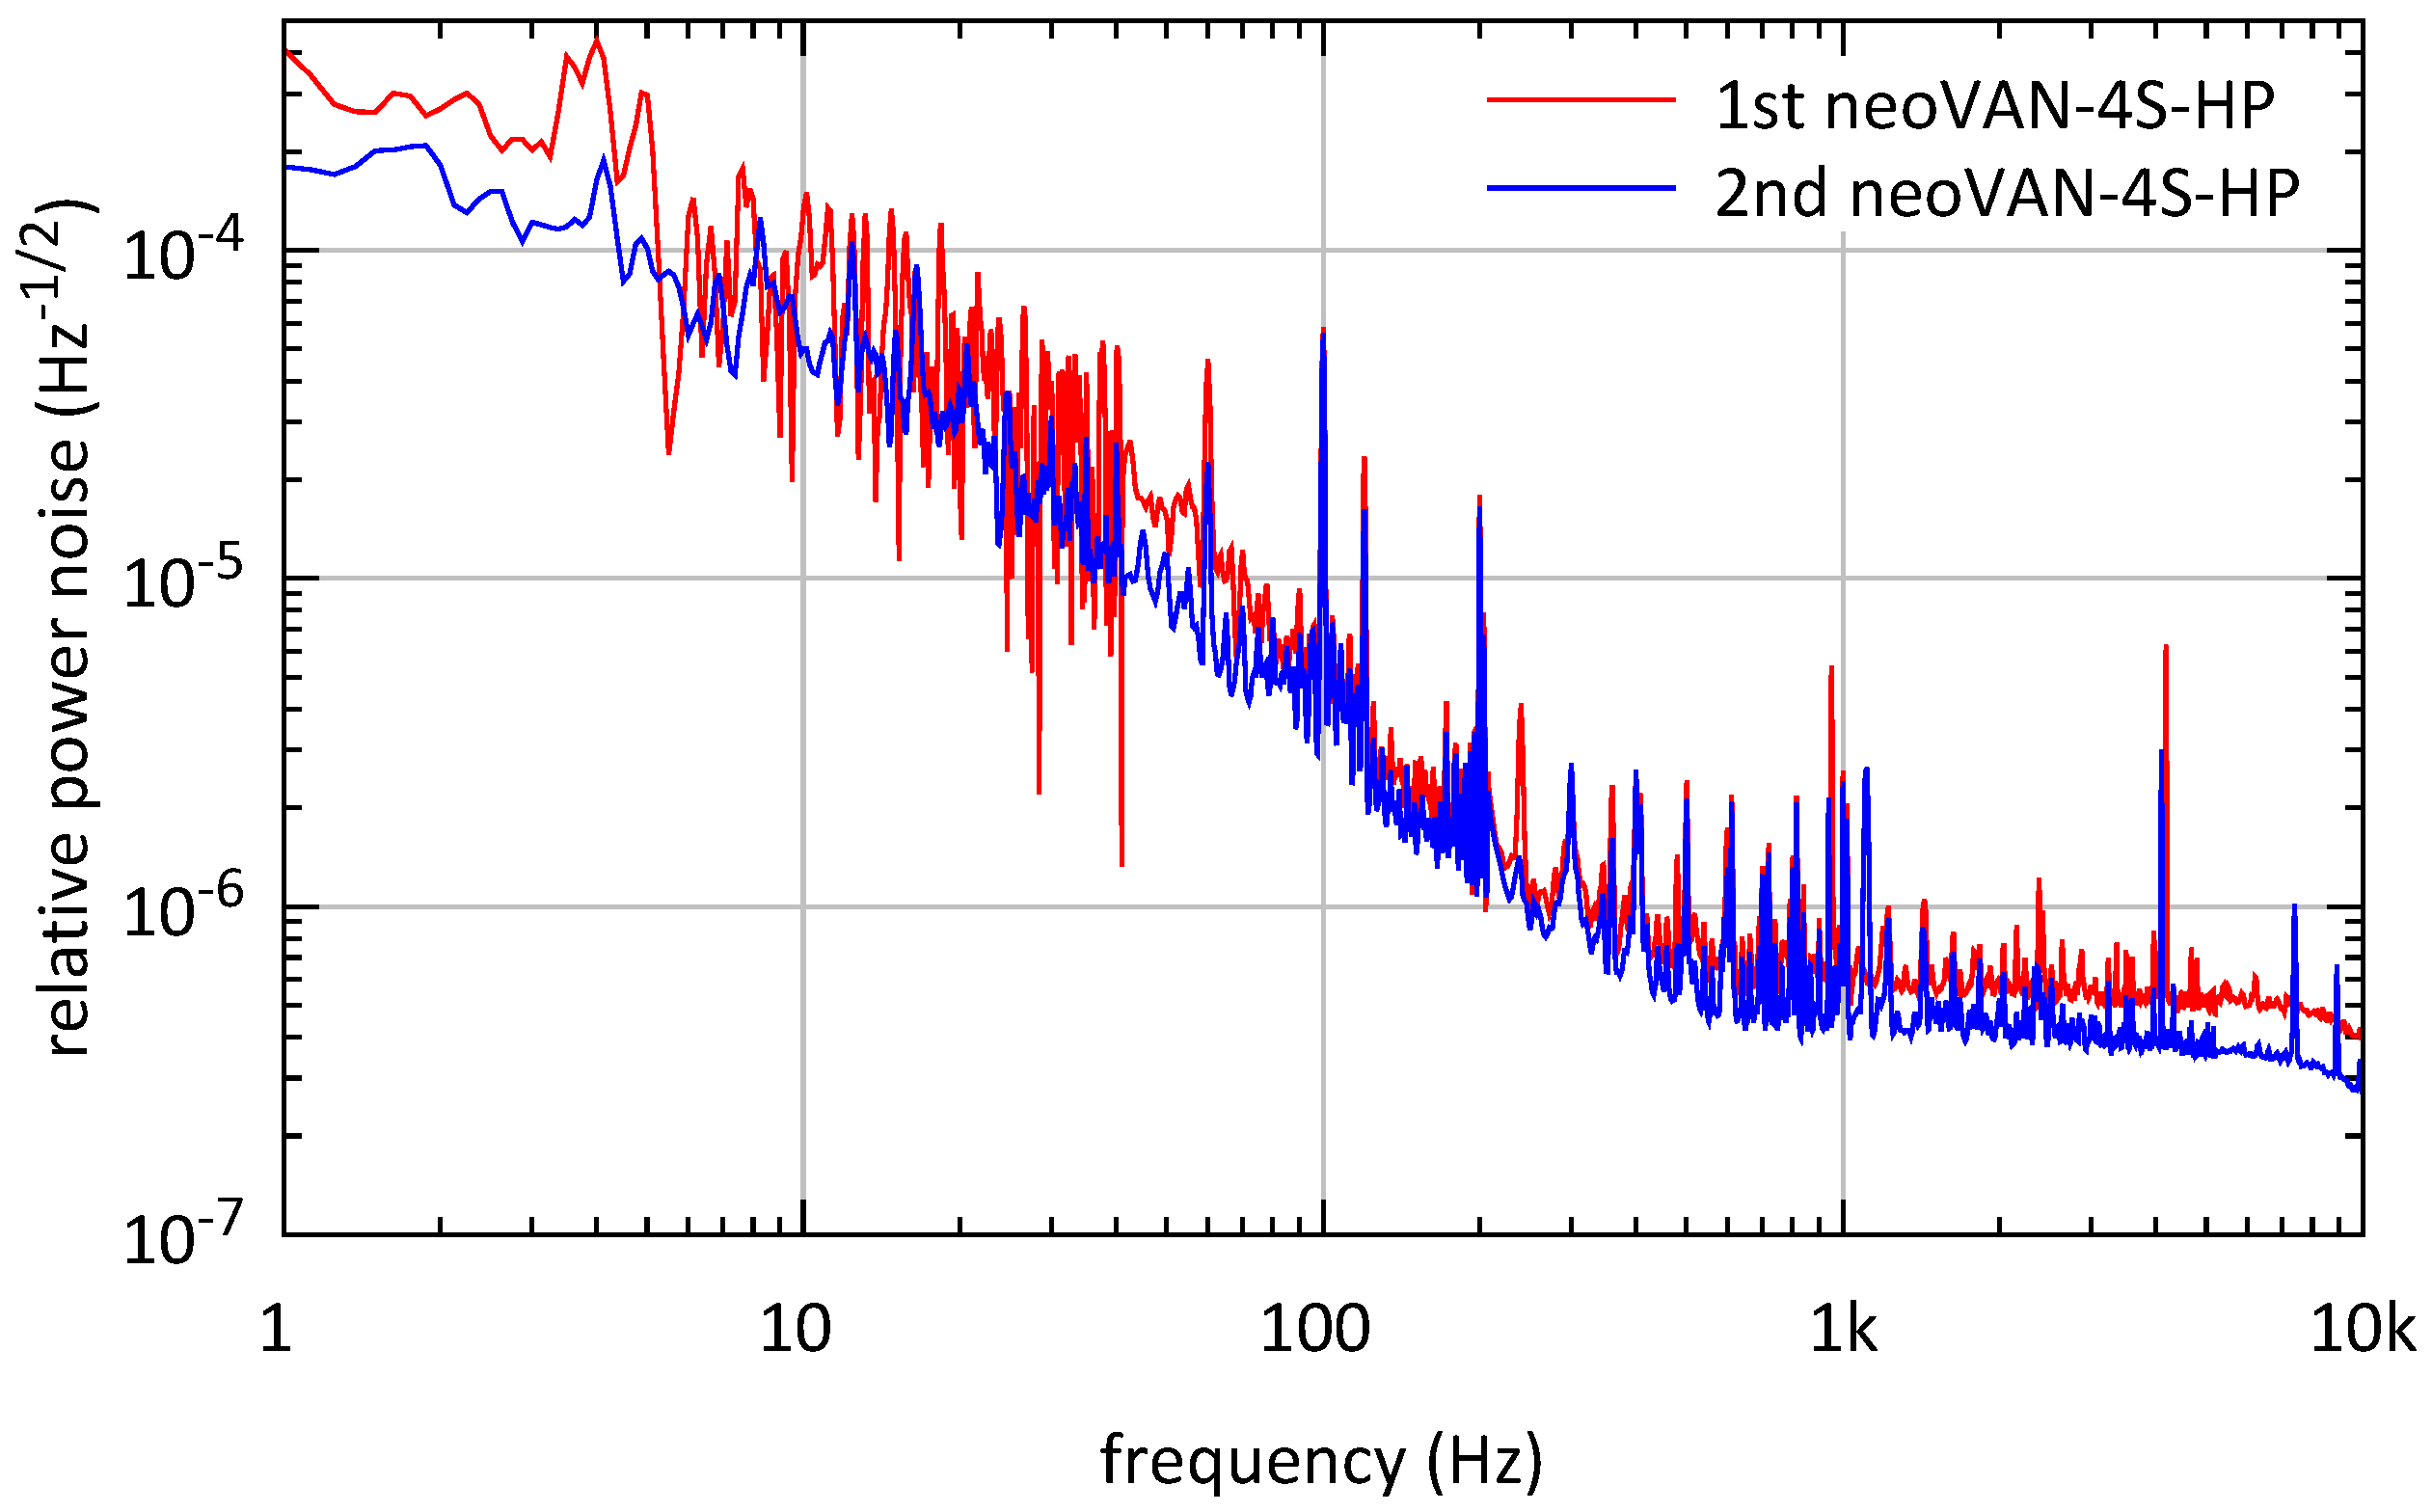
3.2. Characterization of the O4 Laser System Prototype

As previously mentioned, a first prototype of the O4 laser system, as depicted in Figure 6, was installed in the Test and Training facility at the LIGO site in Livingston, Louisiana. This prototype was used to test and optimize the design and to gain experience with alignment, commissioning and maintenance tasks without interfering with the operating gravitational wave detectors.
Here we will show the full characterization of the laser system before the frequency stabilization subsystem (see green box in Figure 6) was installed and before the power stabilization (blue box in Figure 6) was commissioned. All measurements were performed with the DBB as shown in Figure 6.
Figure 7 shows modescan measurements of the laser beams amplified by the first and second neoVAN-4S-HP amplifiers. The peak at about 0.3 FSR increased after the second neoVAN-4S-HP amplifier. As explained in Section 2, this peak represents the TEM 20 and TEM 02 modes and can thus be explained by non perfect mode matching or astigmatism in the laser beam. The higher order mode content was measured to be <4.2% at the output of the first neoVAN-4S-HP amplifier and <4.5% at the output of the second one. Hence, there are 134 W in the TEM 00 mode available.
The RPN measurements of the beams amplified by the first and second neoVAN-4S-HP amplifier, respectively, are plotted as amplitude spectral densities in Figure 8. It has to be pointed out here that the NPRO laser’s noise eater was turned off in these measurements, whereas it was turned on in the RPN measurements of the O3 laser, shown in Section 2. The noise eater is a built-in power stabilization mechanism integrated to suppress the NPRO laser’s relaxation oscillation. It also reduces the laser’s RPN at frequencies from about 10 Hz to several MHz , as described in [14]. Large fluctuations can be observed in the frequency band around 10 Hz , which were most probably caused by environmental disturbances. Besides that, the RPN measured at the output of the second neoVAN-4S-HP amplifier is decreased compared to its seed, which is the output of the first neoVAN-4S-HP amplifier. This behavior is expected from a saturated amplifier with low noise pump diodes. If a certain seed power level is reached, the amplification is not linear anymore and a fixed power is added by the amplifier nearly independent of the seed power. The RPN of the amplifier’s output beam is given by the uncorrelated sum of the seed and pump diodes relative power noise contributions. The pump diodes used for the neoVAN-4S-HP amplifier have much lower RPN than the amplifier’s seed beam. Thus, the output beam’s RPN is equal to the seed RPN decreased by the inverse of the frequency dependent amplification, as described in [20].
Figure 9 shows the frequency noise measurements of the two neoVAN-4S-HP amplifier output beams. Both measurements show a similar noise level that is close to the expected NPRO noise. Fluctuations similar to the relative power noise can be observed around 10 Hz , which are most likely caused by the same environmental issues. The elevated area around 8 k Hz in the second neoVAN-4S-HP amplifier’s noise curve is a measurement artefact.
It is important to note that the aLIGO laser room provides a much quieter environment than the Test and Training laboratory. Hence, we expect that these low frequency fluctuations in the RPN and the frequency noise will be lower for laser systems installed in the laser rooms at the observatories.
The last DBB measurements show the relative beam pointing noise, measured at the output of each neoVAN-4S-HP amplifier, in Figure 10. The relative pointing noise measurements shown here are higher than the curves measured for the Livingston O3 system shown in Figure 4, but the two measurements are close to each other, hence no additional noise was added by the second neoVAN-4S-HP amplifier. Additionally, the two AEI publications ([7,20]) showed that the neoVAN-4S-HP amplifiers don’t add relative pointing noise to their seeds. The higher noise level compared to the O3 system, thus, must result from environmental issues as well as the internal DBB noise. The elevated area up to 100 Hz is most likely due to external influences, such as vibrations of the table. Lower relative pointing noise than measured here is expected once the system is installed in the quieter laser room.
As stated before, high resonances in the beam pointing between 250 Hz and 800 Hz influenced the detector’s sensitivity before O3. Even in the noisy environment of the Test and Training laboratory, our measurements do not show resonances in the affected frequency range. Thus, we do not expect negative influences of the PSL pointing on the sensitivity of the gravitational wave detector.

4. Summary and Outlook

In this paper we presented the PSL that was used for aLIGO’s third observation run as well as the PSL that will be used for O4. Both systems are based on solid state amplifiers that showed high reliability and low-noise behavior.
The O3 PSL consisted of an eLIGO front-end together with a neoVAN-4S solid state amplifier. The system delivered an output power of 70 W with a higher order mode content of <6.2%. The output beam was spatially filtered by a bow-tie cavity and frequency and power pre-stabilization were performed. This system worked stably and reliably for the twelve month duration of O3.
The PSL that will be used for O4 consists of an NPRO laser and two neoVAN-4S-HP amplifiers in series. Our test system with this configuration had an output power of 140 W with a higher order mode content of <4.5%. The laser beam will be frequency and power stabilized just like the O3 system, and a new pre-modecleaner will be installed.
Further upgrades of aLIGO and future detectors will most likely require pre-stabilized laser systems with even higher laser power and/or a longer wavelength. One option for more laser power would be to continue to rely on the very stable and reliable neoVAN-4S-HP amplifiers and install them in series with a third amplifier, as described in [20]. Here a three amplifier system with 195 W of output power was presented. Another option would be to use high power fiber amplifier systems, which were shown to work at 200 W and above [22,23,24].

Author Contributions

Conceptualization, N.B.; methodology, P.F., E.G., R.L.S. and B.W.; investigation, N.B., J.B., X.C., M.F. (Maik Frede), M.F. (Michael Fyffe), M.H., P.K., J.L., J.O., A.S.; writing—original draft preparation, N.B.; writing—review and editing, N.B. and B.W. All authors have read and agreed to the published version of the manuscript.

Funding

LIGO was constructed by the California Institute of Technology and Massachusetts Institute of Technology with funding from the National Science Foundation, and operates under cooperative agreement PHY-1764464. aLIGO was built under award PHY-0823459.

Acknowledgments

The authors gratefully acknowledge the support of the United States National Science Foundation (NSF) for the construction and operation of the LIGO Laboratory and Advanced LIGO; and the Science and Technology Facilities Council (STFC) of the United Kingdom and the Max-Planck-Society (MPS) for support of the construction of Advanced LIGO. Additional support for Advanced LIGO was provided by the Australian Research Council. The authors acknowledge the LIGO Scientific Collaboration Fellows program for additional support.

Conflicts of Interest

The authors declare no conflict of interest.

Abbreviations

The following abbreviations are used in this manuscript:
LIGOlaser interferometric gravitational wave observatory
eLIGOenhanced LIGO
aLIGOadvanced LIGO
PSLpre-stabilized laser system
NPROnon-planar ring oscillator
O3observation run three
O4observation run four
DBBdiagnostic breadboard
QPDquadrant photodiode
ASDamplitude spectral density
EOMelectro-optical modulator
AOMacousto-optical modulator
PMCpre-modecleaner
IOinput optics
CDScontrol and design system
HOMhigher order mode
AEIAlbert Einstein Institute
RPNrelative power noise

References

  1. LIGO Scientific Collaboration. Advanced LIGO. Class. Quantum Gravity 2015, 32, 074001. [Google Scholar] [CrossRef]
  2. Fricke, T.T.; Smith-Lefebvre, N.D.; Abbott, R.; Adhikari, R.; Dooley, K.L.; Evans, M.; Fritschel, P.; Frolov, V.V.; Kawabe, K.; Kissel, J.S.; et al. DC readout experiment in Enhanced LIGO. Class. Quantum Gravity 2012, 29, 065005. [Google Scholar] [CrossRef]
  3. Somiya, K.; Chen, Y.; Kawamura, S.; Mio, N. Erratum: Frequency noise and intensity noise of next-generation gravitational-wave detectors with RF/DC readout schemes [Phys. Rev. D73, 122005 (2006)]. Phys. Rev. D 2007, 75. [Google Scholar] [CrossRef] [Green Version]
  4. Põld, J.H. aLIGO Bow-Tie Pre-Modecleaner Document; Technical Report LIGO-T0900616; Albert-Einstein-Institut Hannover: Hannover, Germany, 2012. [Google Scholar]
  5. Mueller, C.L.; Arain, M.A.; Ciani, G.; DeRosa, R.T.; Effler, A.; Feldbaum, D.; Frolov, V.V.; Fulda, P.; Gleason, J.; Heintze, M.; et al. The advanced LIGO input optics. Rev. Sci. Instrum. 2016, 87, 014502. [Google Scholar] [CrossRef] [PubMed] [Green Version]
  6. Kwee, P.; Bogan, C.; Danzmann, K.; Frede, M.; Kim, H.; King, P.; Põld, J.; Puncken, O.; Savage, R.L.; Seifert, F.; et al. Stabilized high-power laser system for the gravitational wave detector advanced LIGO. Opt. Express 2012, 20, 10617. [Google Scholar] [CrossRef] [PubMed] [Green Version]
  7. Thies, F.; Bode, N.; Oppermann, P.; Frede, M.; Schulz, B.; Willke, B. Nd:YVO4 high-power master oscillator power amplifier laser system for second-generation gravitational wave detectors. Opt. Lett. 2019, 44, 719. [Google Scholar] [CrossRef] [PubMed]
  8. Harry, G.M.; the LIGO Scientific Collaboration. Advanced LIGO: The next generation of gravitational wave detectors. Class. Quantum Gravity 2010, 27, 084006. [Google Scholar] [CrossRef]
  9. Winkelmann, L.; Puncken, O.; Kluzik, R.; Veltkamp, C.; Kwee, P.; Poeld, J.; Bogan, C.; Willke, B.; Frede, M.; Neumann, J.; et al. Injection-locked single-frequency laser with an output power of 220 W. Appl. Phys. B 2011, 102, 529–538. [Google Scholar] [CrossRef]
  10. Kane, T.J.; Byer, R.L. Monolithic, unidirectional single-mode Nd:YAG ring laser. Opt. Lett. 1985, 10, 65. [Google Scholar] [CrossRef] [PubMed]
  11. Frede, M.; Schulz, B.; Wilhelm, R.; Kwee, P.; Seifert, F.; Willke, B.; Kracht, D. Fundamental mode, single-frequency laser amplifier for gravitational wave detectors. Opt. Express 2007, 15, 459. [Google Scholar] [CrossRef] [PubMed]
  12. Adhikari, R.; Fritschel, P.; Waldman, S. Enhanced LIGO; Technical Report LIGO-T060156; LIGO Laboratory: Pasadena, CA, USA, 2006. [Google Scholar]
  13. Buikema, A.; Cahillane, C.; Mansell, G.; Blair, C.; Abbott, R.; Adams, C.; Adhikari, R.; Ananyeva, A.; Appert, S.; Arai, K.; et al. Sensitivity and performance of the Advanced LIGO detectors in the third observing run. Phys. Rev. D 2020, 102. [Google Scholar] [CrossRef]
  14. Kwee, P.; Seifert, F.; Willke, B.; Danzmann, K. Laser beam quality and pointing measurement with an optical resonator. Rev. Sci. Instruments 2007, 78, 073103. [Google Scholar] [CrossRef] [PubMed]
  15. Kwee, P.; Willke, B. Automatic laser beam characterization of monolithic Nd:YAG nonplanar ring lasers. Appl. Opt. 2008, 47, 6022. [Google Scholar] [CrossRef] [PubMed] [Green Version]
  16. Morrison, E.; Meers, B.J.; Robertson, D.I.; Ward, H. Automatic alignment of optical interferometers. Appl. Opt. 1994, 33, 5041. [Google Scholar] [CrossRef] [PubMed]
  17. Liu, J.; Savage, R.; King, P.; Zhang, L.; Appert, S. aLIGO All-Bolted PMC; Technical Report LIGO-T1700543; LIGO Laboratory / LSC: Pasadena, CA, USA, 2017. [Google Scholar]
  18. Black, E.D. An introduction to Pound–Drever–Hall laser frequency stabilization. Am. J. Phys. 2001, 69, 79–87. [Google Scholar] [CrossRef] [Green Version]
  19. Bork, R.; Hanks, J.; Barker, D.; Betzwieser, J.; Rollins, J.; Thorne, K.; von Reis, E. Advligorts: The Advanced LIGO Real-Time Digital Control and Data Acquisition System. Available online: https://arxiv.org/abs/2005.00219 (accessed on 4 May 2020).
  20. Bode, N.; Meylahn, F.; Willke, B. Sequential high power laser amplifiers for gravitational wave detection. Opt. Express 2020, 28, 29469–29478. [Google Scholar] [CrossRef] [PubMed]
  21. Abbott, R.S.; King, P.J. Diode-pumped Nd:YAG laser intensity noise suppression using a current shunt. Rev. Sci. Instrum. 2001, 72, 1346. [Google Scholar] [CrossRef]
  22. Wellmann, F.; Steinke, M.; Meylahn, F.; Bode, N.; Willke, B.; Overmeyer, L.; Neumann, J.; Kracht, D. High power, single-frequency, monolithic fiber amplifier for the next generation of gravitational wave detectors. Opt. Express 2019, 27, 28523. [Google Scholar] [CrossRef] [PubMed]
  23. Wellmann, F.; Steinke, M.; Wessels, P.; Bode, N.; Meylahn, F.; Willke, B.; Overmeyer, L.; Neumann, J.; Kracht, D. Performance study of a high-power single-frequency fiber amplifier architecture for gravitational wave detectors. Appl. Opt. 2020, 59, 7945. [Google Scholar] [CrossRef] [PubMed]
  24. Zhao, J.; Guiraud, G.; Pierre, C.; Floissat, F.; Casanova, A.; Hreibi, A.; Chaibi, W.; Traynor, N.; Boullet, J.; Santarelli, G. High-power all-fiber ultra-low noise laser. Appl. Phys. B 2018, 124, 114. [Google Scholar] [CrossRef] [Green Version]
Figure 1. Schematic diagram of the aLIGO O3 pre-stabilized laser system. An eLIGO front-end seeded the neoVAN-4S amplifier delivered an output power of 70 W . The main beam was sent through the PMC and then to the interferometer’s input optics. The two low power output beams from the PMC were used for the frequency and power pre-stabilization stages.
Galaxies 08 00084 g001
Figure 2. (Left) Modescan of the laser beam coming from the front-end. The higher order mode content of the laser beam was <5.7%. (Right) Diagnostic breadboard (DBB) modescan of the laser beam amplified by the neoVAN-4S amplifier. The higher order mode content of the laser beam was <6.2%.
Galaxies 08 00084 g002
Figure 3. Relative power noise (RPN) measurements of the front-end laser beam and the laser beam amplified by the neoVAN-4S amplifier. The RPN is increased by the neoVAN-4S amplifier’s amplification. Measurements at the AEI Hannover showed that this is due to noise added by the pump diode power supplies.
Galaxies 08 00084 g003
Figure 4. Relative pointing measurements of the front-end laser beam and the laser beam amplified by the neoVAN-4S amplifier. The two curves are each representing the mean values of the four lighter curves in the same color that show the measurements of the four alignment degrees of freedom for each laser. The relative pointing noise is not increased by the neoVAN-4S amplifier.
Galaxies 08 00084 g004
Figure 5. The power transmitted by the PMC at the LIGO site in Hanford. The fully operational pre-stabilized laser system (PSL) was available for the whole observation run. The total power decrease over time from 55 W to 52 W was due to alignment and HOM content drifts.
Galaxies 08 00084 g005
Figure 6. Schematic diagram of the aLIGO O4 pre-stabilized laser system. A non-planar ring oscillator laser (NPRO) seeds two sequential neoVAN-4S-HP amplifiers. The pre-stabilization concept is equivalent to the one used in O3.
Galaxies 08 00084 g006
Figure 7. (Left) Modescan of the laser beam amplified by the first neoVAN-4S-HP amplifier. The higher order mode content of the laser beam was <4.2%. (Right) DBB modescan of laser beam amplified by the second neoVAN-4S-HP amplifier. The higher order mode content of the laser beam was <4.5%.
Galaxies 08 00084 g007
Figure 8. RPN measurements of the beam amplified by the first and second neoVAN-4S-HP amplifier, respectively.
Galaxies 08 00084 g008
Figure 9. Frequency noise measurements of the beam amplified by the first and second neoVAN-4S-HP amplifier, respectively. Both curves are very close to each other and to the typical NPRO behavior, as expected.
Galaxies 08 00084 g009
Figure 10. Relative beam pointing noise measurements of the beam amplified by the first and second neoVAN-4S-HP amplifier, respectively.
Galaxies 08 00084 g010
Publisher’s Note: MDPI stays neutral with regard to jurisdictional claims in published maps and institutional affiliations.

