Article

Radio Galaxy Classification: #Tags, Not Boxes

Minnesota Institute for Astrophysics, University of Minnesota, 116 Church St., Minneapolis, MN 55455, USA
Galaxies 2021, 9(4), 85; https://doi.org/10.3390/galaxies9040085
Submission received: 28 September 2021 / Revised: 23 October 2021 / Accepted: 26 October 2021 / Published: 29 October 2021

Abstract

:
After six decades of studying radio galaxies, we are now delightfully overwhelmed by their exponentially expanding numbers and the complexity of their structures. Similarly, the methods we use to classify radio galaxies have exploded, often resulting in conflicting terminology, ambiguous classifications, and historical schemes that may or may not match our current physical understanding. After discussions with more than 100 radio astronomers over the last several years and listening to their ideas and aspirations, I propose that we reconceptualize the classification of radio galaxies. Instead of trying to place them into “boxes”, we should assign them #tags, a system that is easy to understand and apply, that is flexible and evolving, and that can accommodate conflicting ideas with respect to what is relevant and important. Here, I outline the basis of such a #tag system; the rest is up to the community.

1. Introduction

Why do we classify radio galaxies, or any objects for that matter? I observe three main benefits to classification in general:
  • Communication: For such purposes, we have a language to describe what objects we are interested in, “I’m investigating one-sided jets”.
  • Investigation: For such purposes, we can define samples for study, e.g., to look for correlated variables, “I’m studying whether one-sided jets appear more frequently in variable core sources”.
  • Interpretation: For such purposes, we can develop physical models to explain observed phenomena, “I’m working on how relativistic beaming can determine whether jets would appear one- or two-sided”.
The challenges inherent in our classification system are well-known, but they are difficult to avoid. Different people often mean different things but use the same term—could we find a group of astronomers to decide on what a dying radio galaxy is? Often, objects do not fit nicely into the boxes we have defined—ADS lists 230 articles with “hybrid,” “radio,” and “galaxy” in their abstracts. In a remote talk for the 2019 3Csky conference in Turin, Bernie Fanaroff (of FR reknown) lamented “[recently] I worked on a sample of sources. I couldn’t classify them. They were too ambiguous and irregular [due to limited sensitivity and dynamic range]”. In other cases, we group together objects with very different physical origins (e.g., the broad variety of “X-shaped” radio galaxies), confounding studies that look for correlations and or that develop physical models, etc.
Where are we today? Table 1 summarizes many of the classes of sources in the current literature. Some of these classes are exclusive, i.e., a source can be one or the other, e.g., either “flat” or “steep” spectrum and either “S-shaped” or “C-shaped”, but not both. Other classes can be combined, e.g., a source can be in both the FRI and narrow-angle tail classes. These multiple uses and the lack of a clear definition for many of the classes can result in confusion and, worse, can result in scientifically inconsistent results from different studies. Other measured quantities, such as polarization information as a function of wavelength or X-ray counterparts, add additional layers of complexity.
Over the past several years, I have led discussions and surveys on these issues with over 100 members of the radio astronomy community at meetings and workshops; I acknowledge, without mentioning names, the many people who contributed fertile ideas. Several lessons became clear, and they are outlined as follows:
  • The current classification schemes are confusing and have started to break down.
  • As a community, we want to document a very wide variety of characteristics for large samples of radio sources. Some of the more commonly mentioned ones (at least today) are listed in Table 2.
  • Multi-wavelength information should be included where available.
  • Confidence levels should be provided.
  • Classifications should evolve as more information becomes available.
  • The criteria for classification should be completely transparent.
In the face of these challenges and aspirations, we are fortunately at a time of great opportunity since new catalogs with millions of radio components are being or will be produced by LOFAR, EMU, and POSSUM at ASKAP, MeerKAT, and VLASS at the VLA, Apertif at Westerbork, μ GMRT, GLEAM at the MWA, etc. If new classification schemes can be incorporated into these catalogs, then their scientific usefulness will blossom.

2. #Tags

To take advantage of these opportunities, I propose that instead of placing a source into a box so that it belongs in that box and not in other boxes, we use a series of criteria-based #tags. Each source can have any number of #tags as long as the source passes the criteria for each #tag.
This system forces a subtle but important distinction in how we think about these classes—instead of deciding that “Source A IS a member of Class X”, we say more narrowly that, “In Survey G, Source A passes the test to be assigned #X.” Although this may seem trivial, it provides enormous advantages. For example, we will no longer need to argue about whether a source detected in a high-resolution survey is really a small one-sided jet; if it passes the criteria, it will be assigned #one-sided-jet. Then, if a new low frequency survey shows that it is part of a much larger structure, with two jets and extended lobes visible, then the new survey will assign it a different #tag, particular to that survey. #Tags are, thus, explicitly dependent on the properties of the observations/survey that were used to make the assignment.
Figure 1 provides a further example of this re-conceptualization. It shows two views of the prototypical narrow-angle-tail source NGC 1265. Such tails, when observed near AGN at high resolution, will always appear as wide-angle-tails (WATs). If we follow the criteria in the defining paper for WATs (Owen & Rudnick [2]), the “source” on the left would be classified as #WAT. This is not a mistake—if we follow the #tag schema, it simply means that it has passed the relevant test. A theorist, e.g., may well want to select it as part of a sample of #WATs, to model the properties of the gently bent portion of jets. On the other hand, an observer studying ICM interactions might want to exlcude this #WAT based on other catalog entries, e.g., because its small linear size shows that it is still being influenced by its host’s ISM.

2.1. #Tag Principles

The following summarizes the principles and characteristics of #tag systems that are required to meet the scientific needs expressed in our discussions. These are likely to need refinement once such systems are put to use:
  • #Tags as proposed here apply to sources, where all emissions are believed to originate in a single host, whether it is visible or not. #Tags currently do not apply to the source’s constituent components, as identified by “source” finders, although such schemes could also be developed.
  • Each source can have multiple #tags.
  • A source can pass or fail meeting the criteria of each #tag or it can have insufficient information to be tested. For example, a barely resolved double source cannot be tested for the number of jets present.
  • There can be multiple versions of #tags for the same purpose, with different underlying criteria. For example, #Giant A might include bent sources, where the sum of the length of the two lobes was >700 kpc, while #Giant B might only include sources that cannot fit in a 700 kpc box.
  • #Tags must be based on well-defined criteria that are quantitative wherever possible, with the definitions or algorithms made available.
  • #Tags can change with time as more information or better algorithms become available. (Keeping track of versions will become important.)
  • #Tags should have corresponding confidence values if possible.
  • #Tags will be specific to a given survey since they will depend on resolution, sensitivity, dynamic range, availability of auxiliary information, etc.
  • #Tags can be valuable even when they appear trivial. For example, although sizes and errors may be included in a catalog, the distinction between extended and compact sources may need expert judgement and be embodied in the #tag. The experts would consider the dependencies on signal:noise, dynamic range, the presence of artifacts, etc., in setting up #tag criteria.

2.2. Tag Example

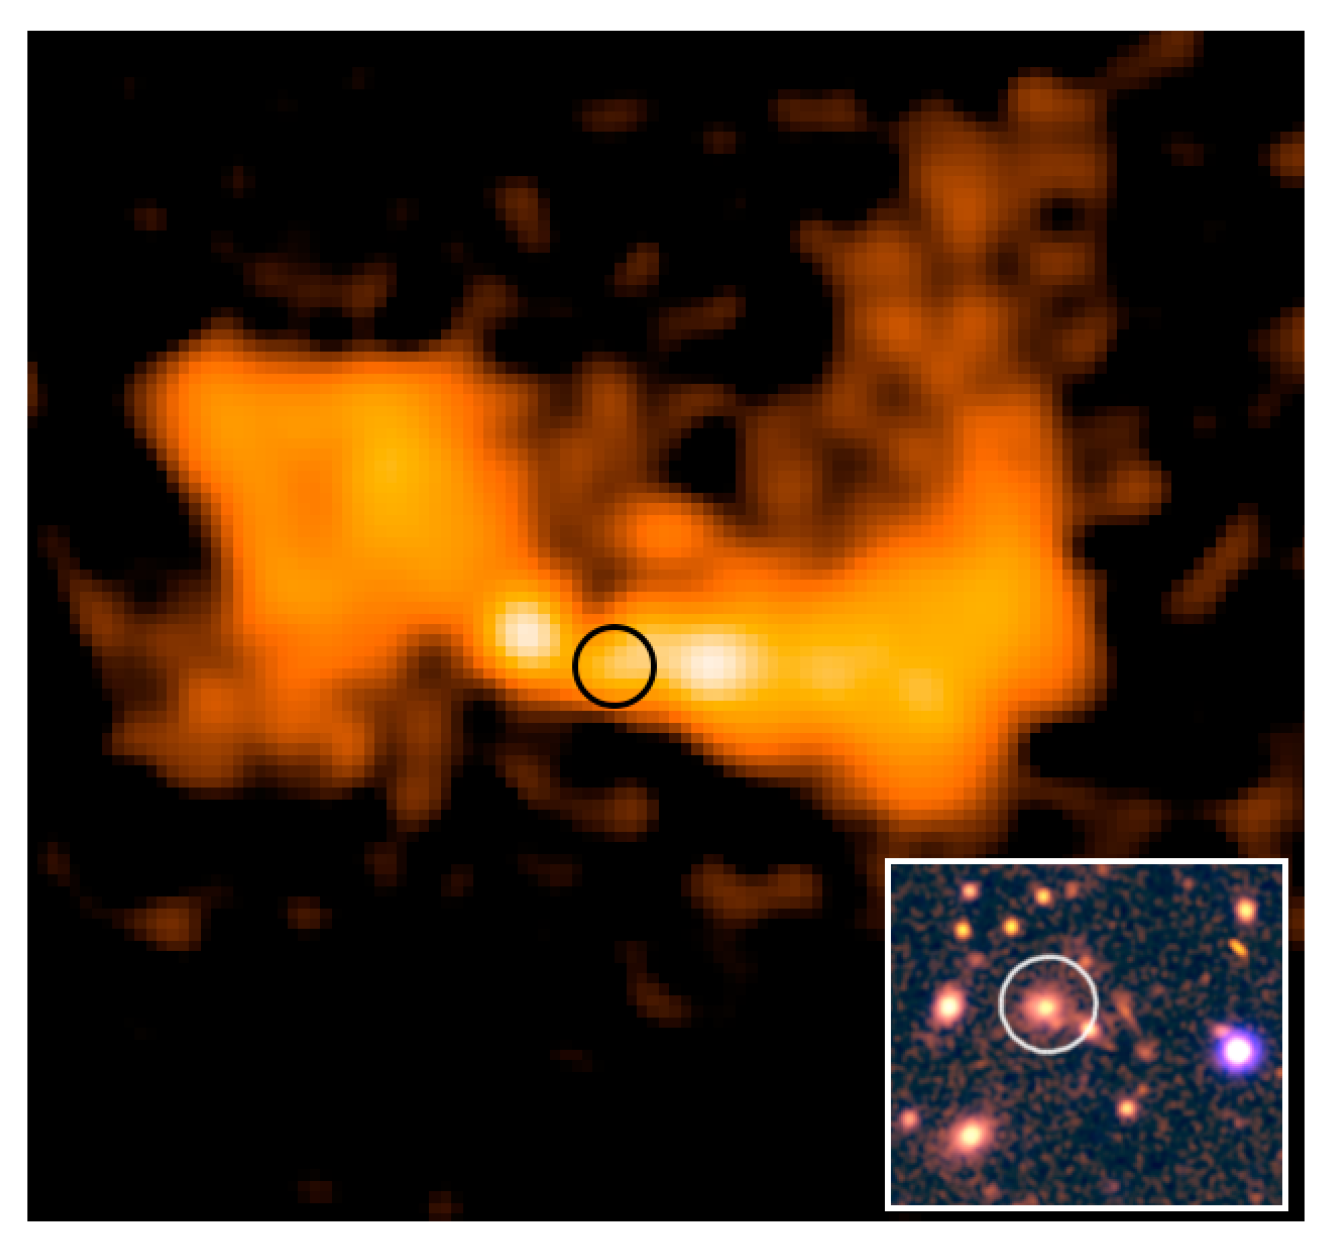
Table 3 illustrates the application of #tags to an anonymous source from the MeerKAT Galaxy Cluster Legacy Survey (Knowles et al. [4]). Only a handful of #tags are shown; each catalog may use as many #tags as are appropriate or practical. Note that there will be many other catalog entries for this source. These would include positions, fluxes, etc., as listed in Table 1 and would be used as criteria for each #tag. The assumption, for this illustration, is that in-band spectral indices are available, as well as the optical host, but not its redshift.
Careful readers will note two unfamiliar #tags, #EMK:Backflow and #EMK:Outflow. I introduce them here as an example of how individuals can add #tags that they consider as important without affecting earlier alternative #tags. In this case, the new #tags are alternatives to the FRI,II scheme, and are likely to be much more scientifically informative. #EMK:Backflow denotes sources with spectral indices that steepen from their leading edge back to the nucleus; #EMK:Outflow sources have spectral indices that steepen with increasing distance from the nucleus. These represent two physically different jet behaviors, and the FRI,II scheme can be understood as a less precise proxy for these behaviors. The disadvantage of these new #tags is that they can be applied only to sources that are sufficiently large and bright; but since they only add information, nothing is lost. Another technical detail is that spectral changes due to magnetic field variations on a curved electron spectrum would have to be considered in applying this criterion in order to isolate the effects of radiative ageing.

2.3. Implementation of #Tags

Although individual investigators could and should develop their own #tags to address questions of scientific interest, the most beneficial use of #tags will come from observatory or survey teams that incorporate them into catalogs. The EMU Survey has begun such a process in the design of EMUcat, with many of the details still being worked out. The following are some notes and guidelines that may be useful in implementing such a scheme. As mentioned before, these will certainly need to be revisited as the community acquires experience with this new classification tool:
  • For a source-based #tag scheme, the components from source-finders will first have to be assembled into sources, with or without host identification.
  • Each #tag will require measurements or other data about the source that are already included in the catalog. Early identification of #tags to be used will ensure that the required information is available.
  • While some #tags will be based on catalog data, other #tags will require algorithms to be run on images (e.g., symmetries, jet presence, or dominance)
  • Some #tags will require information from auxiliary databases not included with the catalog; links or other references with respect to that information are needed.
  • All criteria and algorithms should be made publicly available either as metadata or in software repositories, etc.
  • Different surveys will require different schemes; however, wherever common definitions can be used, those will be highly desirable.
  • It is desirable to allow for new #tags developed by individuals and teams to be added to the catalog after appropriate vetting by the survey team.
  • Versioning of #tags will have to be built into the catalog design.
One quite promising opportunity and challenge to a strict algorithmic approach is to incorporate classifications that are performed by visual inspection, such as Radio Galaxy Zoo (Banfield et al. [5]) or LOFAR Galazy Zoo (Williams et al. [6]) and their planned successors. The use of MaNGA morphologies from Galaxy Zoo for SDSS entries (Krawczyk et al. [7]), where available, may provide guidance on how to include non-quantitative #tags. Similarly, classifications from supervised and unsupervised machine learning algorithms will become available over the next several years, and the community will have to determine how to best utilize these classifications. One innovative effort using machine learning to build on a #tag-like schema has now been used in the classification of supernova spectra (Davison, Parkinson, Tucker [8]).

3. Conclusions

The mammoth-sized new catalogs and increasingly sophisticated scientific questions being asked about radio galaxies demand a new approach with respect to radio galaxy classification. #Tags provide a promising alternative.

Funding

This work was supported, in part, by U.S. National Science Foundation, grant AST17-14205, to the University of Minnesota.

Institutional Review Board Statement

Not applicable.

Informed Consent Statement

Not applicable.

Data Availability Statement

Not applicable.

Acknowledgments

Although I have been interested in this issue for many years, I credit Ray Norris for “recruiting” me to take on this task because of the demands imposed by the EMU Survey. The advice of many colleagues over the last several years has been of immeasurable value. The questions surrounding implementation have benefited enormously by the work of Josh Marvil and his EMUcat team.

Conflicts of Interest

The author declares no conflict of interest.

References

  1. Hardcastle, M.; Croston, J. Radio galaxies and feedback from AGN jets. New Astron. Rev. 2020, 88, 101539. [Google Scholar] [CrossRef]
  2. Owen, F.; Rudnick, L. Radio sources with wide-angle tails in Abell clusters of galaxies. Astrophys. J. 1976, 205, L1–L4. [Google Scholar] [CrossRef]
  3. Gendron-Marsolais, M.; Hlavacek-Larrondo, J.; van Weeren, R.J.; Rudnick, L.; Clarke, T.E.; Sebastian, B.; Mroczkowski, T.; Fabian, A.C.; Blundell, K.M.; Sheldahl, E.; et al. High-resolution VLA low radio frequency observations of the Perseus cluster: Radio lobes, mini-halo, and bent-jet radio galaxies. Mon. Not. R. Astron. Soc. 2020, 499, 5791–5805. [Google Scholar]
  4. Knowles, K.; Cotton, W.; Rudnick, L.; Camilo, F.; Goedhart, S.; Deane, R.; Ramatsoku, M.; Bietenholz, M.; Brüggen, M.; Button, C. The MeerKAT Galaxy Cluster Legacy Survey. Astron. Astrophys. 2021. accepted. [Google Scholar]
  5. Banfield, J.K.; Wong, O.I.; Willett, K.W.; Norris, R.P.; Rudnick, L.; Shabala, S.S.; Simmons, B.D.; Snyder, C.; Garon, A.; Seymour, N.; et al. Radio Galaxy Zoo: Host galaxies and radio morphologies derived from visual inspection. Mon. Not. R. Astron. Soc. 2015, 453, 2326–2340. [Google Scholar] [CrossRef] [Green Version]
  6. Williams, W.L.; Hardcastle, M.J.; Best, P.N.; Sabater, J.; Croston, J.H.; Duncan, K.J.; Shimwell, T.W.; Röttgering, H.J.A.; Nisbet, D.; Gürkan, G.; et al. The LOFAR Two-metre Sky Survey. III. First data release: Optical/infrared identifications and value-added catalogue. Astron. Astrophys. 2019, 622, A2. [Google Scholar] [CrossRef] [Green Version]
  7. Krawczyk, C.; Masters, K.; Lingard, T.; Smethurst, B.; Kruk, S.; Lintott, C.; and Many More from Galaxy Zoo Team. MaNGA Morphologies from Galaxy Zoo. Available online: https://www.sdss.org/dr16/data_access/value-added-catalogs/?vac_id=manga-morphologies-from-galaxy-zoo (accessed on 1 October 2021).
  8. Davison, W.; Parkinson, D.; Tucker, B.E. STag: Supernova Tagging and Classification. arXiv 2021, arXiv:2108.10497. [Google Scholar]
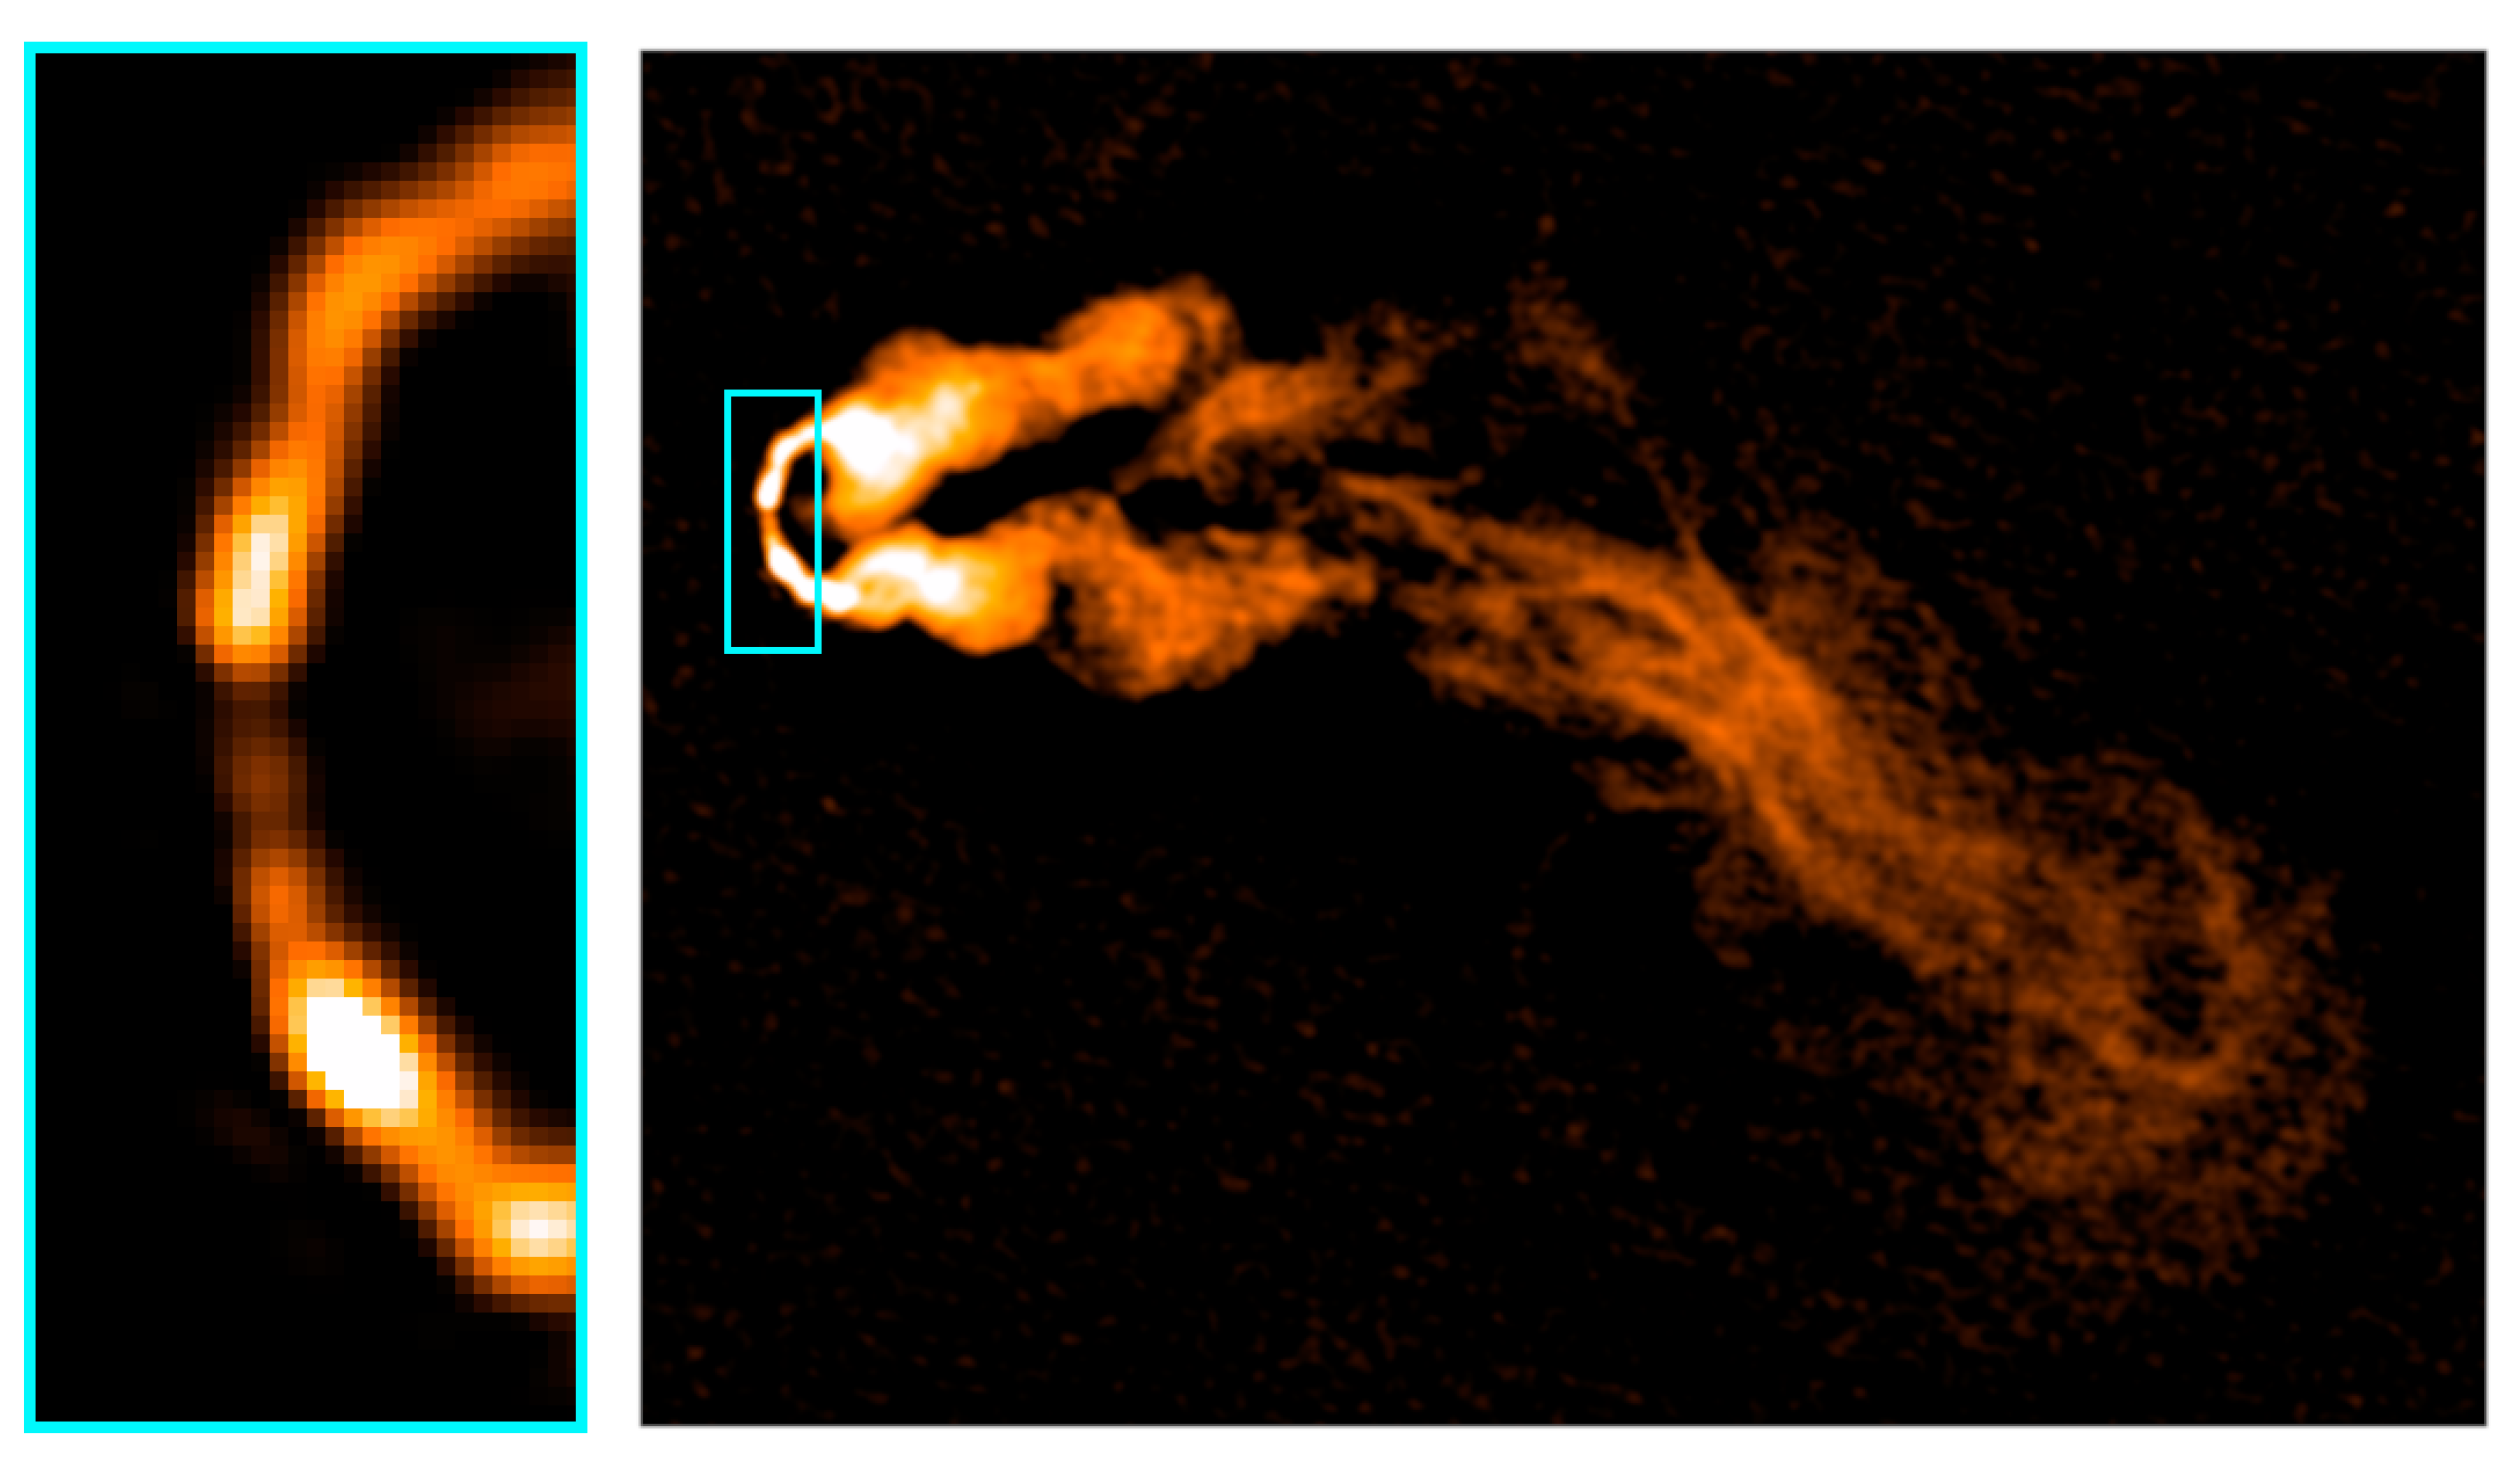
Figure 1. Is this not a WAT? Illustrative new images using the VLA data presented in Gendron-Marsolais et al. [3]: (Left) close-up view of the head of NGC 1265; (Right) larger scale view of the same source.
Galaxies 09 00085 g001
Figure 2. Anonymous example source from the (fictitious) EMK Survey for the application of #tags. Radio map is actually from the MeerKAT Galaxy Cluster Legacy Survey Knowles et al. [4]. Optical inset is from the Dark Energy Survey.
Galaxies 09 00085 g002
Table 1. Examples of radio galaxy classifications in current use.
CategoryClasses
MorphologyDouble; Classical double; Triple; Narrow-angle tail; Wide-angle tail;
Bent-tail; FRI, FRII, FR0 *; Hybrid; X-shaped;
S-shaped; C-shaped; Relaxed; Dying RG; Double-double;
Core-dominant; Core-halo; Core-jet; CSO; 1-sided
SizeCompact (pc); Galactic (<10 kpc); extended RG (10–1000 kpc);
Giant RG (>1 Mpc)
HostRadio Galaxy; SFG: Spiral; Seyfert I,II; QSO; Blazar
BLLac; BLRG; NLRG; ULIRG; LERG;
HERG; LINER; BCG
SpectraFlat; Steep; Ultra-steep; GigaHz Peaked;
Inverted; Convex; Concave; Complex
* This unfortunate nomenclature is now being more widely adopted and should by dropped; see the critique in Hardcastle and Croston [1].
Table 2. Commonly mentioned priorities for catalog source descriptions. These assume that components have been assembled into sources. Some require information external to the survey.
CategoryMeasurements/Descriptors
DirectPeak and total flux; Brightness temperature;
Angular size and area; Linear Size and area;
Redshift; Spectral index; Fractional polarization; RM;
Number of components/peaks in source
StructuralCore/total flux; Number of jets (0, 1, 2); Jet-flux/total-flux;
Peak-separation/total-extent (FRI,II); Shape (e.g., linear, bent);
Symmetry (S-, C-, X-)
SupplementalHost properties (include SFR); X-ray properties;
pc-scale structure; group or cluster environment
Table 3. #Tag example for source in Figure 2. +1 = satisfied #tag criteria. −1 = failed #tag criteria. 0 = insufficient information to test #tag criteria. Each #tag is prepended by EMK to identify it with the (fictitious) EMK survey.
#TagValue#TagValue
Structural Spectral+
#EMK:S-symmetry+1#EMK:SteepSpec+1
#EMK:C-symmetry−1#EMK::ConvexSpec0
#EMK:FRI (peaksep/tot < 0.5)+1#EMK:Backflow−1
#EMK:FRII (peaksep/tot > 0.5)−1#EMK:Outflow+1
#EMK:Coredom−1#EMK:Polarized0
#EMK:Giant0#EMK:BCG0
Publisher’s Note: MDPI stays neutral with regard to jurisdictional claims in published maps and institutional affiliations.