A Fully Coupled Tribocorrosion Simulation Method for Anchor Chain Considering Mechano-Electrochemical Interaction


Abstract
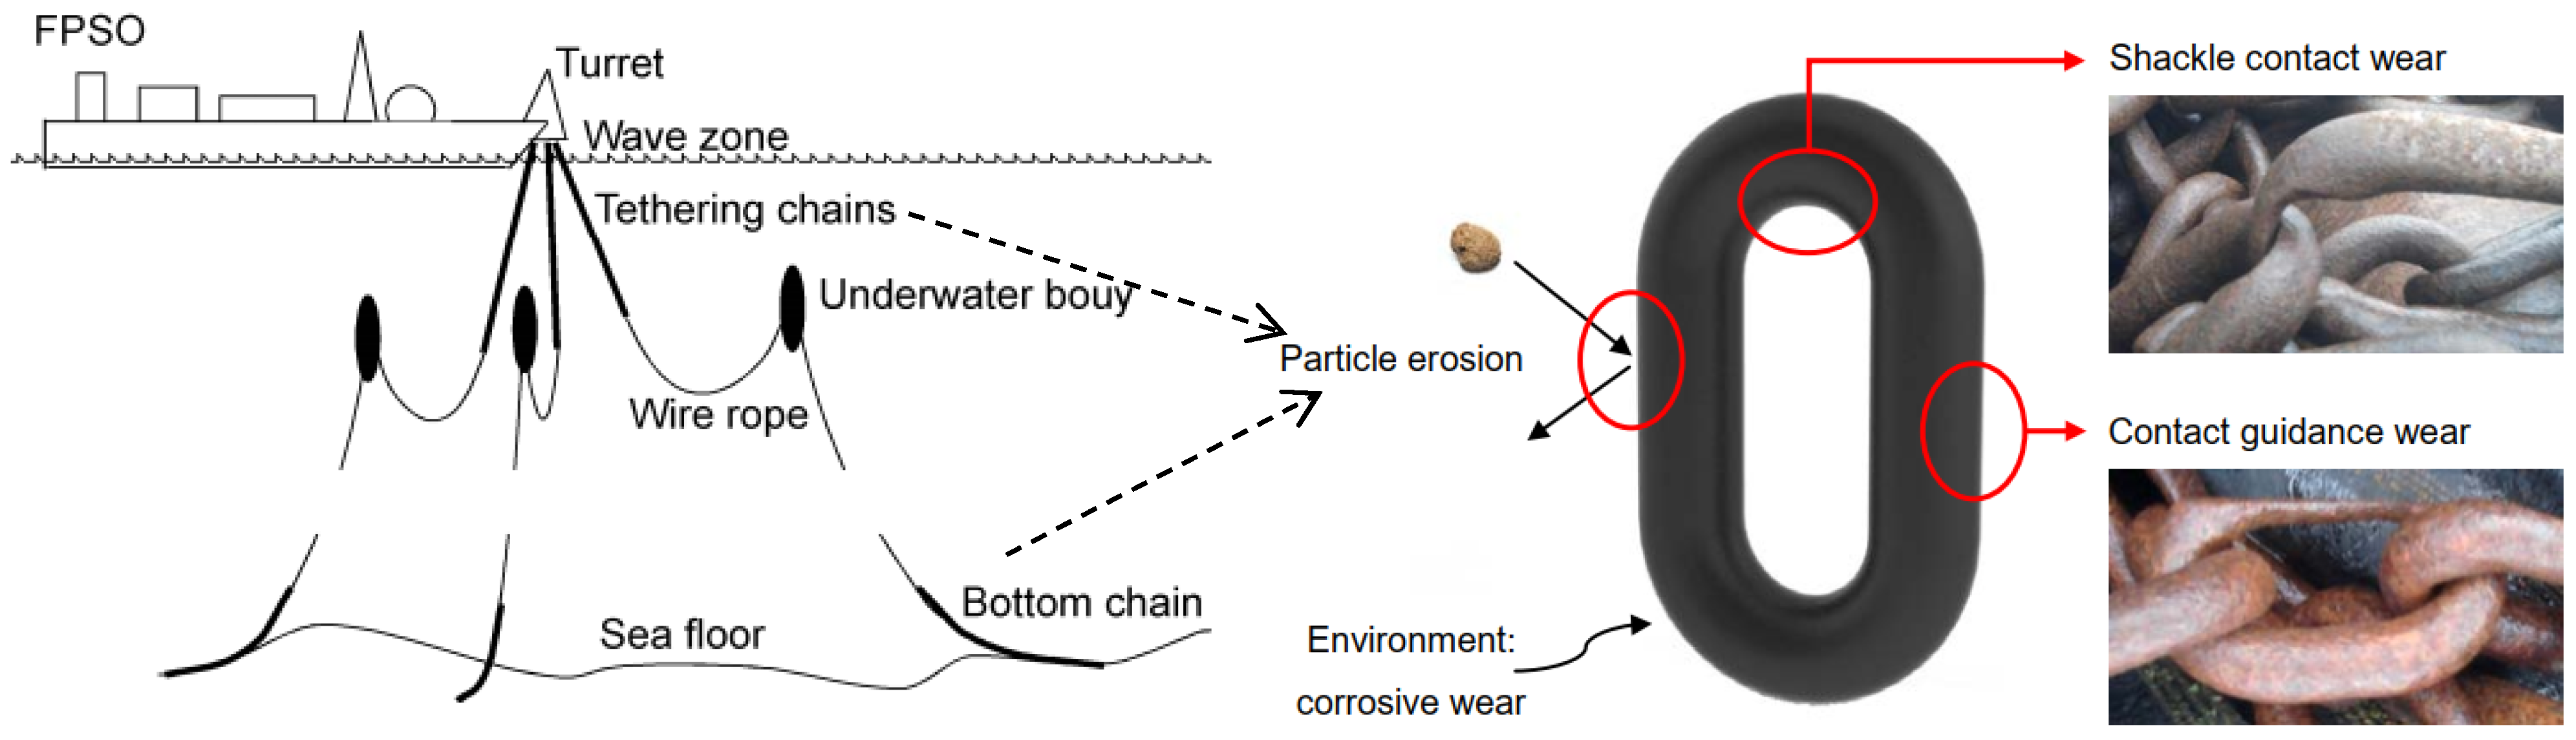
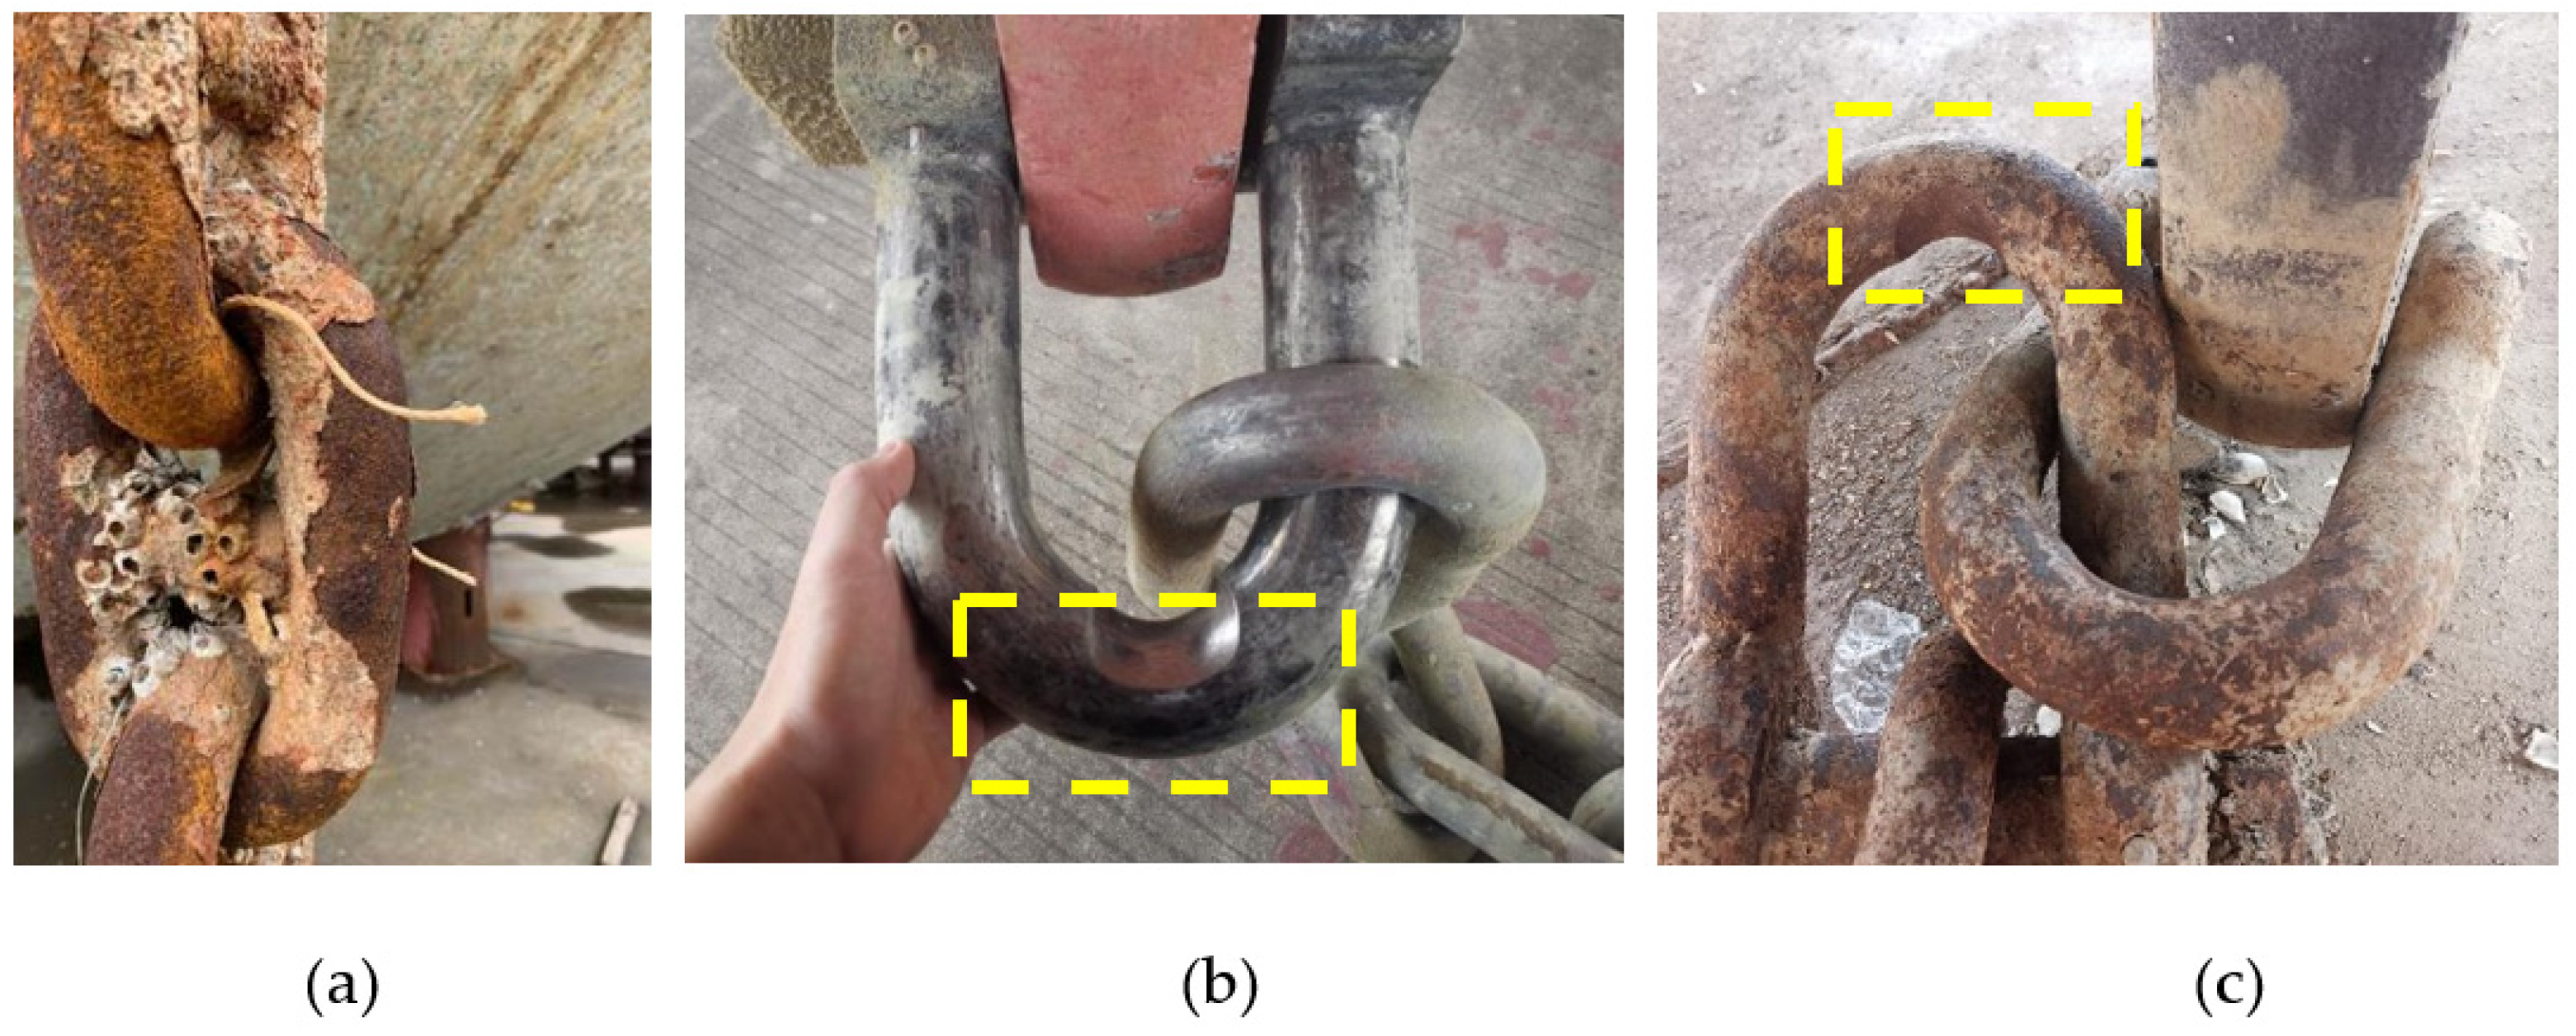
:1. Introduction
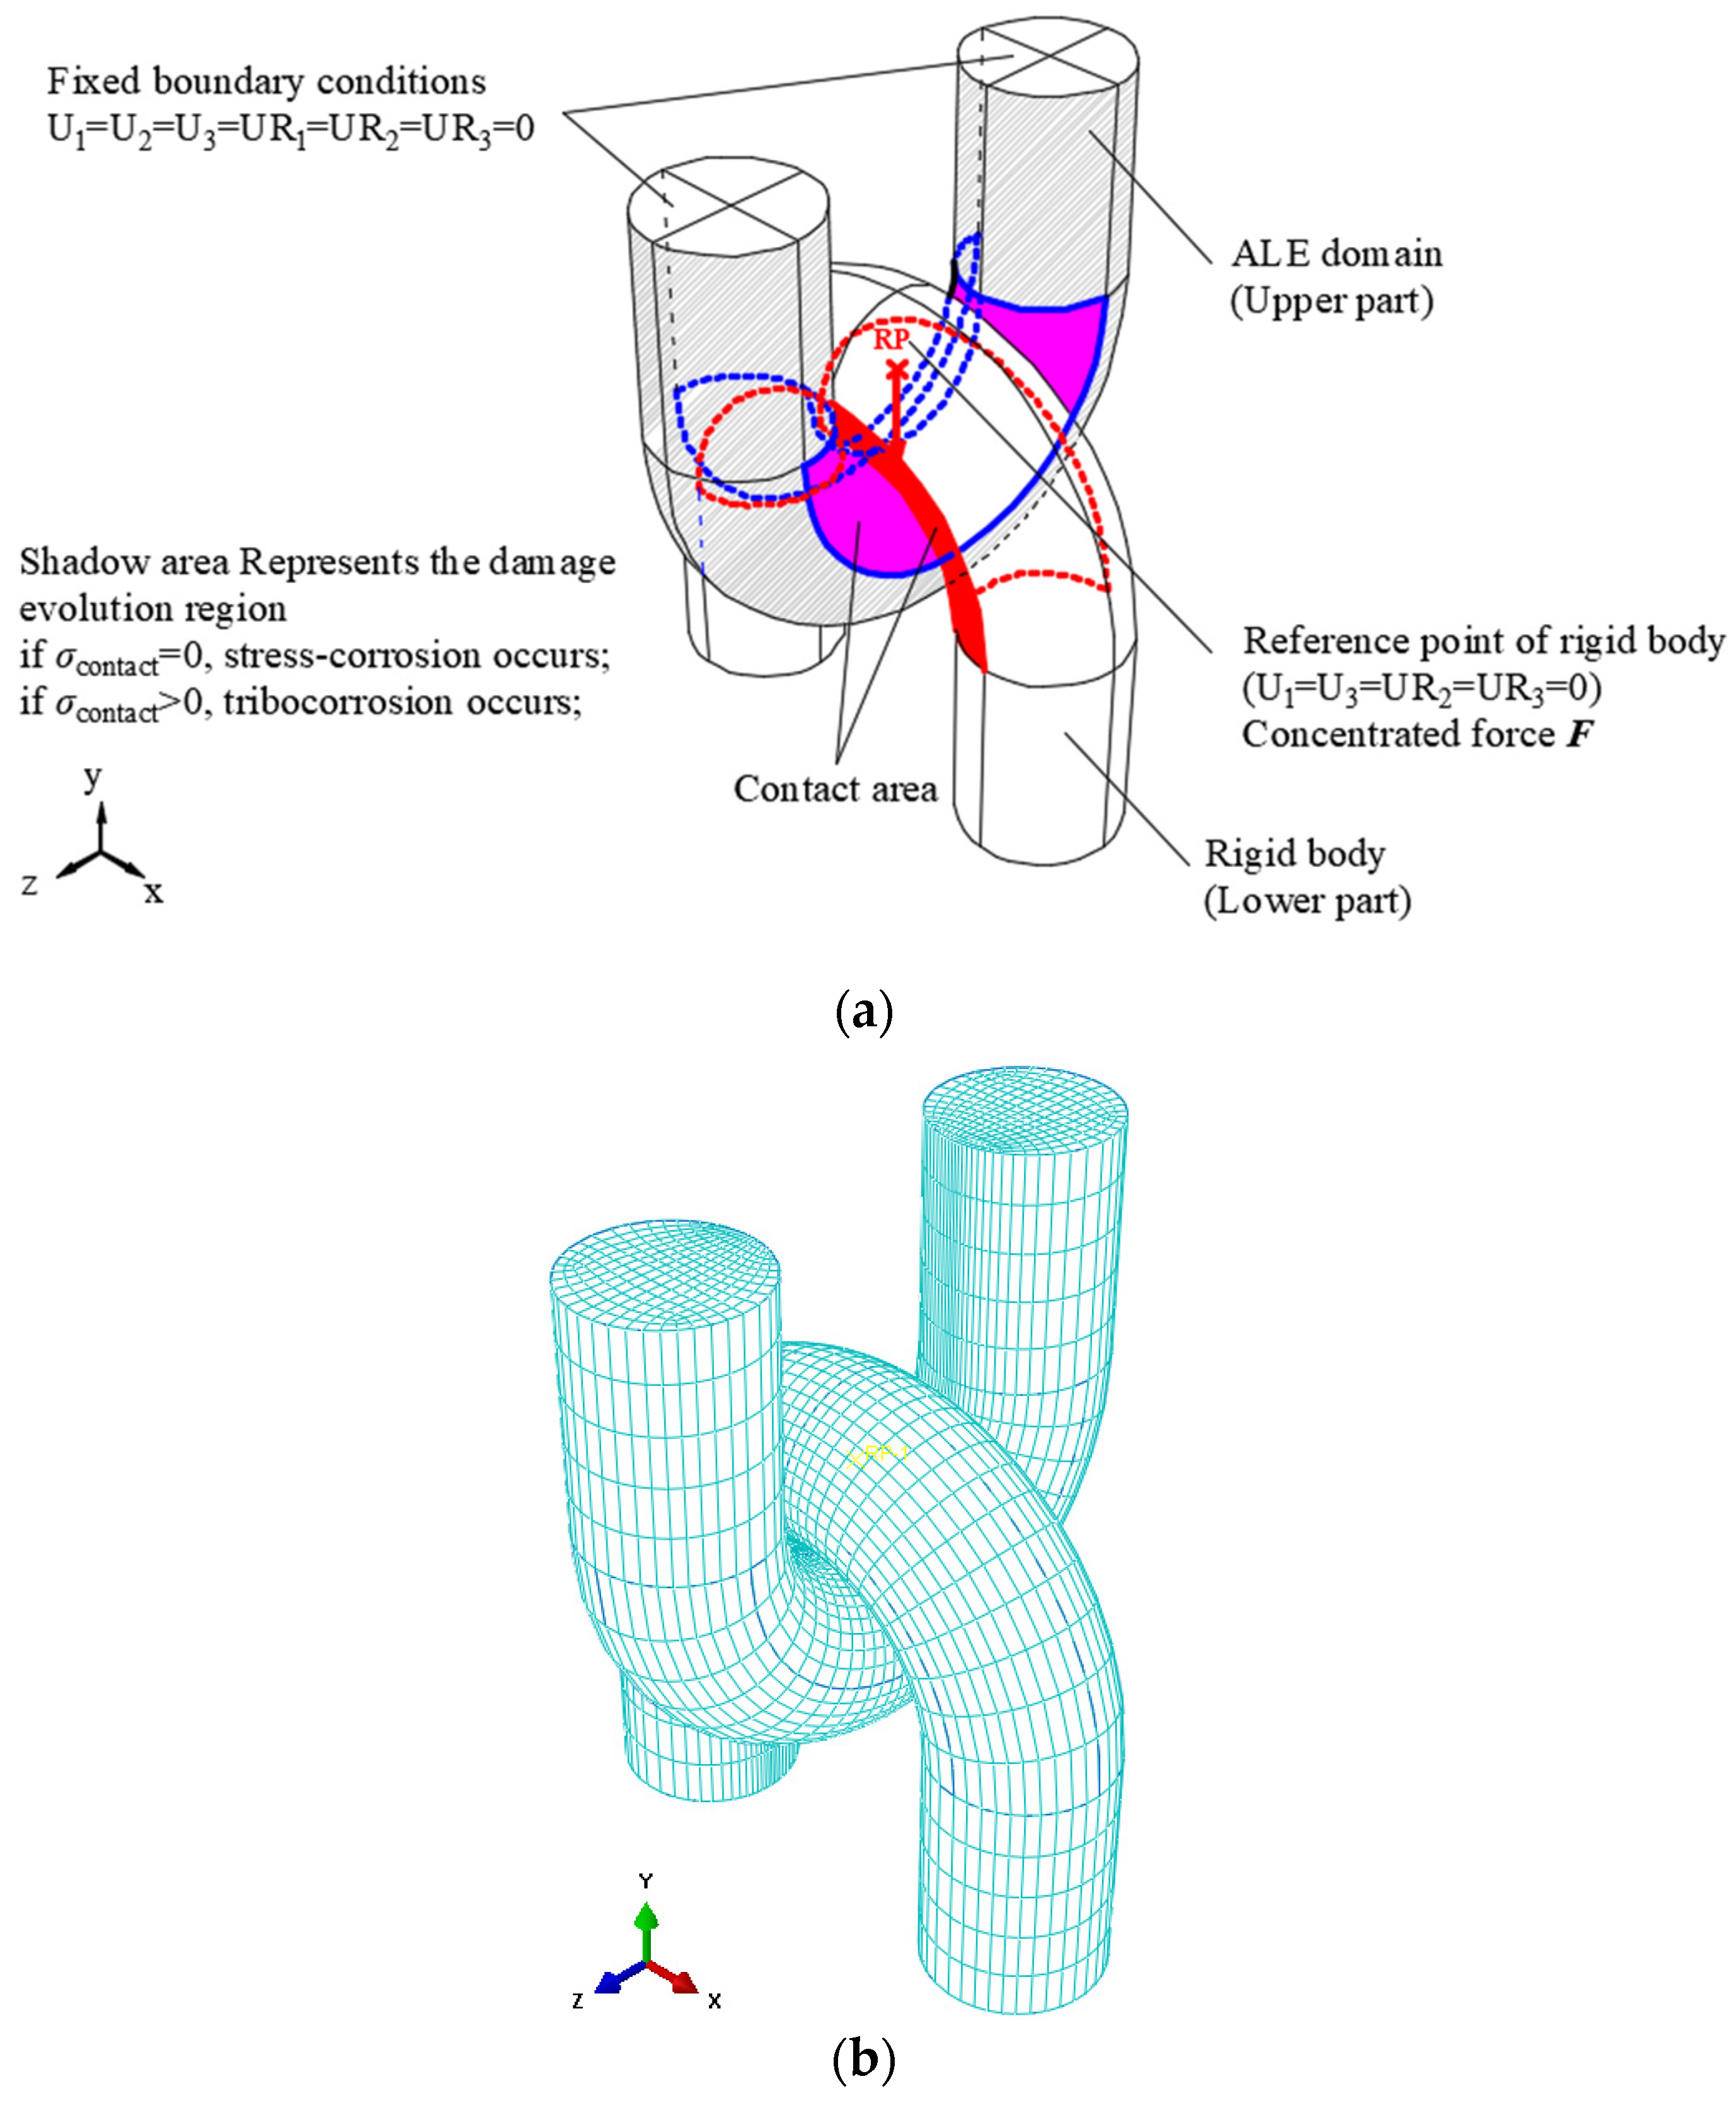
2. Numerical Model and Simulation Scheme
2.1. Material Parameters
2.2. Stress-Corrosion Evolution Model
2.3. Wear and Corrosion Accelerated Wear Model
2.4. Linear Damage Accumulation Rules Considering Mechano-Electrochemical Interaction
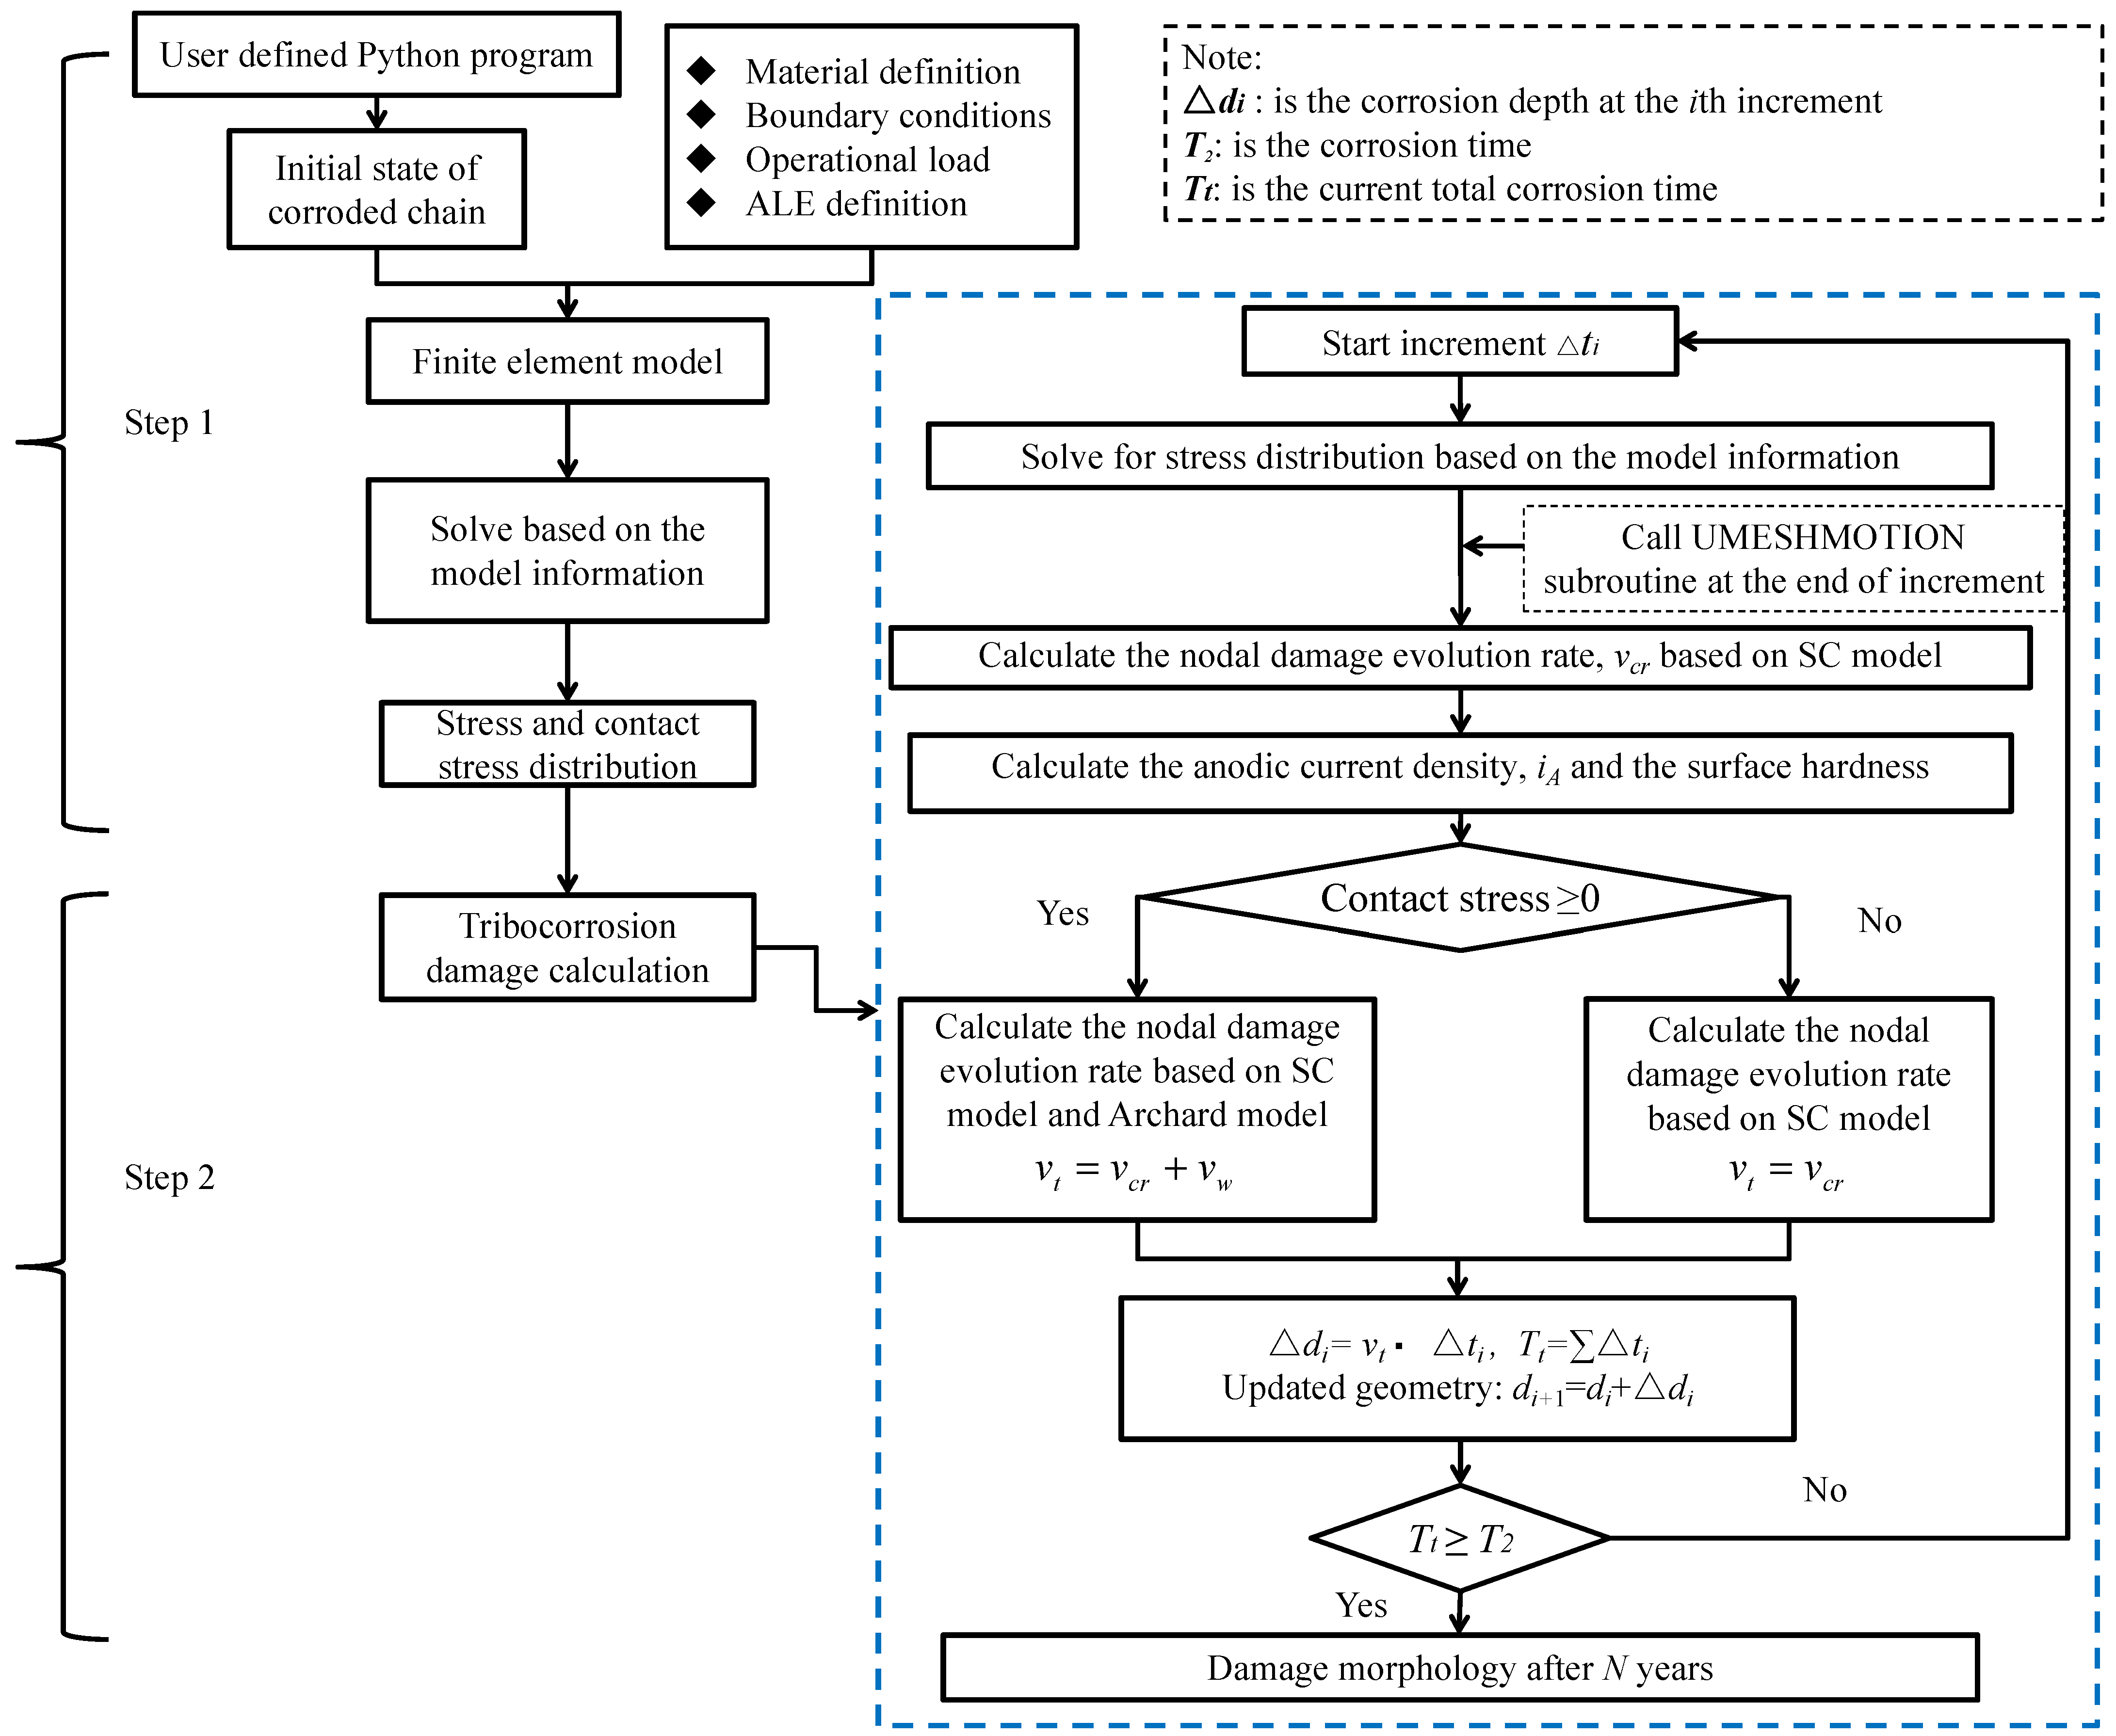
2.5. UMESHMOTION Subroutine Realization
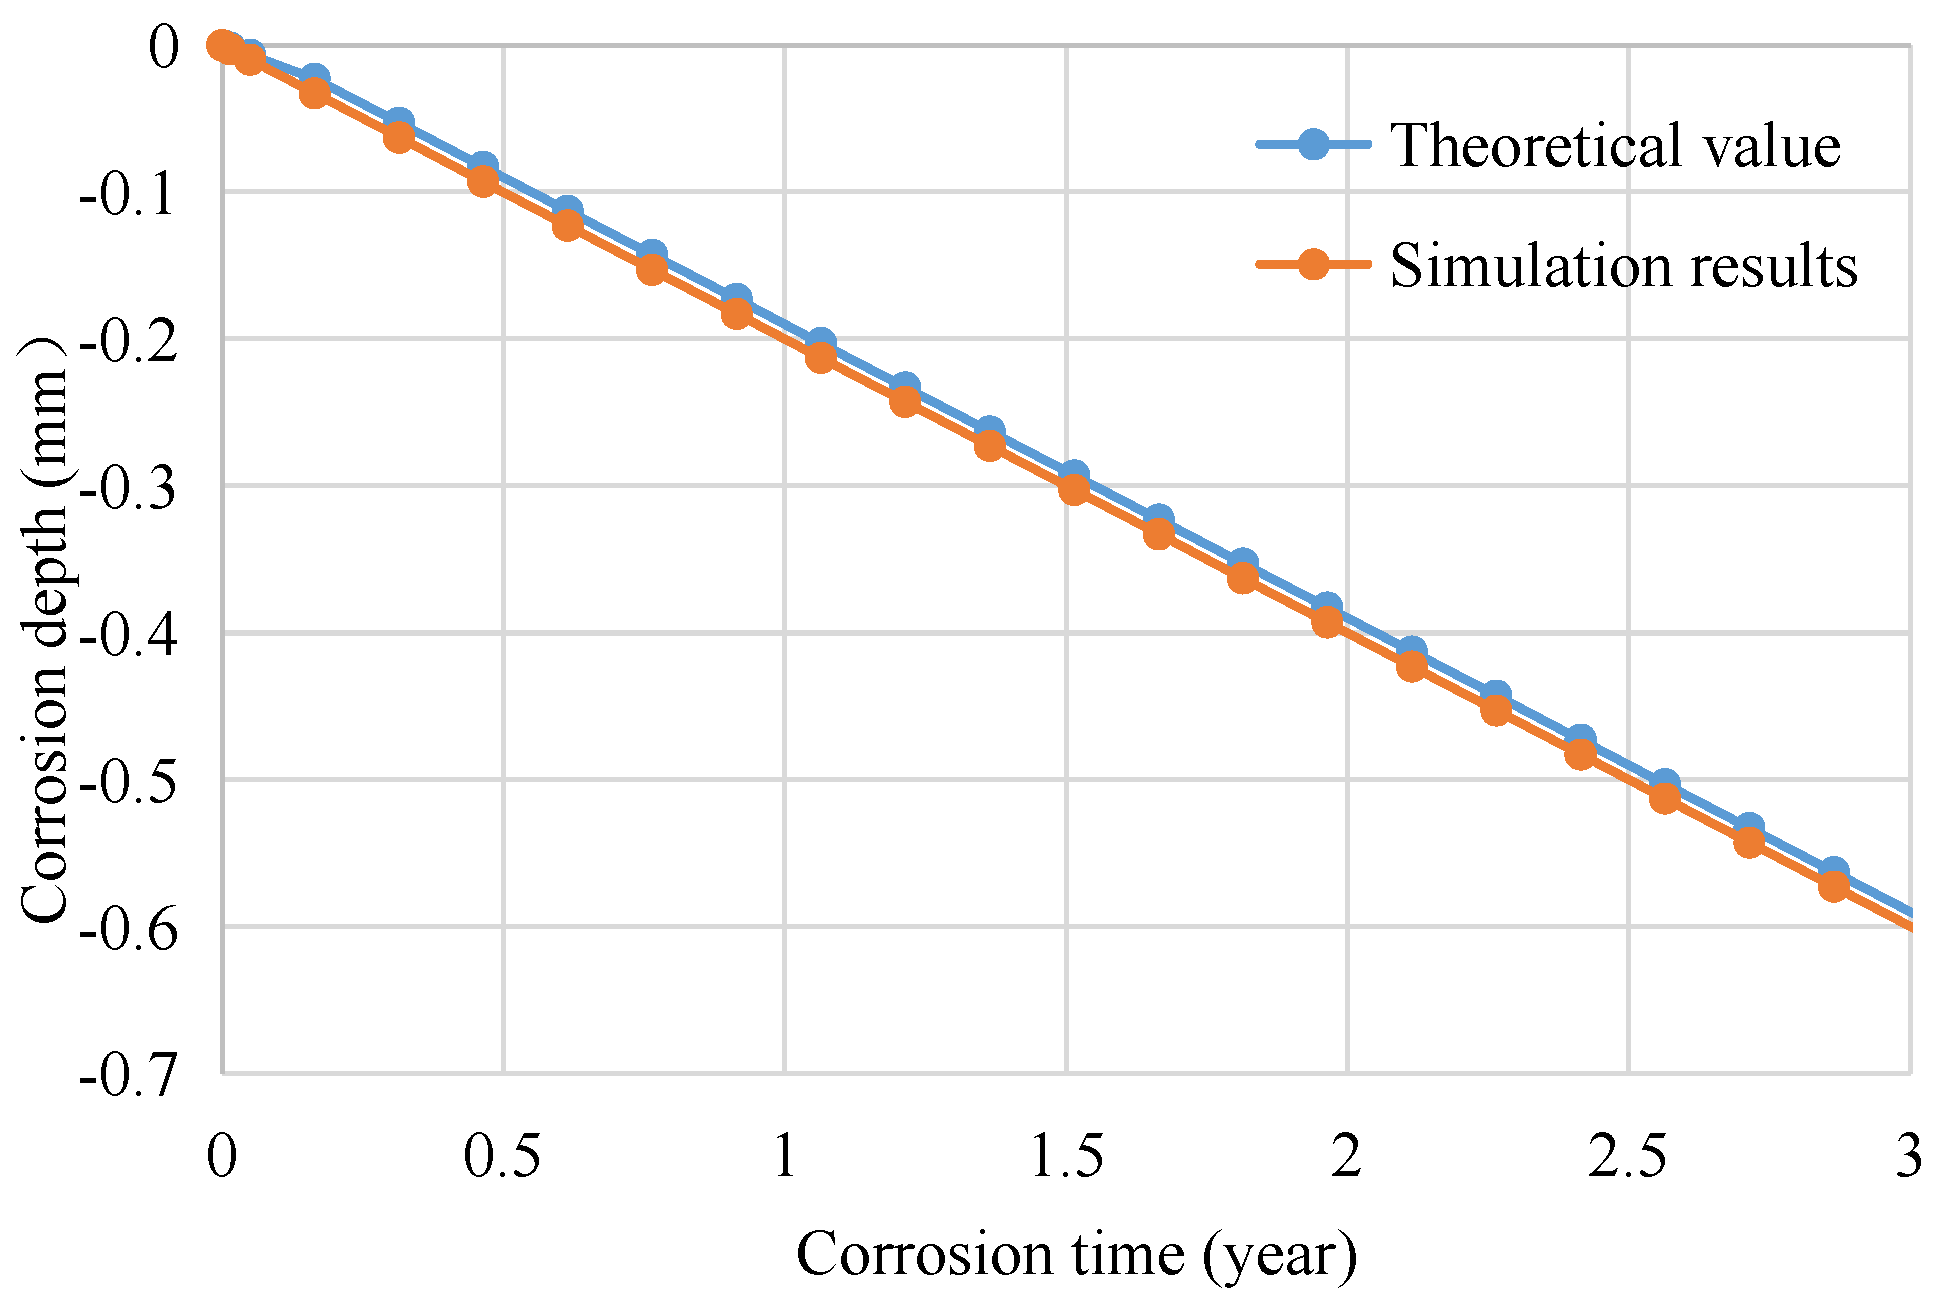
3. Model Validation
4. Results and Discussion
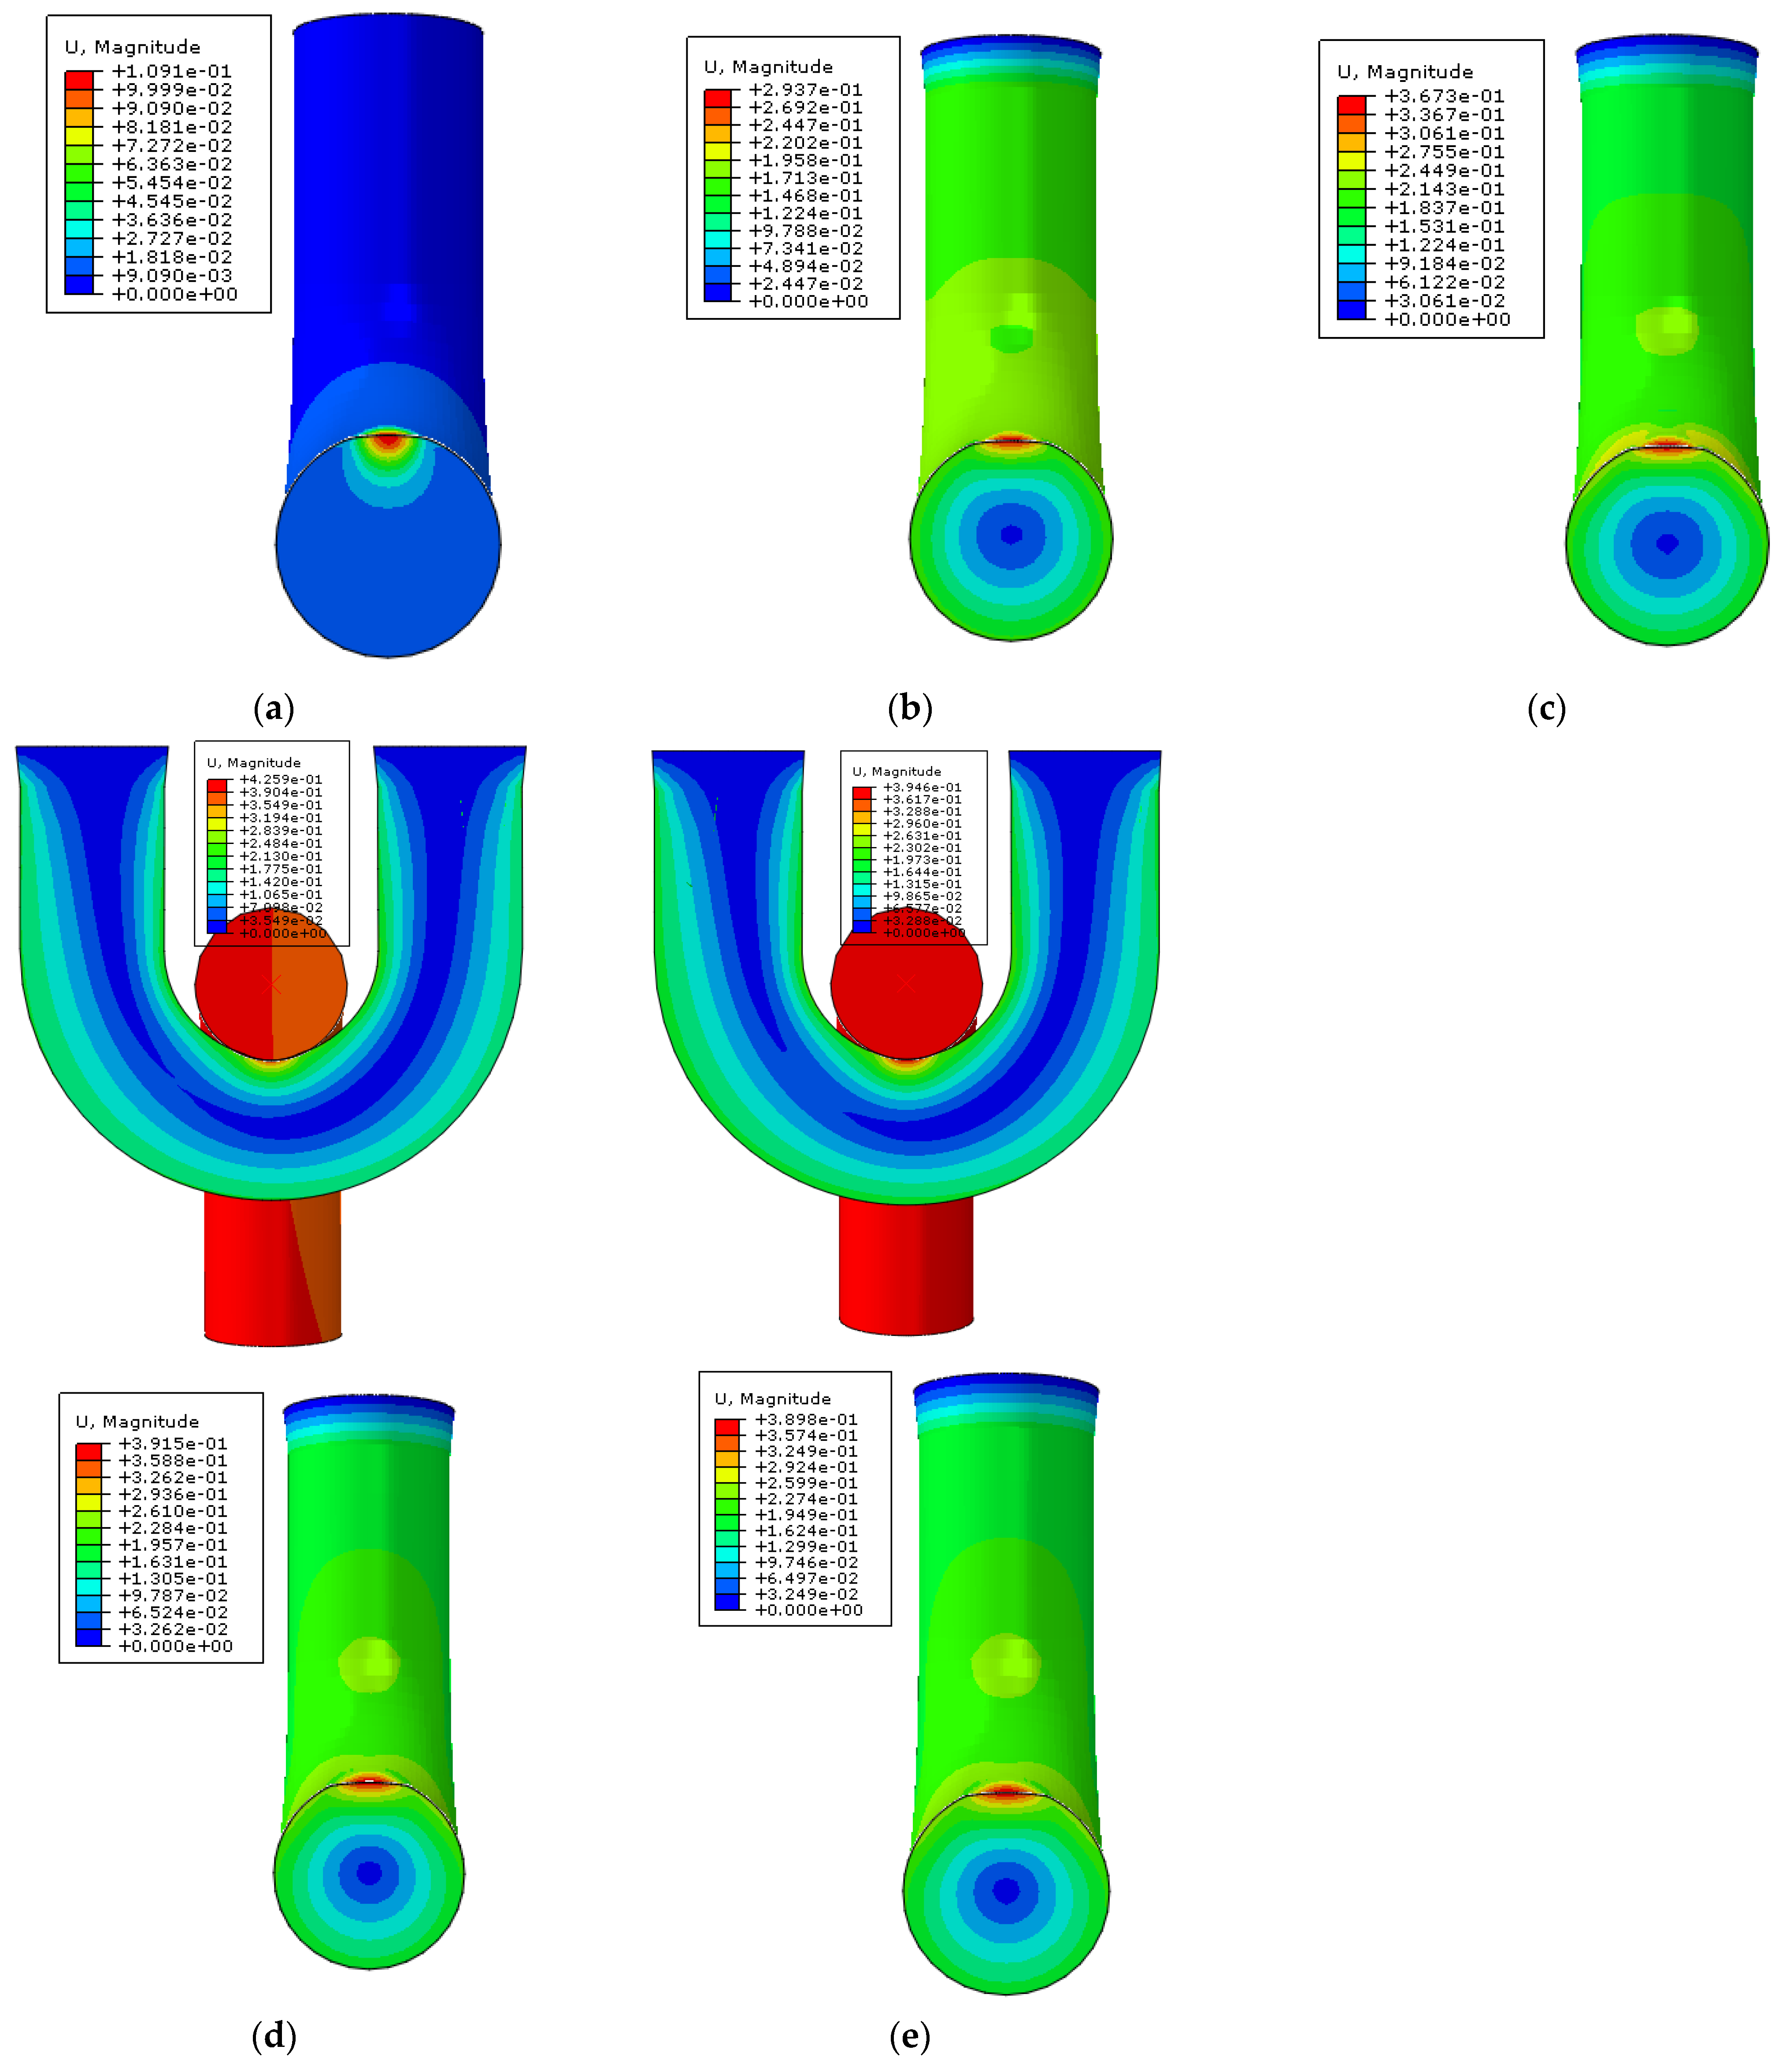
4.1. Comparison of Different Damage Evolution Models
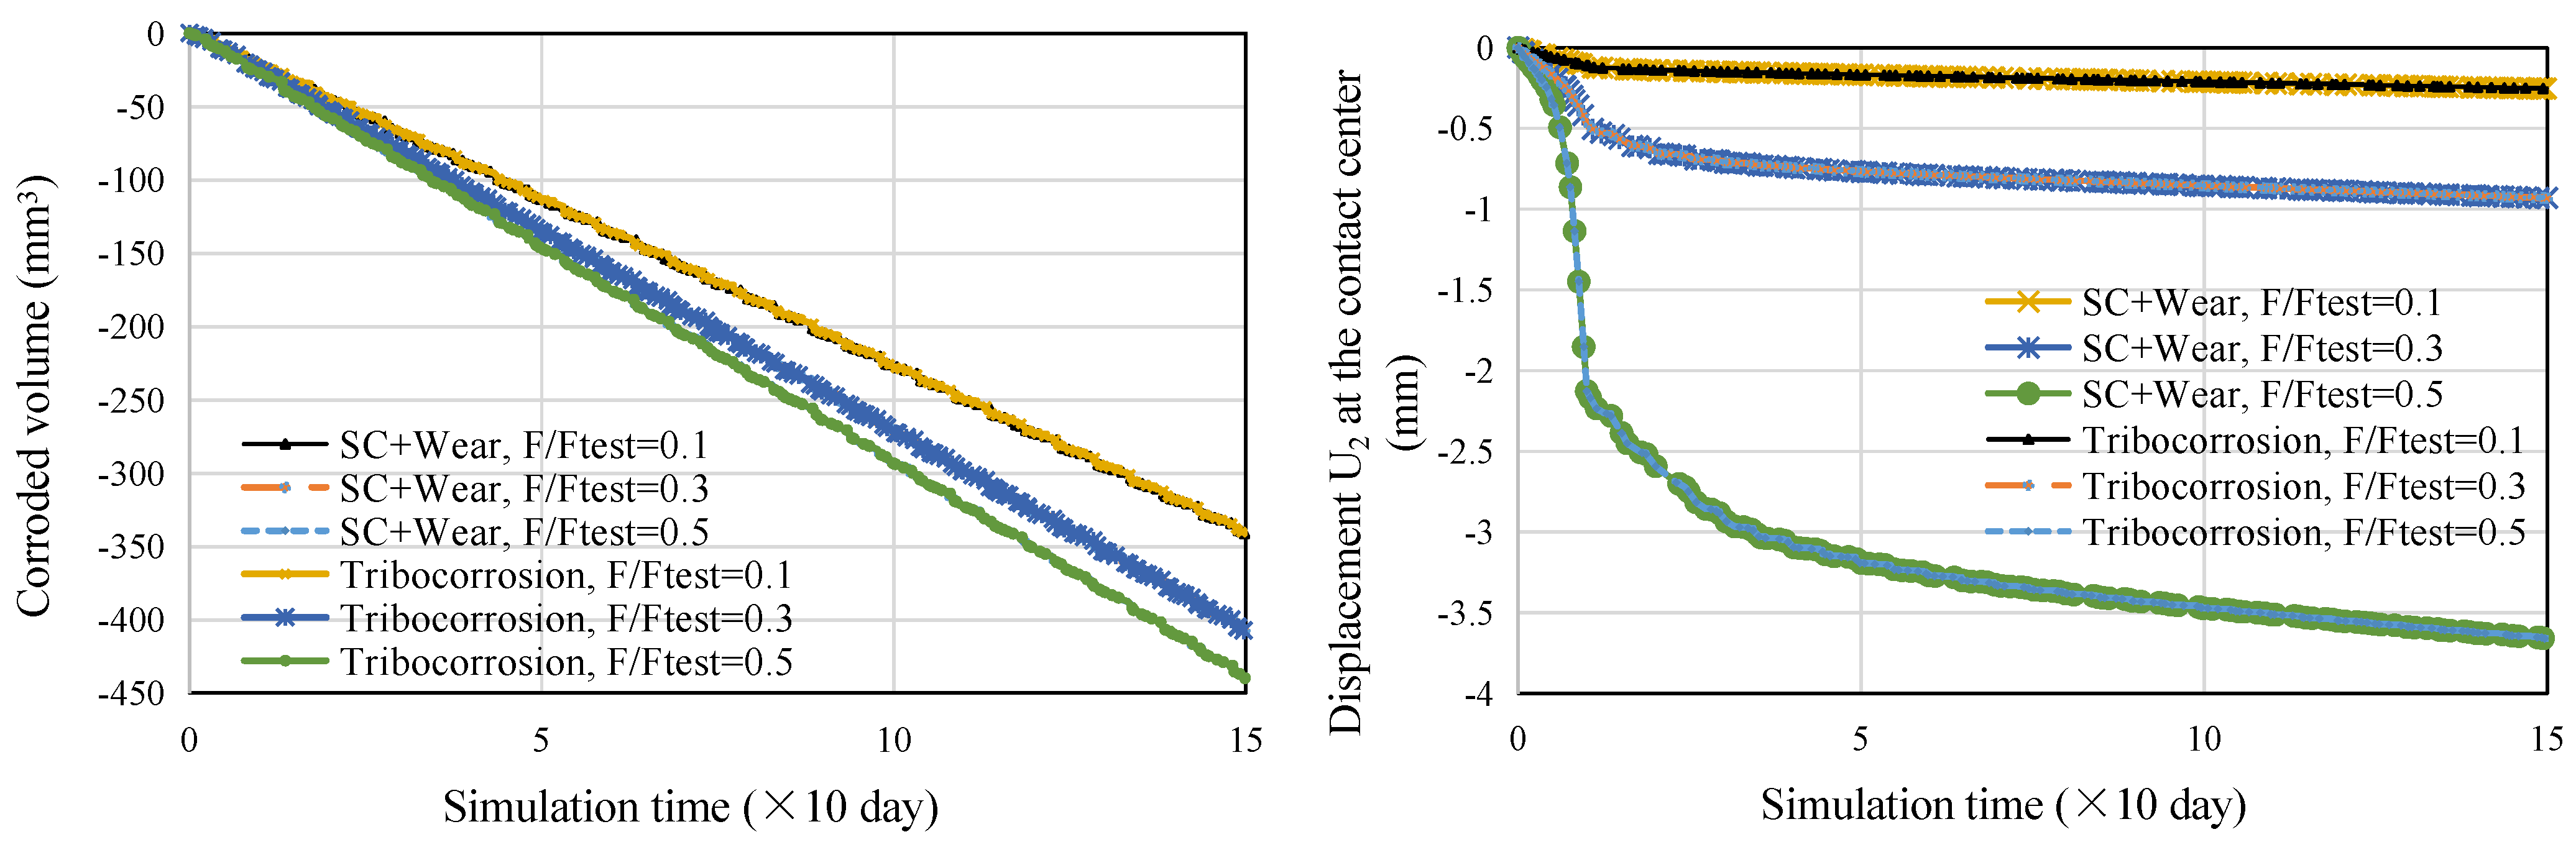
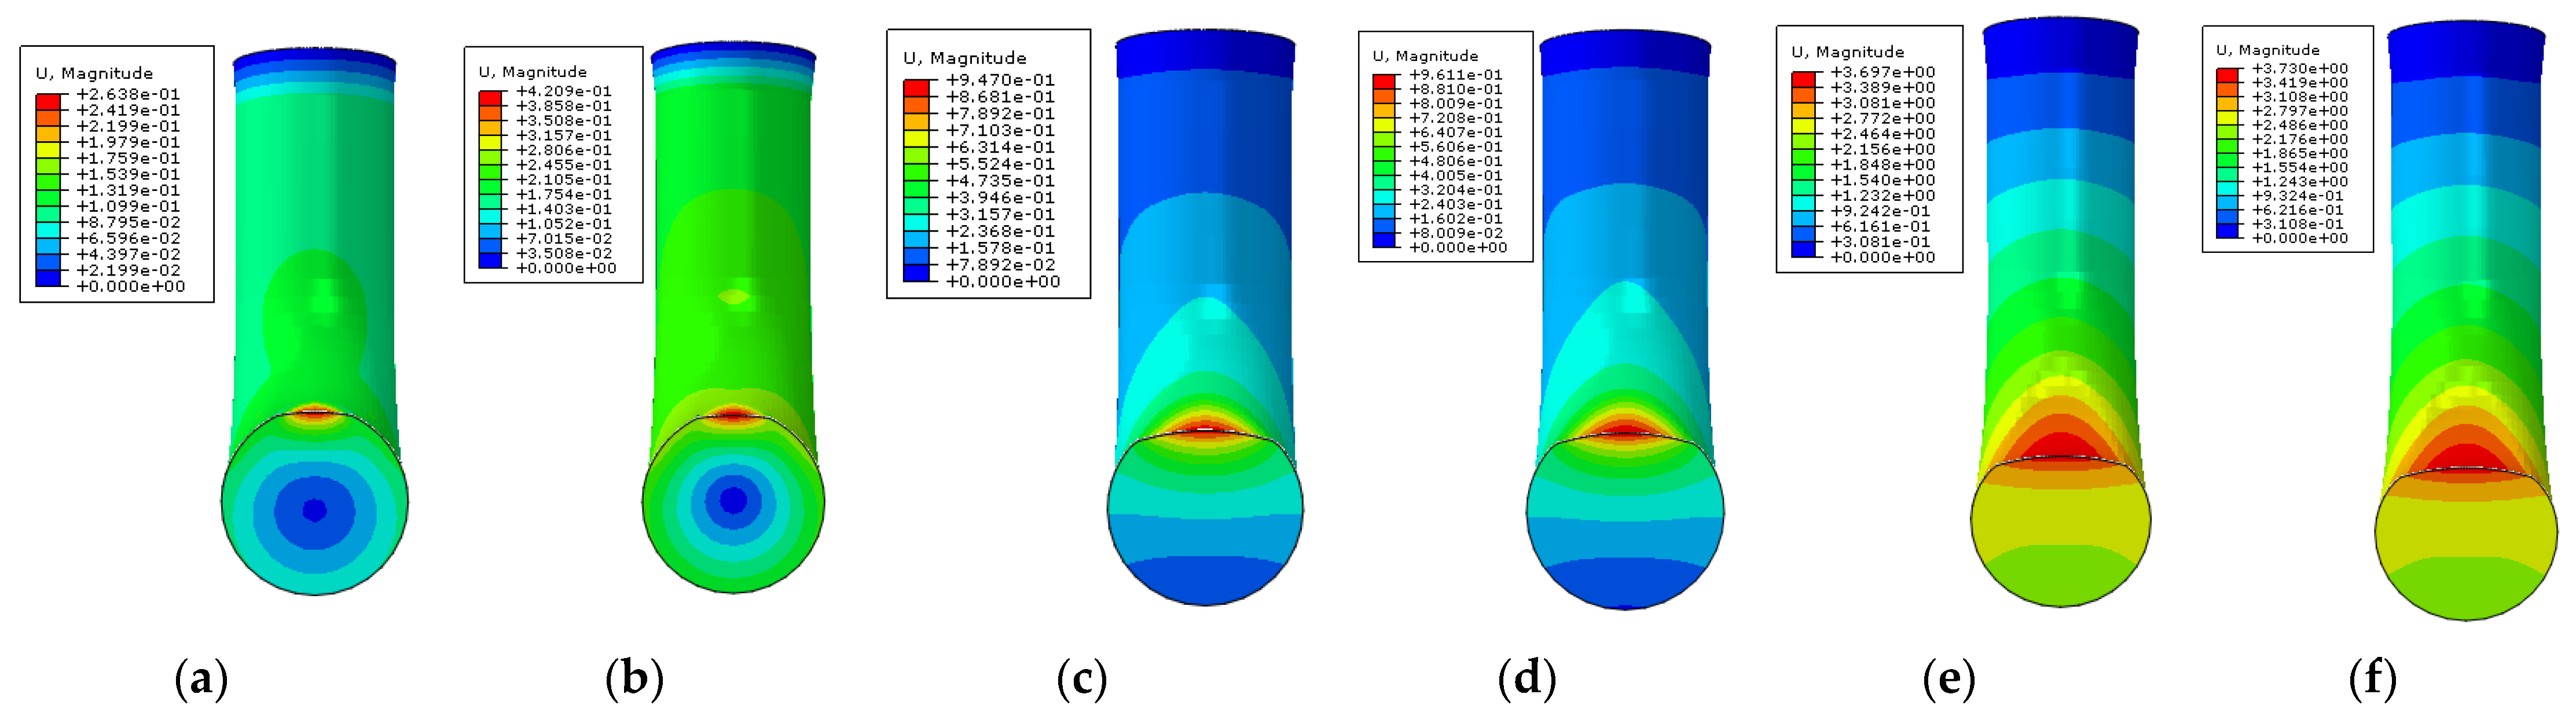
4.2. Effects of Applied Load and Moving Angle
4.3. Effect of Wear Coefficient
4.4. A Modified Chain Link Design Method
5. Conclusions
- The mechano-electrochemical interaction of tribocorrosion can be considered by the proposed simplified method, and the time-variant damage morphology can be obtained.
- Ignoring mechanochemical interaction leads to significant underestimation of damage, especially for stress-accelerated corrosion, and also leads to unsafe design. Additionally, as the hardness reduction caused by corrosion is very limited, the corrosion-accelerated wear is marginal, which can be ignored.
- Reducing service load is beneficial to reduce tribocorrosion, and the recommended operational load is 0.3 times the test load.
- The proposed modified design method can be used to obtain an optimized configuration and allowance dimension for chain link.
Author Contributions
Funding
Data Availability Statement
Conflicts of Interest
References
- Melchers, R.E.; Chaves, I.A.; Yaghin, A.L. Studies of Iter-link Cyclic Wear of Axially Loaded Mooring Chains. In Proceedings of the Twelfth ISOPE Pacific/Asia Offshore Mechanics Symposium, Gold Coast/Brisbane, Australia, 4–7 October 2016. [Google Scholar]
- Yaghin, A.L.; Melchers, R.E. Long-term inter-link wear of model mooring chains. Mar. Struct. 2015, 44, 61–84. [Google Scholar] [CrossRef]
- Van Steenkiste, D.; Plasschaert, S.; De Baets, P.; De Pauw, J.; Perez Delgado, Y.; Sukumaran, J. Abrasive wear of link chains. In Sustainable Construction and Design; Ghent University, Laboratory Soete: Ghent, Belgium, 2011; pp. 388–396. [Google Scholar]
- API SPEC 2F; Specification for Offshore Mooring Chain. American Petroleum Institute: Washington, DC, USA, 2015.
- DNVGL-OS-E302. Offshore Mooring Chain. Det Norske Veritas and Germanischer Lloyd. 2018. Available online: http://www.dnvgl.com (accessed on 22 November 2022).
- Han, W.; Pan, C.; Wang, Z.; Yu, G. A study on the initial corrosion behavior of carbon steel exposed to outdoor wet-dry cyclic condition. Corros. Sci. 2014, 88, 89–100. [Google Scholar] [CrossRef]
- Lan, T.T.N.; Thoa, N.T.P.; Nishimura, R.; Tsujino, Y.; Yokoi, M.; Maeda, Y. Atmospheric corrosion of carbon steel under field exposure in the southern part of Vietnam. Corros. Sci. 2006, 48, 179–192. [Google Scholar] [CrossRef]
- Ma, Y.; Li, Y.; Wang, F. The atmospheric corrosion kinetics of low carbon steel in a tropical marine environment. Corros. Sci. 2010, 52, 1796–1800. [Google Scholar] [CrossRef]
- Yu, J.; Wang, H.; Yu, Y.; Luo, Z.; Liu, W.; Wang, C. Corrosion behavior of X65 pipeline steel: Comparison of Wet-Dry cycle and full immersion. Corros. Sci. 2018, 133C, 276–287. [Google Scholar] [CrossRef]
- Wang, H.; Yu, Y.; Yu, J.; Wang, Z.; Li, H. Development of erosion equation and numerical simulation methods with the consideration of applied stress. Tribol. Int. 2019, 137, 387–404. [Google Scholar] [CrossRef]
- Yu, Y.; Sun, Z.; Wang, H.; Gao, J.; Chen, Z. Time variant characteristic of steel cable considering stress-corrosion deterioration. Constr. Build. Mater. 2022, 328, 127038. [Google Scholar] [CrossRef]
- Wang, H.; Yu, Y.; Yu, J.; Xu, W.; Li, X.; Yu, S. Numerical simulation of the erosion of pipe bends with the consideration of fluid-induced stress and surface scar evolution. Wear 2019, 440–441, 203043. [Google Scholar] [CrossRef]
- Gao, K.; Li, D.; Pang, X.; Yang, S. Corrosion behaviour of low-carbon bainitic steel under a constant elastic load. Corros. Sci. 2010, 52, 3428–3434. [Google Scholar] [CrossRef]
- Wang, Y.; Zhao, W.; Ai, H.; Zhou, X.; Zhang, T. Effects of strain on the corrosion behaviour of X80 steel. Corros. Sci. 2011, 53, 2761–2766. [Google Scholar] [CrossRef]
- Gutman, E.M. Mechanochemistry of Solid Surfaces; World Scientific Publication: Singapore, 1994. [Google Scholar]
- Xu, L.Y.; Cheng, Y.F. Development of a finite element model for simulation and prediction of mechanoelectrochemical effect of pipeline corrosion. Corros. Sci. 2013, 73, 150–160. [Google Scholar] [CrossRef]
- Xu, L.Y.; Cheng, Y.F. An experimental investigation of corrosion of X100 pipeline steel under uniaxial elastic stress in a near-neutral pH solution. Corros. Sci. 2012, 59, 103–109. [Google Scholar] [CrossRef]
- Sun, J.; Cheng, Y.F. Modelling of mechano-electrochemical interaction of multiple longitudinally aligned corrosion defects on oil/gas pipelines. Eng. Struct. 2019, 190, 9–19. [Google Scholar] [CrossRef]
- Sun, J.; Cheng, Y.F. Investigation by numerical modeling of the mechano-electrochemical interaction of circumferentially aligned corrosion defects on pipelines. Thin-Walled Struct. 2019, 144, 106314. [Google Scholar] [CrossRef]
- Sun, J.; Cheng, Y.F. Modelling of mechano-electrochemical interaction at overlapped corrosion defects and the implication on pipeline failure prediction. Eng. Struct. 2020, 212, 110466. [Google Scholar] [CrossRef]
- Yang, Y.; Cheng, F. Stress Enhanced Corrosion at the Tip of Near-Neutral pH Stress Corrosion Cracks on Pipelines. Corrosion 2016, 72, 1035–1043. [Google Scholar] [CrossRef]
- Xu, L.; Cheng, Y.F. A finite element based model for prediction of corrosion defect growth on pipelines. Int. J. Press. Vessel. Pip. 2017, 153, 70–79. [Google Scholar] [CrossRef]
- Yang, S.; Yang, H.; Liu, G.; Huang, Y.; Wang, L. Approach for fatigue damage assessment of welded structure considering coupling effect between stress and corrosion. Int. J. Fatigue 2016, 88, 88–95. [Google Scholar] [CrossRef]
- Wang, H.; Yu, Y.; Xu, W.; Li, Z.; Yu, S. Time-variant burst strength of pipe with corrosion defects considering mechano-electrochemical interaction. Thin-Wall Struct. 2021, 169, 108479. [Google Scholar] [CrossRef]
- Wang, H.; Gao, J.; Liu, T.; Yu, Y.; Xu, W.; Sun, Z. Axial buckling behavior of H-piles considering mechanical-electrochemical interaction induced damage. Mar. Struct. 2022, 83, 103157. [Google Scholar] [CrossRef]
- Archard, J.F. Contact and Rubbing of Flat Surfaces. J. Appl. Phys. 1953, 24, 981–988. [Google Scholar] [CrossRef]
- Tandler, R.; Bohn, N.; Gabbert, U.; Woschke, E. Analytical wear model and its application for the wear simulation in automotive bush chain drive systems. Wear 2020, 446–447, 203193. [Google Scholar] [CrossRef]
- Liu, J. Research on Approach for Corrosion and Wear Cumulative Damage Assessment of Chain Links; Dalian University of Technology: Dalian, China, 2013. [Google Scholar]
- Su, J.; Liu, G.; Sun, J.J. Research on tests and numerical analysis of corrosion and wear damage of mooring chain steel 22MnCrNiMo. Chin. J. Comput. Mech. 2015, 32, 113–117. [Google Scholar]
- ABAQUS. User’s Manual: Version 6.12; Simulia: Johnston, RI, USA, 2013. [Google Scholar]
- Yu, J.X.; Sun, Z.Z.; Liu, X.X.; Zhai, Y.X. Ring–truss theory on offshore pipelines buckle propagation. Thin-Walled Struct. 2014, 85, 313–323. [Google Scholar] [CrossRef]
- Guo, H.X.; Lu, B.T.; Luo, J.L. Interaction of mechanical and electrochemical factors in erosion–corrosion of carbon steel. Electrochim. Acta 2005, 51, 315–323. [Google Scholar] [CrossRef]
- Lu, B.T.; Lu, J.F.; Luo, J.L. Erosion–corrosion of carbon steel in simulated tailing slurries. Corros. Sci. 2011, 53, 1000. [Google Scholar] [CrossRef]
- de Pauw, J.; Sukumaran, J.; Delgado, Y.P.; Rodriguez, V.; de Baets, P. Effect of hardness in shackle chain wear under harsh environmentally conditions. Wear 2013, 306, 131–137. [Google Scholar] [CrossRef]
- Martínez, F.J.; Canales, M.; Izquierdo, S.; Jiménez, M.A.; Martínez, M.A. Finite element implementation and validation of wear modelling in sliding polymer–metal contacts. Wear 2012, 284–285 (Suppl. C), 52–64. [Google Scholar] [CrossRef]
- Hegadekatte, V.; Huber, N.; Kraft, O. Finite element based simulation of dry sliding wear. Model. Simul. Mater. Sci. Eng. 2005, 13, 57–75. [Google Scholar] [CrossRef]


| Material | K (Dimensionless) | H0 (GPa) | Cycle of Motion, T (s) | Angle of Reciprocating Motion, θ (°) | Ring Diameter, d (mm) | Friction Coefficient |
|---|---|---|---|---|---|---|
| Value | 1 × 10⁻⁶ | 2.5 | 12 | 1 | 14 | 0.3 |
Publisher’s Note: MDPI stays neutral with regard to jurisdictional claims in published maps and institutional affiliations. |
© 2022 by the authors. Licensee MDPI, Basel, Switzerland. This article is an open access article distributed under the terms and conditions of the Creative Commons Attribution (CC BY) license (https://creativecommons.org/licenses/by/4.0/).
Share and Cite
Wang, H.; Liu, T.; Zhang, Y.; Zhu, Y.; Liu, F.; Wang, T. A Fully Coupled Tribocorrosion Simulation Method for Anchor Chain Considering Mechano-Electrochemical Interaction. Lubricants 2022, 10, 330. https://doi.org/10.3390/lubricants10120330
Wang H, Liu T, Zhang Y, Zhu Y, Liu F, Wang T. A Fully Coupled Tribocorrosion Simulation Method for Anchor Chain Considering Mechano-Electrochemical Interaction. Lubricants. 2022; 10(12):330. https://doi.org/10.3390/lubricants10120330
Chicago/Turabian StyleWang, Huakun, Tongmu Liu, Yao Zhang, Yesen Zhu, Fangzhou Liu, and Tongyao Wang. 2022. "A Fully Coupled Tribocorrosion Simulation Method for Anchor Chain Considering Mechano-Electrochemical Interaction" Lubricants 10, no. 12: 330. https://doi.org/10.3390/lubricants10120330
APA StyleWang, H., Liu, T., Zhang, Y., Zhu, Y., Liu, F., & Wang, T. (2022). A Fully Coupled Tribocorrosion Simulation Method for Anchor Chain Considering Mechano-Electrochemical Interaction. Lubricants, 10(12), 330. https://doi.org/10.3390/lubricants10120330