Article

Development of Universal Friction Calibration Curve for Ball Ironing Test

by
Nuttakorn Sae-eaw
1,
Sutee Olarnrithinun
2,
Varunee Premanond
3 and
Yingyot Aue-u-lan
1,*
1
Materials and Production Engineering Program, The Sirindhorn International Thai-German Graduate School of Engineering (TGGS), King Mongkut’s University of Technology North Bangkok, Bangkok 10800, Thailand
2
Rail and Modern Transports Research Center, National Science and Technology Development Agency (NSTDA), Pathum Thani 12120, Thailand
3
Department of Tool and Materials Engineering, Faculty of Engineering, King Mongkut’s University of Technology Thonburi, Bangkok 10140, Thailand
*
Author to whom correspondence should be addressed.
Lubricants 2022, 10(6), 106; https://doi.org/10.3390/lubricants10060106
Submission received: 6 May 2022 / Revised: 22 May 2022 / Accepted: 26 May 2022 / Published: 30 May 2022
(This article belongs to the Special Issue Advances in Wear Predictive Models)

Abstract

:
The friction calibration curve (FCC) is normally constructed to indirectly approximate the friction value for any simulative friction test based on sensitive friction indicators (i.e., forming load or final geometry) by finite element modeling (FEM). For calculation, these indicators are highly dependent on flow stress data and the techniques to extrapolate them. A universal FCC is preferable with the independence of these factors. In this paper, the sensitivity of the material data and our proposed extrapolation techniques for the ball ironing test (BIT) were studied to construct a new universal FCC. A specific load was proposed as a new friction indicator for this universal FCC. It was used to approximate the friction value for different materials and lubricants. This friction value was also validated to determine the maximum load and geometry for pulley forming. The results obtained from the simulation were in good agreement with the experiment.

1. Introduction

Simulative friction tests are used as a tool for determining the friction value and investigating the material flow behavior in any metal forming process [1,2]. Examples of standard friction tests are the pin-on-disc test and the ring compression test used for any metal forming process [3,4,5]. A suitable test will provide the same tribological conditions as the real forming process, which are normal contact pressure ( σ n ), surface expansion ratio ( ψ ), and relative velocity ( ν ) [6,7]. However, these tests cannot cover the whole range of some processes. Therefore, researchers need to develop new friction tests. For example, the spike forging test, the double-cup extrusion test, and the T-shape compression test were developed for heavy forging processes [8,9,10]. The strip ironing test, the upsetting and sliding test, and the deep drawing and ironing cup test were used for the ironing process [11,12,13,14]. Suitable friction values should be determined corresponding to the appropriate test.
The techniques for friction evaluation in simulative friction tests can be divided into direct and indirect techniques. Direct friction techniques can be used for tests that directly measure the friction force. Examples of these tests are the pin-on-disc test and the strip ironing test. However, some tests cannot measure this force directly, so the indirect friction measurement technique is employed. Change in load or specimen geometry is used to indicate the friction level, called the friction indicator. These tests were previously simulated by using an FEM program to determine the relationship between friction and testing indicators. This relationship was plotted in a line chart or by using the mathematical formula known as the friction calibration curve (FCC). During the experiment, the friction indicator was measured and compared with the FCC to approximate the friction value.
The ball ironing test (BIT) was proposed as a simulative friction test for the thick-sheet ironing process [15]. The concept of thick-sheet forming is widely adapted to produce automotive parts. For cylindrical cup-shaped products such as pulleys, the thickness of the thick sheet is reduced to build the cup wall and height. During production, the performance of the selected lubricant can be evaluated by using the BIT. The tool components are shown in Figure 1. A thick disc-shaped specimen is drawn and simultaneously ironed by a ball-shaped punch. By changing the thickness reduction, the range of tribological conditions can cover all ironing conditions, as seen in Figure 2. In a previous study [16], the maximum load (Lmax) was selected as the friction indicator. Therefore, the relationship between the friction value and maximum load (m-Lmax curve) was used as the FCC for the BIT. However, it was only developed for a single material and thickness reduction, as seen in Figure 3. As a result, when the materials and testing conditions were changed, a new FCC had to be constructed again.
Furthermore, for the material data, the stress–strain curve obtained from the standard material testing was limited to a strain of 0.7 for the uniaxial compression tests (under 50% height reduction). This was not enough in the case of large deformations. Therefore, flow stress extrapolation techniques were used to approximate the material data. Linear or power-law interpolation is a common technique for curve extension, as seen in Figure 4, which has a direct effect on the load-based FCC curve [17,18].
The aim of this work was to investigate the effect of material properties and techniques to input and extrapolate the material data on the FCC of the BIT. A new idea for constructing a universal FCC independent of the material properties was proposed. BIT experiments were conducted to validate the new universal FCC obtained from FEM simulation according to material type, thickness reduction, and lubricant. This new universal FCC was also used to approximate the friction value with tribological conditions such as pulley forming to validate its accuracy.

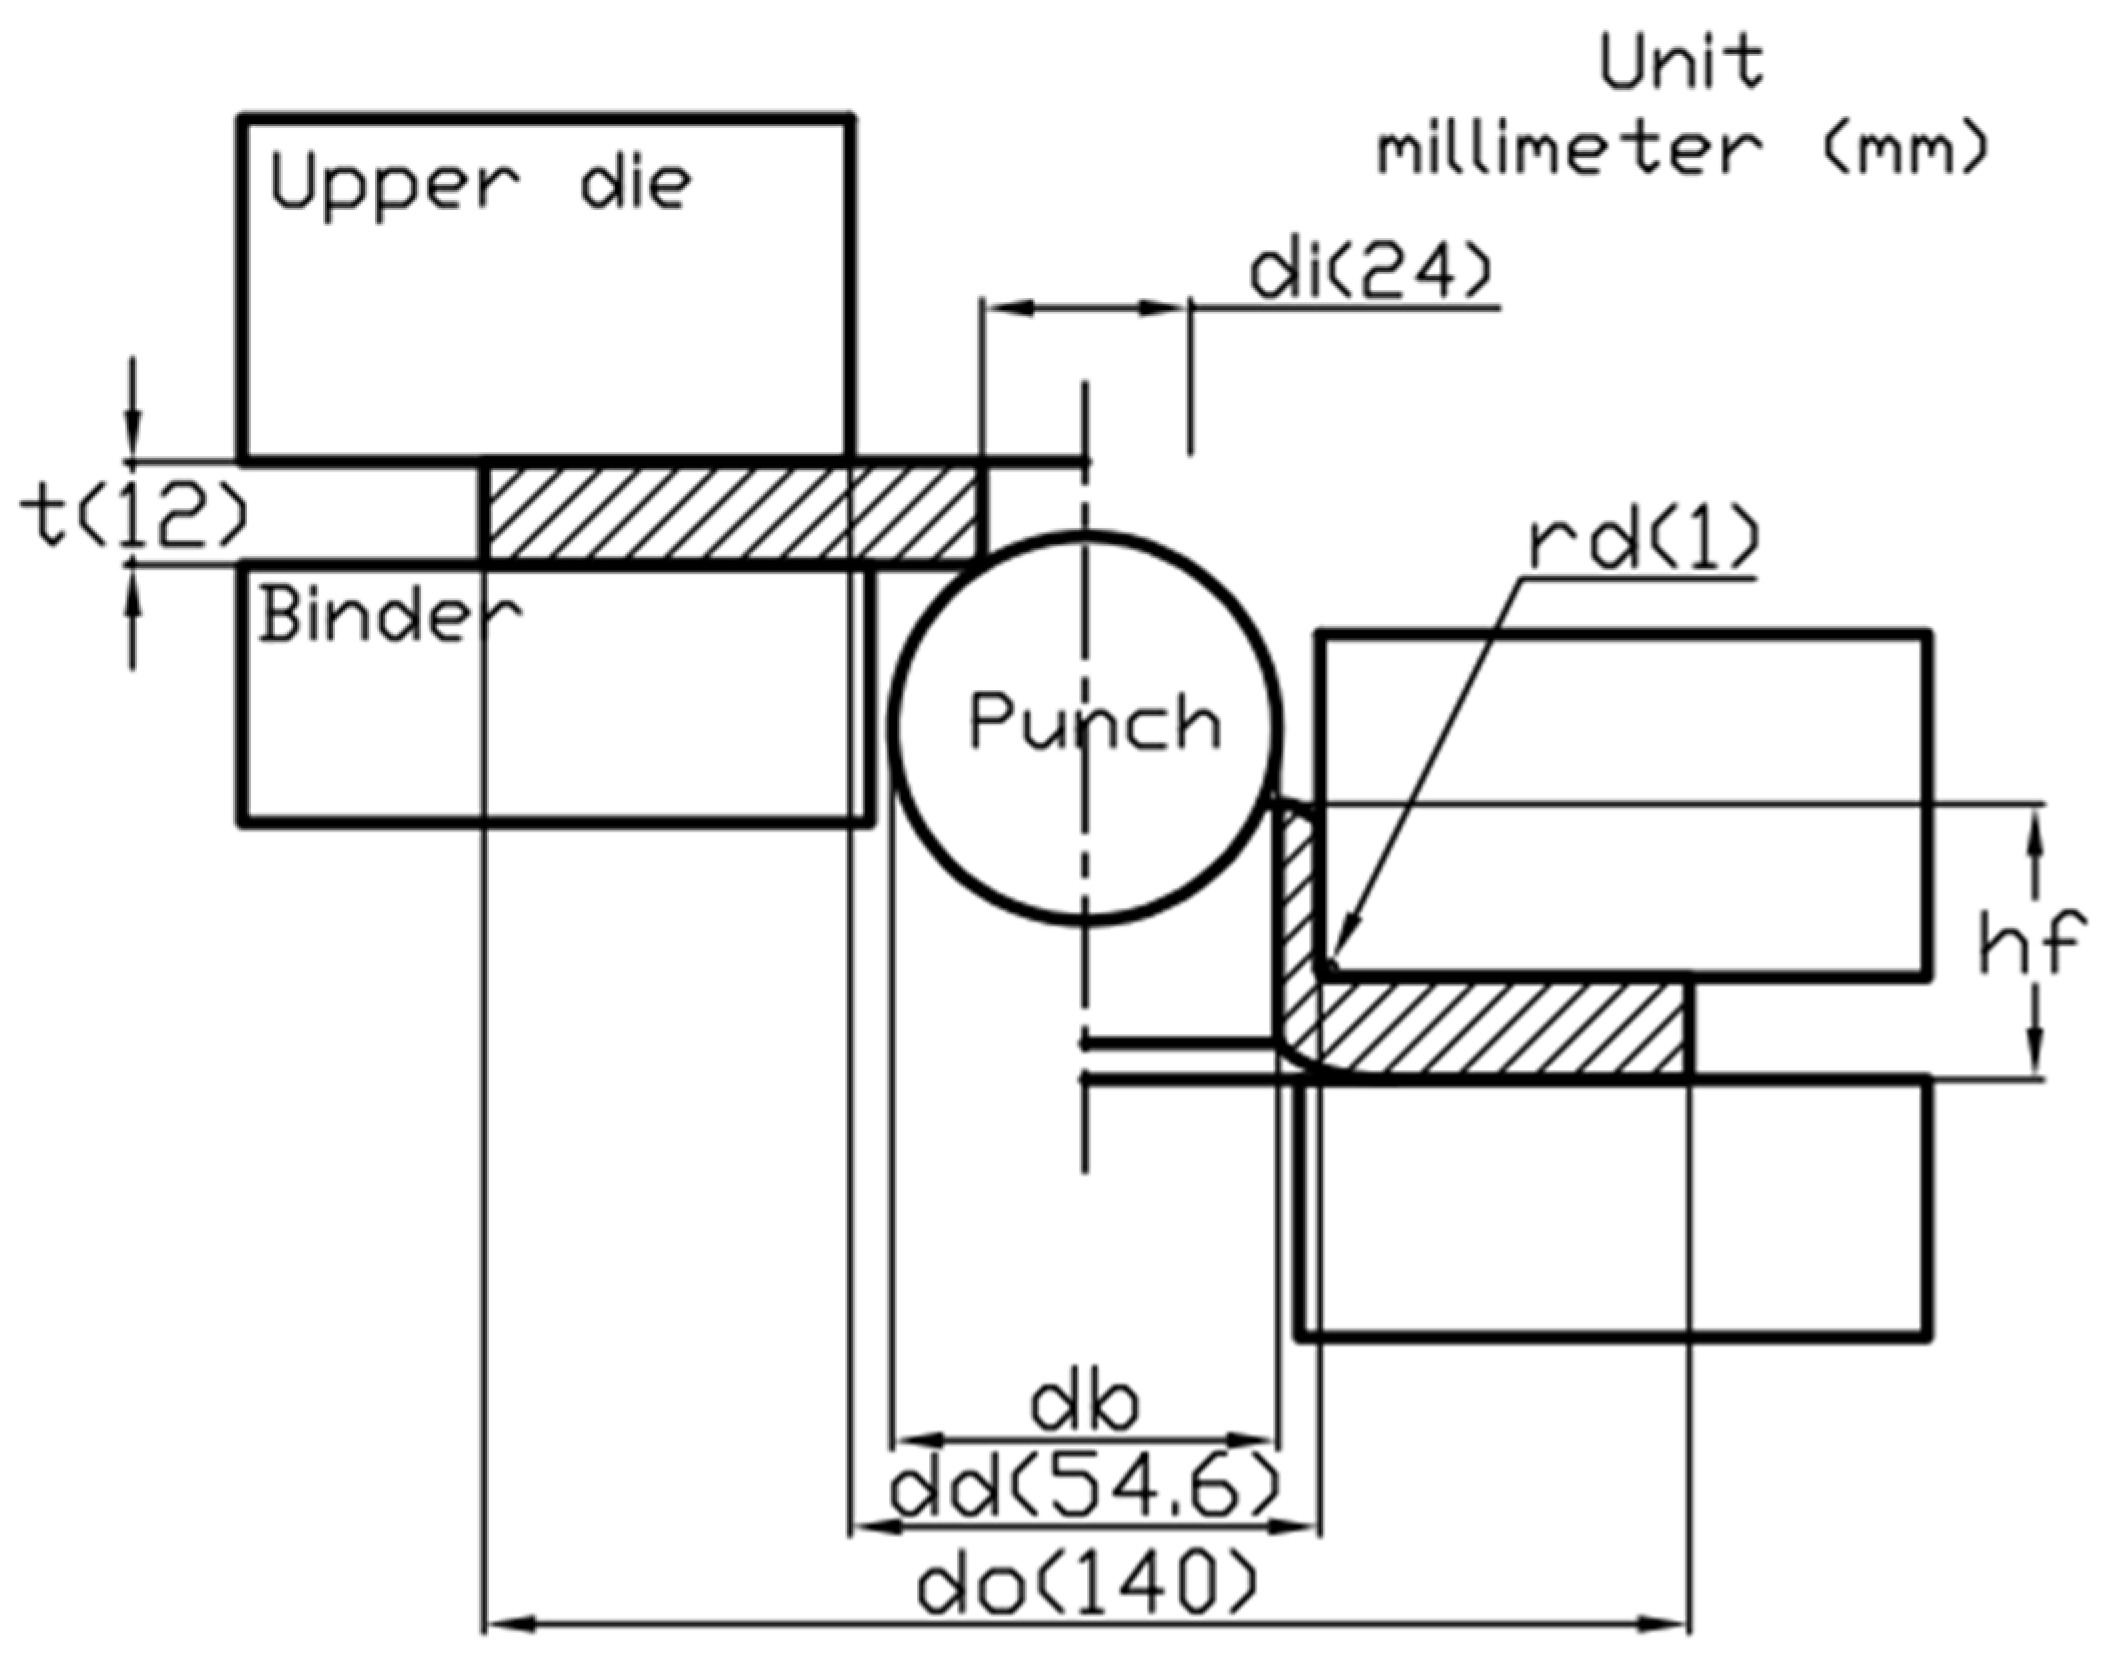
2. Procedure to Construct the Universal FCC

Construction of the universal FCC: A suitable universal FCC must be independent of the material properties. Therefore, a new friction indicator was proposed for the BIT to replace the maximum load used to construct the FCC [16]. A sensitivity analysis of this new indicator was performed to ensure the independence of the material properties. This new indicator was used to construct the universal FCC through FEM simulation.
Validation of the universal FCC: BIT experiments were performed under different testing conditions and materials, as shown in Table 1, Table 2 and Table 3. The friction values for all conditions were determined by using the universal FCC. Then, these values were input into the simulation models, and the results, namely maximum loads and geometries, were compared with the experimental results to validate the universal FCC. For the tooling, the die set of the BIT is shown in Figure 5, and the dimensions are shown in Figure 1 [15].
Verification of the universal FCC for friction determination: The same tribological conditions (contact pressure and surface expansion ratio) of the pulley-forming process seen in Figure 6 were selected in the BIT to determine the friction value from the universal FCC. In the actual process, this pulley was made of AISI-1005 (Automotive supplier, Rayong city, Thailand) and lubricated with a Zn-Ph coating. The maximum load and product dimensions between the experiment and simulation were compared to verify the accuracy of the universal FCC.
The dimensionless parameter, called specific load (Ls), was proposed as a new friction indicator. It was developed based on the work balance theory, which is the ratio between the actual maximum force and the ideal force, as seen in Equation (1) [19]. For the ideal force, only the load without friction and redundant forces was determined. The simplified formula for calculating the ironing force was a function of dd, db, ti, tf, and σ ε i , which are die cavity diameter, ball diameter, initial specimen thickness, final specimen thickness, and representative stress, respectively [20]. In this work, σ ε i was used instead of the tensile strength of the material because it cannot be determined directly from the uniaxial compression test. The specific loads were calculated by using stress values at different strain levels, as seen in Figure 4. Table 4 shows the parameters affecting the friction indicator. Different materials were selected to study the effect of the mechanical properties. Their chemical compositions are shown in Table 2. The stress–strain curves were obtained from the uniaxial compression test at a 50% height reduction. Two general techniques for curve extrapolation were also used for the load calculation in FEM. The strain levels were extended up to 3, which covers the strain range of the deformation. The friction indicators, Ls values, and universal FCCs based on two interpolation techniques were compared.
L s = L m e a s u r e L i d e a l = L m e a s u r e π ( d d d b 2 ) ( t f ) ( σ ε i ) ( ln t i t f )
λ = | k m i k m 0 k m 0 |
The sensitivity parameters ( λ ), as shown in Equation (2), were calculated to determine the friction sensitivity of the friction indicators obtained from the two interpolation techniques, where km0 and kmi are the Ls values at the frictionless condition and the defined friction values. The universal FCC with the high friction sensitivity were selected.

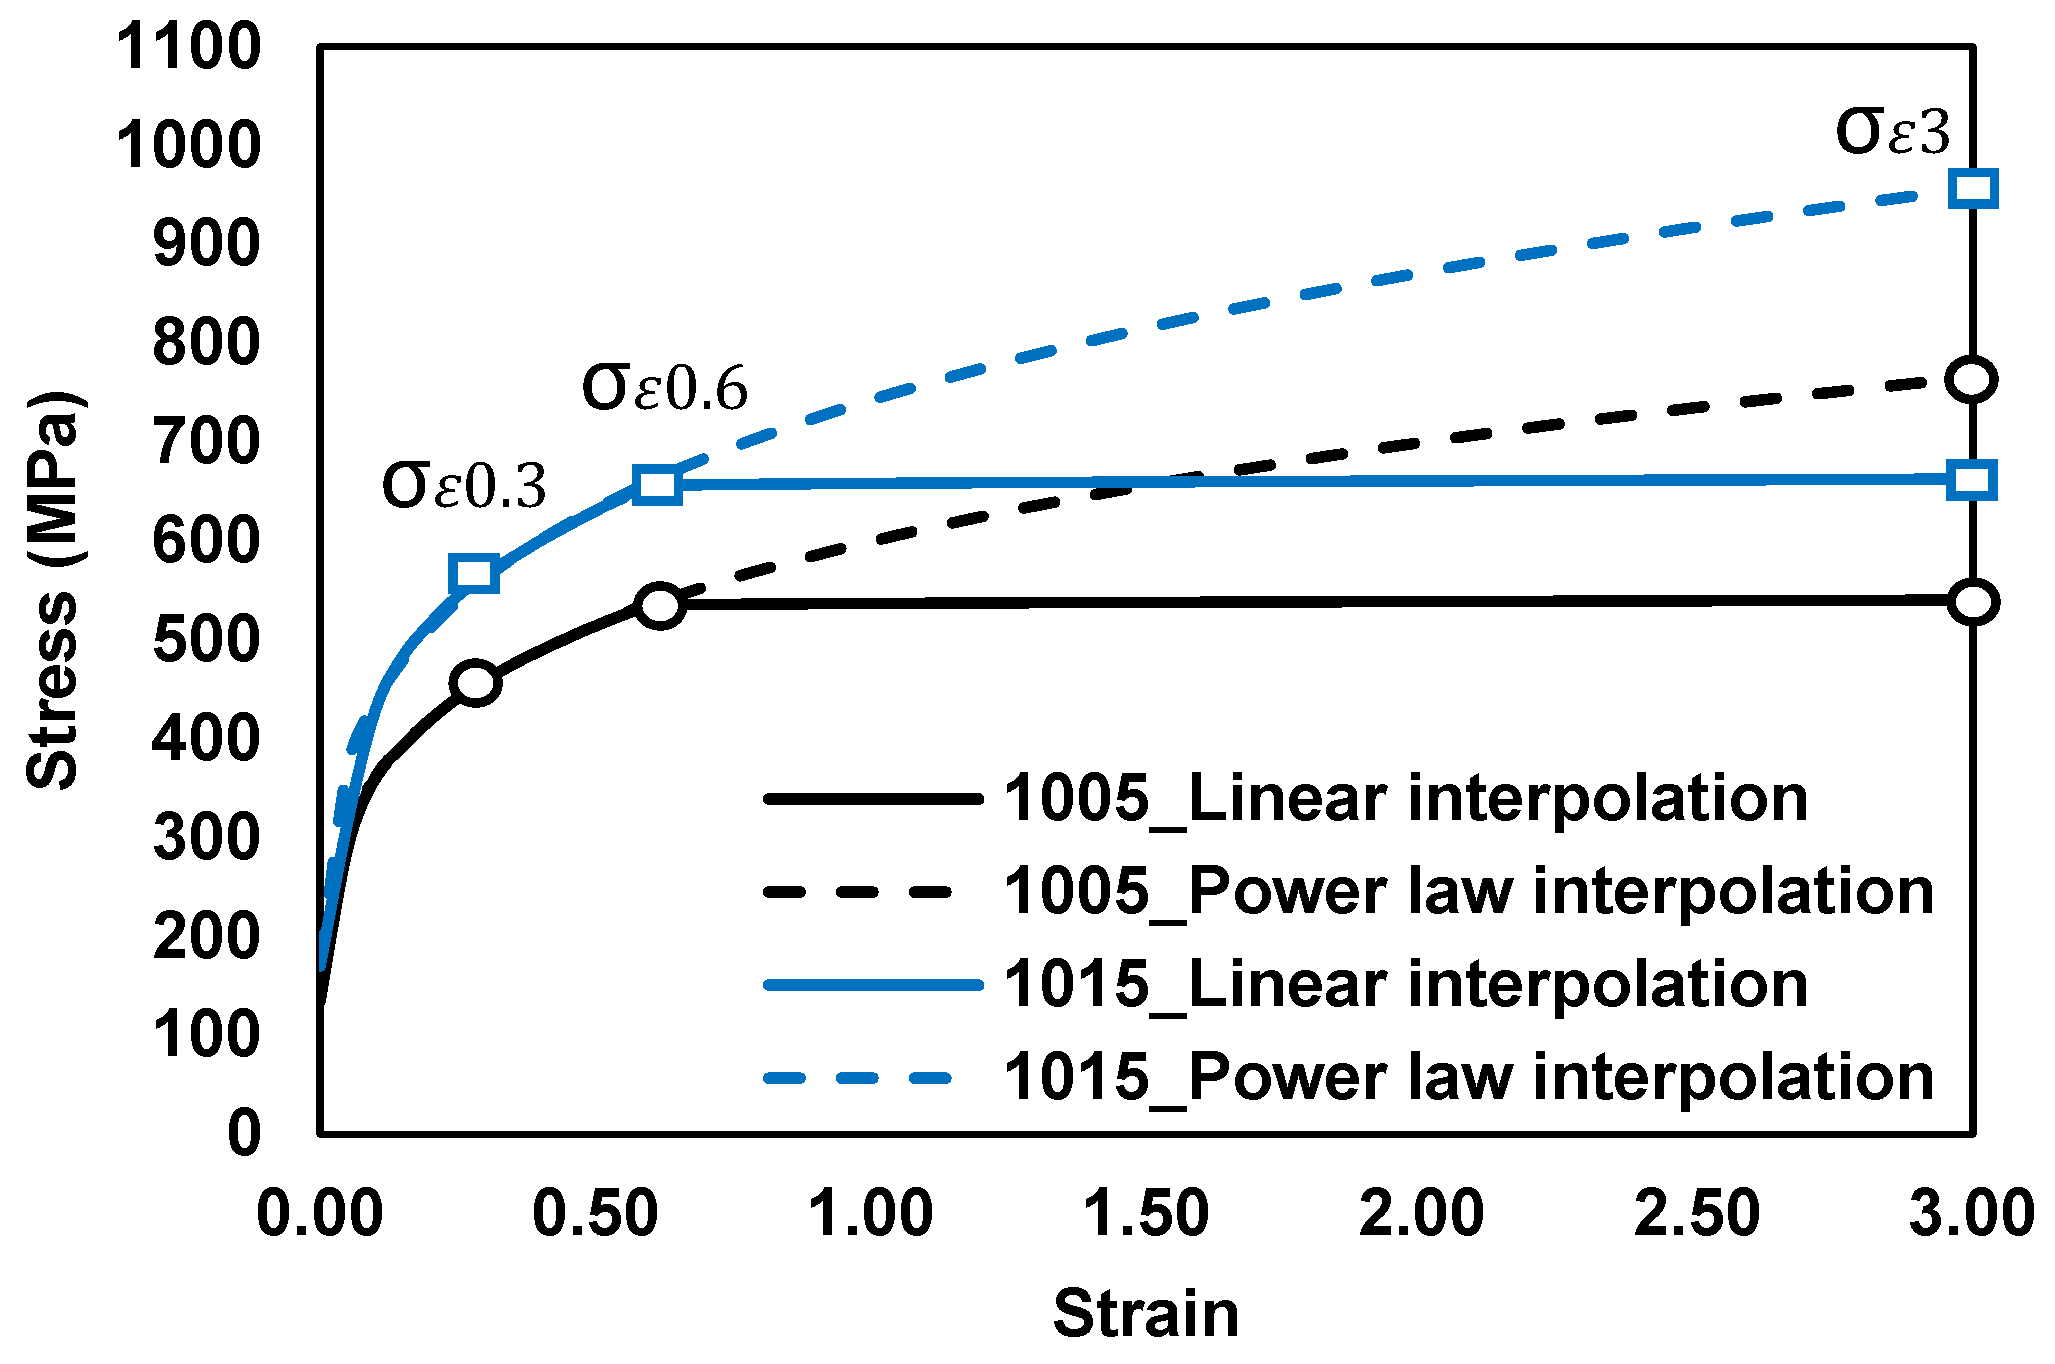
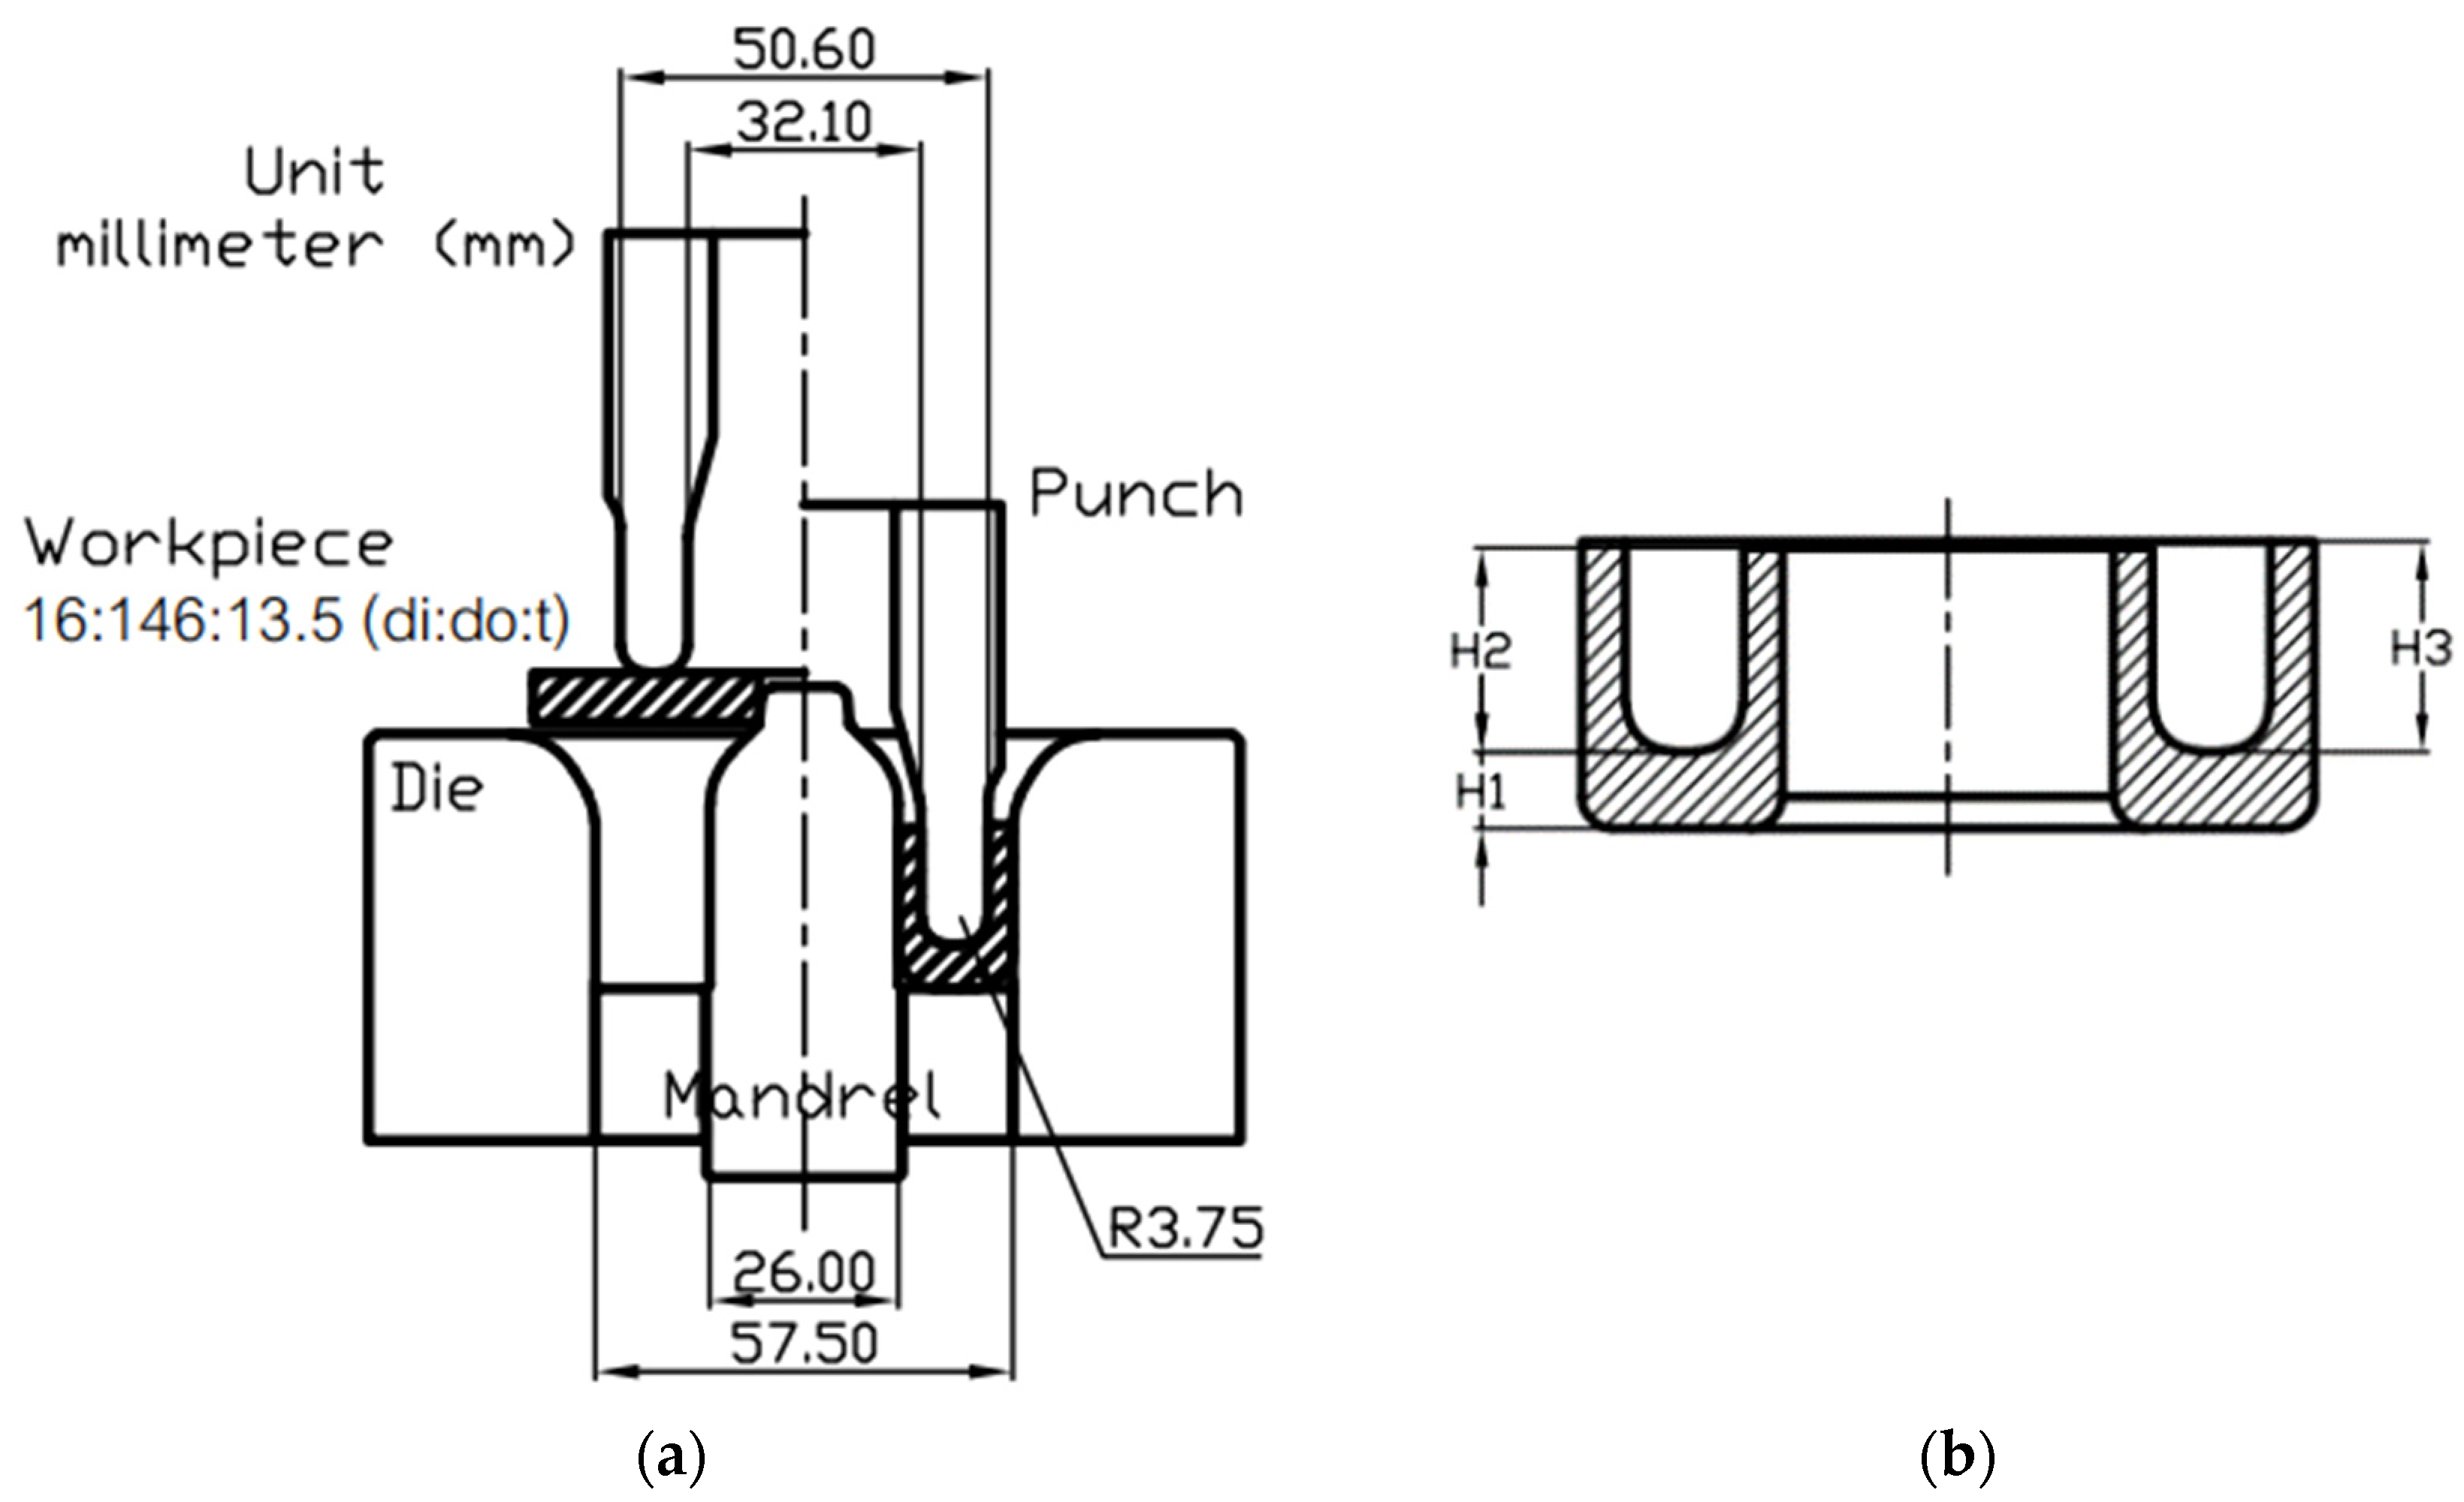
3. Finite Element Modeling (FEM) Setup

The FEM software for the analysis was DEFORM2D ver. 12.1.1 (SFTC, Columbus, OH, USA). Due to the symmetry of the BIT components, a 2D axisymmetric model was used, as seen in Figure 7. All tool components were assumed as the rigid body, while only the workpiece was assumed as the plastic material that could be deformed. At the workpiece, quadrilateral elements with a fine element size of 0.2 mm were created at the inner diameter of the workpiece. The boundary conditions of the BIT simulation are shown in Table 5.
To acquire the accuracy of the simulation results, the remeshing criterion was applied by controlling the interference depth between the tool and the workpiece at 0.1 mm. For the contact condition, the shear friction law ( τ = mk; where τ , k, and m are frictional shear stress, shear strength of material, and shear friction factor) was selected. This friction law uses a shear friction factor (m) to quantify the interface friction for large deformation processes. It is widely used in bulk metal forming processes. The m value is a fraction of the shear strength of the material (k) [21].

4. Simulation Results

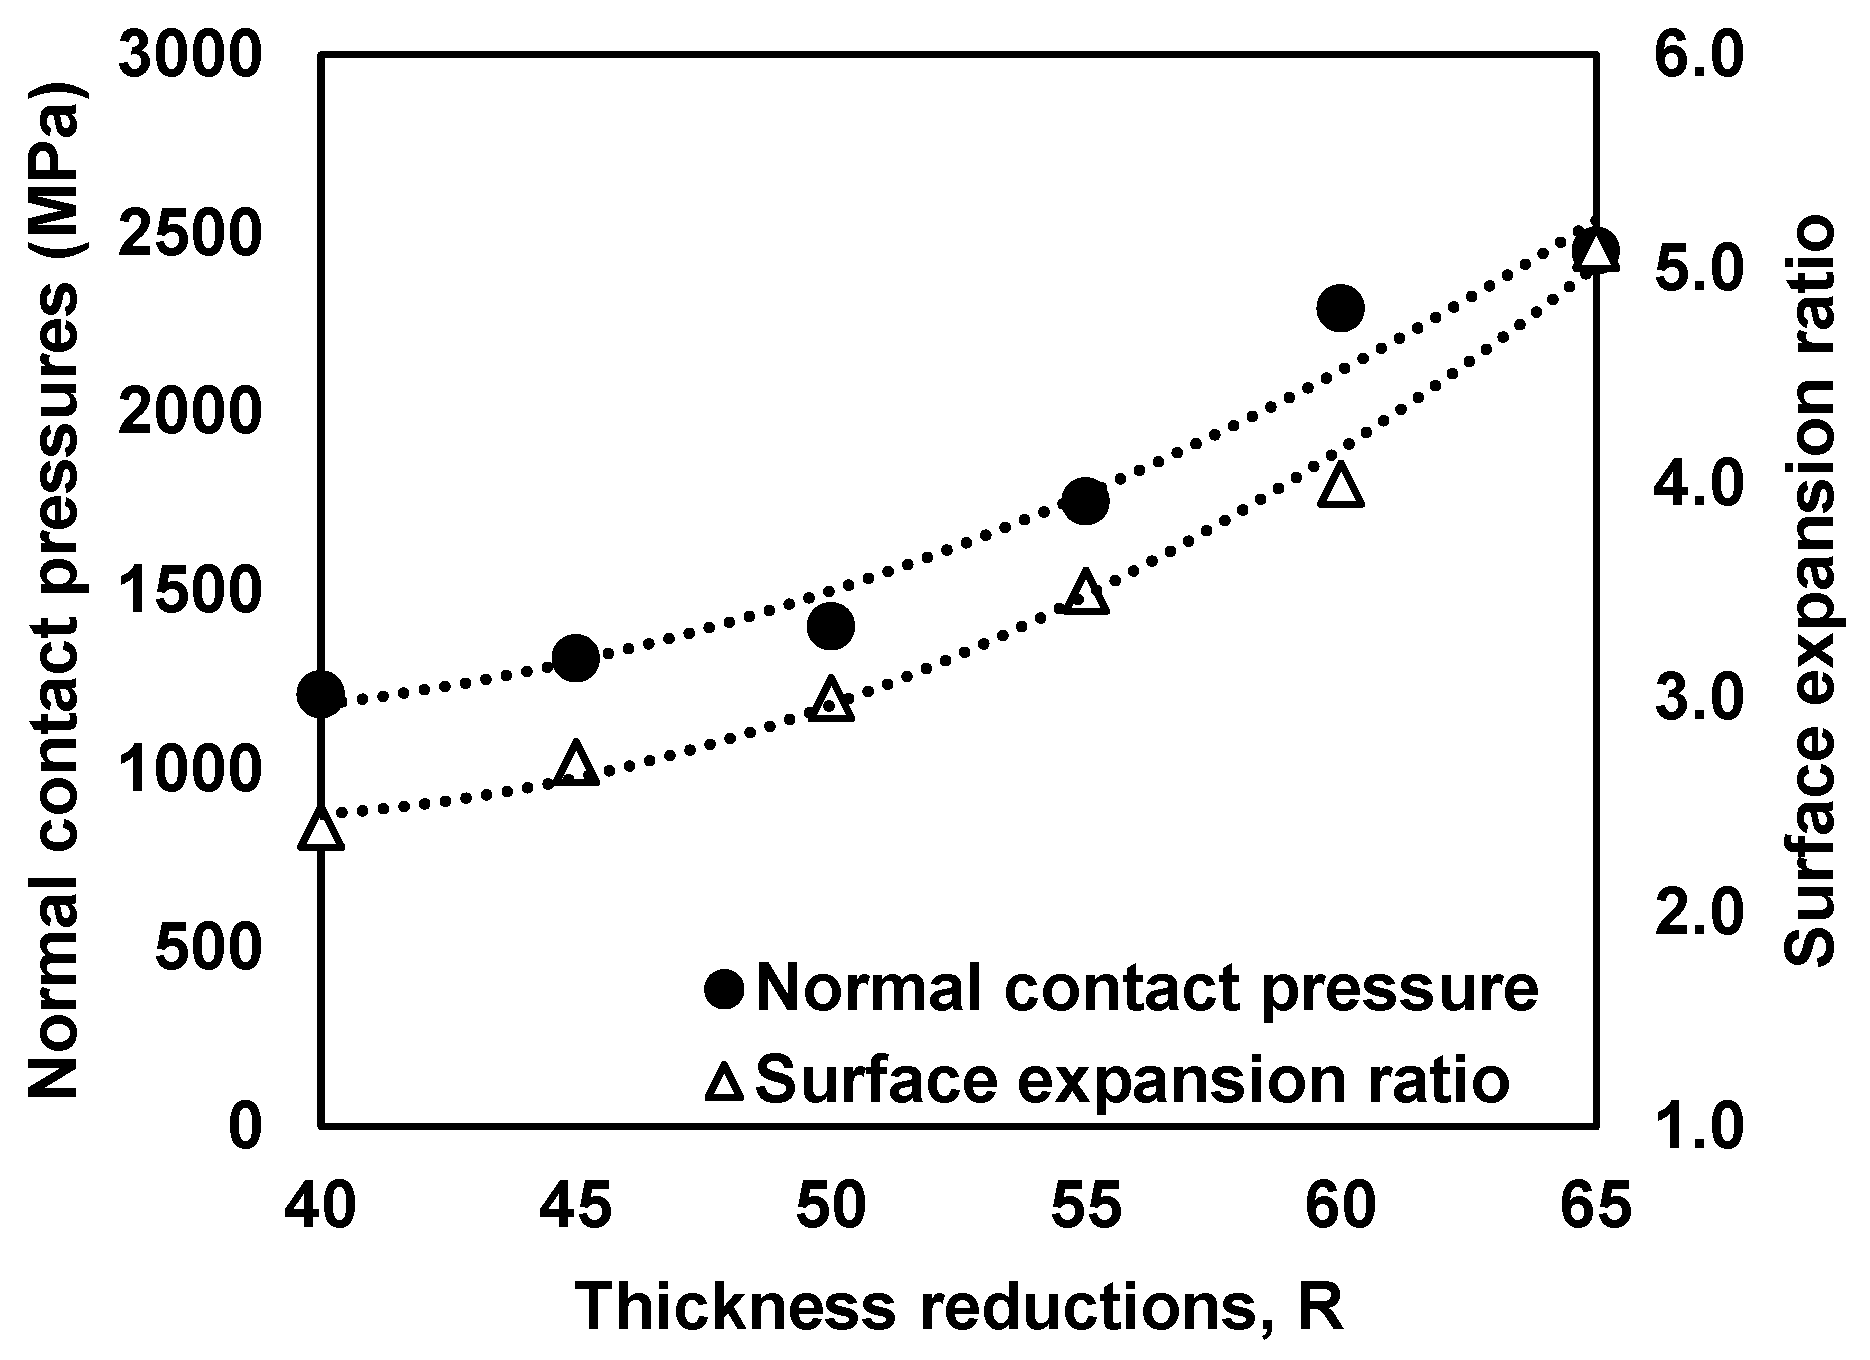
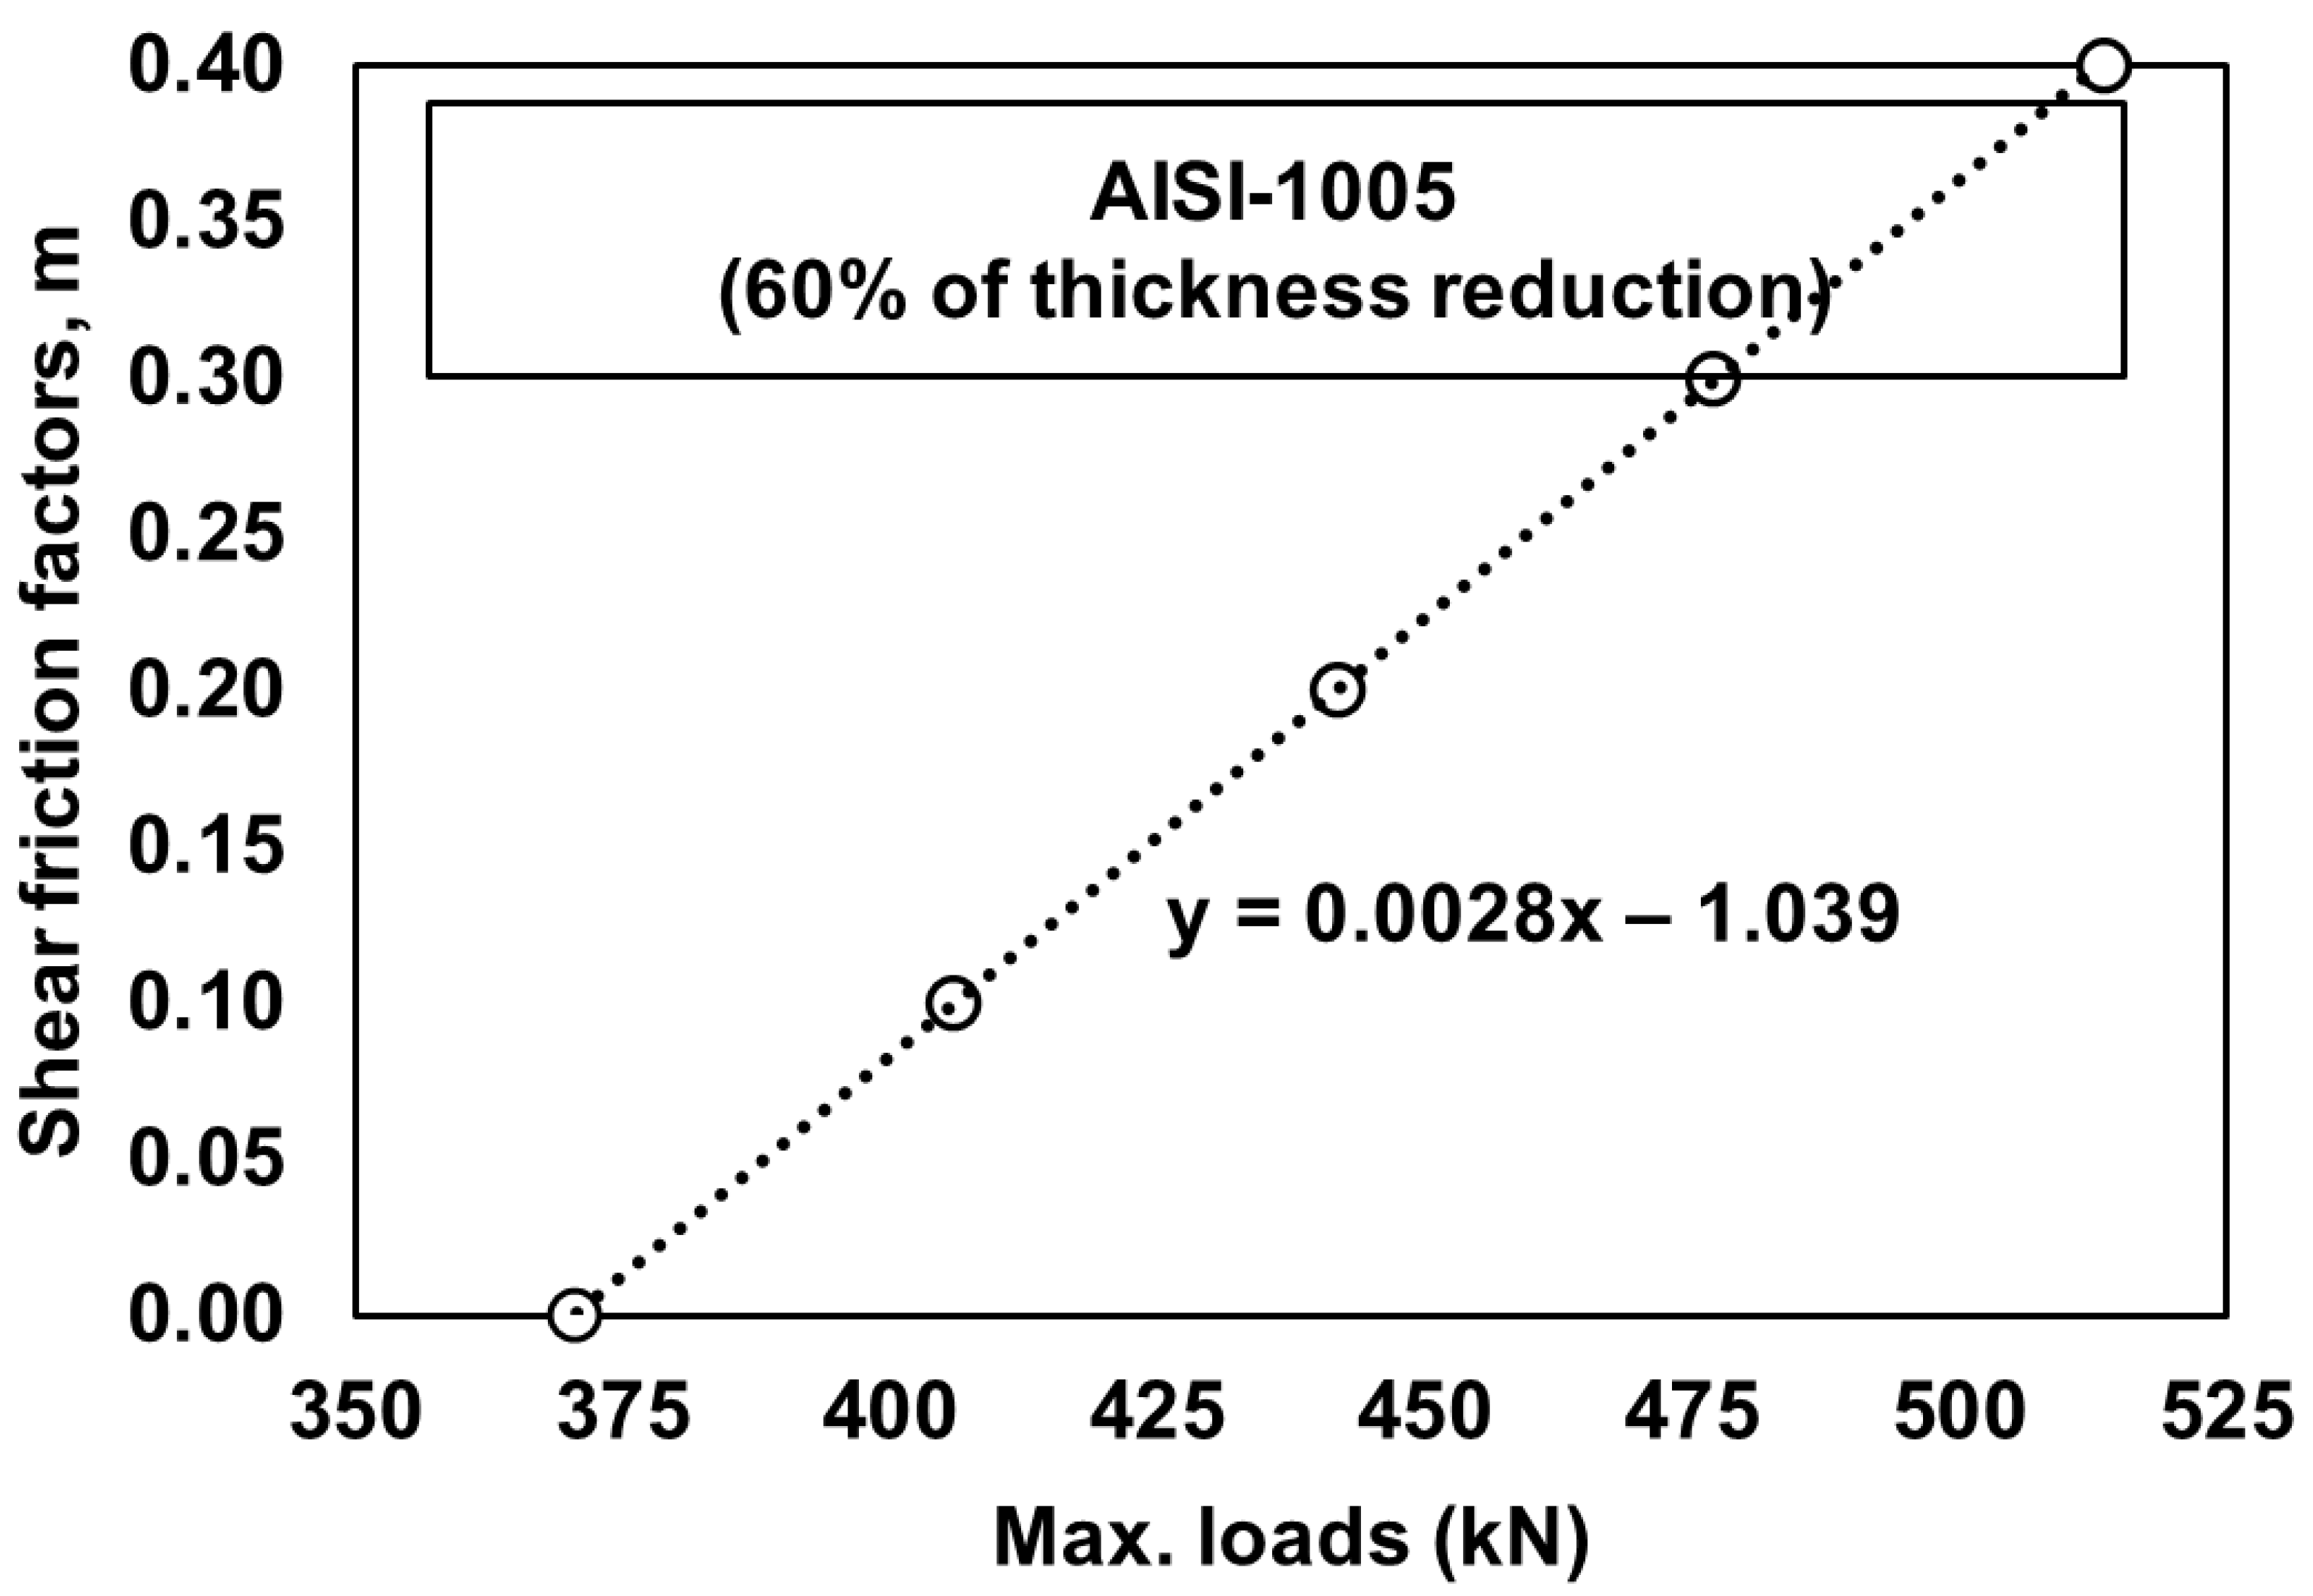
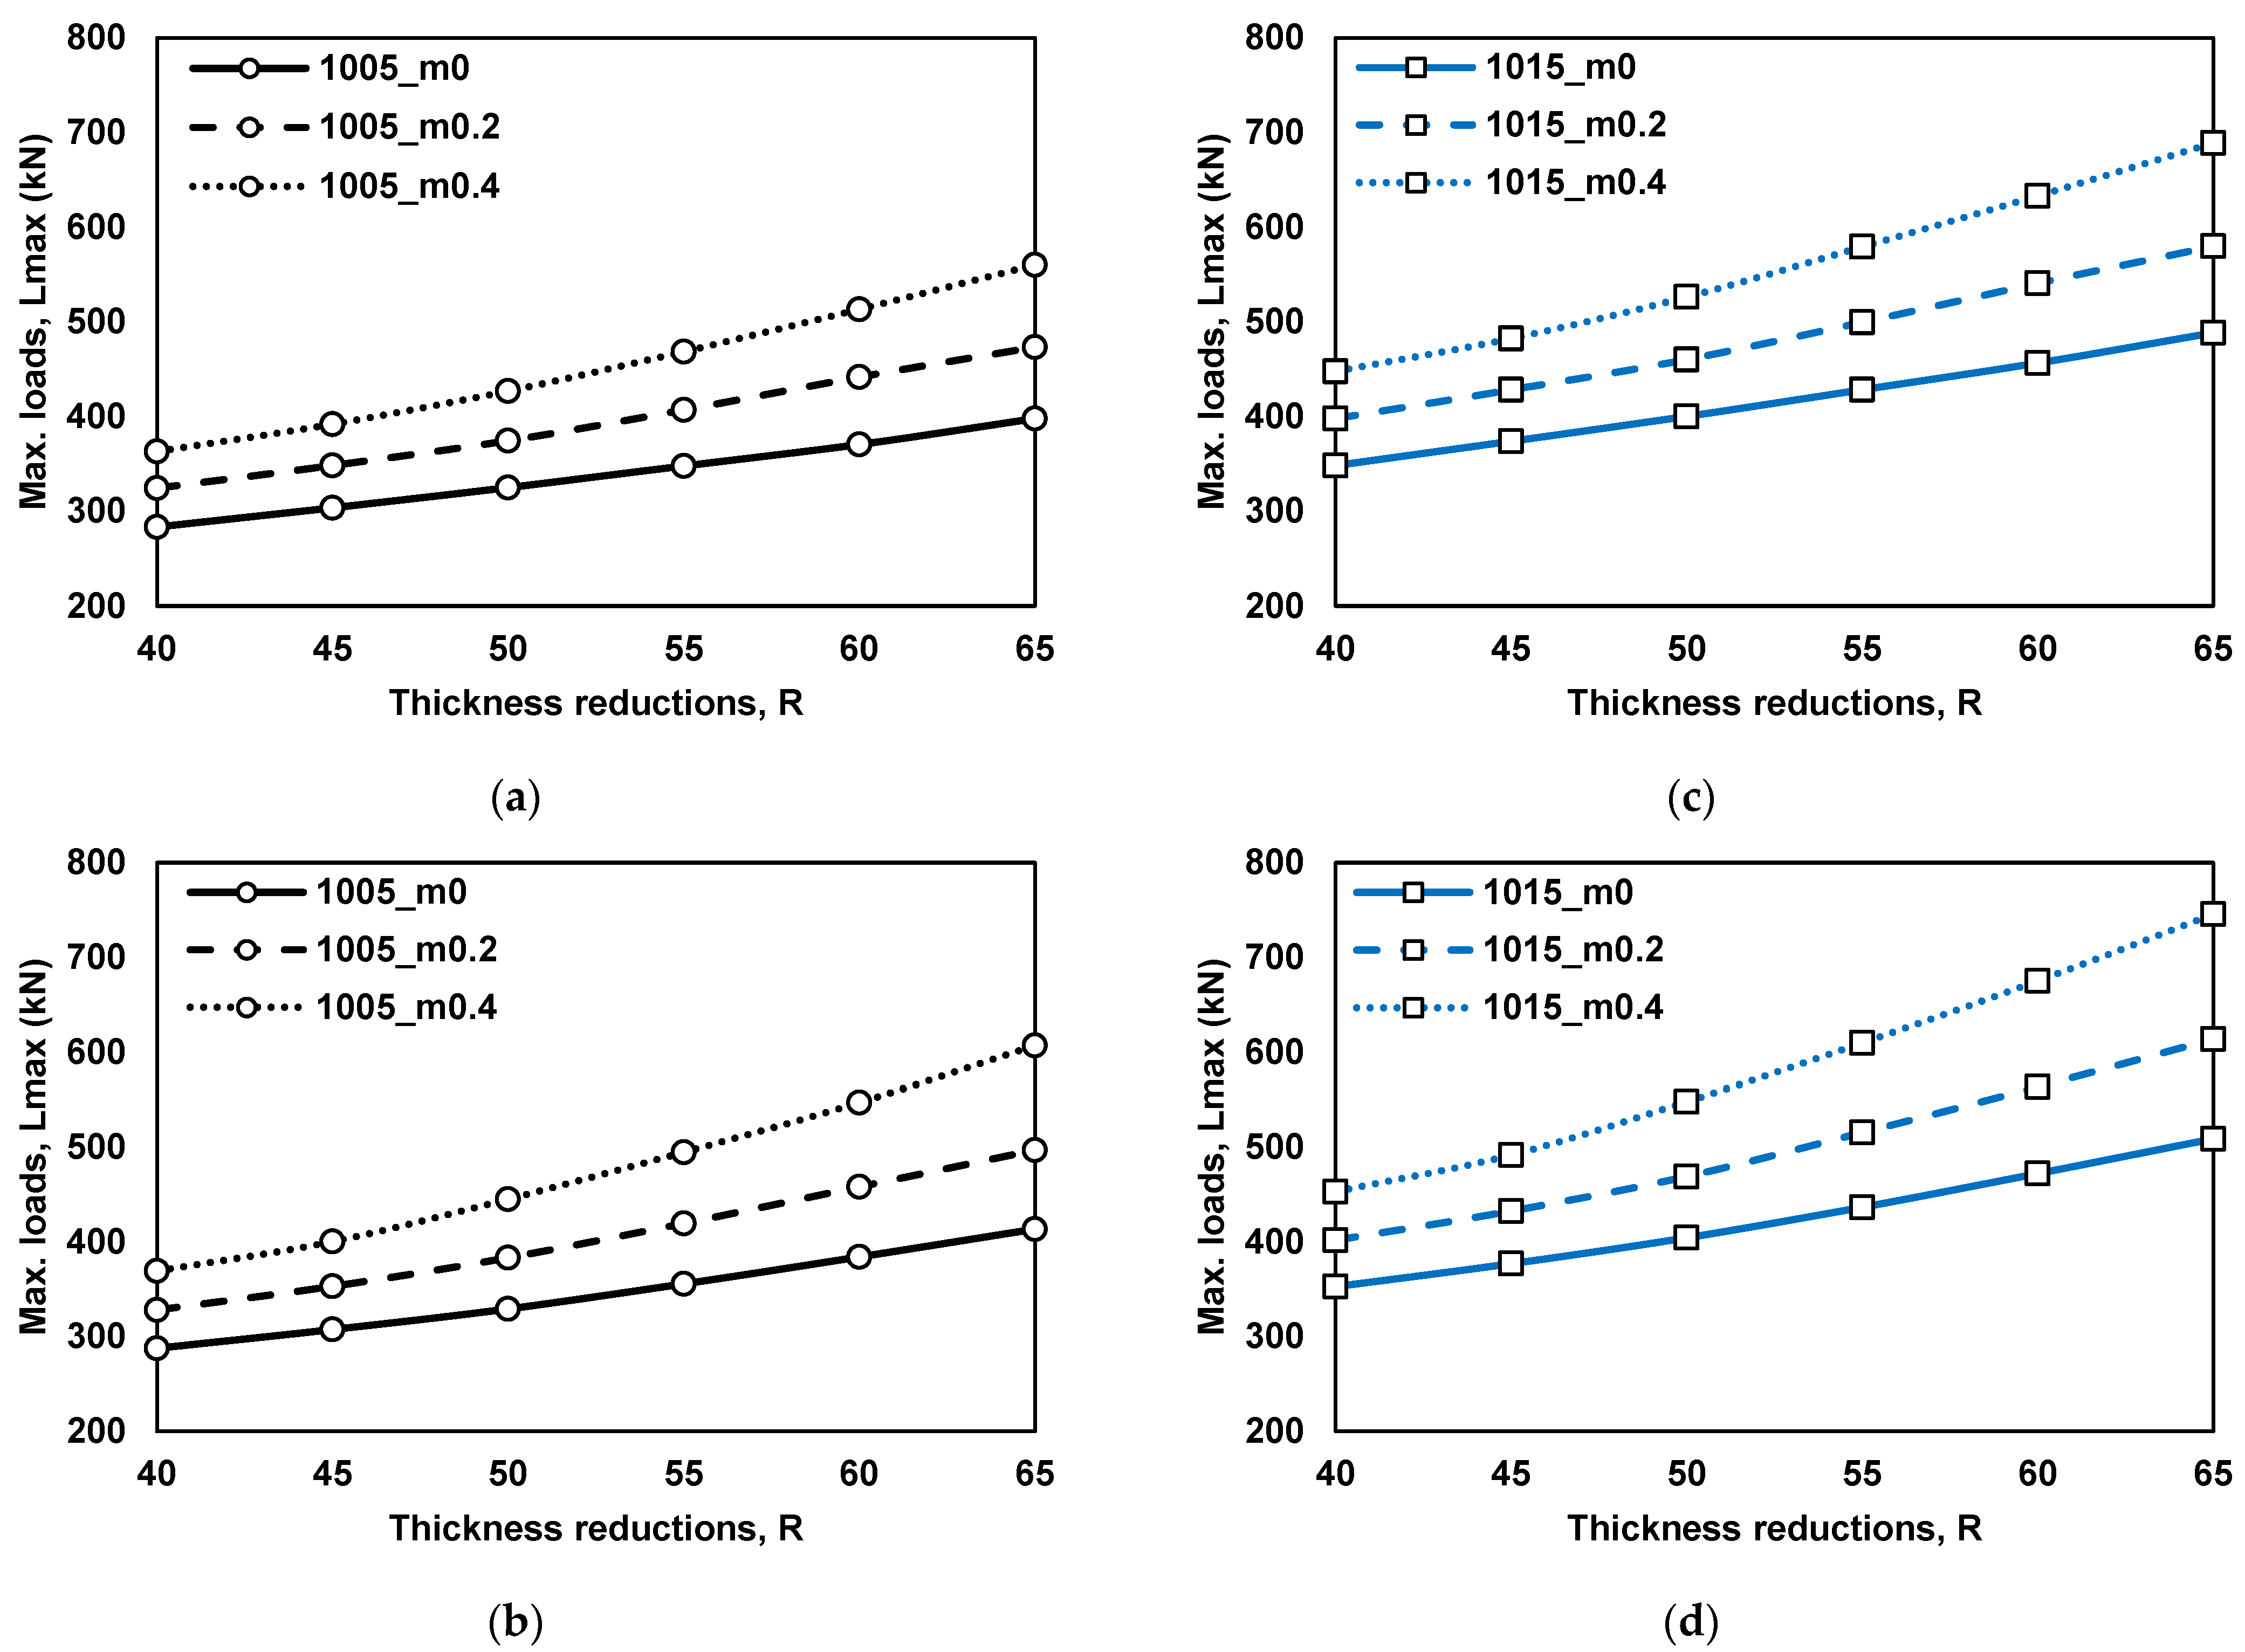
4.1. Effect on the Maximum Load (Lmax)

As shown in Table 1, various BIT simulation models were simulated to predict the testing results. The maximum load comparison is shown in Figure 8. The maximum loads of AISI-1015 were higher than AISI-1005 under the same testing conditions. In addition, the load increased when the thickness reductions and friction values increased. Moreover, the different interpolation techniques of the stress–strain curves also had an effect on these loads.
From the stress–strain curve in Figure 4, the curves of the two techniques were similar only at low strain levels (<0.6). Therefore, the loads from the simulation were almost the same level. For high-thickness-reduction conditions, the loads obtained from the power-law interpolation technique were significantly higher than those of the linear interpolation technique because the calculation depended on the stress level obtained from the stress–strain curve. At large strain levels, the stress values from the power-law interpolation technique were higher.
Both materials presented the same tendencies in the maximum loads. This can confirm that the original FCC, the m-Lmax curve, was not universal because the loads greatly depended on the material properties and thickness reductions.

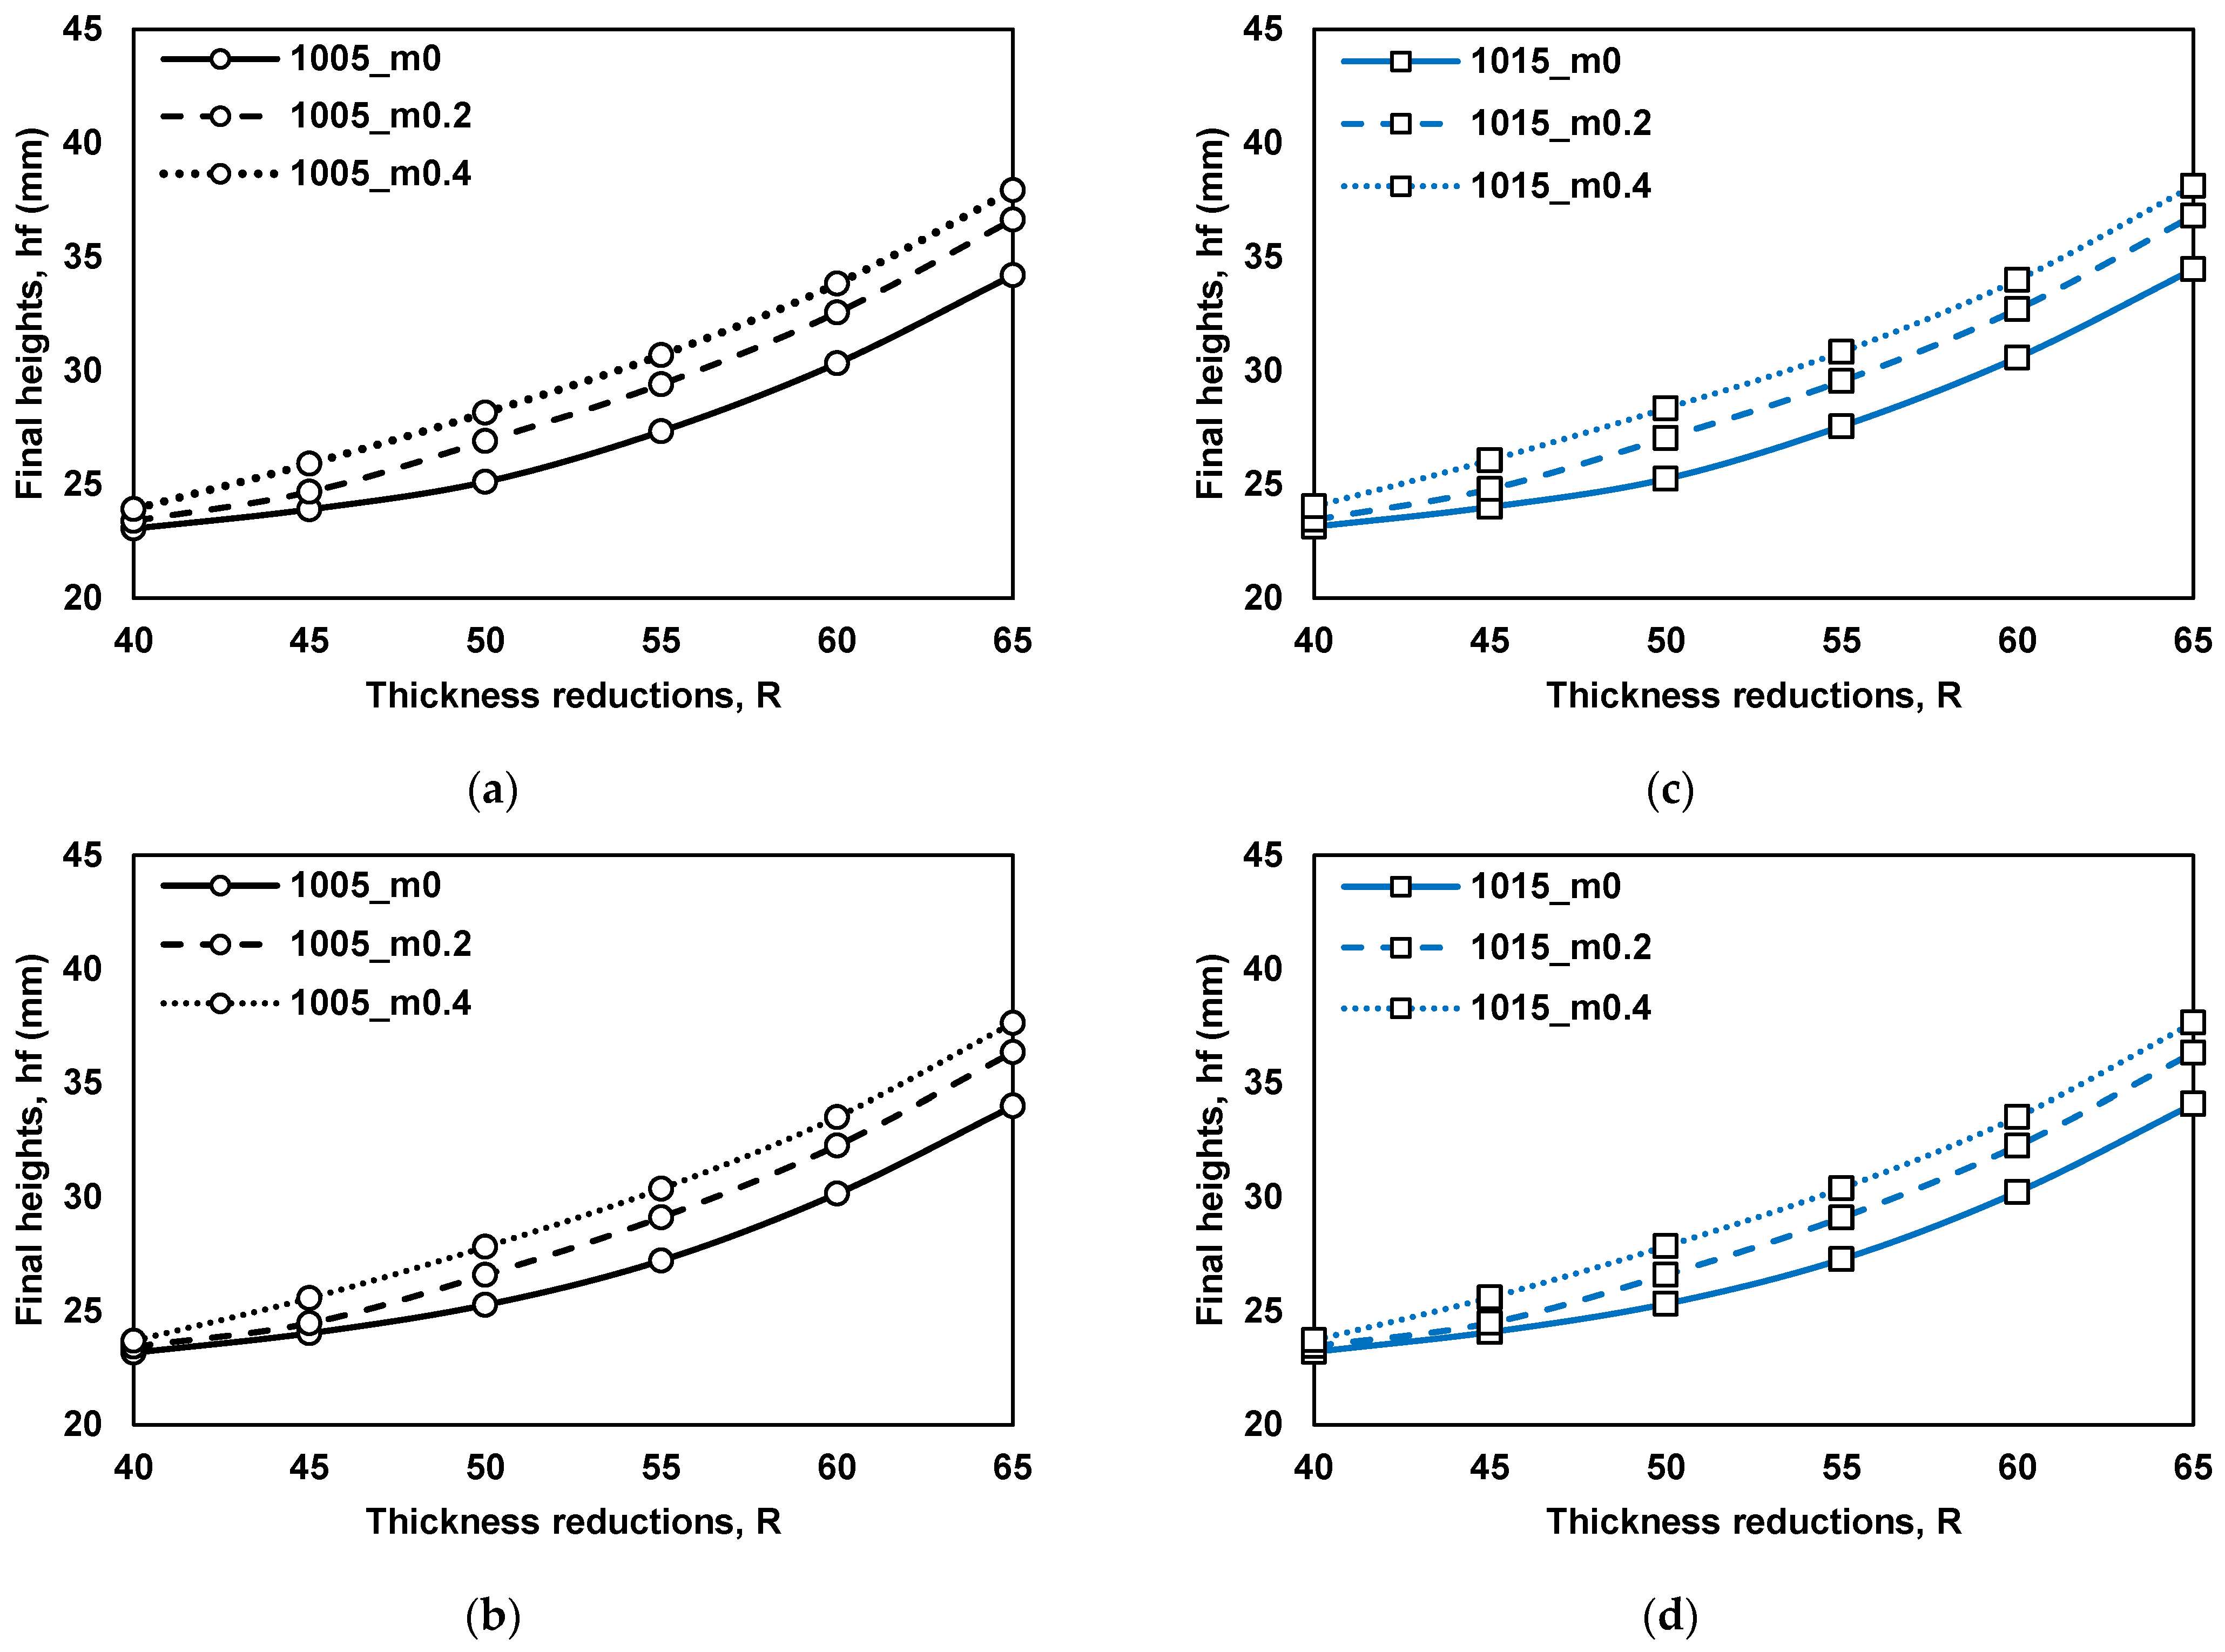
4.2. Effect on the Final Height (hf)

Under the same testing conditions, different materials also provided the same level of final heights because the volume of specimens was constant. The stress–strain curve interpolation techniques had no effect on the final height of the specimen, as seen in Figure 9. The shape and dimensions of the specimen were mainly controlled by the levels of thickness reductions (R).
In addition, the heights slightly increased when the friction values were increased in the case of the high thickness reduction conditions. This height deviation was caused by the edge deformation when the thickness of the thick sheet was reduced.

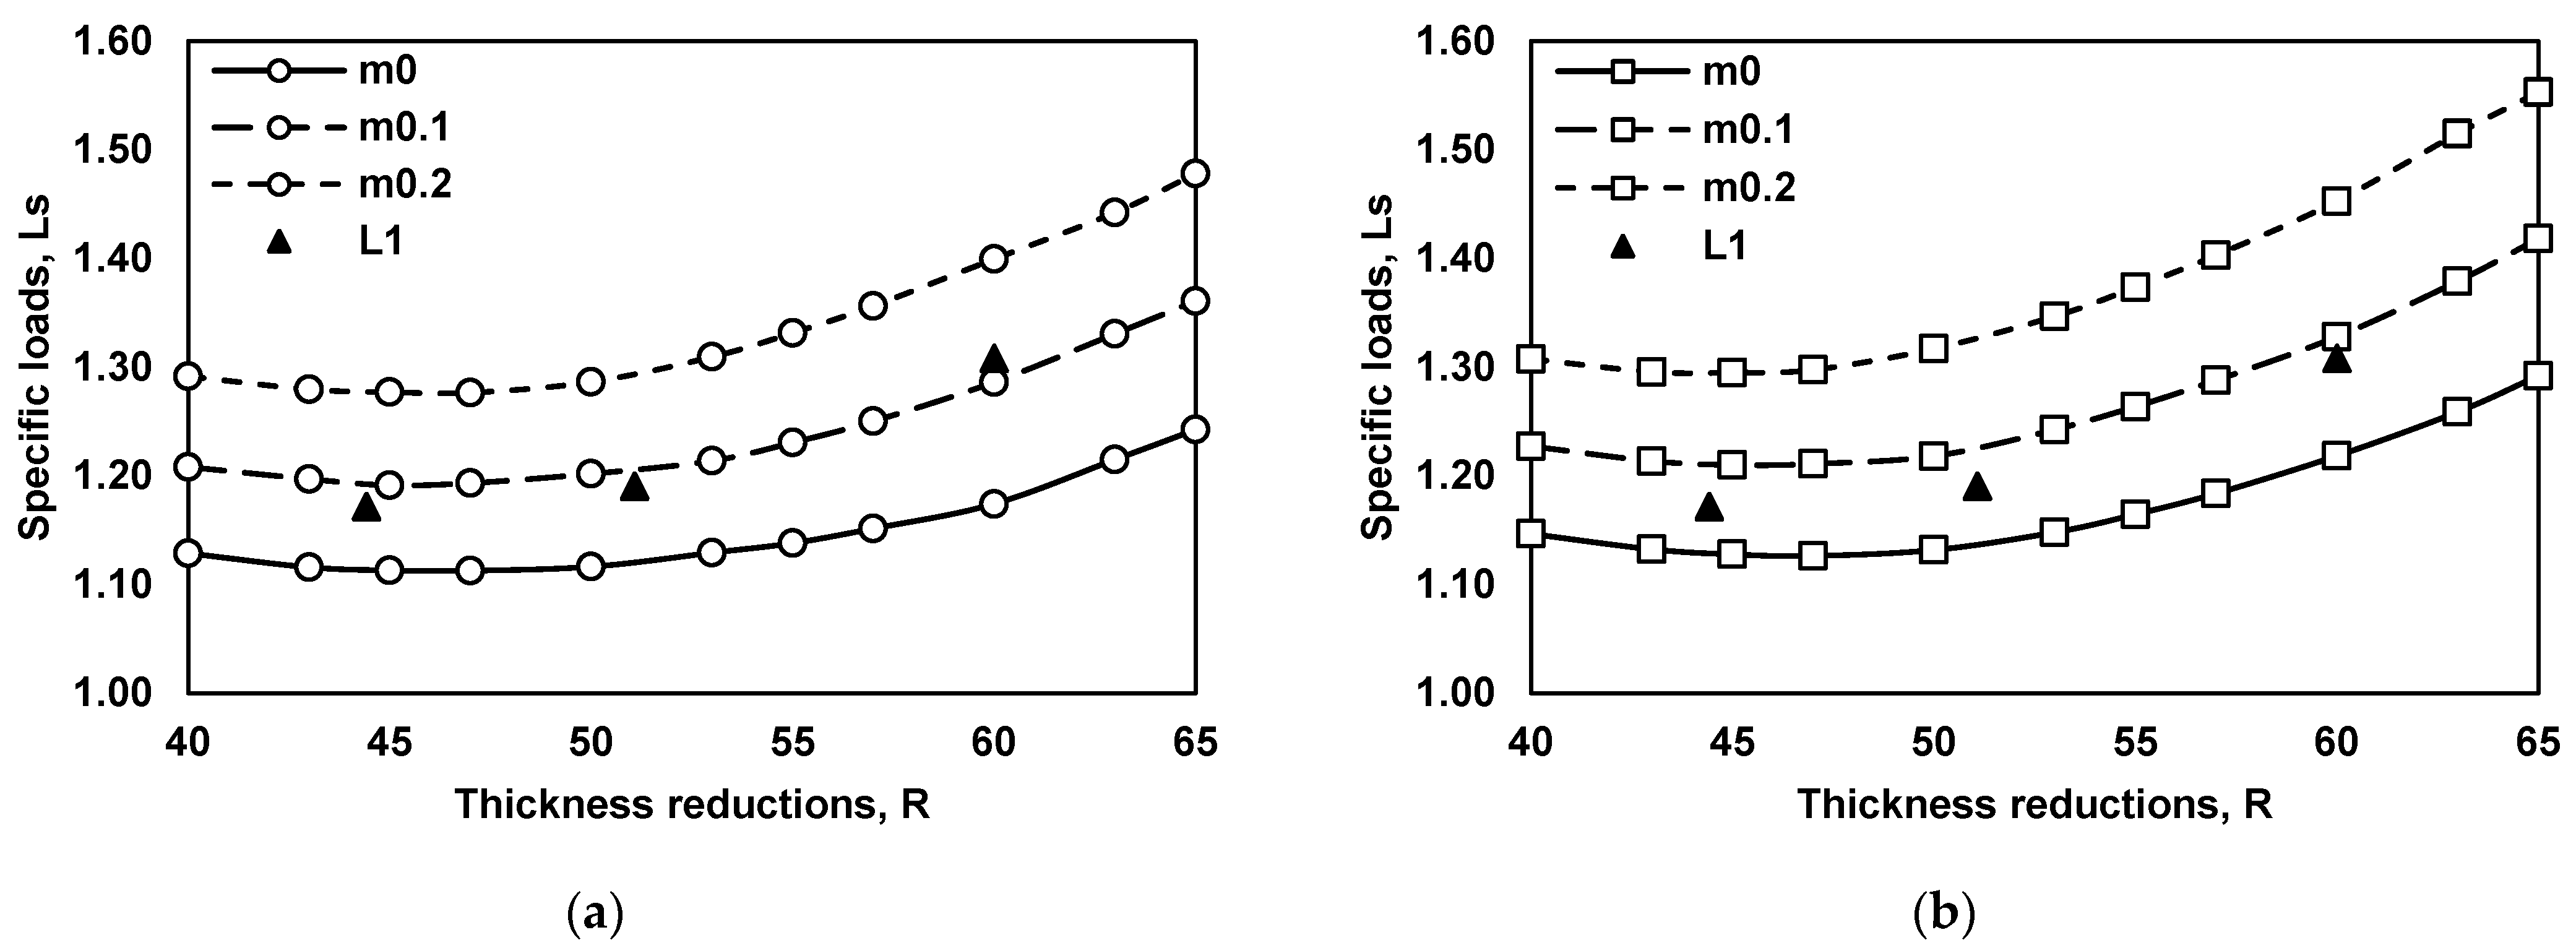
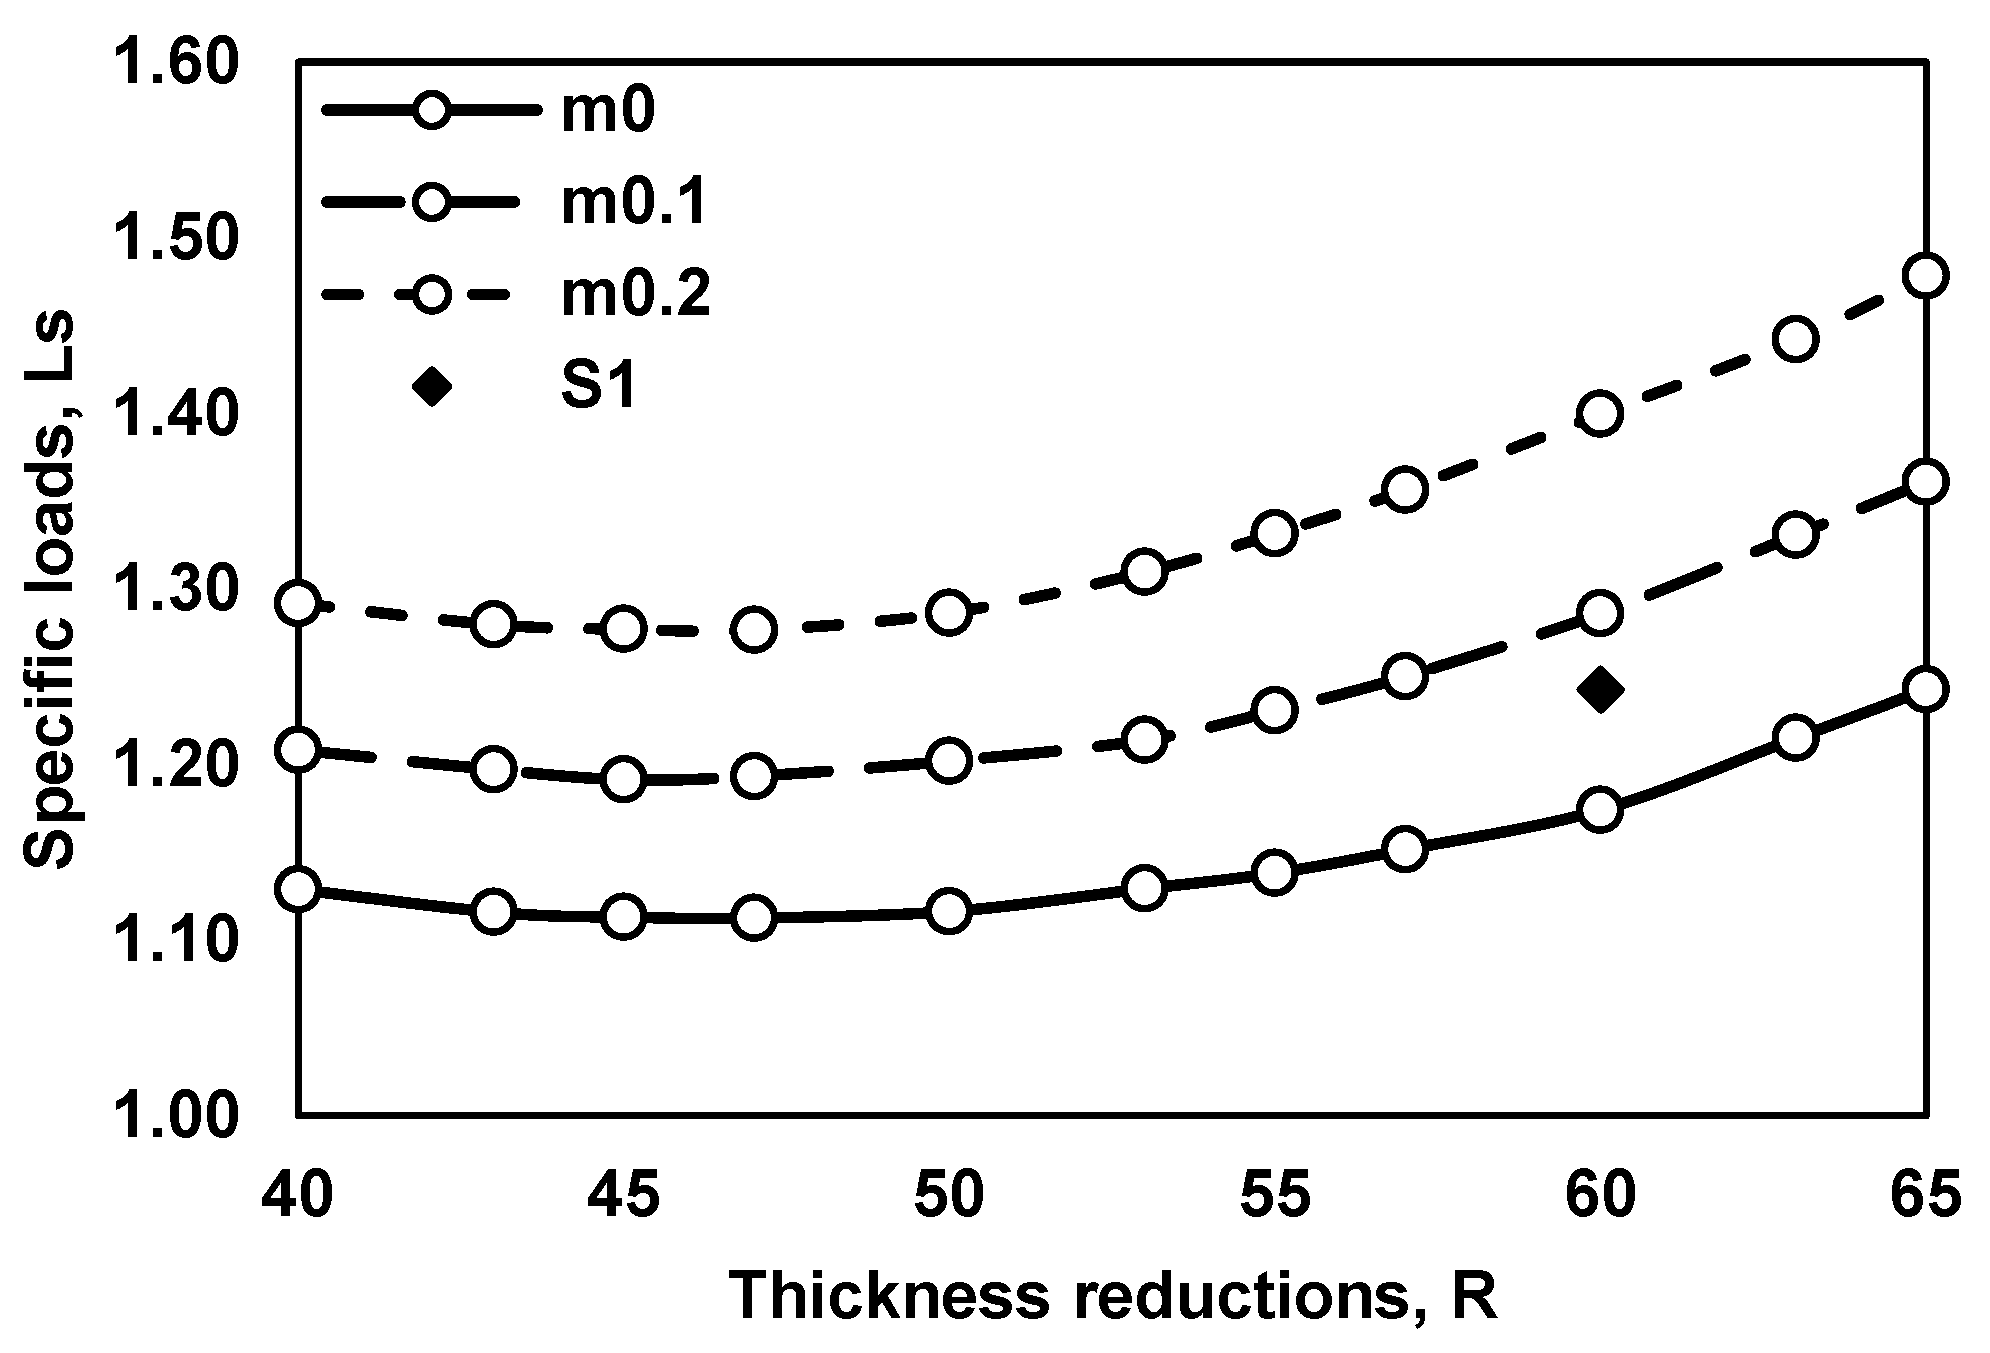
5. Development of Universal FCC

The relationship between the specific loads and thickness reductions under different friction conditions, the Ls-R curve, was developed as the new FCC of this test. The specific loads obtained from the different materials were the same values in all testing conditions of the thickness reductions and friction levels, as seen in Figure 10. This means this dimensionless parameter can be used as a new friction indicator instead of the maximum load.
However, the representative stresses and stress–strain curve interpolation techniques still had an effect on this universal FCC. Using Equation (1), the representative stresses ( σ ε i ) from the low strain levels will provide low values of ideal forces. Consequently, the levels of Ls will also be high. In this study, the specific loads based on the stress at ε 0.3 . were the highest levels compared to the others. Two interpolation techniques also showed the same tendencies.
In Figure 10a–c, with the linear interpolation technique, the specific loads based on strains of 0.6 and 3 were almost the same because of the same stress levels on the extrapolation line, as seen in Figure 4. For the power-law interpolation, increasing the strains will sharply increase the levels of σ ε i . As a result, the specific loads were significantly decreased under the large strain conditions, as seen in Figure 10d–f.
The friction sensitivity parameters ( λ ) of these Ls values were calculated by using Equation (2). The comparison is shown in Figure 11. It was used to select the suitable condition of the universal FCC from Figure 10. The results showed that the friction sensitivities of the specific loads based on different σ ε i conditions presented the same responses. Thus, each σ ε i condition can be selected as the suitable universal FCC for the BIT. Moreover, the λ based on the power-law interpolation performed similarly to the results obtained from the linear interpolation.
Therefore, the gradient of the Ls values on the FCC under different friction conditions was used as the criterion for selecting the suitable universal FCC. The distinct distribution of the specific loads on the FCC occurred in the conditions using σ ε i at the strain of 0.3, so it was selected in this work. Finally, the suitable universal FCCs based on the two techniques of the stress–strain interpolations are shown in Figure 12.

6. Experiment and Discussion

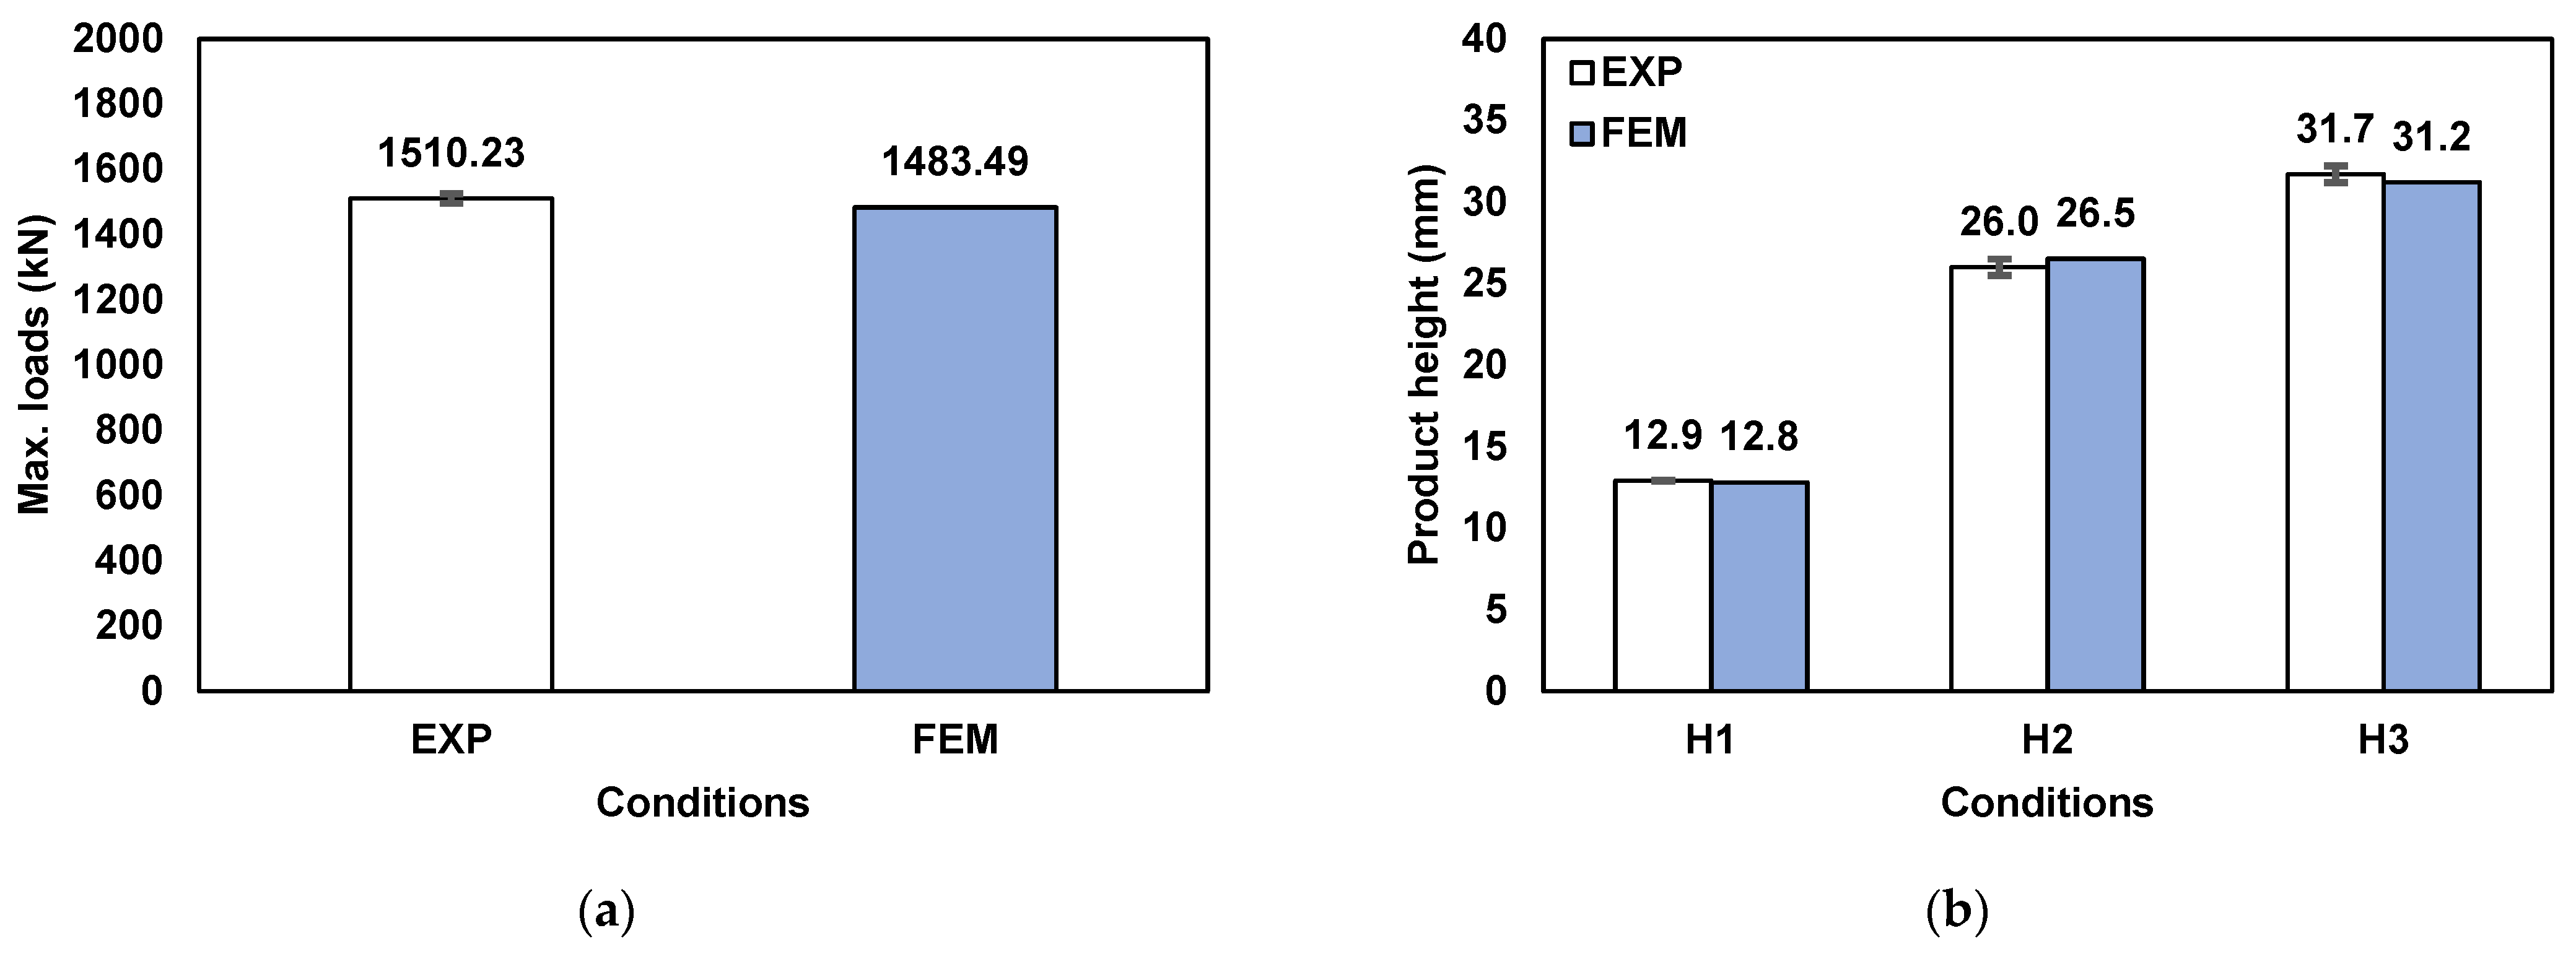
6.1. Validation of Universal FCC

The BIT experiments were conducted under the defined testing conditions. The material was AISI-1005, the thickness reductions were varied, and the lubricant was the forming oil L1. It was applied on both surfaces of the specimens by brushing. The volume of the lubricant was controlled at 5 mL per surface. The specimens before and after the test are shown in Figure 13. The maximum loads were measured and then used to calculate the specific loads.
The results are shown in Figure 14. By plotting the Ls values on the FCCs, the friction values could be determined. The averaged m values from the two interpolation techniques were compared, as seen in Figure 15. The m values obtained from the linear interpolation were higher than those obtained by the power-law interpolation. At the low thickness reduction condition, they were slightly different between the two techniques because the FCCs provided almost the same levels of the specific loads on the FCCs. However, a high deviation in m values was found in the condition of the high thickness reduction due to the different specific loads on FCCs calculated from the two stress–strain curve interpolation techniques.
To validate the results, these m values were input into the BIT simulation models to predict the testing results. The calculated load and final height were compared with the experimental results. Information on the flow stress of the material and interface friction was used for load calculation in FEM software. The total forming load came from the combination of deformation force and friction force. From the simulation results, the load predictions using m values obtained from these two FCCs can provide the same level of maximum loads as the experimental results. The comparison is shown in Figure 16a. In the case of the power-law interpolation technique, it also provided low m values, but its stress–strain curve was higher than the other technique.
For the height comparison shown in Figure 16b, the high friction value provided a high level of specimen height. The prediction showed that the m values obtained from the FCC based on the linear interpolation can be used to predict the final height of the specimen. The results were closer to the experiment than those of the power-law interpolation technique. Moreover, the tip shapes of these specimens were compared, as seen in Figure 17. The shapes of the tips with two friction values obtained from the different flow stress interpolations are different. The slope was higher in the case of m0.12. This indicates that not only do different flow stress interpolations play a significant role in the degree of the friction values but also the material flow, especially for the shear friction law. As mentioned before, the shear friction model was highly dependent on the maximum shear stress of the material, which will directly influence the flow stress interpolation techniques. According to Figure 17, the linear flow stress interpolation provided the best fit when compared with the power-law interpolation. It was confirmed that the m value obtained from the FCC based on the linear interpolation technique can be used to predict the final shape and dimensions of the testing specimens.

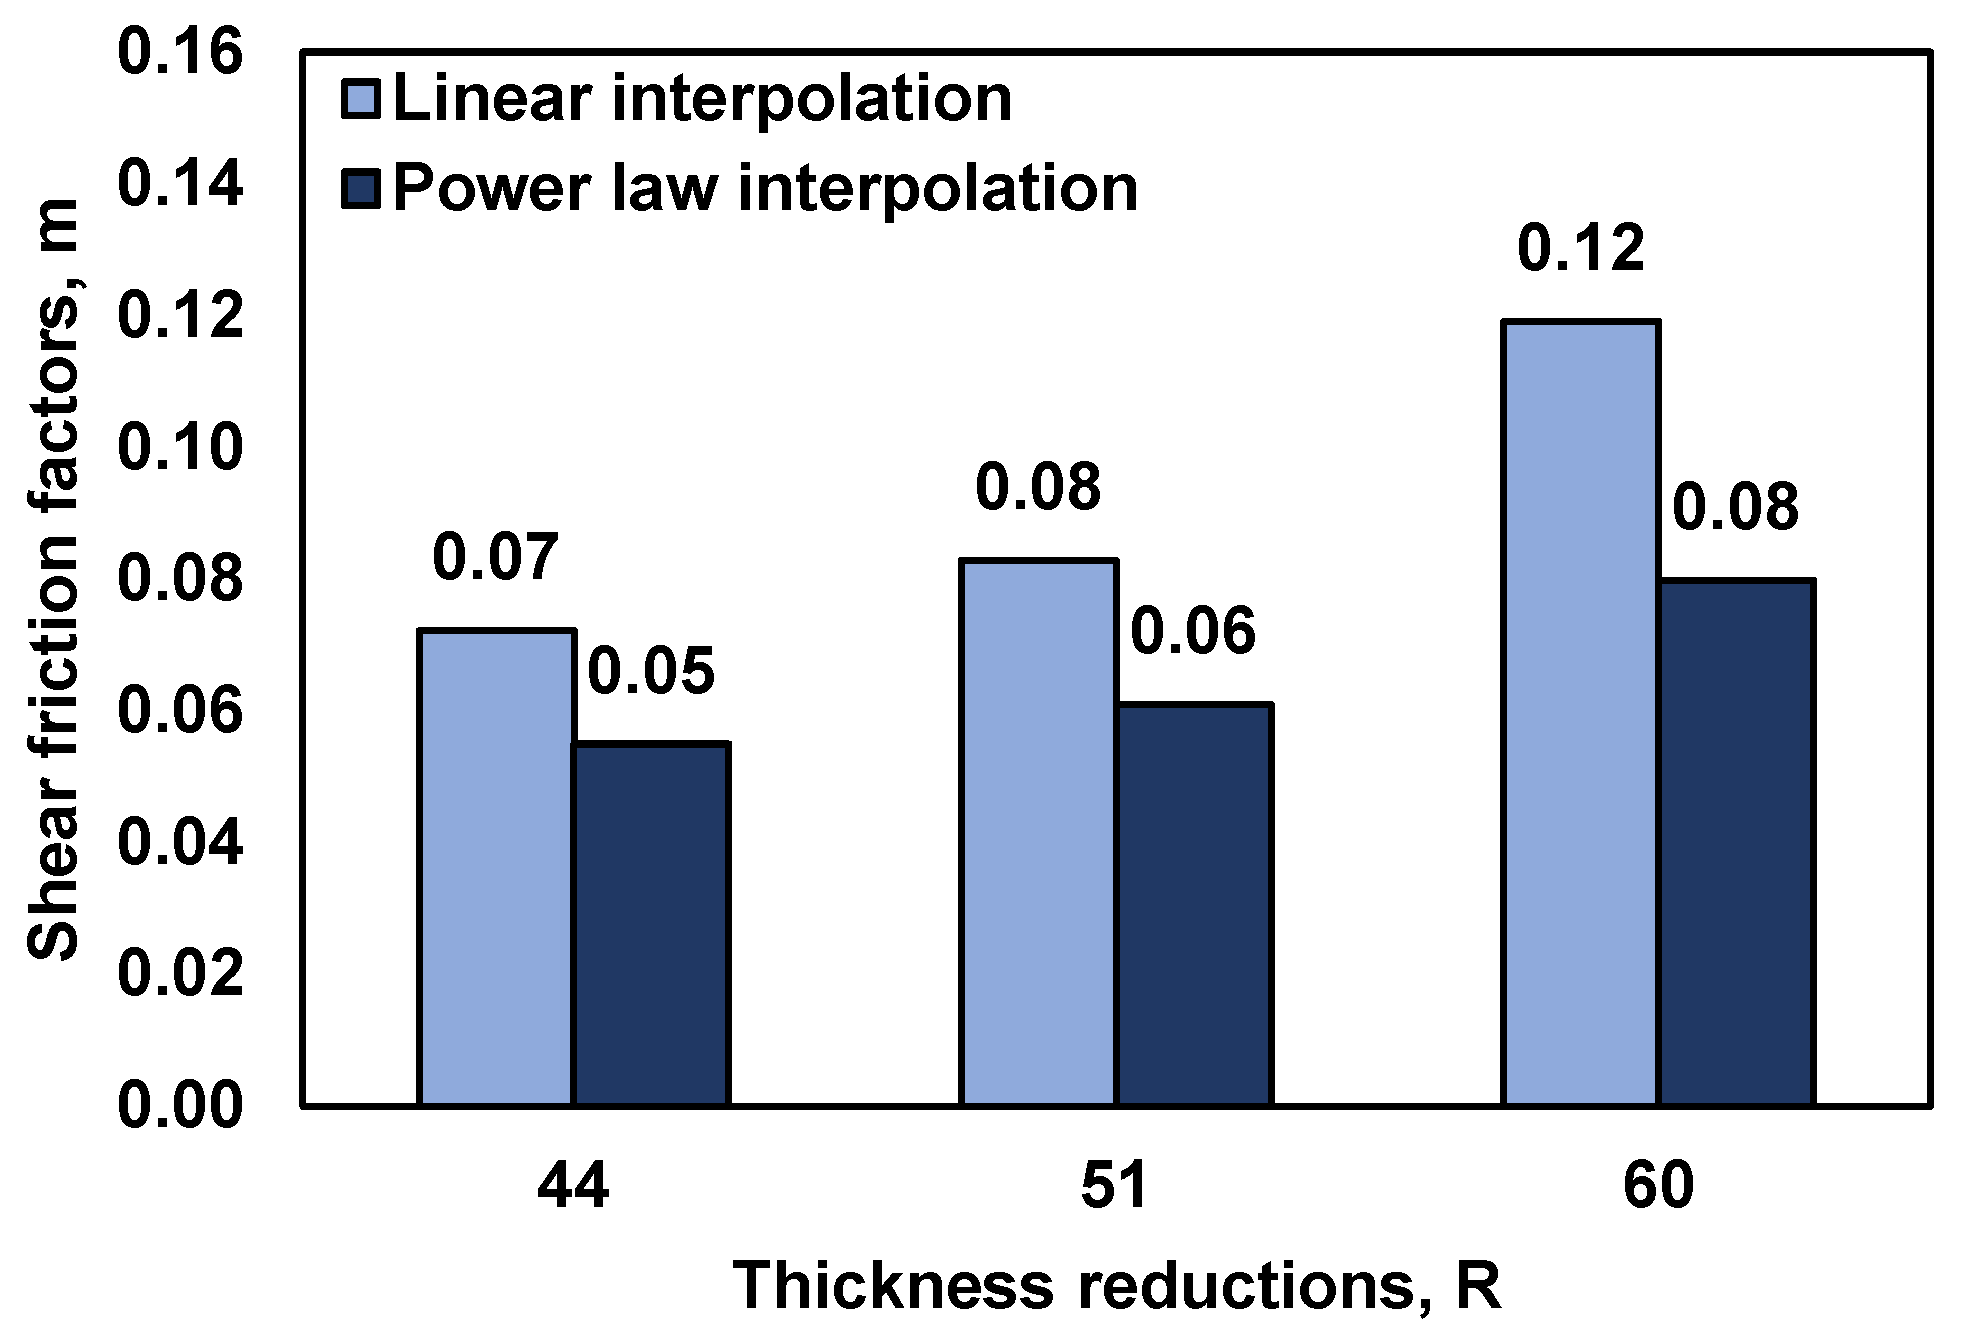
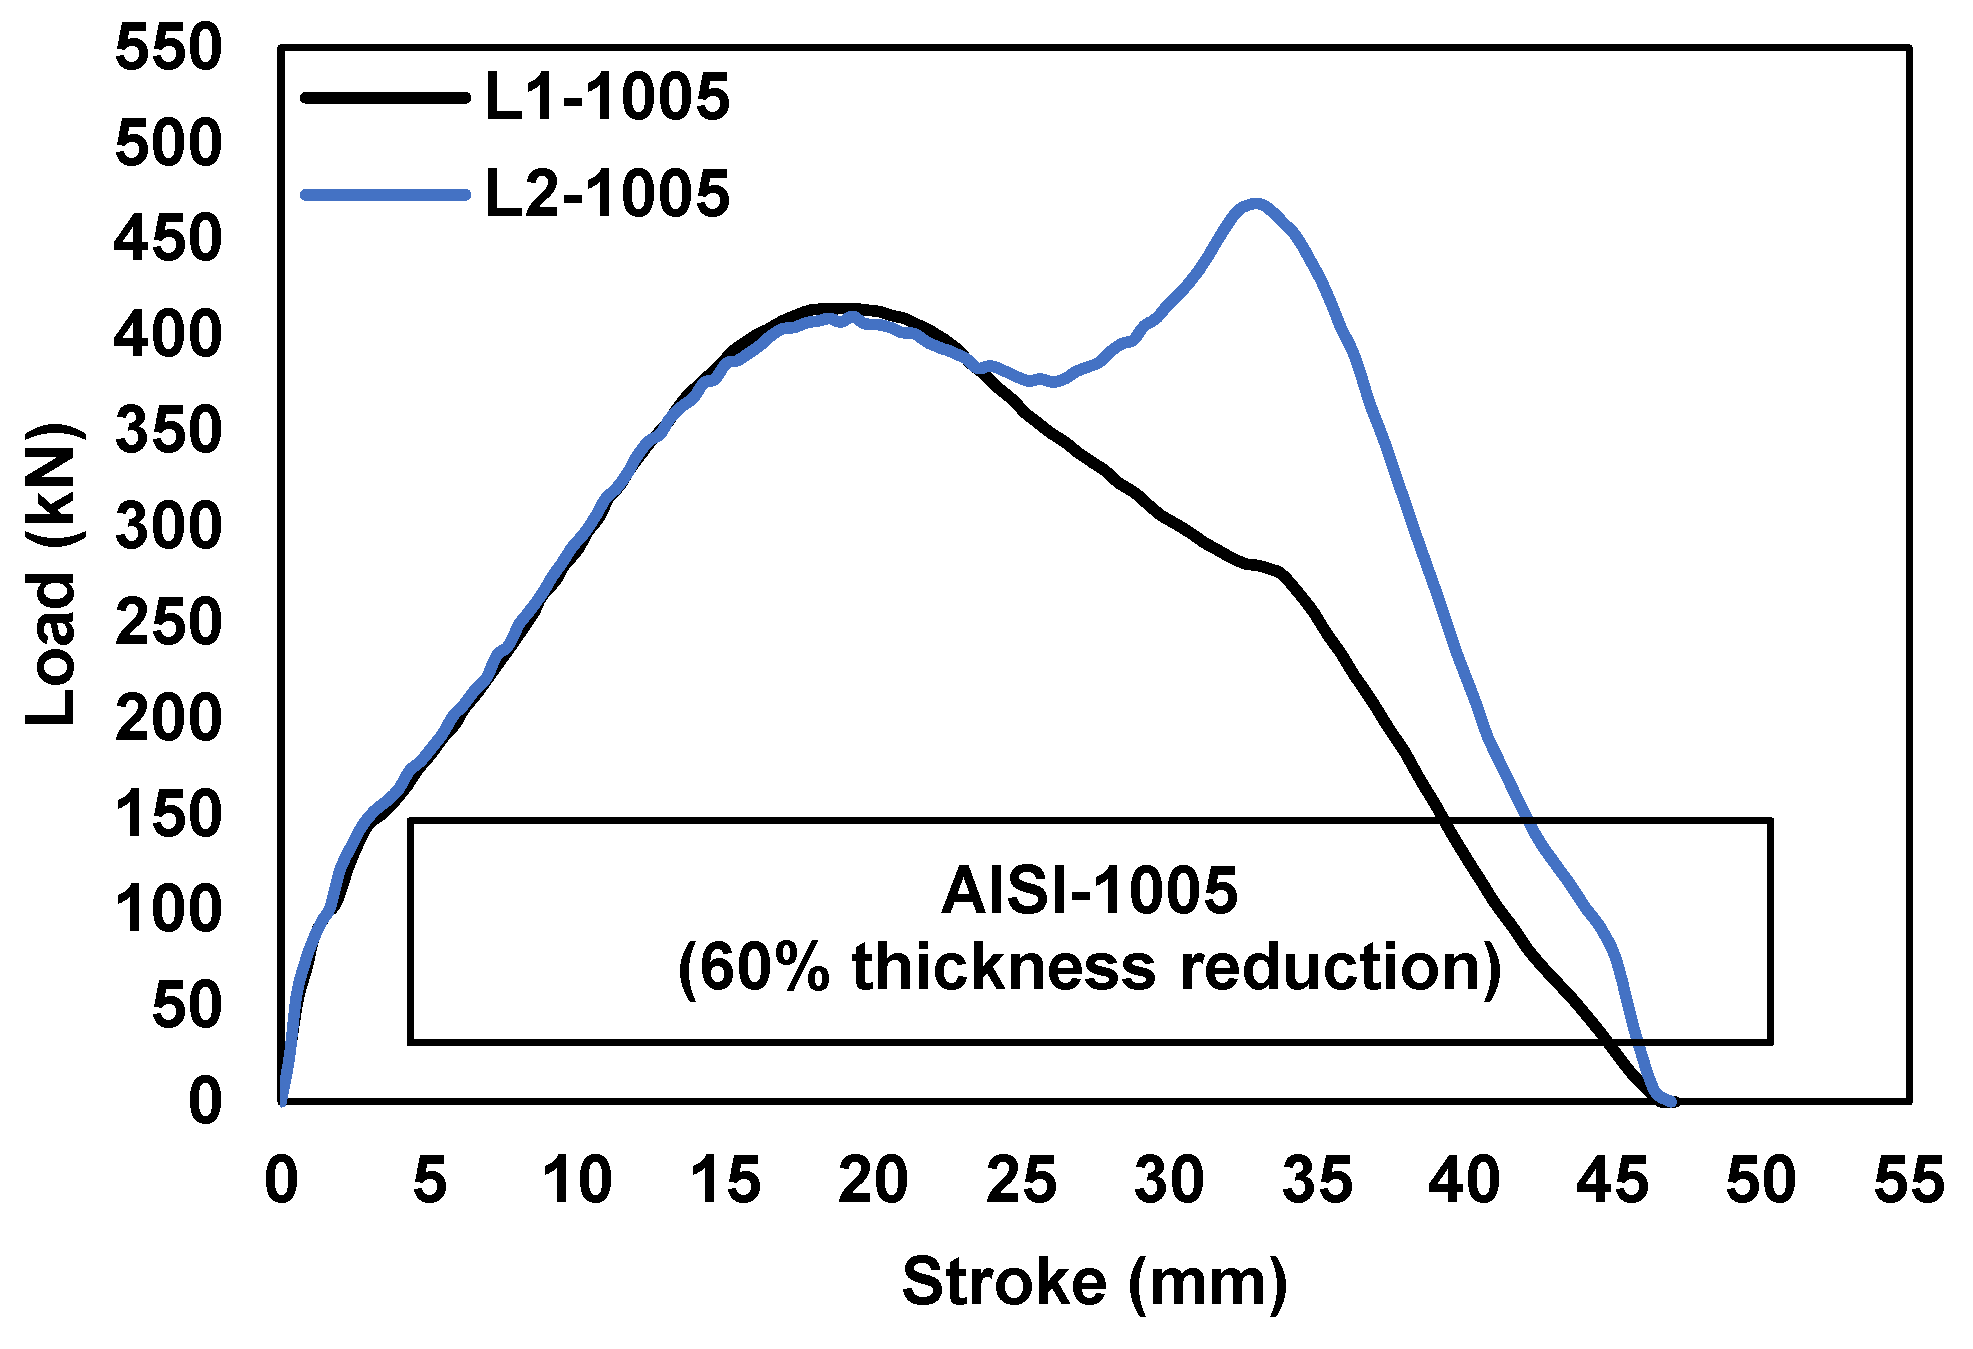
6.2. Friction Evaluation under Different Testing Conditions

The universal FCC was used to approximate the shear friction factors (m) of the various testing conditions. AISI-1005 and AISI-1015 were tested under three levels of thickness reductions. Two forming oils, L1 and L2, were used as the lubricants.
The maximum loads were measured and calculated as the Ls values plotted in the universal FCC based on the linear interpolation method. In Figure 18a, the forming oil L1 could not be used to form the specimen at the conditions of AISI-1015 and R60. The high-strength material allowed high normal contact pressure during deformation. It also increased when the thickness reduction was increased. Therefore, the forming oil L1 cannot withstand such severe conditions. This was clearly seen in the conditions of the forming oil L2, which had a low level of viscosity. It can only be formed in the condition of R44, as seen in Figure 18b. Forming defects and wear occurred on the die and specimen in unsuccessful conditions, as shown in Figure 19.
From the FCC, the m values of these testing conditions were evaluated and compared, as shown in Figure 20. AISI-1015 provided a high level of m values in all success testing conditions. This test cannot be used to evaluate m in unsuccessful conditions. When wear occurred, it had a significant effect on the testing load, as shown in Figure 21. The load sharply increased during testing because of the metal-to-metal contact.
Not only the friction evaluation but also the BIT with the universal FCC can be used to determine the performances of interesting lubricants. In this experiment, the performance of the forming oil L1 was better than L2. Lubricants with a high level of viscosity can be used in severe forming conditions. The Ls values, working together with the universal FCC, can be used to distinctly rank the lubricant performances.

6.3. Friction Evaluation in Thick-Sheet Ironing Process for Pulley Manufacturing

The BIT with the universal FCC was employed to approximate the shear friction factor under real tribological conditions in the actual forming process of the pulley. The testing condition with R60 was selected because it can duplicate the same level as the process conditions of the actual work. The maximum effective strain was around 2.1, and the surface expansion ratio was around 4.2. For specimen preparation, the solid lubricant S1, Zn-Ph coating, was applied on the specimen surfaces.
From the Ls value calculated from the experimental results, the m value of this condition was determined as 0.06, as seen in Figure 22. It was input into the simulation model of pulley forming to predict the forming results. The load comparison showed that the load obtained from the calculation was slightly lower than that obtained from the experimental results, as seen in Figure 23a. It was less than 2% for load deviation. Moreover, the heights of the pulley shown in Figure 6b were measured and compared with the simulation. All dimensions of the heights were almost the same as the measurement data, as seen in Figure 23b. It can be confirmed that the BIT with the universal FCC can be used to evaluate the tribological conditions in the actual thick-sheet ironing process.

7. Conclusions

  • A dimensionless specific load (Ls) was proposed as a new friction indicator for the BIT. It can eliminate the effect of material properties when different materials are used.
  • The universal FCC, the Ls-R curve, was developed by using the relationship between the specific loads and thickness reductions under different friction values.
  • The BIT with the universal FCC was used to determine the shear friction factor in the actual tribological conditions of the thick-sheet ironing process. The average shear friction factor (m) was determined as 0.06. For validation, this friction value was input into the FEM simulation model to predict the forming results. The forming load and dimension of the product from the simulation were in good agreement with the experimental results. The deviations in load and dimension were less than 2%.
  • The ball ironing test with the newly developed FCC is recommended for determining the friction value of the thick-sheet ironing processes.

Author Contributions

Conceptualization, N.S.-e., S.O., V.P. and Y.A.-u.-l.; methodology, N.S.-e. and Y.A.-u.-l.; software, N.S.-e. and Y.A.-u.-l.; validation, N.S.-e. and Y.A.-u.-l.; formal analysis, N.S.-e., S.O., V.P. and Y.A.-u.-l.; investigation, N.S.-e., S.O., V.P. and Y.A.-u.-l.; resources, N.S.-e. and Y.A.-u.-l.; data curation, N.S.-e. and Y.A.-u.-l.; writing—original draft preparation, N.S.-e.; writing—review and editing, S.O., V.P. and Y.A.-u.-l.; visualization, N.S.-e.; supervision, S.O., V.P. and Y.A.-u.-l.; project administration, Y.A.-u.-l.; funding acquisition, N.S.-e. and Y.A.-u.-l. All authors have read and agreed to the published version of the manuscript.

Funding

This work was partially supported by the Thailand Research Fund (TRF), Research and Researchers for Industries (RRi), Grant Number PHD60I0072 was funded by King Mongkut’s University of Technology North Bangkok, Contract Number KMUTNB-61-GOV-03-45.

Institutional Review Board Statement

Not applicable.

Informed Consent Statement

Not applicable.

Data Availability Statement

Not applicable.

Acknowledgments

The authors would like to thank Tanom Leetrakul, Atapol Palasay, and Piyapat Chuchuay for their support of our experiments.

Conflicts of Interest

The authors declare no conflict of interest.

Nomenclature

ε Strain
λ Friction sensitivity parameter
ν Relative velocity
σ ε i Representative stress
σ n Normal contact pressure
τ Shear stress
ψ Surface expansion ratio
LLoad
LsSpecific load
kShear strength of material
mShear friction factor

References

  1. Schey, J.A. Tribology in Metalworking: Friction, Lubrication and Wear; American Society for Metals: Metals Park, OH, USA, 1983. [Google Scholar]
  2. Groche, P.; Kramer, P.; Bay, N.; Dubar, L.; Hayakawa, K.; Hu, C.; Kitamura, K.; Moreau, P. Friction Coefficients in Cold forging: A Global Perspective. CIRP Ann.-Manuf. Technol. 2018, 67, 261–264. [Google Scholar] [CrossRef]
  3. Velkavrh, I.; Lüchinger, M.; Kern, K.; Klien, S.; Ausserer, F.; Voyer, J.; Diem, A.; Schreiner, M.; Tillmann, W. Using a Standard Pin-on-disc Tribometer to Analyze Friction in a Metal Forming Process. Tribol. Int. 2017, 114, 418–428. [Google Scholar] [CrossRef]
  4. Trivedi, H.K.; Bhatt, D.V. Effect of Lubricating Oil on Tribological Behaviour in Pin on Disc Test Rig. Tribol. Ind. 2017, 39, 90–99. [Google Scholar] [CrossRef] [Green Version]
  5. Martín, F.; Martín, M.J.; Sevilla, L.; Sebastián, M.A. The Ring Compression Test: Analysis of Dimensions and Canonical Geometry. Proc. Eng. 2015, 132, 326–333. [Google Scholar] [CrossRef] [Green Version]
  6. Bay, N.; Azushima, A.; Groche, P.; Ishibashi, I.; Merklein, M.; Morishita, M.; Nakamura, T.; Schmid, S.; Yoshida, M. Environmentally Benign Tribo-systems for Metal Forming. CRIP Ann.-Manuf. Technol. 2010, 59, 760–780. [Google Scholar] [CrossRef] [Green Version]
  7. Altan, T. Cold and Hot Forging: Fundamentals and Application; ASM International: Materials Park, OH, USA, 2005. [Google Scholar]
  8. Hu, C.; Ou, H.; Zhao, Z. Investigation of Tribological Conditions in Cold Forging Using an Optimized Design of Spike Forging Test. Adv. Mech. Eng. 2015, 7, 1–11. [Google Scholar] [CrossRef]
  9. Gariety, M.; Ngaile, G.; Altan, T. Evaluation of New Cold Forging Lubricants Without Zinc Phosphate Precoat. Int. J. Mach. Tools 2007, 47, 673–681. [Google Scholar] [CrossRef]
  10. Zhang, Q.; Felder, E.; Bruschi, S. Evaluation of Friction Condition in Cold Forging by Using T-Shape Compression Test. J. Mater. Process. Technol. 2009, 209, 5720–5729. [Google Scholar] [CrossRef]
  11. Aleksandrović, S.; Đorđević, M.; Stefanović, M.; Lazić, V.; Adamović, D.; Arsić, D. Different Ways of Friction Coefficient Determination in Stripe Ironing Test. Tribol. Ind. 2014, 293–299. [Google Scholar]
  12. Üstünyagiz, E.; Nielsen, C.V.; Christiansen, P.; Martins, P.A.F.; Bay, N. Continuous Strip Reduction Test Simulating Tribological Conditions in Ironing. Proc. Eng. 2017, 207, 2286–2291. [Google Scholar] [CrossRef] [Green Version]
  13. Dubois, A.; Patalier, D.; Picart, P.; Oudin, J. Optimization of The Upsetting-sliding Test Parameters for the Determination of Friction Laws at Medium and High Contact Pressures. J. Mater. Process. Technol. 1996, 62, 140–146. [Google Scholar] [CrossRef]
  14. Kim, H.; Taylan, A.; Yan, Q. Evaluation of Stamping Lubricants in Forming Advanced High Strength Steels (AHSS) Using Deep Drawing and Ironing Tests. J. Mater. Process. Technol. 2009, 209, 4122–4133. [Google Scholar] [CrossRef]
  15. Sae-eaw, N.; Aue-u-lan, Y. Friction Evaluation for Combined Drawing and Ironing process with Thick Sheet by Ball Ironing Test. J. Manuf. Sci. Eng. 2021, 143, 061004. [Google Scholar] [CrossRef]
  16. Sae-eaw, N.; Aue-u-lan, Y. Evaluation of Lubricant Performance for Thick Sheet Ironing Process by Ball Ironing Test. In Proceedings of the Forming the Future: Proceedings of the 13th International Conference on the Technology of Plasticity, Online, 25–30 July 2021. [Google Scholar]
  17. Lin, Y.; Hsu, K.; Lee, P. The Application of Flow Stress Model to Sheet Metal Forming Simulation. China Steel Tech. Rep. 2010, 23, 31–35. [Google Scholar]
  18. Hering, O.; Kolpak, F.; Tekkaya, A.E. Flow Curves up to High Strains Considering Load Reversal and Damage. Int. J. Mater. Form. 2019, 12, 955–972. [Google Scholar] [CrossRef] [Green Version]
  19. Hosford, W.F.; Caddell, R.M. Metal Forming Mechanics and Metallurgy; Cambridge University Press: Cambridge, UK, 2011. [Google Scholar]
  20. Lange, K. Handbook of Metal Forming; McGraw Hill: New York, NY, USA, 1985. [Google Scholar]
  21. Nielsen, C.V.; Bay, N. Review of Friction Modeling in Metal Forming Processes. J. Mater. Process. Technol. 2018, 255, 231–241. [Google Scholar] [CrossRef] [Green Version]
Figure 1. Schematic of ball ironing test (BIT).
Lubricants 10 00106 g001
Figure 2. Range of tribological conditions obtained from ball ironing test.
Lubricants 10 00106 g002
Figure 3. Friction calibration curve (FCC), m-Lmax curve, of ball ironing test.
Lubricants 10 00106 g003
Figure 4. Stress–strain curves of studied materials.
Lubricants 10 00106 g004
Figure 5. Tooling for experiment: (a) tooling components; (b) die set of ball ironing test.
Lubricants 10 00106 g005
Figure 6. Combined drawing and ironing process: (a) tool components; (b) preform shape of the pulley.
Lubricants 10 00106 g006
Figure 7. Simulation model of ball ironing test.
Lubricants 10 00106 g007
Figure 8. Maximum load comparison: (a) AISI-1005 with linear interpolation; (b) AISI-1005 with power-law interpolation; (c) AISI-1015 with linear interpolation; (d) AISI-1015 with power-law interpolation.
Lubricants 10 00106 g008
Figure 9. Final height comparison: (a) AISI-1005 with linear interpolation; (b) AISI-1005 with power-law interpolation; (c) AISI-1015 with linear interpolation; (d) AISI-1015 with power-law interpolation.
Lubricants 10 00106 g009
Figure 10. Effect of material properties on FCC: (a) linear interpolation and σ ε 0.3 ; (b) linear interpolation and σ ε 0.6 ; (c) linear interpolation and σ ε 3 ; (d) power-law interpolation and σ ε 0.3 ; (e) power-law interpolation and σ ε 0.6 ; (f) power-law interpolation and σ ε 3 .
Lubricants 10 00106 g010
Figure 11. Comparison of the friction sensitivity parameters under: (a) linear interpolation; (b) power-law interpolation.
Lubricants 10 00106 g011
Figure 12. Universal friction calibration curve (FCC) for BIT under: (a) linear interpolation; (b) power-law interpolation.
Lubricants 10 00106 g012
Figure 13. BIT specimens before and after testing.
Lubricants 10 00106 g013
Figure 14. Friction evaluation of forming oil L1: (a) FCC under linear interpolation; (b) FCC under power-law interpolation.
Lubricants 10 00106 g014
Figure 15. Shear friction factor comparison of the forming oil L1.
Lubricants 10 00106 g015
Figure 16. Result validation for forming oil L1: (a) maximum load; (b) final height.
Lubricants 10 00106 g016
Figure 17. Comparison of tip shape deformation.
Lubricants 10 00106 g017
Figure 18. Friction evaluation under different testing conditions: (a) forming oil L1; (b) forming oil L2.
Lubricants 10 00106 g018
Figure 19. Surface defect “wear” on specimen and tool.
Lubricants 10 00106 g019
Figure 20. Comparison of shear friction factors under: (a) forming oil L1; (b) forming oil L2.
Lubricants 10 00106 g020
Figure 21. Load profile comparison of 2 forming oils at R60.
Lubricants 10 00106 g021
Figure 22. Shear friction factor of solid lubricant S1.
Lubricants 10 00106 g022
Figure 23. Result validation of pulley model: (a) maximum load; (b) product height.
Lubricants 10 00106 g023
Table 1. Experimental conditions for FCC validation.
ConditionsDetails
MaterialsAISI-1005, AISI-1015
Thickness reduction, R (%)R44(db41.28), R51(db42.87), R60(db45.00)
LubricantsL1, L2, S1
Table 2. Chemical compositions of the studied materials.
SteelsChemical Composition (wt%)
AISI-1005C0.053%, Si0.004%, S0.006%, Mn0.229%, Cr0.013%
AISI-1015C0.161%, Si0.155%, S0.012%, Mn0.514%, Cr0.008%
Table 3. Properties of selected lubricants.
Code NamesDetails
L1Liquid lubricant—additive EP
Density at 30 °C (g/mm3)
Kinetic viscosity at 40 °C (mm2/s)
VI index
Flash point temperature (°C)
0.934
480
98
210
L2Liquid lubricant—base oil
Density at 30 °C (g/mm3)
Kinetic viscosity at 40 °C (mm2/s)
VI index
Flash point temperature (°C)
0.86
30
n/a
200
S1Solid lubricant—Zn-Ph coating
Combined lubrication layer weight (g/m2)
>8
Table 4. Studied parameters for specific load (Ls).
ParametersDetails
Representative stresses, σ ε i (MPa) σ ε 0.3 , σ ε 0.6 , σ ε 3
Stress–strain curve interpolation techniqueLinear interpolation, power-law interpolation
Type of materialAISI-1005, AISI-1015
Thickness reduction, R (%)R40(db40.20)—R65(db46.20)
Shear friction factors, m0–0.4
Table 5. Boundary conditions of ball ironing test simulation.
ParametersDetails
Workpiece—material typePlastic
Workpiece—flow stressObtained from compression test
Workpiece—number of elements8000 elements
Tooling—material typeRigid
Binder force16 tons
Punch speed1 mm/s
Total stroke60 mm
Publisher’s Note: MDPI stays neutral with regard to jurisdictional claims in published maps and institutional affiliations.

