Article

Process Optimization of Automotive Brake Material in Dry Sliding Using Taguchi and ANOVA Techniques for Wear Control

Department of Mechanical Engineering, BITS Pilani—Hyderabad Campus, Hyderabad 500078, India
*
Author to whom correspondence should be addressed.
Lubricants 2022, 10(7), 161; https://doi.org/10.3390/lubricants10070161
Submission received: 27 June 2022 / Revised: 8 July 2022 / Accepted: 12 July 2022 / Published: 18 July 2022

Abstract

:
In this paper, an investigation of the load-dependent wear behavior of copper-free semi-metallic brake material is presented. The experiments were conducted in ambient thermal settings with varying sliding velocities (3.141 m/s, 2.09 m/s, and 1.047 m/s), normal load (60 N, 50 N, and 40 N), and sliding distance (4500 m, 3000 m, and 1500 m). Taguchi’s method was used in designing experiments to examine the output through an L9 orthogonal array. ANOVA was used to identify the consequence of interactions among different constraints. It also established the significant contribution of each process factor. The objective was set as the ‘smaller is better’ criterion to find minimum wear conditions. The impact of the normal load on the wear process was found to be maximum (71.02%), followed by sliding velocity (27.84%) and sliding distance (1.14%). The optimum condition for the minimum wear rate was found at 40 N normal load, 1500 m sliding distance, and 3.14 m/s sliding velocity. The results were confirmed with validatory friction experiment runs. The resulting error was within 10% error, which verified the experiment methods. The SEM investigation of worn surfaces of pin and disc confirmed abrasive wear and adhesive wear at 60 N and 40 N, respectively.

1. Introduction

Brake pads are one of the most difficult composite materials to work with. They are challenging to fabricate owing to the differences in the chemical behaviors of each component [1]. The behavior of the brake friction material is impacted by its microstructure and composition. It contains fibers, abrasives, minerals, lubricants, fillers, and phenolic resin. It should maintain a consistent and moderate coefficient of friction (CoF) under wide-ranging and fluctuating environmental conditions. The friction behavior can be altered by changing the constituent fiber with different hardness [2,3]. The selection of brake material is affected by numerous criteria, such as friction behavior, wear, etc. [4,5]. The CoF of the brake frictional material should be such that it does not lock the wheel and produce high noise. At the same time, it should also stop the vehicle at a desirable sliding distance when needed [6,7,8]. The CoF should lie between 0.3 and 0.5 for efficient braking [9,10,11]. Another condition for the brake material is that it should not wear out quickly. However, it must not damage the rotor in a prolonged run. Under these circumstances, knowledge of the wear process of brake material becomes essential [12,13].
As illustrated in Figure 1, due to the motion of the brake pad against the rotor, a substantial portion of wear from the friction material will be discharged as particulate matter. Brake wear accounts for 16% to 55% of total particle mass in non-exhaust road traffic emissions in urban contexts, according to research. The presence of copper in the automotive brake pad has been a significant concern owing to its adverse effects on the ecosystem, mainly marine life. Brake makers were anticipated to decrease the amount of copper used in their friction material by 2021 to comply with the copper-free brake pad agreement reached in 2015 between the US Environmental Protection Agency and industry representatives. This led to the arrival of copper-free semi-metallic friction materials. To maintain the performance of copper-free semi-metallic friction material at par with copper-based friction material, the wear behavior of copper-free friction material must be examined. Furthermore, there has been much research in the past on the optimization of the brake manufacturing process. However, insights into the wear process, factors affecting it, and the interaction among the wear process variables are still needed [13,14,15,16,17,18,19,20].
Because of the complexity of the wear process, a scientific methodology is required to investigate the tribological properties of the friction pair. One of the most important statistical techniques for studying diverse process factors by lowering the number of multiple trials is the design of the experiment (DOE). The Taguchi design technique leads to the removal of unnecessary experiments in the process. It is followed by ANOVA analysis. This results in identifying the crucial characteristics that influence wear rate. ANOVA also becomes essential to determine what percentage of each sliding wear process parameter contributes to wear loss of copper-free semi-metallic friction material [20,21].
As a result, Taguchi’s experimental method provides a solid instrument for examining the impact of diverse process variables on brake wear when paired with ANOVA analysis [22,23,24,25,26,27,28,29]. The research aims to achieve optimal results in establishing minimum wear rates by analyzing the effect of various process variables, i.e., load, sliding distance, and sliding velocity, on copper-free semi-metallic friction material under dry sliding conditions.

2. Methodology

“According to Archard’s wear law, the wear volume is proportional to the normal force, the sliding distance, and inversely proportional to the softer contact partners’ hardness”. The selection of factors was made, keeping this law into consideration. It was followed by the design of experiments, conducting experiments, and validating the model, as shown in Figure 2. Sliding distance, sliding velocity, and normal load were the parameters varied for the dry sliding wear test. The model’s response is the least wear rate for the copper-free semi-metallic friction material. The interaction between parameters is also analyzed. The SN ratio, which sums together the various input parameter arrangements of the run, is determined by the type of output being examined. To examine dry sliding wear, the ‘smaller is better’ features were chosen [30,31,32,33,34,35].

2.1. Design of Experiment

The design of experiments is the most essential approach for the simultaneous investigation of the various factors affecting the process. It does not only reduce the number of experiments to be conducted but also lays down the investigations needed to achieve the goal. The correct identification of factors is required in order to analyze the scientific process [35,36,37,38]. To construct the engineering optimization and analysis experiment plan, the Taguchi method uses standard orthogonal arrays. The experiment’s findings are then analyzed using ANOVA. An L9 orthogonal array was chosen to comprehend the impact of three separate factors, each with three levels. It is a balanced array and makes sure that all parameter levels are taken into account equally. The range of brake loads, from mild to heavy, has been considered. Less time is needed to conduct and analyze the experiments. The factors chosen are explained below.

2.1.1. Load

A stationary pin is held against a spinning disc in a pin-on-disc tribometer. The pin can be in any form to imitate accurate contact, but cylindrical/rectangular tips are commonly utilized to streamline the contact geometry. The ratio of the frictional force to the normal force determines the coefficient of friction. When the normal load increases, friction occurs at the contact surface, resulting in the loss of material [28].

2.1.2. Sliding Distance

Sliding distance is obtained by the product of the linear speed and the time taken. The wear rate increases with the distance traveled by the pin. However, the rate of wear during travel is also impacted by other factors, such as the roughness of the profile, the behavior of the interface and the genuine contact zone, etc. Asperity interaction through the contact zone also alters the wear rate [29,30,31]. Sliding distance in meters is calculated by:
x = Π × d × N × t ,
where d = wear track diameter in meters; N = rotor speed in RPM; t = time in mins.

2.1.3. Sliding Velocity

Sliding velocity is relative to the product of the rotor’s spinning speed and the track diameter of the pin. An increase in the sliding velocity also alters the temperature of the pin–rotor contact zone, leading to changes in the wear value [30,31]. Sliding velocity in m/s is provided by:
v = Π × D × N 60
D = diameter of the rotor in meters.
N = revolution per min.
Table 1 lists the identified input factors against corresponding levels.
The research objective was to determine the relation between variation in operating conditions and the wear of the copper-free semi-metallic brake pad material. The SN ratio was chosen as the performance criterion, as illustrated in Table 2. This ratio under different noise conditions assesses the convergence of the output to the objective. The formula is as follows:
S N = 10   l o g   1   n   ( Σ y i 2 )  
where ‘n’ signifies the number of observations, while ‘yi’ denotes the data. The signal is represented by the letter ‘S’. In contrast, the noise is represented by the letter ‘N’. SN ratios were calculated based on the experiment objective ‘smaller is better’, in alignment with the reduction of wear rate. When a process parameter was altered, the results were used to compute the wear response. The optimum conditions for the wear process of semi-metallic brake pad material were determined. The noise was reduced through a change in the dependent variables. It is challenging to change the external inputs to modify noise. These constitute sliding distance, sliding velocity, and load. The process finds the best process parameters for reducing the wear rate. The interaction between the factors was also considered. Table 3 shows the design of the experiment in the L9 array.

3. Experimental Procedure
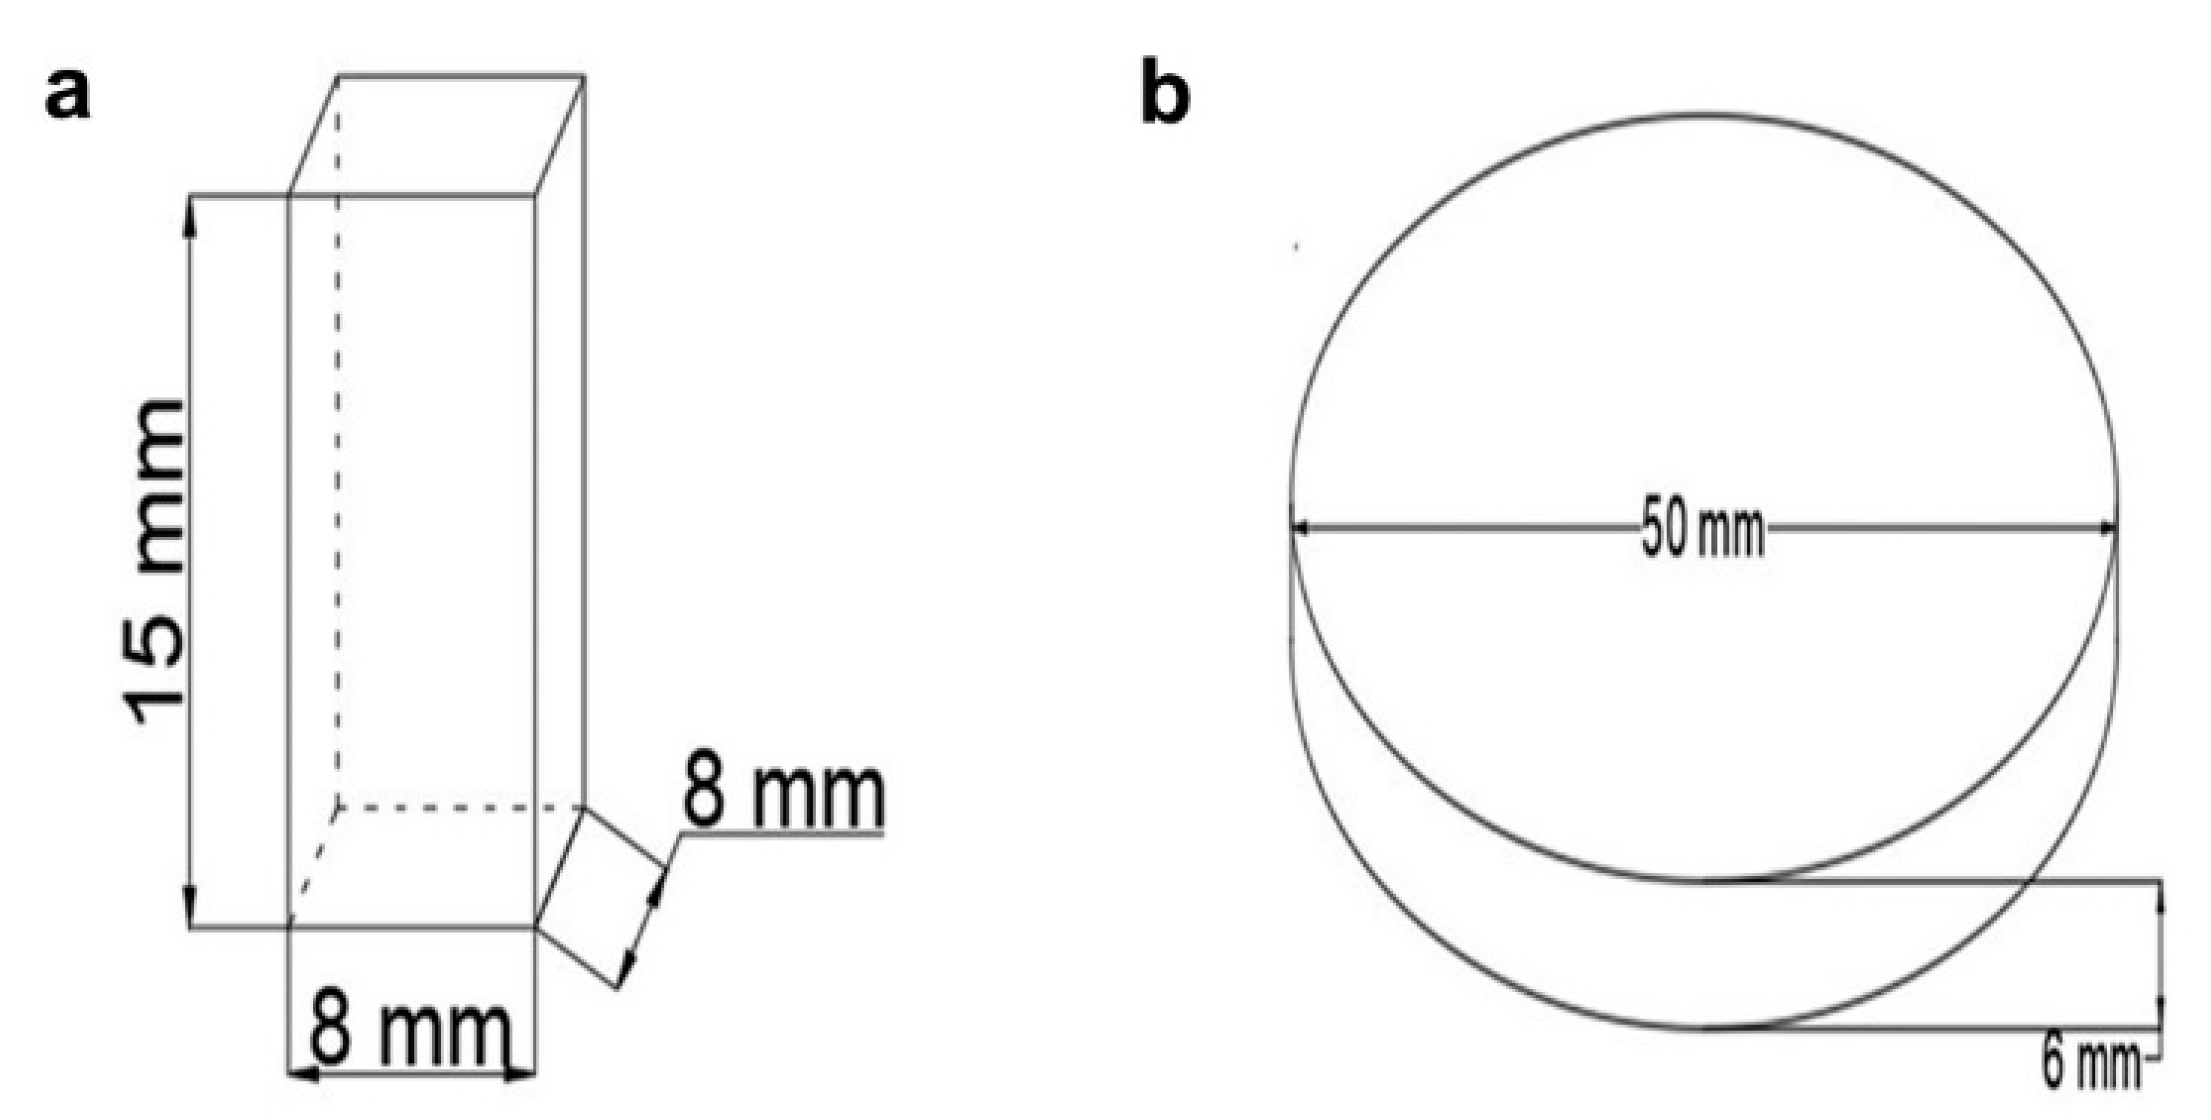
3.1. Materials

The friction behavior of copper-free friction material was investigated by using a pin-on-disc tribometer. Pin specimens of the friction material were fabricated, as shown in Figure 3a, with 15 mm height and 8 mm × 8 mm base, according to ASTM G99 test standards. As shown in Figure 3b, a GCI disc with 6 mm thickness and 50 mm diameter was employed as a counter-rotor. Table 4 depicts the composition of friction material found by XRF analysis. The various semi-metallic constituents of the friction material can be seen. Figure 4a depicts the SEM image of the cross-section of the copper-free semi-metallic friction material, while Figure 4b–f depicts the EDS mapping of the elements present within the matrix. Carbon, along with iron, is the most profuse element present in the material matrix. The presence of nickel, barium, and oxygen is also visible.

3.2. Wear Experiment

The dry sliding wear tests at ambient thermal conditions were conducted by a computerized pin-on-disc tribometer (Model: Magnum, India). The study strictly followed ASTM G99 procedures. A digital weight balance (Shimadzu UniBloc, Model AUW220D, Tokyo, Japan) was used to find the initial weight of the virgin pins and the final weight of the worn friction material pins. The precision was up to four decimal places. An 800-grit SiC abrasive paper was used to abrade the surface before the friction test in order to have a flat contact with the counter GCI disc. The pin was loaded into the tribometer through the connected lever. The GCI disc was used as counter-face material with a hardness of 350 HV60 (measured with a Mitutoyo Vickers hardness testing machine; Model HM-200, USA). The disc had a roughness profile of 0.16 µ at the start (measured with a Mitutoyo surface roughness tester; Model SJ 410, Aurora, IL, USA). Measurements of the samples were done with Vernier calipers (Mitutoyo; Model 500-196-20, Aurora, IL, USA). The wear rate of the brake material was obtained by the ratio of material volume loss to sliding distance. The formula is as follows:
Q = W f W i ρ l
where Q = wear rate (mm3/m), Wf = final weight of the pin in g, Wi = initial weight of the pin in g, ρ = density of pin in g/mm3, and l = sliding distance in meters.
The tribometer with a counterweight and a rotating rotor delivered the braking force, as shown in Figure 5. Dry sliding experiments were conducted at 4500 m, 3000 m, and 1500 m with sliding velocities of 3.141 m/s, 2.094 m/s, and 1.047 m/s, at a standard contact force of 60 N, 50 N, and 40 N, and a track radius of 20 mm. The contact was equipped with an LVDT and a strain gauge to monitor the displacement and frictional force. The gadget was linked to a computer that ran the ‘Magview’ program, which allowed the changes in wear, frictional force, and sliding velocity to be monitored and assessed. The sliding wear data were stored in the software file. Each friction test was carried out three times in order to obtain statistically reliable and repeatable wear data.
The accuracy and precision of the measuring instruments are shown in Table 5.

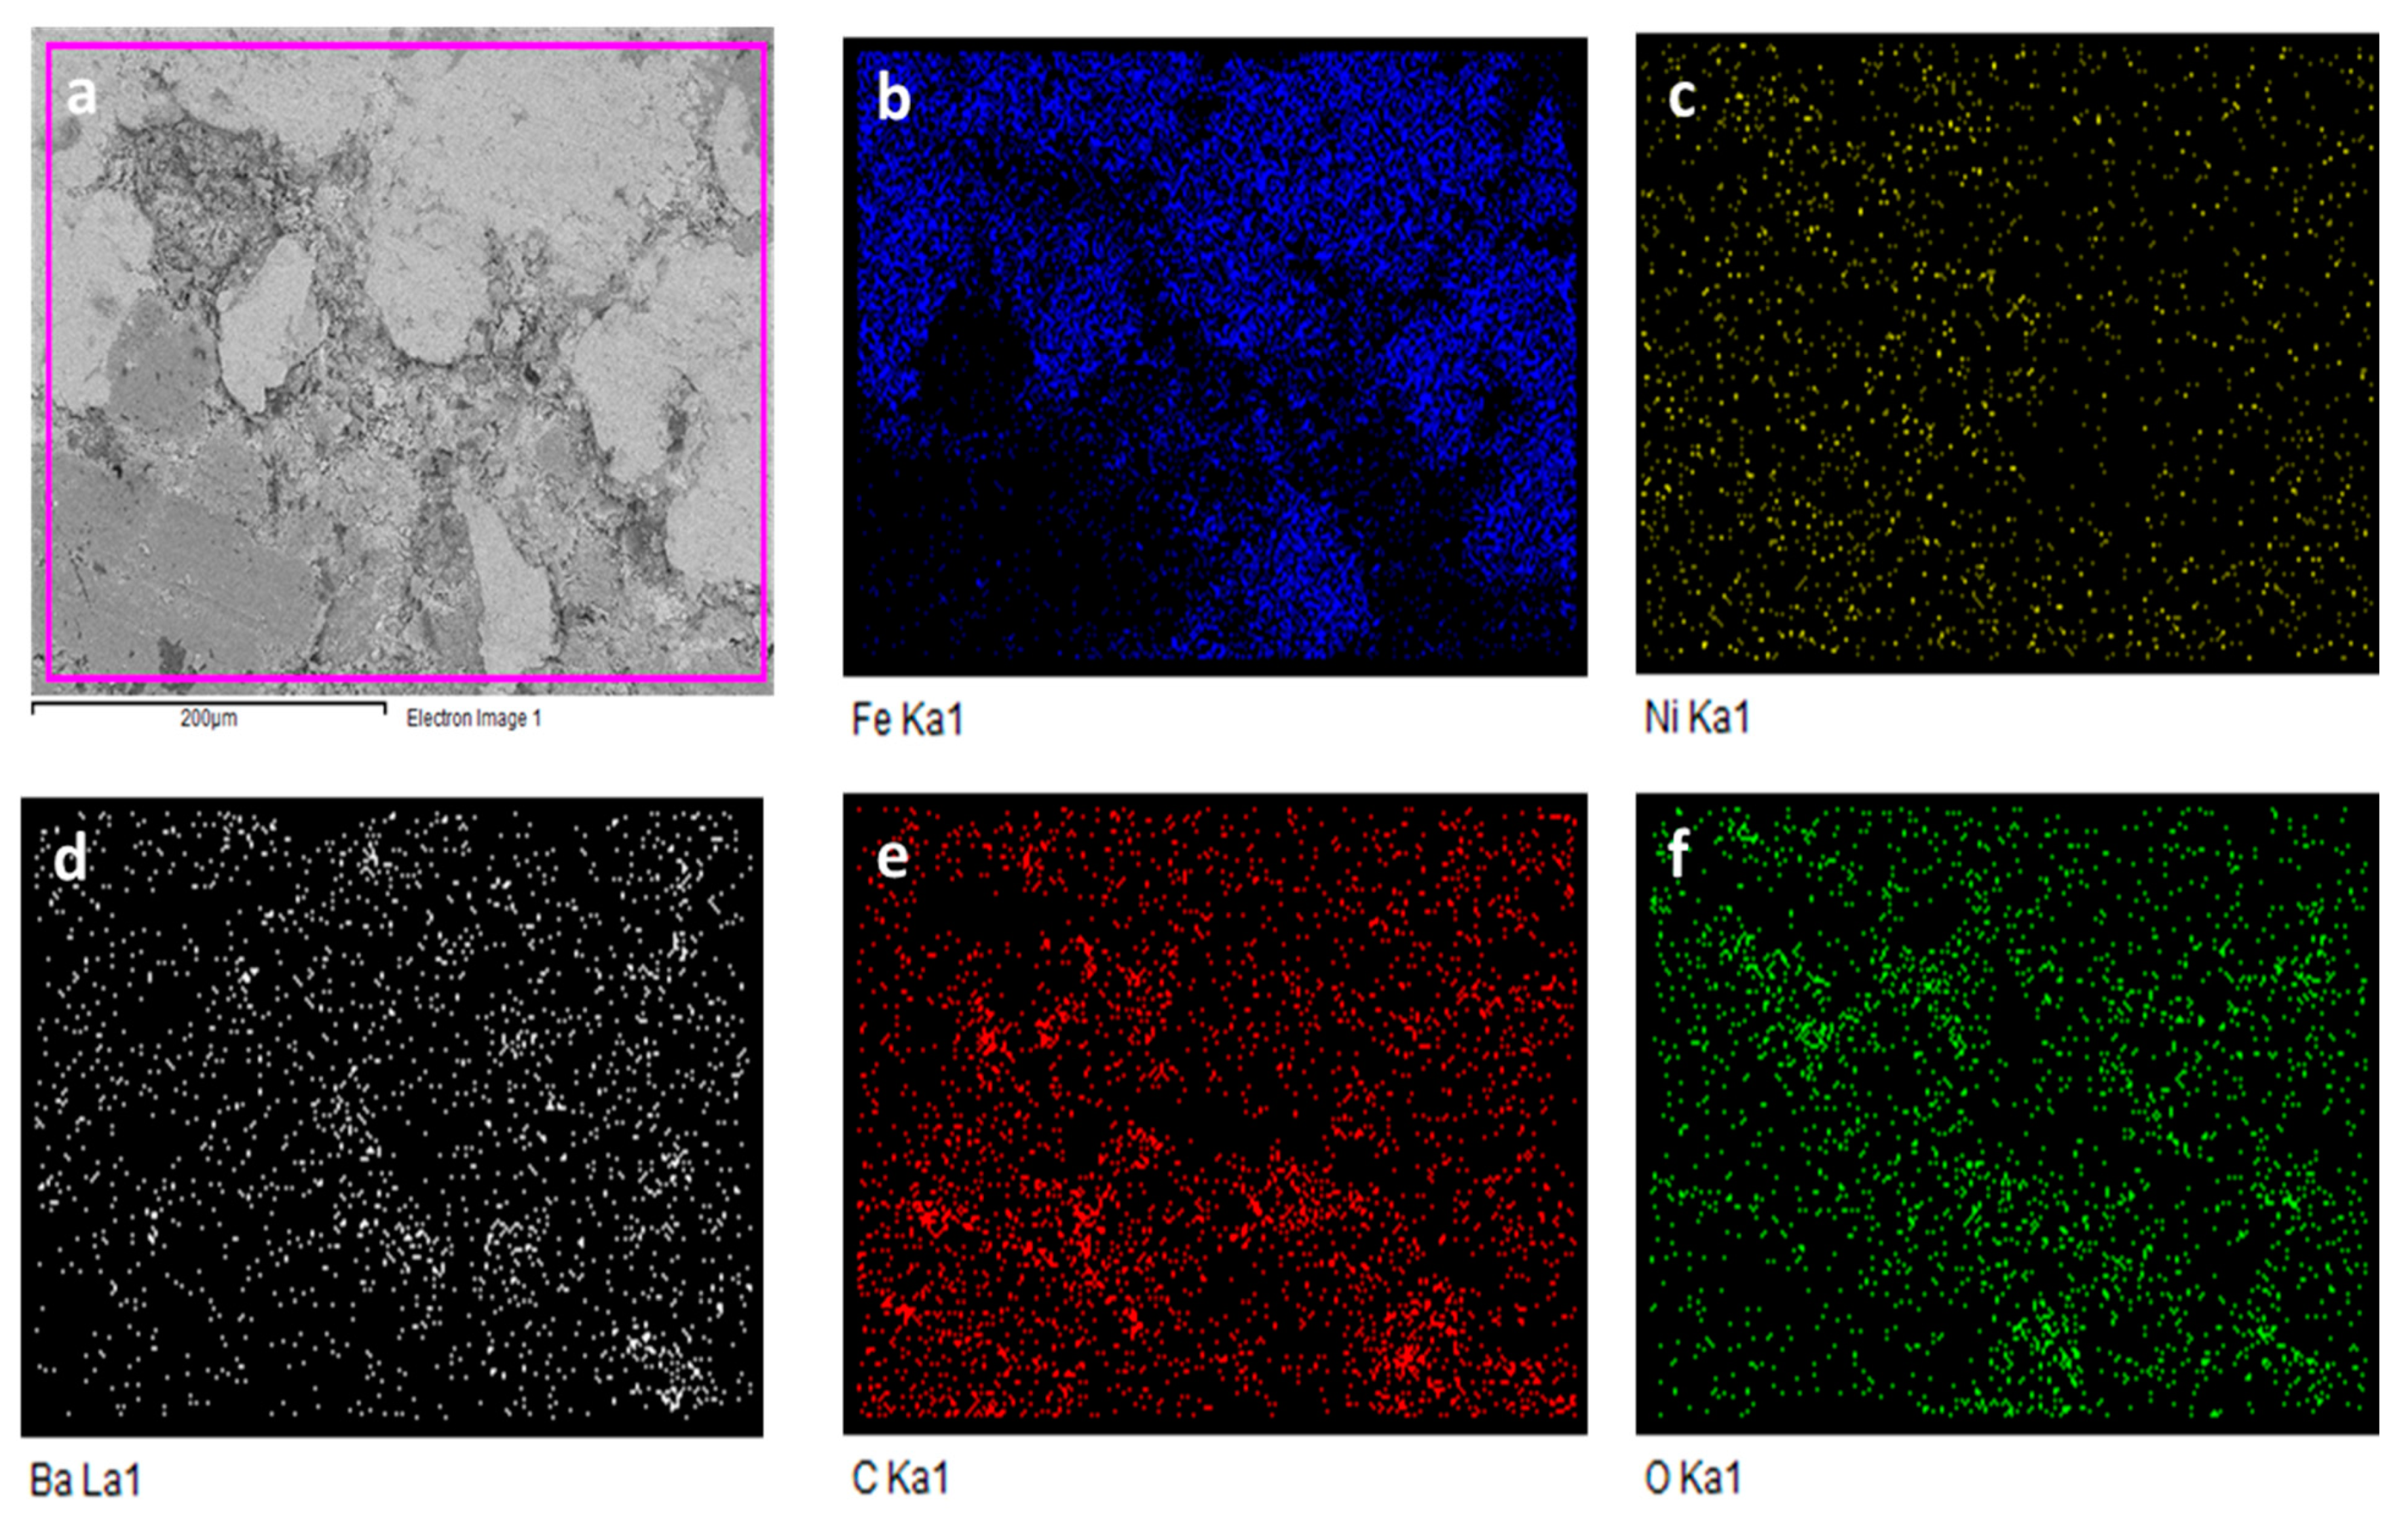
3.3. Characterization Techniques

To investigate the worn surfaces of the pin and disc, a scanning electron microscope (SEM) was used. The ED-XRF (PANalytical, Model: Epsilon-1, Malvern, UK) equipment was used to trace the presence of elements in the copper-free semi-metallic friction material. X-ray fluorescence emissions were analyzed using the inbuilt library functions. SEM (FEI, Model: Apreo LoVac, Waltham, NJ, USA) was used to analyze the worn-out friction material surface and disc surface. The coating on the specimens was done by the sputtering of 10 nm gold nanoparticles (Leica Ultra Microtome, Model: EM UC7, Wetzlar, Germany).

4. Results and Discussion

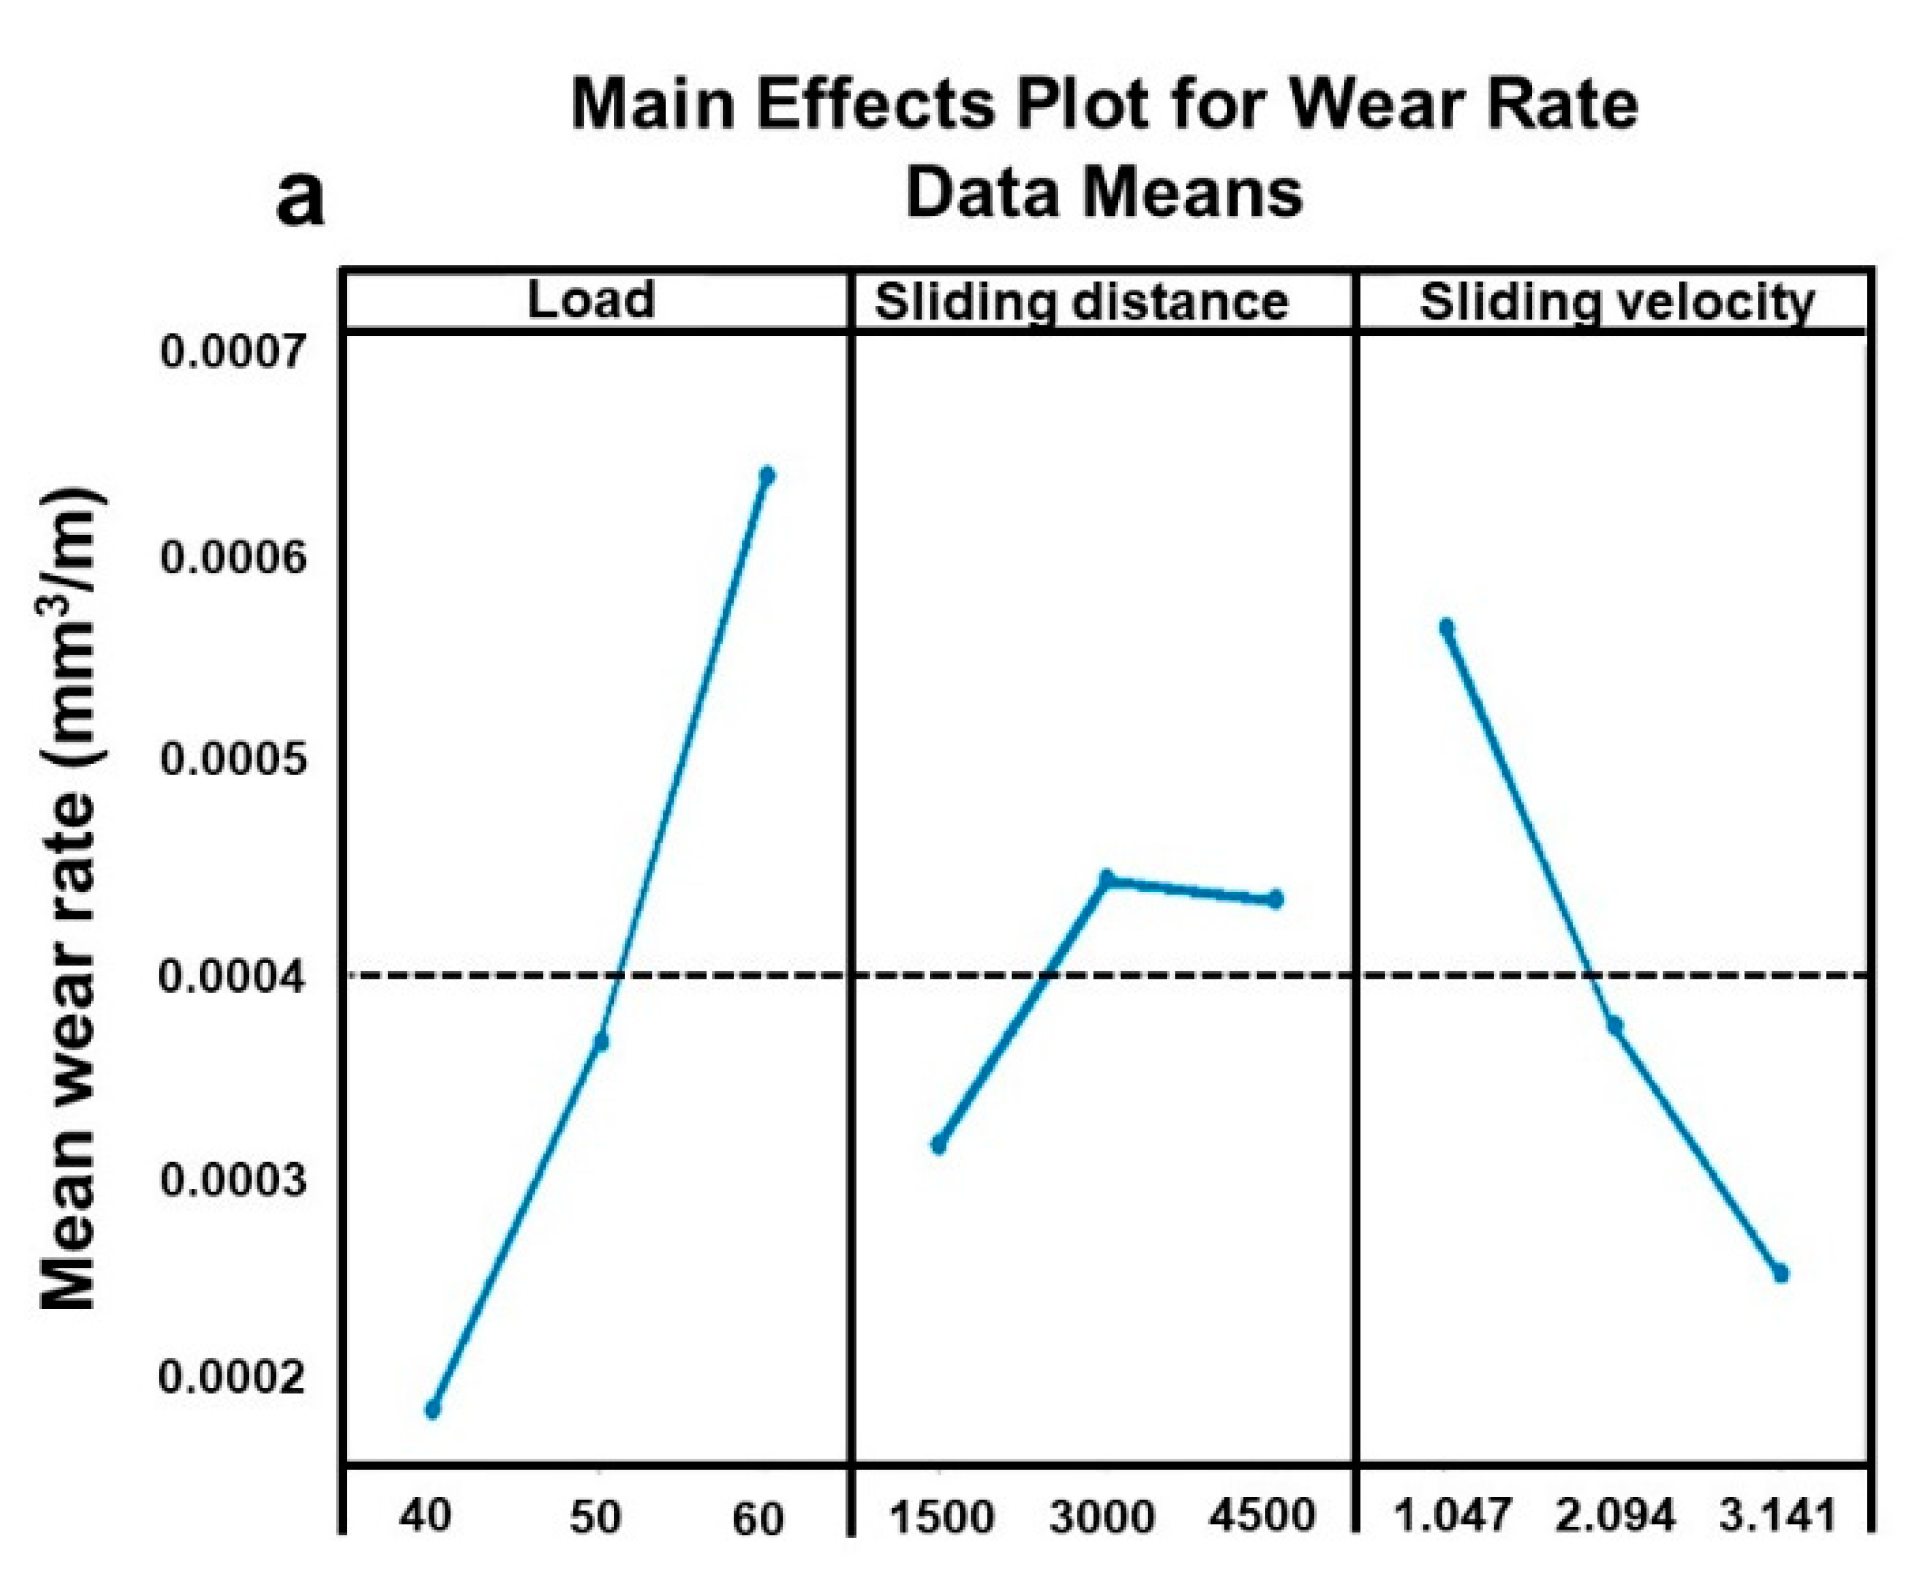
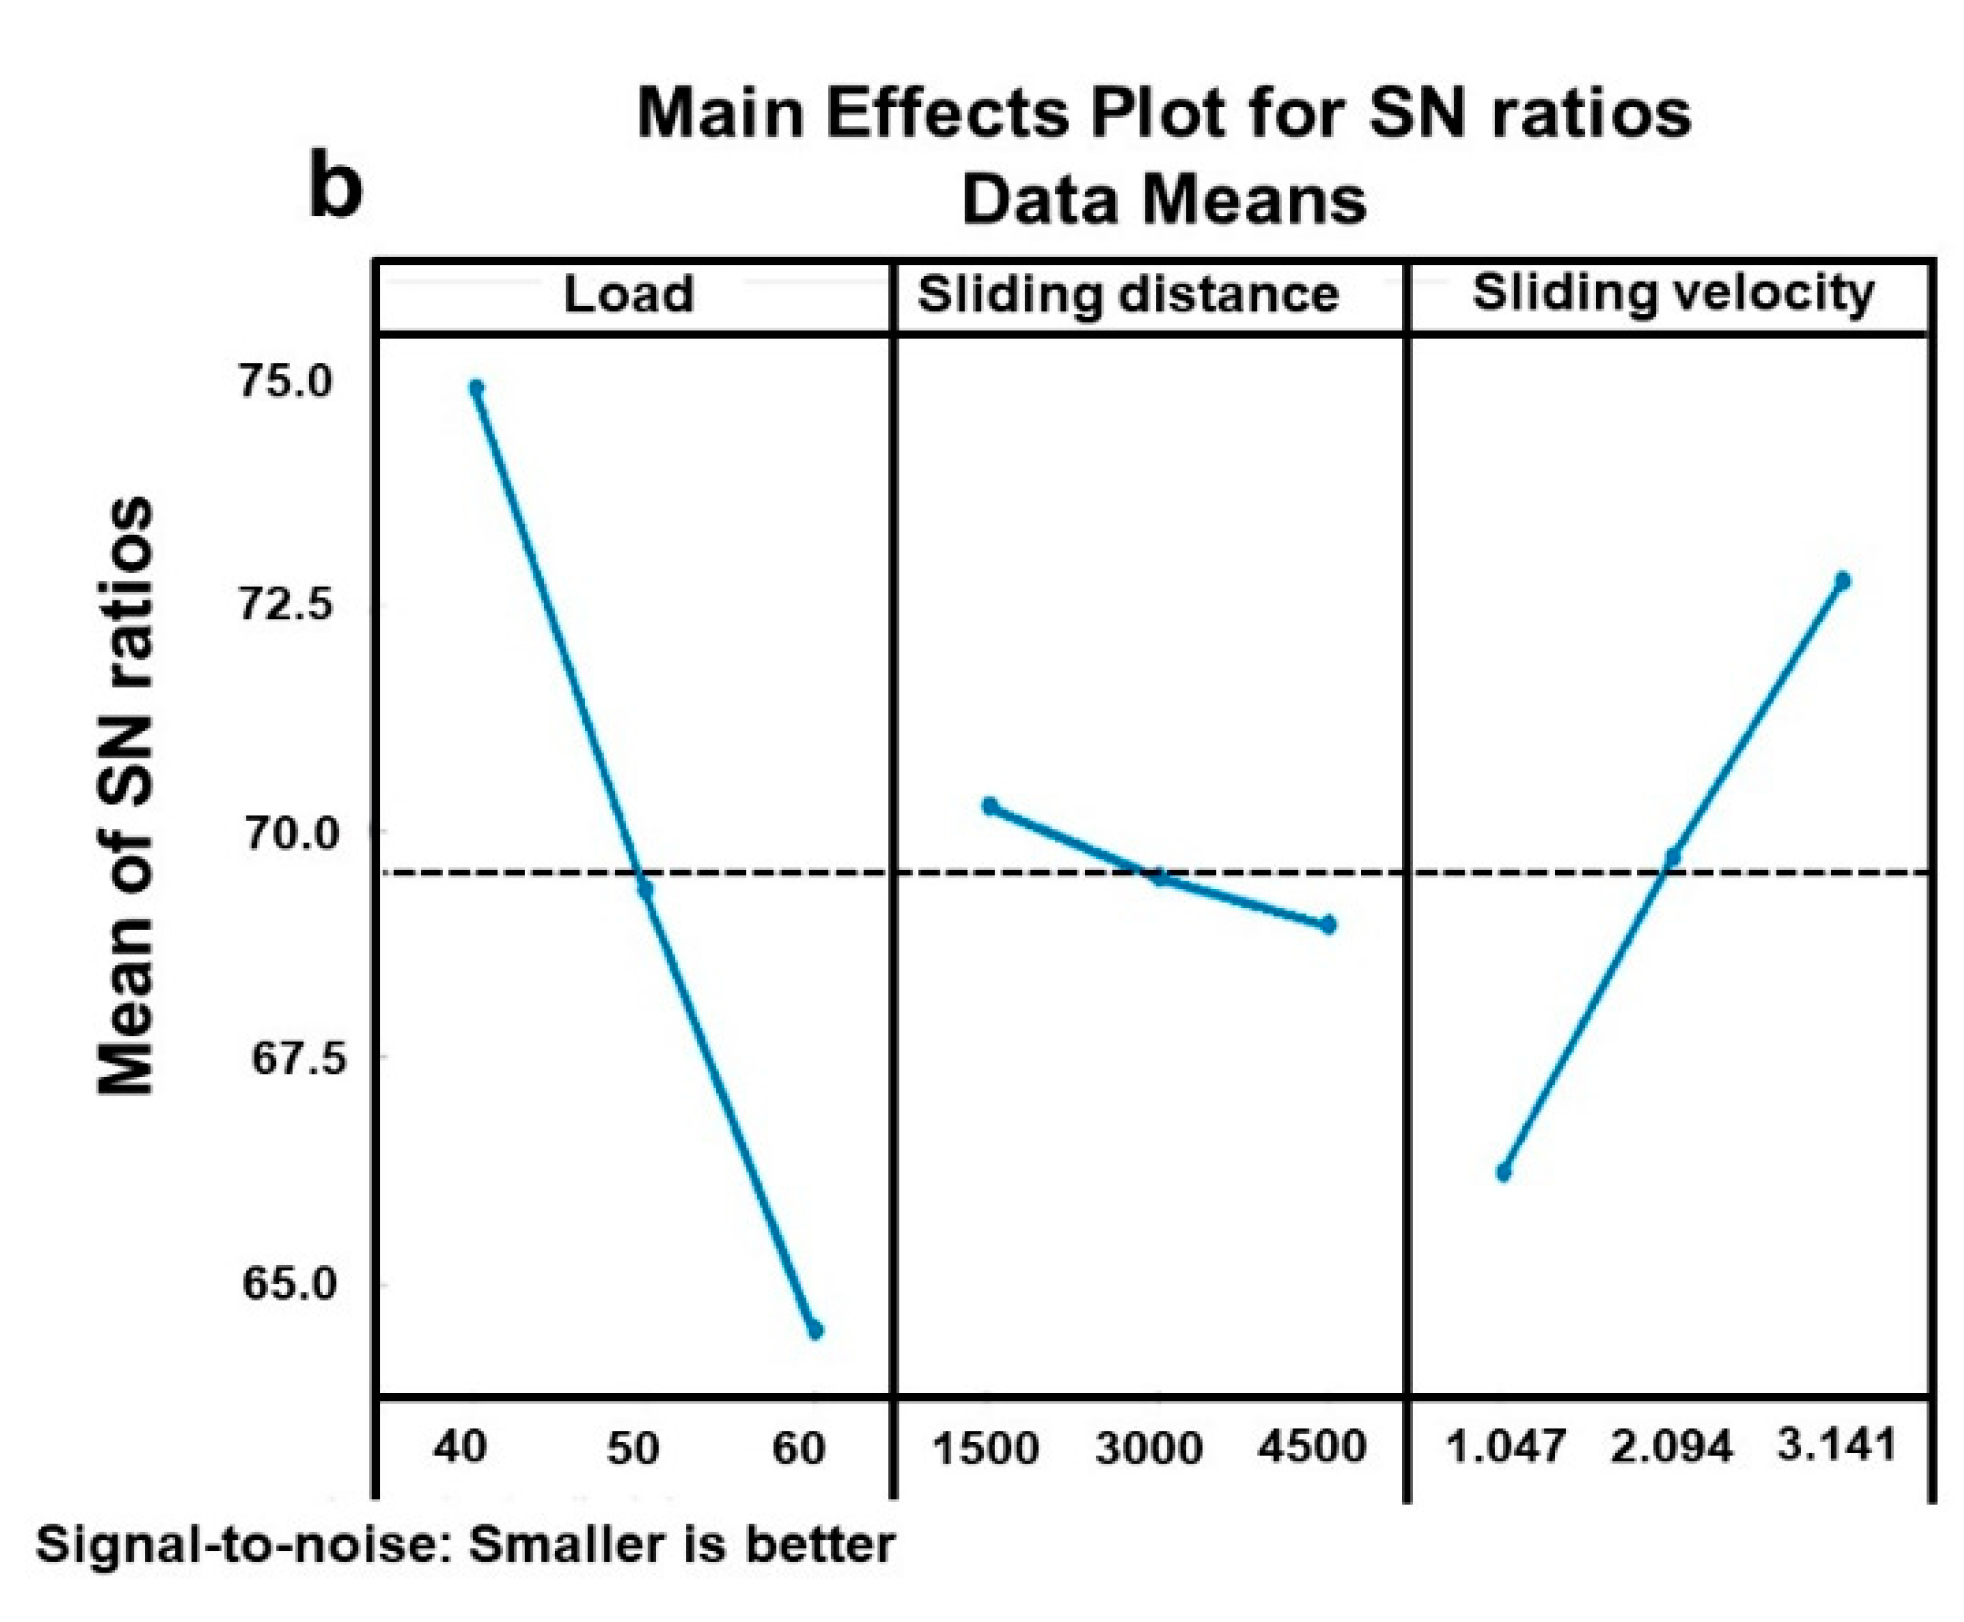
4.1. Signal to Noise (SN) Analysis of Wear

The research goal was to identify the essential parameters affecting the wear process and the corresponding conditions for minimum wear. The SN ratio results from the orthogonal array for various parameter combinations are displayed in Table 6. By translating the experiment results into ratios, MINITAB 18 was used to calculate the multiple functions related to the performance of the friction material. The standard deviations for the repeated tests were obtained in addition to the wear rate data.
The impact of wear on control test limits was studied with the corresponding optimum condition and wear mechanism. The influence of input constraints was analyzed based on the data means and SN ratios, as shown in Table 7 and Table 8. The current levels for each factor were defined with the understanding that these represented the range of low to high loading circumstances required for braking to occur. The raw response variable means for each factor/level combination were the ‘data means’, as shown in Table 7. The difference between the highest and lowest characteristic averages for a factor was used to calculate the amount of the effect or delta. It is easier to see which factors have the biggest impact when analyzing the ranks in a response table. The factor with the biggest delta value was given rank 1, the second-biggest delta was given rank 2, and so on. The SN ratios were statistically significant for input parameter behaviors. The signal-to-noise ratio for each factor level, delta, and rank is listed in a row in Table 8. Each factor has its own column in the table. Delta and rank were calculated in the same manner as explained before. The applied load was the most critical element impacting the wear phenomenon in the experiment, followed by sliding velocity and sliding distance. The principal control design for the SN ratio, for the mean, for wear, and for the interaction effect with governing inputs are featured in Figure 6a,b and Figure 7. The tilts of the primary impression curves show the influence of each parameter. The factor with the highest inclination of the line was the most critical. The main effect charts for wear in Figure 6a and the SN ratio in Figure 6b depict that the applied load was the most critical factor.
The presence of non-parallel factor effects can be determined using an interaction plot. If the behavior of an interaction plot is non-parallel, there is only a minor interaction; if the lines are complementary, there is an intense interaction. As illustrated in Figure 7, the component’s load and sliding velocity interacted significantly. The other factors, on the other hand, had minor interactions. According to the findings of this research, the normal force had the most significant impact on the copper-free friction material wear characteristics.
The interaction plot in Figure 7 and contour images in Figure 8a–c shows the interaction of the different inputs and their effect on the wear intuitively. The load outperformed the variance in the other two inputs, as shown in Figure 7. Most of the load vs. sliding velocity fluctuations were in the 40–45 N range (Figure 8a). The influence of sliding distance was in the range of 2400 m to 4500 m for the 40–50 N load, as seen in the distance vs. load curve (Figure 8b). The impact of sliding velocity and sliding distance was comparatively lesser (Figure 8c). The contour map makes it intuitive and straightforward to examine the effect of the deviation of each factor on the wear process.

4.2. Analysis of Variance (ANOVA) of Wear

ANOVA is a statistical tool for estimating processes and analyzing mean differences. It is utilized to determine the statistical significance of the test. It is employed to study the impact of sliding distance, normal load, and sliding velocity on the output wear control process. The F-value (factor value) is calculated by the division of the difference between specimen averages by the difference among specimens. The greater the F-value, the more significant the difference between specimen averages and variation within the specimen. If the F-value is higher, the corresponding p-value (probability value) is lower. The p-value indicates the chances of an error. The results were adjusted at three levels, and their relationships are shown in Table 9. They were used to determine which component controls which and how much each individual factor contributes. In this investigation, a 95% confidence level was used. Sources contributing to the performance measures were statistically significant contributors with a p-value of less than 0.05. In the ANOVA analysis, the following equations were used [37]:
P Q T = P S L + P S D + P S V  
P Q T = Σ 1 n d i 2     R 2 / n  
P S l = Σ i = 1 t ( S d i 2 / t ) R 2 / n
where PQT is the net-addition of squares, PSL is the load-addition of squares, PSD is the sliding distance-addition of squares, PSV is the sliding velocity addition of squares, n is the number of data, Sdi2 is the addition of the experiments relating constraint l at level i, and R is the resultant for all the tests.
The normal load had the most significant impact on the wear rate of the friction material. As a result, the load, followed by sliding velocity and sliding distance, is a crucial control component to consider during the wear process. The interaction within different inputs had a minor impact on the wear rate.

5. Multiple Linear Regression Model for Wear Rate

The multiple linear regression equation confirmed the experimental findings with an equation to form a connection between three independent variables and a response variable. It is used to create a multiple linear regression configuration. The resultant regression equation links the control parameters to the output through an equation. The multiple linear regression model is used for n data. [37,38]:
y = β 0 + β 1 x 1 + . + β n x n + ,
where ‘y’ = forecasted value of dependent variable, ‘ β 0 ’= y-intercept, ‘x’ = independent variable, ‘n’ = number of independent variables, and ‘’ = error.
Least estimator is derived by:
β 1 = Σ ( x i x ¯ )   ( y i y ¯ ) / Σ ( x i x ¯ ) 2 ,
where β1 = slope parameter/regression coefficient; xi = value of ith independent variable; yi = value of ith dependent variable; x ¯ = mean of independent variables; y ¯   = mean of dependent variables.
When the control factors of a model are linear, it is said to be linear. Thus, y / β i should not depend on any β.
The following is the wear rate regression equation for the semi-metallic brake pad:
                                        Q = 0.00044926 + ( L o a d   [ N ] ) × ( 1.86 × 10 5 ) + ( S l i d i n g   d i s t a n c e   [ m ] ) × ( 3.97 × 10 8 ) ( S l i d i n g   v e l o c i t y   [ m s ] ) × ( 0.00011154 )
Equation (10) depicts that normal load has a considerable impact on wear rate and is strongly influenced by sliding velocity followed by sliding distance.

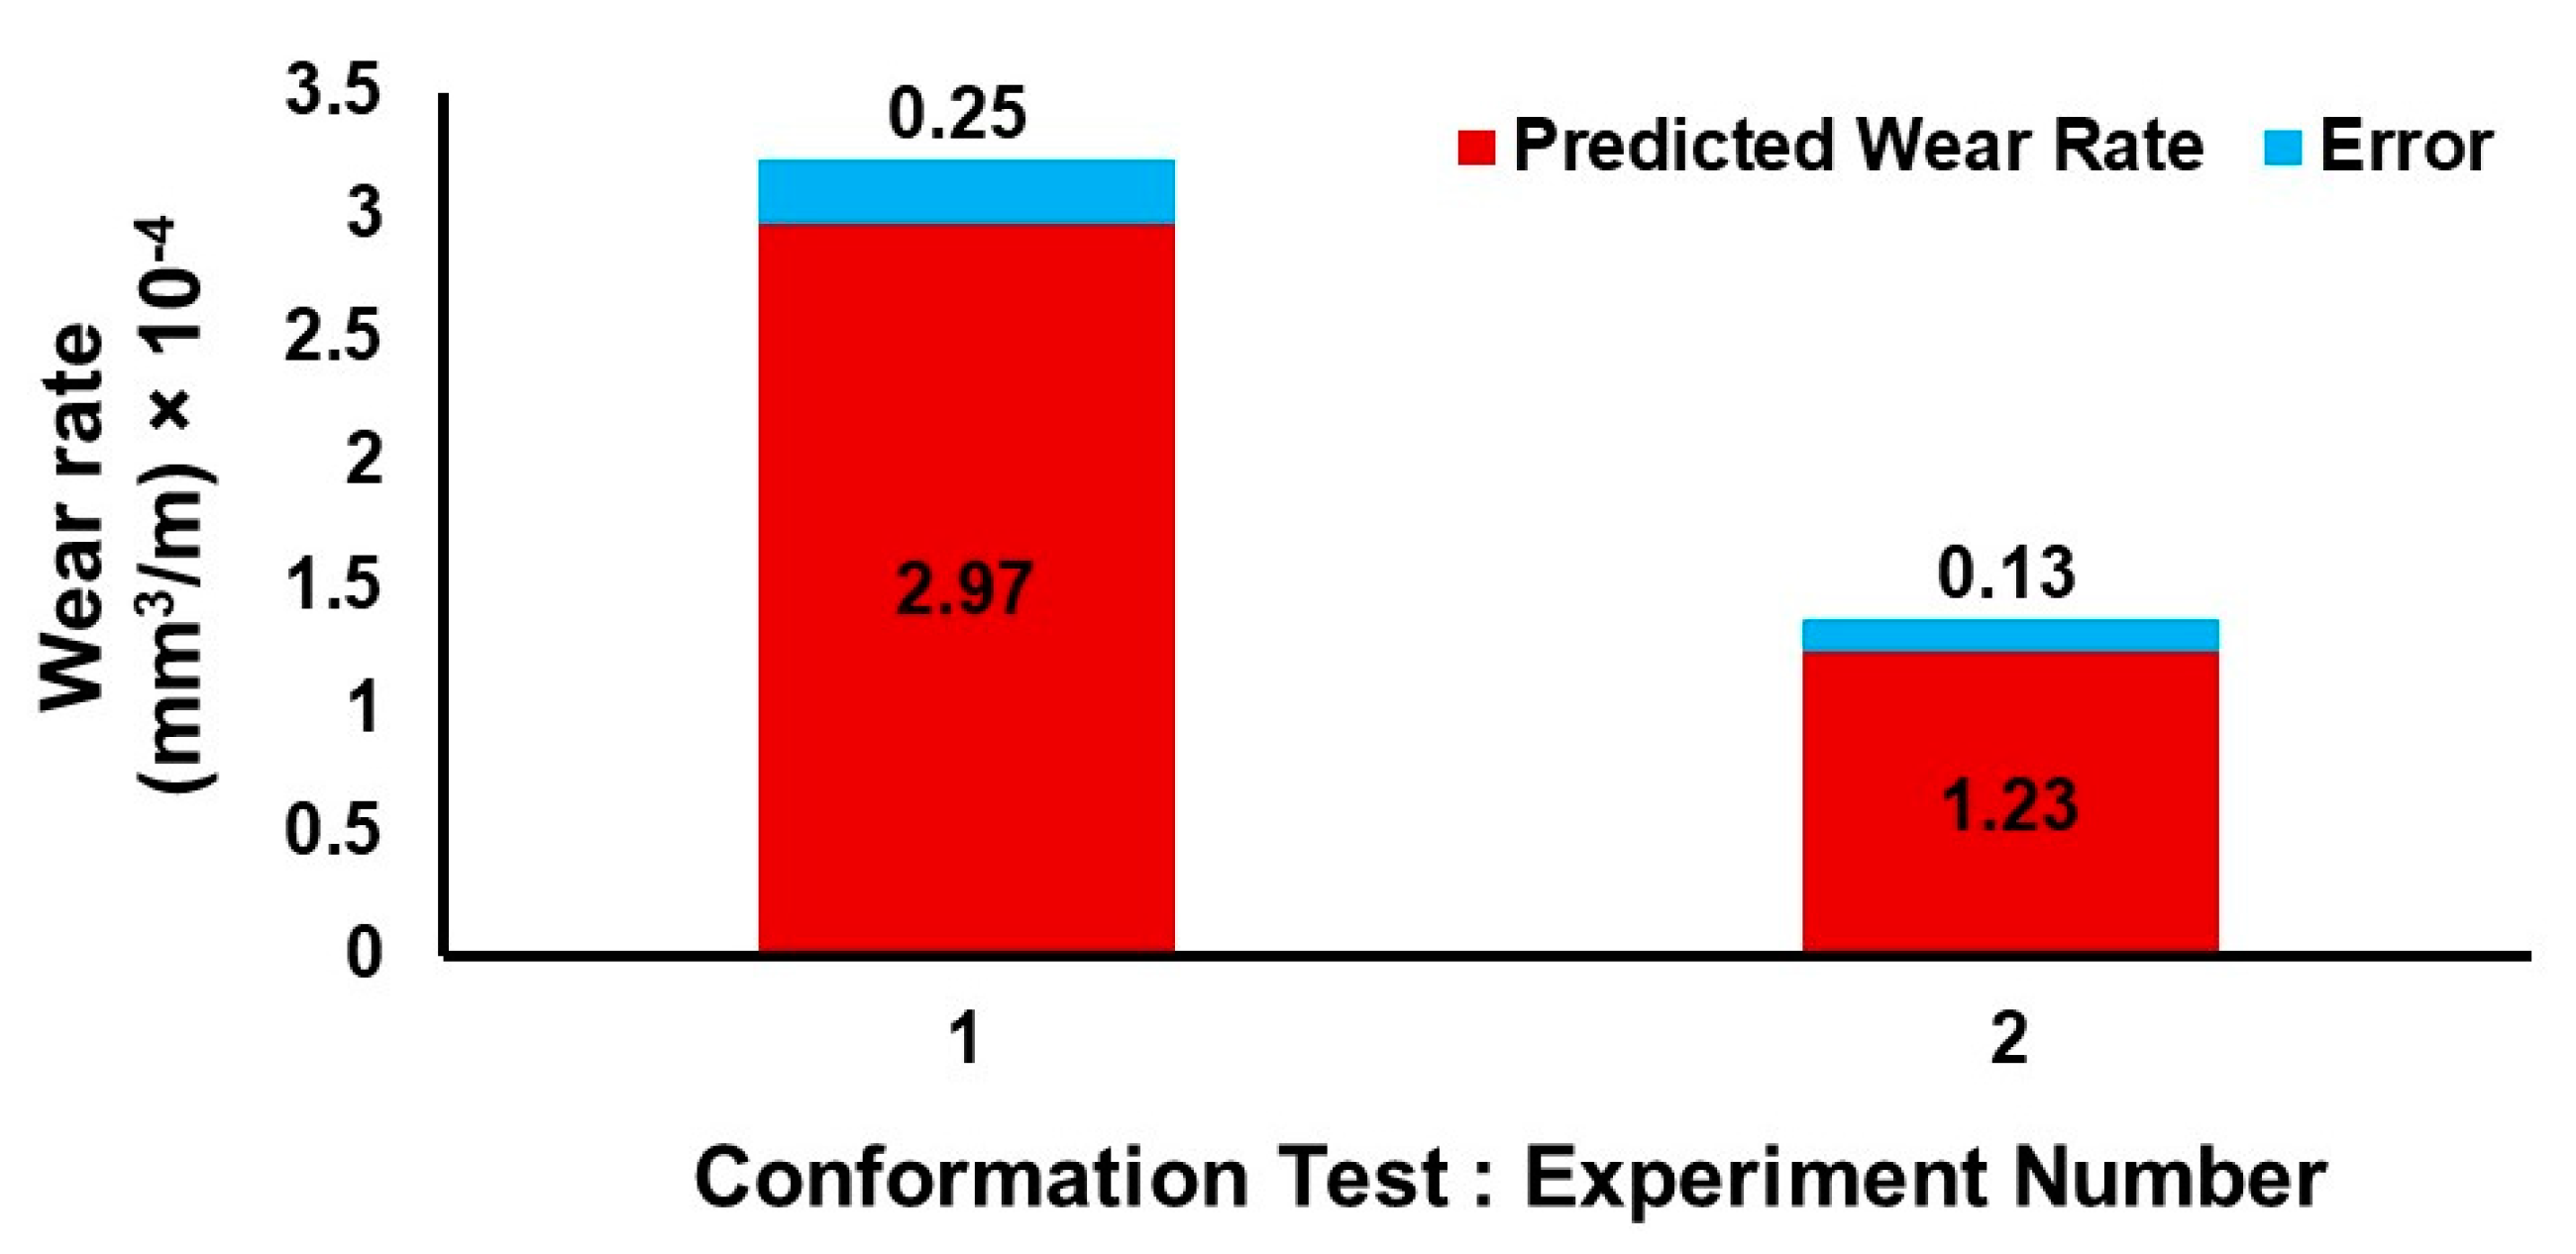
6. Validation Test and Wear Mechanism

The validation assessment comes at the end of the experiment design phase. A verification test is required to guarantee that the trials were done correctly after determining the optimal level for a process parameter. Dry sliding tests with pre-defined sets of limits were used to validate the statistical inquiry, as indicated in Table 10. Table 11 shows the test results, deemed confirmatory with an error rate of less than 10%. The difference between experimental and numerical validation should, in general, be less than 10%, but this depends on a number of factors, most notably the complexity of the process. The reliability of the model is indicated by a low error [39,40,41]. The wear rate for confirmation testing is shown in Figure 9.
The development of wear debris is triggered by shear stresses and relative motion. As determined by the analysis, the optimal state produced the least amount of wear. The SEM image (at 40 N, 1500 m, 3.141 m/s) also confirmed it, as seen in Figure 10a. At the interface of the pin and disc was the friction layer. The friction layer was generated by the progressive compaction and sintering of worn-out particles from both the pin and the disc [5,6]. It functioned as a third body mechanism, lowering the wear rate and possibly resulting in optimal wear. Furthermore, at 40 N, 1500 m, and 3.141 m/s in Figure 11a is shown the detachment of the friction layer on the GCI disc, confirms the adhesive wear mechanism.
At the high operating condition of 60 N, maximum wear debris generation could be noticed, as shown in Figure 10b. Figure 10c,d show wear debris formation under 50 N conditions. The wear process is inherently dynamic. The friction layer’s constant build-up and break-up can be seen. The wear process is abrasive in nature, as shown in Figure 11b. Plowing action could be clearly seen on the GCI disc by the abrasive particles of the friction material at 60 N, 4500 m, and 1.047 m/s.
The radar chart depicting the relations of the various process elements is shown in Figure 12a. It is a graphical way of showing the proportion of participation of the three input parameters in multivariate data. The normal load has the most significant influence on wear rate, as shown in Figure 12b, followed by the sliding velocity and sliding distance.

7. Conclusions

The Taguchi design of the experiment coupled with ANOVA was used to identify the best operating parameters for copper-free semi-metallic friction material against a grey cast iron disc in dry sliding. Validation tests were carried out to ensure that the ideal wear rate was achieved. The process can be further studied and optimized with the inclusion of more factors that affect the wear rate of semi-metallic friction material, such as temperature and humidity, etc. The following conclusions can be drawn from the research:
  • Normal load significantly impacts copper-free semi-metallic friction material wear rate, followed by sliding velocity and sliding distance.
  • The wear rate at intermediate conditions can be calculated using the regression equation of semi-metallic friction material.
  • Test results confirmed an error of less than 10% linked to the dry sliding wear rate. As a result, the wear rate estimation regression model was effectively tested.
  • The normal load had the most significant impact on the wear process (71.02%), followed by sliding velocity (27.84%) and sliding distance (1.14%).
  • The dynamic high wear at 60 N, 4500 m, and 1.047 m/s was confirmed by SEM analysis, and the optimal wear conditions were found at 40 N, 1500 m, and 3.141 m/s.
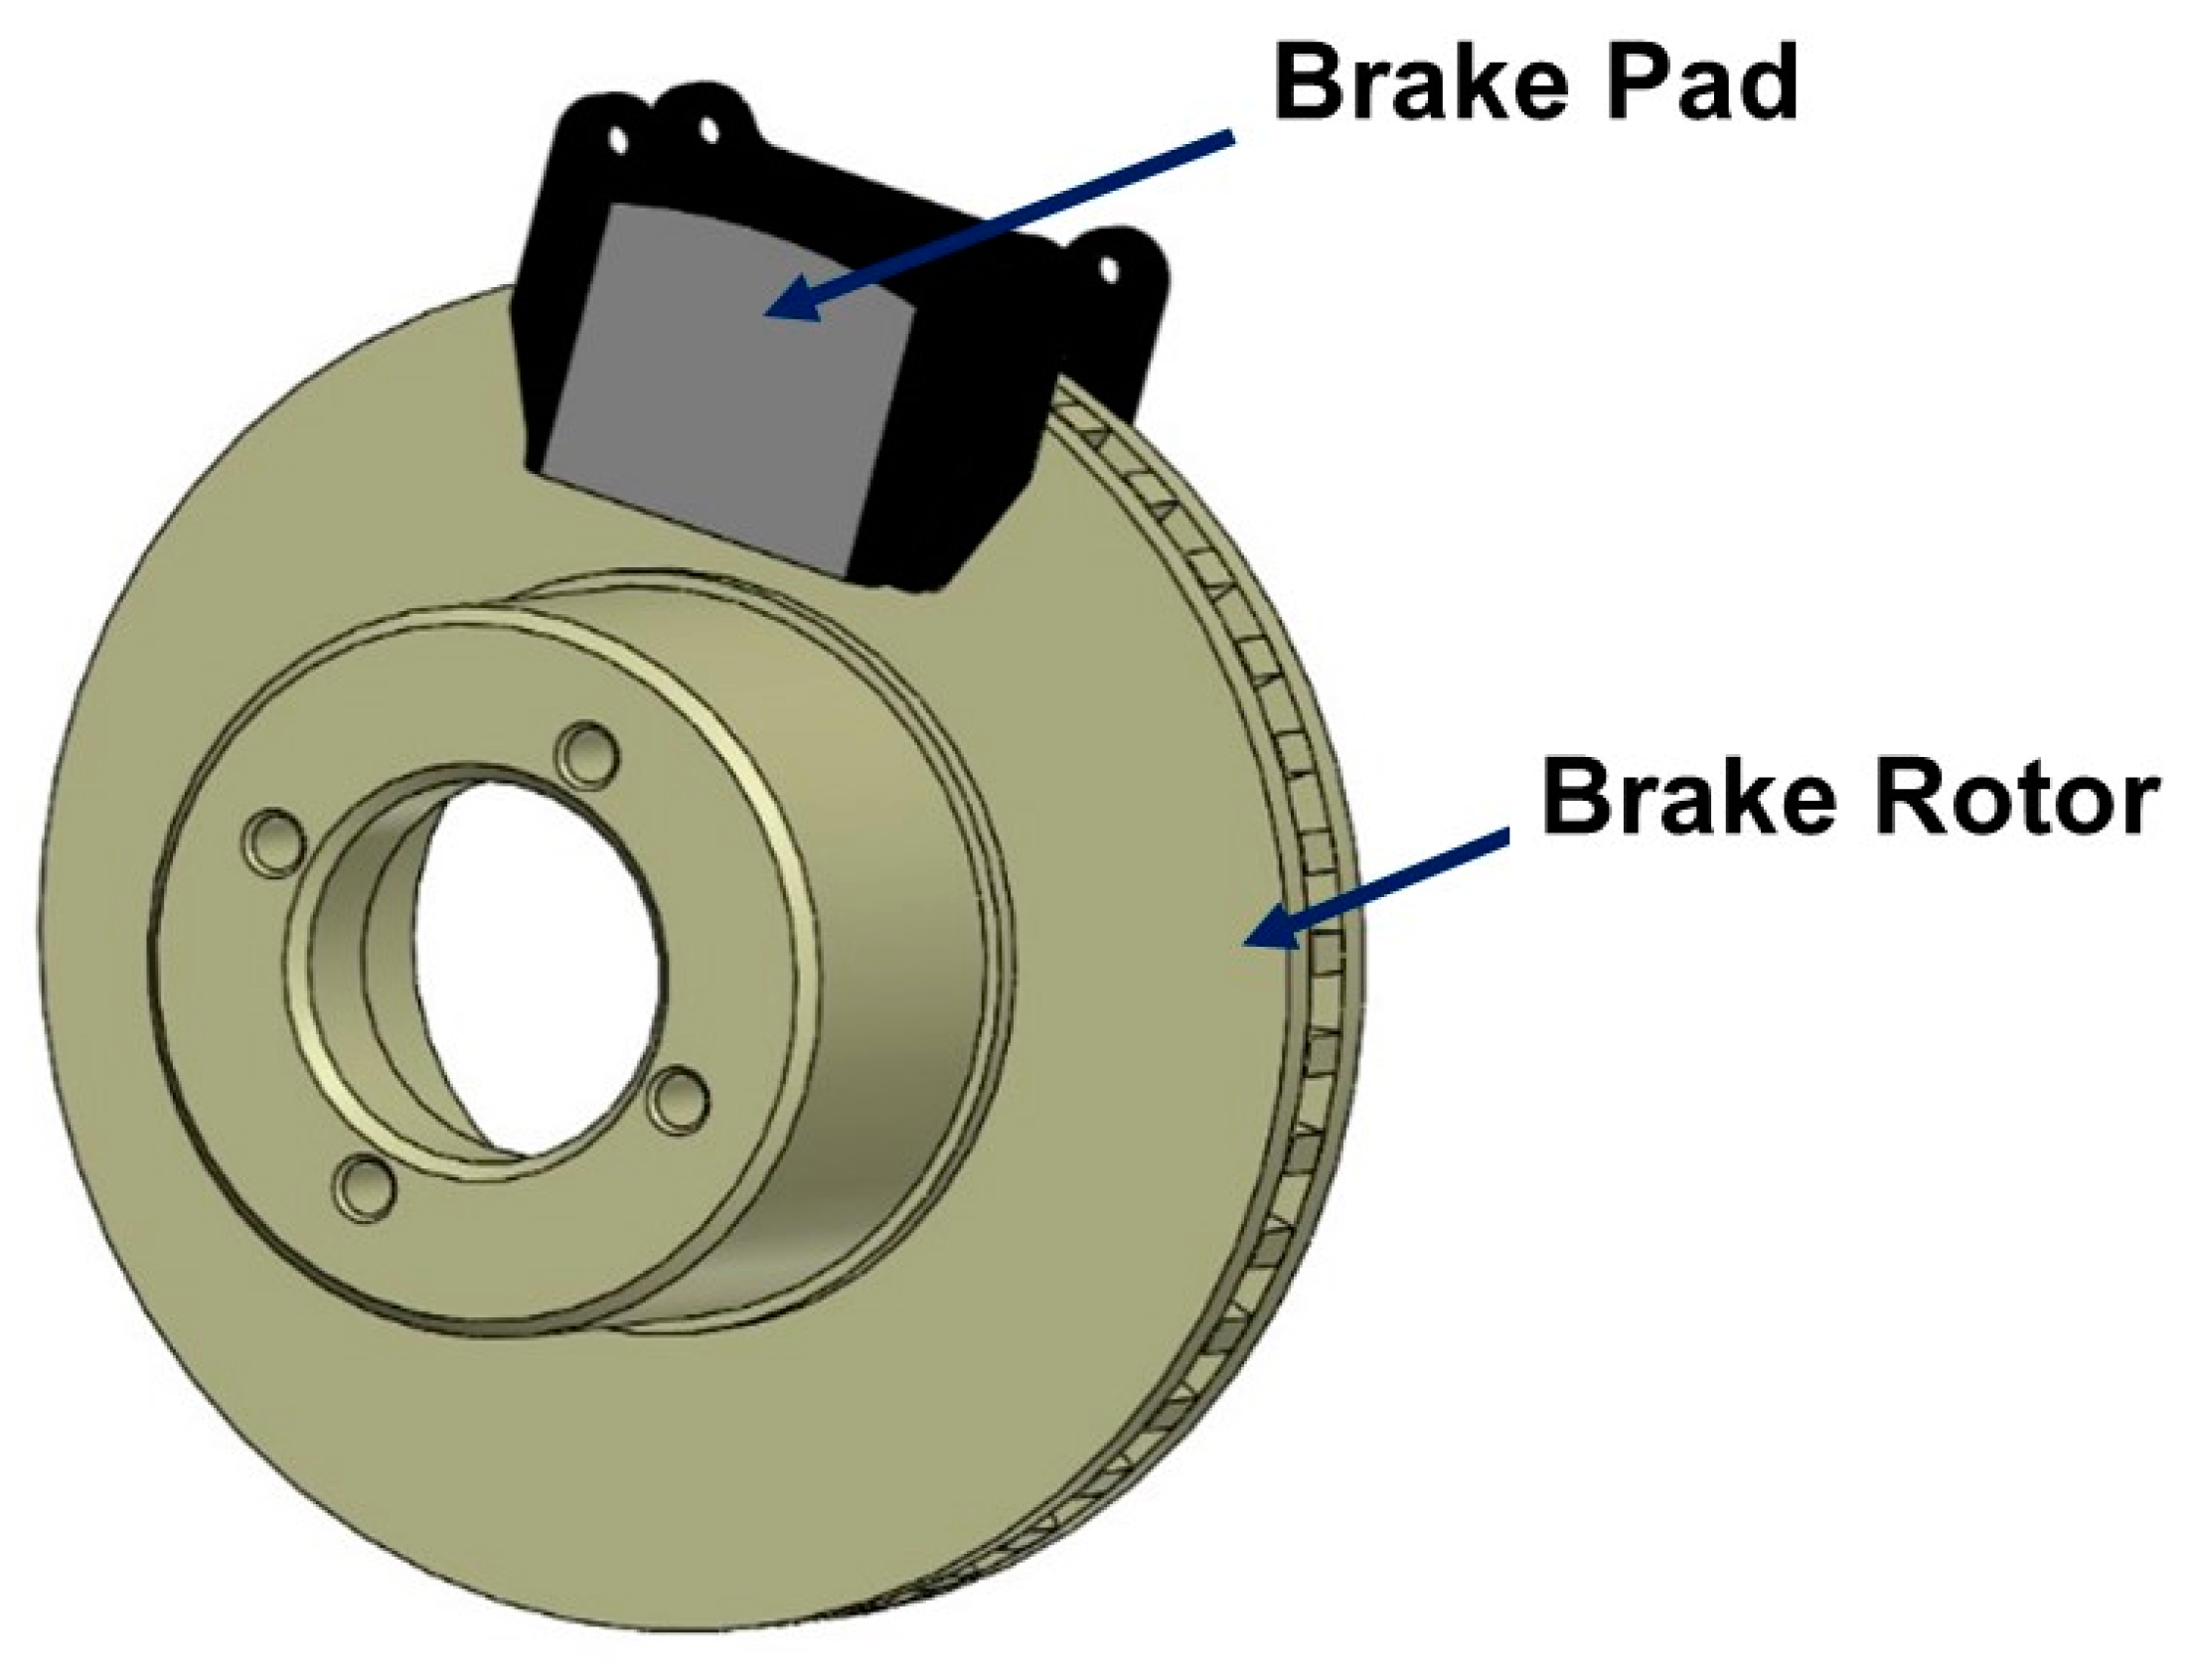
  • At lower loading conditions, i.e., 40 N transfer of the friction layer found on the GCI disc, the adhesive wear dominance at the lower load was confirmed, whereas at 60 N, the plowing action that could be seen on the GCI disc confirmed the abrasive wear mechanism.

Author Contributions

A.S.: Visualization, Methodology, Investigation, Validation, Writing—original draft, Data curation. K.J.: Visualization, Writing—original draft, Methodology. A.M.: Investigation, Data curation. P.C.V.: Writing—review and editing, Fund acquisition, Conceptualization, Supervision. All authors have read and agreed to the published version of the manuscript.

Funding

This research was funded by the Science and Engineering Research Board (SERB), under the start-up research grant (SRG) number SRG/2021/001174, and the APC was funded by the Department of Mechanical Engineering, BITS Pilani-Hyderabad Campus.

Institutional Review Board Statement

Not applicable.

Informed Consent Statement

Not applicable.

Data Availability Statement

The datasets used and/or analyzed during the current study are available from the corresponding author upon reasonable request.

Acknowledgments

The authors are thankful to the BITS Pilani-Hyderabad campus central library for providing access to different journals and the Central Analytical Laboratory (CAL) for SEM observations.

Conflicts of Interest

The authors declare that they have no known competing financial interests.

Nomenclature

CoFcoefficient of friction
DOEdesign of experiment
xSliding distance (meters)
dwear track diameter (meters)
Nrotor speed (RPM)
ttime (mins)
vsliding velocity (m/s)
Ddiameter of the rotor (meters)
SNsignal to noise
Nnumber of observations
Wffinal weight of the pin (g)
Wiinitial weight of the pin (g)
ρdensity of pin (g/mm3)
Qwear rate (mm3/m)
lsliding distances (meters)
µarithmetic mean
NDnot defined
xivalue of ith independent variable
x ¯ mean of independent variables
SEMscanning electron microscope
Bal.balance
St. dev.standard deviation
PQTnet-addition of squares
PSLload-addition of squares
PSDsliding distance addition of squares
PSVsliding velocity addition of squares
Sdi2addition of the experiments at level i
DFdegree of freedom
Seq. SSsequential sums of squares
Adj. SSadjusted sum of squares
Adj. MSadjusted mean squares
Ffactor value
pprobability value
yforecasted value
βy-intercept
error
σstandard deviation
β1slope parameter
yivalue of ith dependent variable
y ¯   mean of dependent variables
XRFX-ray fluorescence spectroscopy
EDSenergy dispersive X-ray spectroscopy

References

  1. Gramstat, S.; Mertens, T.; Waninger, R.; Lugovyy, D. Impacts on Brake Particle Emission Testing. Atmosphere 2020, 11, 1132. [Google Scholar] [CrossRef]
  2. di Confiengo, G.G.; Faga, M.G. Ecological Transition in the Field of Brake Pad Manufacturing: An Overview of the Potential Green Constituents. Sustainability 2022, 14, 2508. [Google Scholar] [CrossRef]
  3. Rajaei, H.; Menapace, C.; Amirabdollahian, S.; Perini, M.; Straffelini, G.; Gialanella, S. Microstructural and Tribological Evaluation of Brake Disc Refurbishing Using Fe-Based Coating via Directed Energy Deposition. Metals 2022, 12, 465. [Google Scholar] [CrossRef]
  4. Verma, P.C. Automotive Brake Materials: Characterization of Wear Products and Relevant Mechanisms at High Temperature. Ph.D. Thesis, University of Trento, Trento, Italy, 2016. [Google Scholar]
  5. Verma, P.C.; Menapace, L.; Bonfanti, A.; Ciudin, R.; Gialanella, S.; Straffelini, G. Braking Pad-Disc System: Wear Mechanisms and Formation of Wear Fragments. Wear 2015, 322–323, 251–258. [Google Scholar] [CrossRef]
  6. Straffelini, G.; Verma, P.C.; Metinoz, I.; Ciudin, R.; Perricone, G.; Gialanella, S. Wear Behavior of a Low Metallic Friction Material Dry Sliding against a Cast Iron Disc: Role of the Heat-Treatment of the Disc. Wear 2016, 348–349, 10–16. [Google Scholar] [CrossRef]
  7. Straffelini, G.; Verlinski, S.; Verma, P.C.; Valota, G.; Gialanella, S. Wear and Contact Temperature Evolution in Pin-on-Disc Tribotesting of Low-Metallic Friction Material Sliding Against Pearlitic Cast Iron. Tribol. Lett. 2016, 62, 36. [Google Scholar] [CrossRef]
  8. Verma, P.C.; Ciudin, R.; Bonfanti, A.; Aswath, P.; Straffelini, G.; Gialanella, S. Role of the Friction Layer in the High-Temperature Pin-On-Disc Study of a Brake Material. Wear 2016, 346–347, 56–65. [Google Scholar] [CrossRef]
  9. Mulani, S.M.; Kumar, A.; Shaikh, H.N.E.A.; Saurabh, A.; Singh, P.K.; Verma, P.C. A Review on recent Development and Challenges in Automotive Brake Pad-Disc System. Mater. Today Proc. 2022, 56, 447–454. [Google Scholar] [CrossRef]
  10. Sethupathi, P.B.; Chandradass, J.; Saibalaji, M. Comparative study of Disc Brake Pads Sold in Indian Market—Impact on Safety and Environmental Aspects. Environ. Technol. Innov. 2021, 21, 101245. [Google Scholar] [CrossRef]
  11. Tavangar, R.; Ansari Moghadam, H.; Khavandi, A.; Banaeifar, S. Comparison of Dry Sliding Behavior and Wear Mechanism of Low Metallic and Copper-Free Brake Pads. Tribol. Int. 2020, 151, 106416. [Google Scholar] [CrossRef]
  12. Shi, X.; Wen, D.; Wang, S.; Wang, G.; Zhang, M.; Li, J.; Xue, C. Investigation on Friction and Wear Performance of Laser Cladding Ni-Based Alloy Coating on Brake Disc. Optik 2021, 242, 167227. [Google Scholar] [CrossRef]
  13. Alves, C.; Evtyugina, M.; Vicente, A.; Conca, E.; Amato, F. Organic Profiles of Brake Wear Particles. Atmos. Res. 2021, 255, 105557. [Google Scholar] [CrossRef]
  14. Perricone, G.; Alemani, M.; Wahlström, J.; Olofsson, U. A Proposed Driving Cycle for Brake Emissions Investigation for Test Stand. Proc. Inst. Mech. Eng. Part D J. Automob. Eng. 2020, 234, 122–135. [Google Scholar] [CrossRef]
  15. Rahimi, M.; Bortoluzzi, D.; Wahlström, J. Input Parameters for Airborne Brake Wear Emission Simulations: A Comprehensive Review. Atmosphere 2021, 12, 871. [Google Scholar] [CrossRef]
  16. Sinha, A.; Ischia, G.; Menapace, C.; Gialanella, S. Experimental Characterization Protocols for Wear Products from Disc Brake Materials. Atmosphere 2020, 11, 1102. [Google Scholar] [CrossRef]
  17. Kim, S.-H.; Jeong, M.H.; Kim, J.; Shim, W.; Kwon, S.-U.; Lee, J.-J.; Huh, S.H.; Pee, J.-H.; Kim, J.-Y. Dynamometric Investigation on Airborne Particulate Matter (PM) from Friction Materials for Automobile: Impact of Abrasive and Lubricant on PM Emission Factor. Lubricants 2021, 9, 118. [Google Scholar] [CrossRef]
  18. Stojanovic, N.; Abdullah, O.I.; Grujic, I.; Boskovic, B. Particles Formation Due to the Wear of Tires and Measures for the Wear Reduction: A Review. Proc. Inst. Mech. Eng. Part D J. Automob. Eng. 2021. [Google Scholar] [CrossRef]
  19. Shinde, D.; Bulsara, M.; Patil, J. Wear Analysis of Eco-Friendly Non-Asbestos Friction-Lining Material Applied in an Automotive Drum Brake: Experimental and Finite-Element Analysis. Proc. Inst. Mech. Eng. Part J J. Eng. Tribol. 2022, 236, 552–562. [Google Scholar] [CrossRef]
  20. Liati, A.; Schreiber, D.; Lugovyy, D.; Gramstat, S.; Eggenschwiler, P.D. Airborne Particulate Matter Emissions from Vehicle Brakes in Micro- and Nano-Scales: Morphology and Chemistry by Electron Microscopy. Atmos. Environ. 2019, 212, 281–289. [Google Scholar] [CrossRef]
  21. Kumar, S.; Priyadarshan; Ghosh, S.K. Statistical and Computational Analysis of an Environment-Friendly MWCNT/NiSO4 Composite Materials. J. Manuf. Process. 2021, 66, 11–26. [Google Scholar] [CrossRef]
  22. Luo, S.-Y.; Weng, C.-Y. A Study of the Metal Matrix Friction Materials of Hot Pressing Using Taguchi Method. Adv. Mater. Process. Technol. 2018, 4, 7–15. [Google Scholar] [CrossRef]
  23. Veličković, S.; Stojanović, B.; Babić, M.; Bobic, I. Optimization of Tribological Properties of Aluminum Hybrid Composites Using Taguchi Design. J. Compos. Mater. 2017, 51, 2505–2515. [Google Scholar] [CrossRef]
  24. Lyu, Y.; Ma, J.; Åström, A.H.; Wahlström, J.; Olofsson, U. Recycling of Worn Out Brake Pads—Impact on Tribology and Environment. Sci. Rep. 2020, 10, 8369. [Google Scholar] [CrossRef] [PubMed]
  25. Borawski, A. Impact of Operating Time on Selected Tribological Properties of the Friction Material in the Brake Pads of Passenger Cars. Materials 2021, 14, 884. [Google Scholar] [CrossRef]
  26. Mehboob, H.; Chang, S.-H. Optimal Design of a Functionally Graded Biodegradable Composite Bone Plate by Using the Taguchi Method and Finite Element Analysis. Compos. Struct. 2015, 119, 166–173. [Google Scholar] [CrossRef]
  27. Pattanaik, A.; Satpathy, M.P.; Mishra, S.C. Dry Sliding Wear Behavior of Epoxy Fly Ash Composite with Taguchi Optimization. Eng. Sci. Technol. Int. J. 2016, 19, 710–716. [Google Scholar] [CrossRef] [Green Version]
  28. Banker, V.J.; Mistry, J.M.; Thakor, M.R.; Upadhyay, B.H. Wear Behavior in Dry Sliding of Inconel 600 Alloy Using Taguchi Method and Regression Analysis. Procedia Technol. 2016, 23, 383–390. [Google Scholar] [CrossRef] [Green Version]
  29. Li, G.; Hao, S.; Gao, W.; Lu, Z. The Effect of Applied Load and Rotation Speed on Wear Characteristics of Al-Cu-Li Alloy. J. Mater. Eng. Perform. 2022, 31, 5875–5885. [Google Scholar] [CrossRef]
  30. Pai, D.; Pai, A.; Kumar, S.; Deb, A. The Response of Two-Wheeler Tires to Three-Body Wear Phenomena by Experimental Simulation of Off-Road Terrains. Proc. Inst. Mech. Eng. Part D J. Automob. Eng. 2019, 233, 3504–3514. [Google Scholar] [CrossRef]
  31. Neog, S.P.; Kumar, A.R.; Das Bakshi, S.; Das, S. Understanding the Complexities of Dry Sliding Wear Behaviour of Steels. Mater. Sci. Technol. 2021, 37, 504–518. [Google Scholar] [CrossRef]
  32. Yun, R.; Filip, P.; Lu, Y. Performance and Evaluation of Eco-Friendly Brake Friction Materials. Tribol. Int. 2010, 43, 2010–2019. [Google Scholar] [CrossRef]
  33. Jerbi, A.; Ammar, A.; Krid, M.; Salah, B. Performance Optimization of a Flexible Manufacturing System Using Simulation: The Taguchi Method versus OptQuest. Simulation 2019, 95, 1085–1096. [Google Scholar] [CrossRef]
  34. Shah, R.; Chen, R.; Woydt, M. The Effects of Energy Efficiency and Resource Consumption on Environmental Sustainability. Lubricants 2021, 9, 117. [Google Scholar] [CrossRef]
  35. Reddy, V.V.; Mandava, R.K.; Rao, V.R.; Mandava, S. Optimization of Dry Sliding Wear Parameters of Al 7075 MMC’s Using Taguchi Method. Mater. Today Proc. 2022, 62, 6684–6688. [Google Scholar] [CrossRef]
  36. Taguchi, G.; Rafanelli, A.J. Taguchi on Robust Technology Development: Bringing Quality Engineering Upstream; ASME Press: New York, NY, USA, 1993. [Google Scholar]
  37. Mustapha, A.N.; Zhang, Y.; Zhang, Z.; Ding, Y.; Yuan, Q.; Li, Y. Taguchi and ANOVA Analysis for the Optimization of the Microencapsulation of a Volatile Phase Change Material. J. Mater. Res. Technol. 2021, 11, 667–680. [Google Scholar] [CrossRef]
  38. Schon, A.F.; Castro, N.A.; Barros, A.D.S.; Spinelli, J.E.; Garcia, A.; Cheung, N.; Silva, B.L. Multiple Linear Regression Approach to Predict Tensile Properties of Sn-Ag-Cu (SAC) Alloys. Mater. Lett. 2021, 304, 130587. [Google Scholar] [CrossRef]
  39. Aamir, M.; Tu, S.; Tolouei-Rad, M.; Giasin, K.; Vafadar, A. Optimization and Modeling of Process Parameters in Multi-Hole Simultaneous Drilling Using Taguchi Method and Fuzzy Logic Approach. Materials 2020, 13, 680. [Google Scholar] [CrossRef] [Green Version]
  40. Chan, S.N.; Wong, W.Y.; Walvekar, R.; Kadhum, A.A.H.; Khalid, M. Parametric Optimization of Pulsed Laser Ablation on Stainless Steel for Improving Corrosion Resistance by Taguchi Method. Mater. Res. Express 2018, 6, 026533. [Google Scholar] [CrossRef]
  41. Hora, J.; Campos, P. A Review of Performance Criteria to Validate Simulation Models. Expert Syst. 2015, 32, 578–595. [Google Scholar] [CrossRef]
Figure 1. Schematic of the automotive brake pad–disc system.
Lubricants 10 00161 g001
Figure 2. Process methodology flow chart.
Lubricants 10 00161 g002
Figure 3. (a) Semi-metallic brake pad pin; (b) cast iron brake rotor with actual dimensions used in the friction test.
Lubricants 10 00161 g003
Figure 4. (a) SEM microstructure of the starting brake-pad material; (bf) corresponding EDX elemental mapping of Fe, Ni, Ba, C, and O, respectively.
Lubricants 10 00161 g004
Figure 5. Pin-on-disc tribometer used for friction test.
Lubricants 10 00161 g005
Figure 6. Main effects plot for (a) wear rate of the friction material, and (b) SN ratio at different operating conditions of load, sliding distance, and sliding velocity.
Lubricants 10 00161 g006aLubricants 10 00161 g006b
Figure 7. Interaction effect of load, sliding distance, and sliding speed on the wear rate of friction material at different operating conditions.
Lubricants 10 00161 g007
Figure 8. Contour plot of (a) wear rate of friction material vs. sliding velocity and load, (b) wear rate of friction vs. sliding distance and load, and (c) wear rate of friction material vs. sliding velocity and sliding distance.
Lubricants 10 00161 g008
Figure 9. Bar graph showing the predicted wear rate and difference with experimental wear rate for friction material tested for (40 N, 3000 m, 1.047 m/s) and (40 N, 4500 m, 3.141 m/s).
Lubricants 10 00161 g009
Figure 10. SEM images of worn brake pin surfaces at different operating conditions (load, sliding distance, and sliding velocity): (a) Least wear debris at (40 N, 1500 m, 3.141 m/s), (b) maximized wear debris at (60 N, 4500 m, 1.047 m/s), (c) wear debris at (50 N, 3500 m, 3.141 m/s), and (d) wear debris at (50 N, 4500 m, 2.09 m/s), respectively.
Lubricants 10 00161 g010
Figure 11. SEM image of worn surface of GCI disc: (a) 40 N, 1500 m, 3.141 m/s; (b) 60 N, 4500 m, 1.047 m/s.
Lubricants 10 00161 g011
Figure 12. (a) Radar graph showing the interaction between factors of wear. (b) Bar graph representing the contribution of each process factor to the wear rate of semi-metallic friction material.
Lubricants 10 00161 g012aLubricants 10 00161 g012b
Table 1. Selected control factors and respective levels for wear tests of the friction material.
LevelFactors
Load (N)Sliding Distance (m)Sliding Velocity (m/s)
1.4015001.047
2.5030002.094
3.6045003.141
Table 2. SN ratios and their meanings.
SN RatioObjectiveMeaning
−10 log   1   n   ( Σ 1/yi2)Higher is betterResponse maximization
10 log (µ/σ)2Nominal is the bestShifts mean to a target value
−10 log   1   n   ( Σ yi2)Smaller is betterResponse minimization
Table 3. An orthogonal array of variables (load, sliding distance, and sliding velocity) for process optimization.
S. No.Load (N)Sliding Distance (m)Sliding Velocity (m/s)
14015001.047
24030002.094
34045003.141
45015002.094
55030003.141
65045001.047
76015003.141
86030001.047
96045002.094
Table 4. Friction material composition as examined by XRF.
ElementWt. (%)
Si0.187
Ni1.827
S1.013
Ca1.229
Mn0.448
Cr0.258
Ti0.133
Fe18.063
P0.089
Zn0.276
Ba3.140
Bal.ND
Table 5. Accuracy and precision of measuring instruments.
EquipmentAccuracyPrecision
Pin-on-disc tribometerLVDT ± 1 μmLVDT 10−8 μm
Weighing balance±10−4 g10−4 g
Vernier caliper±10−2 mm10−2 mm
Vickers hardness tester±10 HV6010−1 HV60
Surface roughness tester±10−2 μm10−3 μm
Table 6. An orthogonal array of process variables for semi-metallic friction material.
S. No.Load
(N)
Sliding
Distance (m)
Sliding Velocity (m/s)Wear Rate (mm3/m)
×10−4
St. Dev.SN Ratio
14015001.0472.38140.0003272.4633
24030002.0941.79330.000674.9269
34045003.1411.36710.0010177.2839
45015002.0943.17520.0015369.9645
55030003.1412.31520.0014172.7080
65045001.0475.42430.0016265.3130
76015003.1413.83670.0017868.3208
86030001.0479.12880.0024360.7917
96045002.0946.17460.0012664.1877
Table 7. Responses for mean wear and corresponding ranking of process variables.
LevelLoadSliding DistanceSliding Velocity
10.00018470.00031310.0005645
20.00036380.00044120.0003344
30.00060090.00039510.0002506
Delta (Δ)0.00041620.00012810.0003139
Rank132
Table 8. Response for SN ratio for wear and corresponding ranking of process variables.
LevelLoadSliding DistanceSliding Velocity
174.8914370.2495666.18937
269.3286169.4756370.26794
365.0082669.5031172.77099
Delta (Δ)9.883170.773936.58162
Rank132
Table 9. ANOVA for SN ratios.
SourceDF
(Degree of Freedom)
Seq. SS
(Sequential Sums of Squares)
Adj. SS
(Adjusted Sum of Squares)
Adj. MS
(Adjusted Mean Squares)
F
(Factor Value)
p
(Probability Value)
Load2164.277164.27782.1383558.470.002
Sliding Distance22.6442.6441.32228.990.1
Sliding Velocity265.06565.06532.5327221.20.005
Residual Error20.2940.2940.1471
Total8231.281
Table 10. Confirmatory test table of process variables.
Experiment No.Load (N)Sliding Distance (m)Sliding Velocity (m/s)
14030001.047
24045003.141
Table 11. Result of confirmation test for wear rate of semi-metallic friction material.
Experiment No.Experimental
Wear Rate (mm3/m) × 10−4
Predicted
Wear Rate (mm3/m) × 10−4
% Error
12.722.979.19
21.361.239.55
Publisher’s Note: MDPI stays neutral with regard to jurisdictional claims in published maps and institutional affiliations.

