Article

Influence of Graphene Nanosheets on Thermo-Physical and Tribological Properties of Sustainable Cutting Fluids for MQL Application in Machining Processes

by
Vitor Baldin
1,
Leonardo Rosa Ribeiro da Silva
1,2,*,
Rogério Valentim Gelamo
3,
Andres Bustillo Iglesias
4,
Rosemar Batista da Silva
2,
Navneet Khanna
5 and
Alisson Rocha Machado
1,2
1
Graduate Program in Mechanical Engineering, Pontifícia Universidade Católica do Paraná—PUC-PR, R. Imaculada Conceição, 1155, Bairro Prado Velho, Curitiba 80215-901, Brazil
2
School of Mechanical Engineering, Federal University of Uberlandia, Av. João Naves de Ávila, 2121, Bloco 1M, Uberlândia 38400-902, Brazil
3
Institute of Technogical and Exact Sciences, Federal University of Triângulo Mineiro, Av. Doutor Randolfo Borges Júnior, 1250, Uberaba 38025-180, Brazil
4
Departamento de Ingenieria Informatica, Universidad de Burgos, Avda Cantabria s/n, 09006 Burgos, Spain
5
Advanced Manufacturing Laboratory, Institute of Infrastructure Technology, Research and Management, Ahmedabad 380008, India
*
Author to whom correspondence should be addressed.
Lubricants 2022, 10(8), 193; https://doi.org/10.3390/lubricants10080193
Submission received: 2 August 2022 / Revised: 14 August 2022 / Accepted: 16 August 2022 / Published: 21 August 2022
(This article belongs to the Special Issue Methods of Application of Cutting Fluids in Machining)

Abstract

:
The growing need to increase productivity and pressures for more sustainable manufacturing processes lead to a shift to less harmful lubrication systems that are less harmful to nature and the people involved. The minimal quantity lubrication system (MQL) stands out in this respect, especially in interrupted cutting processes such as milling, due to the cutting interface’s highly dynamic and chaotic nature. Using graphene sheets in cutting fluids also increases the efficiency of machining processes. This work investigates the influence on thermophysical and tribological properties of concentrations of 0.05 wt% and 0.1 wt% of graphene sheets in two vegetable-based and one mineral-based cutting fluids. The fluids are first characterized (viscosity, thermal conductivity, diffusivity, and wettability) and tested in reciprocating and ramp milling tests; all experiments are based on norms. The results show that the experiments with cutting fluids (with and without graphene) showed better tribological behavior than those in dry conditions. The graphene sheets alter the thermo-physical and tribological properties of the cutting fluids. The MQL15 vegetable-based fluid showed better lubricating properties in the milling tests, with better conditions for tribosystem chip–tool–workpiece interfaces, which makes the friction coefficient, and wear rate stable. Vegetable-based cutting fluids, even in minimum quantities and with graphene nanoparticles, have a high potential for increasing the efficiency and sustainability of the milling process.

Graphical Abstract

1. Introduction

Understanding the machining interface’s tribological behavior is crucial for modeling material removal processes using a defined geometry tool. To date, no model adequately describes the friction in the cutting areas [1]. Therefore, advances in understanding the contact conditions, the plastic deformation behavior, and the cutting temperatures describe this chaotic tribosystem [2,3]. Among the various factors that affect the friction coefficient at the cutting interface, the type of work and tool materials, tool geometry, tool wear, and lubricating conditions can be highlighted. These factors are responsible for changes in the machining forces and heat generated in the cutting zones, and as such, they continuously change the tribosystem’s behavior [4].
Tribological tests can help simulate the machining tribosystem, thus helping understand the friction coefficient behavior and tool wear [5,6]. Through these methods, it is possible to investigate the relationship of different types of coatings with the workpiece materials, load capacity of the tribo-films formed with fluids, or even a combination of coating, tribo-films, and geometry when using a real cutting tool as counterbody [7]. However, conventional tribometers can reproduce the friction coefficient at the cutting interface but with reservations because of the low relative velocities, contact pressures, and temperatures between the workpiece and the counterbody compared to the machining conditions [8,9], resulting in poor quantitative predictions [3]. Furthermore, there are no accurate predictive models that generally predict the coefficient of friction at the workpiece-tool interface, disregarding the shear effect of material inherent to the machining process. This difficulty is demonstrated by the fact that the Coulomb friction model [10] and models derived from the Merchant diagram [4,11] are still widely used in simulations, even though efforts to create more complex models considering the mechanical and adhesive effects of friction are already increasingly common [12,13].
One alternative for better simulation is to adapt machine centers as open tribometers [3,14]. This type of tribometer is often presented as an alternative to a more detailed investigation of the tribological aspects of machining [15], thus allowing for the use of test parameters closer to those used in actual machining conditions [2,16,17].
Salur et al. [18] compared MQL and dry machining in the AISI 1040 carbon steel milling process. The authors reported that the MQL outperformed dry cutting regarding cutting temperature (37%), power consumption (94%), and tool wear (74%). Sen et al. [19] studied mixtures of castor-palm oil (1:0.5–1:3) applied using the MQL delivery system in hard milling. The authors reported that the mixture with a 1:2 proportion resulted in lower surface roughness (8.262 and 16.146%), specific cutting energy (5.459% and 7.971%), and tool wear (2.445% and 3.155%). Mia et al. [20] compared dry, MQL, and solid lubricants applied with compressed air as machining environments in the hardened AISI 1060 steel turning process. According to the Pugh matrix environmental approach, the authors reported that the MQL system is the most environmentally friendly among the evaluated conditions.
Cutting fluid is typically used to reduce friction and heat generation during machining. The lubricating efficiency depends on the fluids’ ability to penetrate and form a lubricant film at the workpiece–tool–chip contact regions to reduce friction and decrease material adhesion on the tool [21,22]. In the case of fluids with lubricating nanoparticles, the particles cause different tribological effects between the two surfaces: they can highlight the effect of rolling, film formation, filling, and polishing [23,24]. The nanoparticles act as spacers between the tribological pairs, cause the scrolling effect, fill the surface gaps, and shear at high machining pressures, promoting the filling of cavities and cutting the peaks existing on the surface during machining; consequently, this process promotes polishing of the workpiece [24]. Tribofilm formation reduces friction between contact surfaces, reducing heat generation and wear [25]. In addition, increasing the nanofluid concentration and the degree of chemical interaction between the particles and the newly formed surface increases the protective film between the tribological pairs; therefore, the surface quality is increased, and the COF is reduced [26].
The literature is scarce regarding the tribological effects of graphene sheets in the cutting fluid on the machining process [27]. However, graphene presents excellent mechanical properties because of the atoms’ covalent bonds [28] and can act as an extreme pressure self-lubricating system that justifies its tribological application [29]. Furthermore, graphene increases the cutting fluids’ wettability [30] and reduces the machining temperature regardless of the fluid flow applied [31]. Past studies indicate that the use of graphene combined with other particles, such as aluminum oxide (Al2O3) [32] and silver (Ag) [33], can further enhance their tribological behavior in the machining process.
Abbas et al. [34] studied the effects of nanofluid MQL in the turning process of the AISI 1045 steel regarding the surface roughness and power consumption. The authors compared the results with dry and flood cooling and reported that the nanofluid MQL presented the highest sustainability index of all tested machining atmospheres. Dubey et al. [35] studied different multicriteria decision-making approaches to optimize the turning process of AISI 304 steel using nano MQL (alumina-graphene) as a machining environment. The authors reported that the use of the nano MQL reduced the cutting forces (13%), surface roughness (31%), and machining temperature (14%) when compared to the nano MQL with only alumina particles. Çamlı et al. [36] compared MQL and Nano-MQL lubrication in the machining process of high-strength steel destined to train wheel manufacturing. The authors reported that MQL and nano MQL reduced surface roughness (24% and 34%) and tool wear (34.1% and 37.6%) compared to dry machining.
This work investigates the influence on thermophysical and tribological properties of concentrations of 0.05 wt% and 0.1 wt% of graphene sheets in one mineral-based and two vegetable-based cutting fluids.

2. Materials and Methods

This section specifies the steel, graphene sheets, cutting fluids, equipment, and tools used in the experiments.

2.1. Workpiece Materials

In this study, AISI 1045 steel was used as the workpiece material, having the conventional microstructure composed predominantly of coarse perlite grains and ferrite, according to Figure 1. According to the ASTM E8/E8M [37] standard, the material was characterized by its stress-strain behavior resulting in an average ultimate tensile strength of 869 MPa and 13.60% strain, and its hardness, according to (ASTM E92-17 [38] standard, resulting in an average hardness of 262 ± 11.35 HV1.

2.2. Cutting Fluids

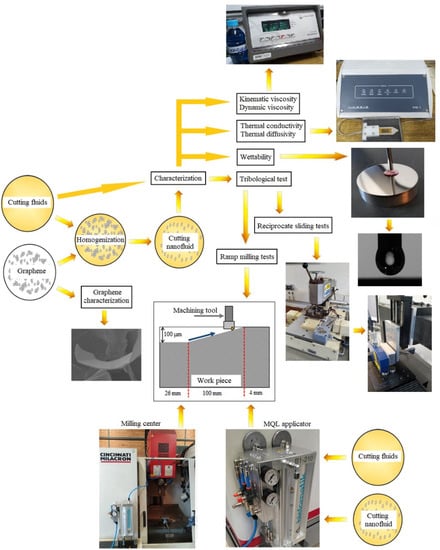
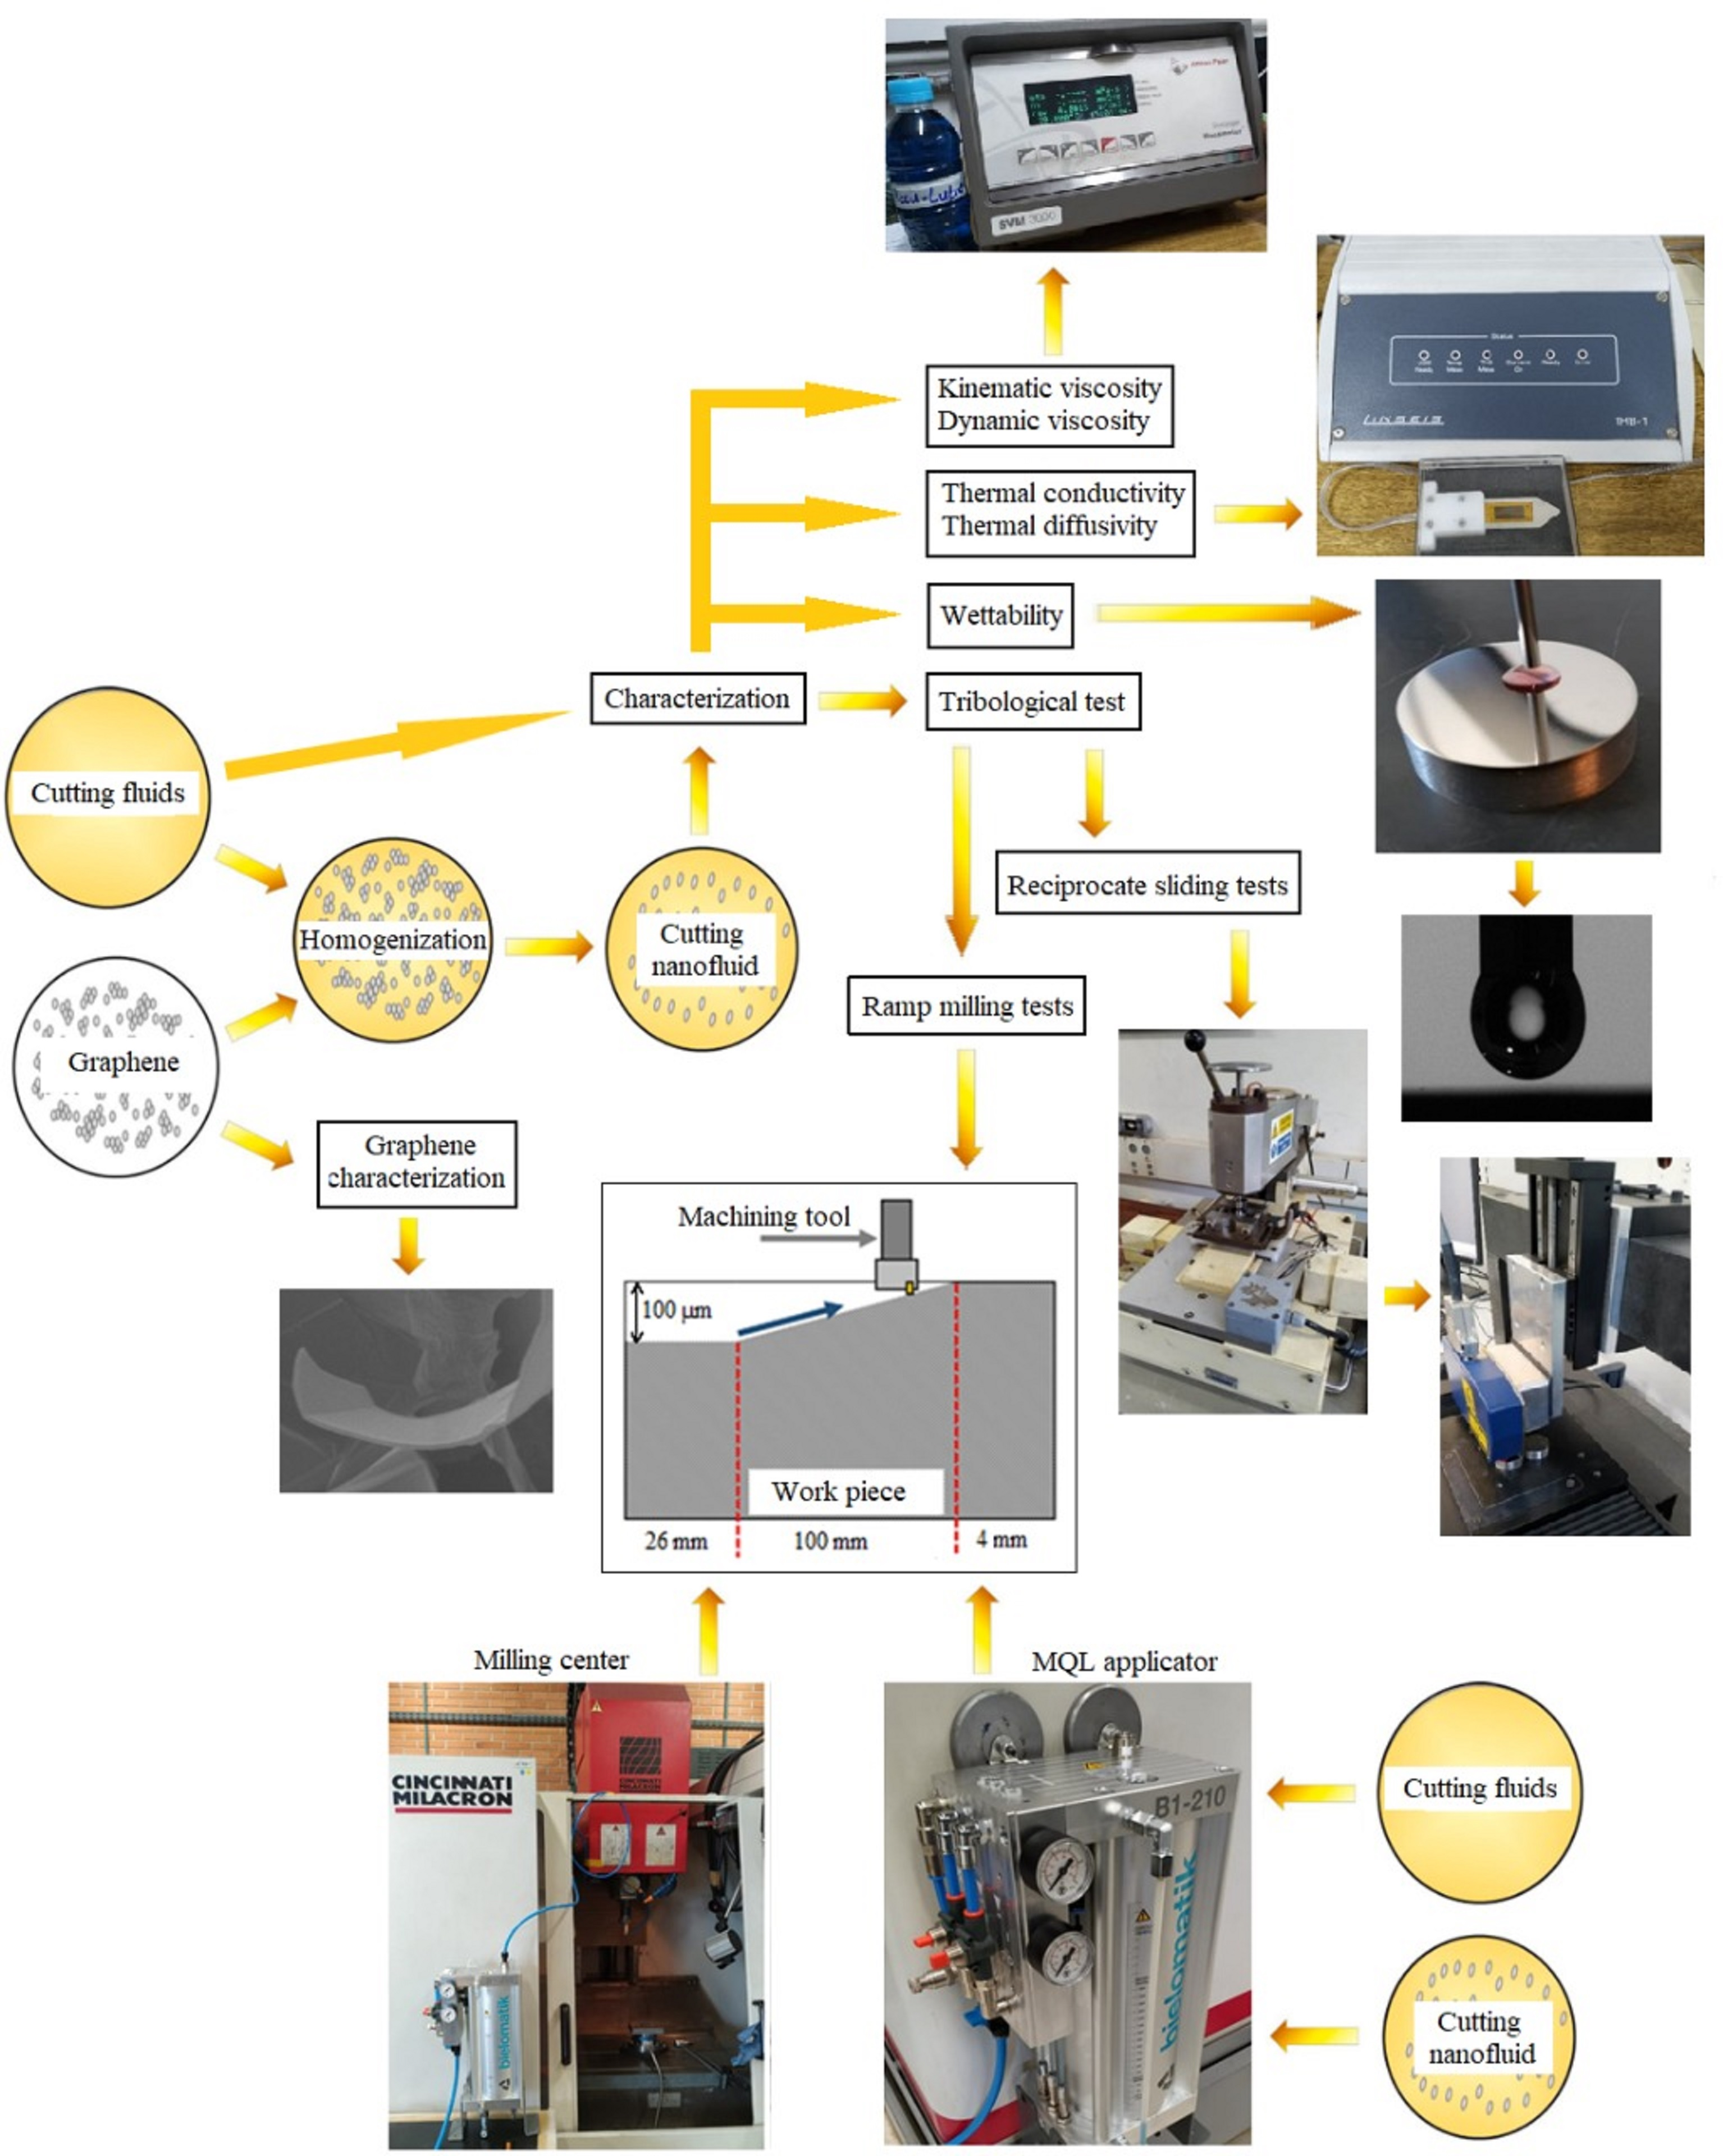
Three different cutting fluids were evaluated, two of which are manufactured by SpecialMix Industrial Ltd.a, Pinhais, Paraná, (MQL14 and MQL15) and manufactured by ITW Chemical Products Ltd.a, Embu das Artes, Brazil, (LB1000). MQL15 and LB1000 are vegetable-based, and the MQL 14 is mineral-based, with the main characteristics of the fluids summarized in Table 1. The three oils were tested pure and with graphene additions in two concentrations, 0.05 wt% and 0.1 wt%. These concentrations were selected based on a literature review [39,40,41]. For the homogenization of graphene sheets in the oil samples, initially, they were manually stirred up for 10 min and then sonicated for 60 min. Volumetric concentrations and synthesis processes were the same for all fluids. In this case, there was no chemical treatment or addition of surfactant in the mixtures for the dispersion of graphene to avoid any interference chemical effects that these elements may have on the properties of nanofluids.
The graphene used in the research was produced at the Federal University of Triângulo Mineiro, Uberaba, Brazil, through the exfoliation of graphite supplied by Nacional de Grafite LTDA, Itapecerica-MG, Brazil (with flakes from 1 to 20 µm in length and 1 to 30 nm in width) as described by [45].
An image of the graphene sheets taken within the scanning electron microscope (SEM) model TESCAN VEGA3 LMU is shown in Figure 2. Graphene’s morphology resembles a folded sheet composed of multilayers and irregular edges due to mechanical exfoliation [46]. These edge defects originate from breaking carbon in the planes, causing structural disorder at these points [47]. A sequence of 10 measurements of the dimensions of the layers of graphene atoms was made, indicating an average thickness of 36.83 ± 3.22 nm after mixing with the cutting oils.
Graphene sheets were also analyzed using a transmission electron microscope (TEM) JEOL JEM 1200EX-II (TEM). Figure 3a presents an image of a graphene particle with multiple layers (or sheets) identified by electron diffraction (Figure 3b), where the external hexagonal (arrangement of the carbon atoms) has an intensity equal to or greater than the internal hexagonal. These results are consistent with the studies [48,49,50,51] and prove that the graphene particles added to the fluids are composed of mono and multilayers.
The dynamic and kinematic viscosities and the specific mass are essential for evaluating and monitoring the cutting oils. These parameters were measured on an Anton Paar viscometer, model SVMTM 3000. The experiments were carried out at a controlled temperature of 40 °C. The viscometer is accurate to the range described in ASTM D445-18 [52], and the measurement method was according to ASTM D2270-10 [53].
The tests for measuring specific heat, diffusivity, and thermal conductivity were performed on the Transient Hot Bridge equipment, model Linseis, with a measurement range for specific heat from 100 to 5000 kJ/(m3K), diffusivity from 0.05 to 10 mm2/s, and thermal conductivity from 0.01 to 1 W/(mK). The experiments were carried out at a controlled temperature of 40 °C, where 2.5 mL of cutting oil was deposited on the equipment, using 5 mL sterile syringes. Oils with graphene mixtures were homogenized before testing.
The wettability represents the contact conditions between a solid surface and a liquid through cohesion and adhesion forces, forming a contact angle, where the lower the angle, the greater the wettability of the liquid [54]. With the wettability test, the characteristic adhesion and spreading of the fluids on a solid surface with low surface roughness are measured. For the wettability tests, the Krüss easy drop goniometer was used. The test consisted of depositing a drop of 10 μL of cutting oil on an AISI 1045 steel sample with average surface roughness less than 0.050 μm, with the dynamic angle measurement being carried out at intervals of 0.2 s at a controlled temperature of 23 °C.

2.3. Progressive Load Reciprocate Sliding Tests

The evaluation of the friction coefficient (COF) and electrical contact potential (POT) of the tribological pair (6 mm carbide ball and flat surface in AISI 1045 steel with an average roughness of 0.050 μm) was carried out using progressive load reciprocate sliding tests at a frequency of 2 Hz, amplitude of 10 mm, and incremental loading of 6.867 N at 10-min intervals. A droplet of 0.5 µL was placed in the contact region between the substrate at every load increase. The workpiece surface had an average roughness of less than 0.050 µm, and a carbide sphere of 5 mm in diameter was used as a counterbody. The tests were completed 5 min after the lubricant film broke, so the test time and applied load varied for each condition.
The tests were developed according to the standard method for linearly reciprocating ball-on-flat sliding wear [55]. A Universal Plint® Tribometer model TE67 was used, manufactured by Plint & Partners LTD (Figure 4). This equipment has a load cell similar to that described in reference [56] for monitoring tangential and normal forces. A linear variable differential transformer (LVDT) sensor, model RS 646-511, was used to measure the position of the counterbody during the tests. The LVDT and load cell data were collected at an acquisition rate of 4 kHz. To ensure reliability, three repetitions were performed for all tests. The wear tracks were analyzed by scanning electron microscopy using secondary electrons (SEM-SE) and laser interferometry scanning (Figure 4c).

2.4. Milling Experiments

The results obtained from the tribological tests were compared with the ramp milling test results. A CNC machining center was used in these tests manufactured by Cincinnati Milacron, model Arrow 500, with 5.5 kW of power and a maximum rotation speed of 6000 rpm. This machining center was adapted as an open tribometer and equipped with a table dynamometer manufactured by Kistler Instruments AG, model 9272, to measure machining forces in ramp milling, as shown in Figure 5a.
The machining conditions used in the test are summarized in Table 2. TiAlN coated cemented carbide inserts with AOMT123608PEER-M VP15TF specifications from Mitsubishi Materials manufacturer (Figure 5c) were used as counter bodies. These inserts have a cutting edge length of 12 mm, a cutting radius of 0.8 mm, and a rake angle of 11°. These tools feature M-type chip breaker geometry and are intended for machining carbon steels in general (Class P), with recommended cutting speed from 110 to 200 m/min, cutting depth of up to 4 mm, and feed per tooth of 0.15 mm/tooth, when using an ae greater than 75% of the diameter of the tool holder shank. The inserts were attached to a 25 mm diameter tool holder, with a 90° approach angle, with an ISO 13,399 designation or Mitsubishi Materials description APX3000R253SA25SA (Figure 5c). The tool holder had a capacity for three inserts; however, only one was used during the tests, a common practice in experimental comparisons, which does not compromise the final results [57], as all experiments were carried out under these conditions.
In Figure 5a, the positioning of the two nozzles of the MQL spray system is illustrated, one on the entrance of the tool in the workpiece and the other at 90° from the first. The two nozzles are approximately 15 mm apart from the cutting edge. To simulate the progressive load reduction in the milling trials, a path on a flat surface for 26 mm with a depth of 100 µm was used to ramp for an additional 100 mm to zero depth, as illustrated in Figure 5b [14]. The workpiece surface was planned before each ramp milling to guarantee the same initial conditions for each test.
Ethanol was used to clean the workpiece before each test and the fluid delivery system when changing lubricants to avoid contamination. Three repetitions were performed for each cutting condition to guarantee the test results’ reliability, with the tool being changed at the end of the repetitions for any indication of wear. Table 2 shows the general conditions of the test, which were planned with factorial planning.
The surface roughness was measured with a portable Time Group Inc profiler, model TR220, with a resolution of 0.01 µm. In addition, the absolute average roughness parameter (Ra) was measured according to NBR ISO 4288-2008 [58] guidelines on the ramp surfaces. Four measurements were also performed on the initial 26 mm of the workpiece, where the tool traveled horizontally (Figure 5b). Variance (ANOVA) and Tukey test were analyzed to compare the differences between fluids and graphene concentrations for all data.

3. Results and Discussion

3.1. Fluid Characterization

To simplify the graphical representation, the name of the cutting fluid plus 0.05G was used as nomenclature for the proportion of 0.05 wt%. graphene and 0.1G for the proportion of 0.1 wt%.
As illustrated in Figure 6, vegetable-based cutting oils (LB1000 and MQL15) showed higher viscosities compared to mineral-based oil, approximately 45.37% for kinematic viscosity (Figure 6a) and 48.54% for dynamic viscosity (Figure 6b), with the commercial oil, LB1000 being the most viscous among the samples, regardless the presence of graphene particles. With the help of ANOVA (Table 3) and the Tukey test, considering a confidence level of 95%, it is possible to prove that the graphene particles slightly increased viscosity in the vegetable oils as their proportion was increased. In this case, there is an increase in adhesion forces and a decline in molecular movement. This condition is consistent with the research results involving graphene and other nanoparticles suspended in cutting fluids [39,59]. On the contrary, in the mineral-based oil MQL14, the opposing result was found, i.e., the viscosity decreased slightly with graphene addition. The decrease in viscosity with graphene in the mineral-based fluid can be explained by the graphene sheets stacking nature, altering van der Waals forces, and increasing the mineral’s adjacent molecular movement [59].
Concerning thermal conductivity (Figure 7a), the vegetable-based oils showed, on average, 34.16% greater heat transfer capacity than the mineral-based oil MQL14, regardless of the addition of graphene. Furthermore, the gradual increase of graphene in vegetable-based oils increased the thermal conductivity slightly because graphene has higher thermal conductivity than the base fluid [60], as expected and confirmed by ANOVA and the Tukey test with a 95% confidence interval (Table 4 and Table 5).
With the help of ANOVA, it was found that adding graphene particles leads to a slight decrease in the thermal diffusivity of the vegetable-based oil LB1000. However, there is an average difference of approximately 40.46% (Figure 7b) in the thermal diffusivity between the vegetable-based oils (MQL15 and LB1000) and the mineral-based oil (MQL14) regardless of the addition of graphene.
Table 5 presents the Tukey test between oil pairs that did not show statistical variations with a 95% confidence interval.
The results of the wettability measurement angle are presented in Figure 8a. The contact angles of pure vegetable-based oils, LB1000 and MQL15 (without the addition of graphene) stabilized with relative values in the last 50 measurement points (averages of 12.33° and 11.07°, respectively, for each fluid). On the other hand, MQL14 mineral-based oil had a low contact angle of 1.53°, indicating a much higher wettability. In this case, the fluid’s ease in adhering and spreading on the solid surface is more remarkable due to the action of adhesive forces, cohesive forces, and low viscosity [61]. The p-values in Table 6 show the average difference between pure fluids with a 95% confidence interval. When statistically analyzing all cutting fluids, it can be concluded that only the wettability of pure MQL15 and LB1000-0.1G fluids are equal in the last 50 measurement points (Figure 8b).
As illustrated in Figure 8b, according to ANOVA (Table 7) (95% confidence interval), there was no significant wettability difference between the vegetable-based cutting oils using graphene sheets with 5 s of experiments. However, there are significant differences in mineral-based oil (MQL14), with an average increase of 62.88% for oil with 0.05 wt% graphene and 38.10% for 0.1 wt% graphene, representing a decrease in fluid wettability.

3.2. Reciprocate Sliding Tests

In Figure 9, the tribological maps of the progressive load reciprocate sliding tests are presented for dry and lubricated conditions with the LB1000, MQL15, and MQL14 fluids without adding graphene. Under all conditions, the cutting oils resulted in significant reductions in the average coefficient of friction (COF), even during the initial running-in period, where the tribosystem is still in a transient state, and the instability of the COF and the average electrical contact potential (POT) occurs through the softening of the surface and significant variation of the contact area [62]. The running-in period is usually attributed to oxidized regions, impurities, and the initial roughness of the sample [63,64]. Figure 9 also highlights that the initial period of running-in is followed by a period of stabilization at lower values, also called a steady state. In this period, the friction coefficient, wear rate, contact temperature, and surface roughness, among other parameters present in the tribe system, are stable [65], with the improvements in this tribosystem indicating the potential of these fluids as boundary lubricants.
The POT is the electrical resistance to contact between two surfaces composed of conductive materials. This electrical quantity makes it possible to investigate the existence of interfacial elements between the sample and the counter-body. If these particles are electrically insulating, the POT rises due to low electrical conductivity [64]. For all conditions evaluated in Figure 9b,d,f,h, electrical contact potential was high in the initial cycles due to the running-in period [62,65]. The POTs for the test conditions with cutting fluids showed similar behavior, where initially there was a rise in the POT (initial running-in period) and later stabilization. After stabilizing the tribofilm, also called steady-state, the film was broken in about 2000 cycles for the dry test.
Contrary to expectations, this resulted in a decrease in the friction coefficient and elevation of the POT. The lubricating film’s presence resulted in a relatively null electrical contact potential after the lubricating tests’ running-in period. Notably, the LB1000 fluid presented considerably fewer contact peaks related to momentary breaks in the tribofilm, probably due to the stick-slip phenomenon [65].
With the aid of ANOVA and a 95% of confidence interval (Table 8), it was observed that the addition of graphene sheets to the cutting oils LB1000 and MQL14 neither reduced the friction coefficient (COF) (Figure 10a) nor the electrical contact potential (POT) (Figure 10b). It did not increase the number of cycles (Figure 10c) supported in the tests. However, in the vegetable-based MQL15, graphene sheets reduced the COF, resulting in more cycles that provided more significant support for loads and lower COF than LB1000. Amazingly, the mineral-based oil MQL14 (with and without graphene) exceeded 40,000 programmed cycles and a force of 116.74 N.
Figure 11, Figure 12, Figure 13 and Figure 14 shows the 3D profiles of the wear tracks of the workpiece samples. This profile was obtained through topographic mapping, using secondary electrons during the scanning electron microscopy (SEM) analysis. Table 9 shows the average forces achieved in these tests. In the dry tests, the flattening and the occurrence of craters along the track are evidenced by the layers’ surface’s depletion by the friction against the carbide sphere (counterbody). This phenomenon was observed even when a force of 13.73 N was applied, and the test was interrupted at only 4816 cycles.
Like dry tests, flattening, detachment, lateral displacement, and craters formation are observed in the wear tracks made with vegetable-based cutting oils (MQL15 and LB1000). These fluids, however, allowed the tests to be conducted for a more significant number of cycles before the friction coefficient showed a considerable increase. This increase in COF at the end of the tests explains why the final wear marks’ topography presented aspects similar to the dry tests. The MQL14 fluid did not show a peak friction coefficient at the end of the tests, evidenced by the more homogeneous wear track aspect. Lower contact stresses can explain this homogeneity.
Figure 15 shows the volume of material removed (VMR) from the workpiece during the progressive load reciprocate sliding tests using the three cutting oils, determined by the laser interferometry scans. The addition of graphene sheets decreased the VMR for the MQL14 while increasing LB1000 and MQL15. These results suggest that in the MQL14 tribosystem, the graphene sheets could have presented a rolling behavior resulting in reduced contact stresses, corroborated by the smoother aspect of the surfaces indicated in Figure 11, Figure 12, Figure 13 and Figure 14. Conversely, the particles may have acted as abrasives in the other lubricants, particularly at the end of the tests, increasing the worn volume.
These results were evaluated with ANOVA with a 95% confidence interval, where the increase in the volume of material removal in reciprocating with LB1000 fluids with graphene sheets and reduction in the volume removal with 0.1 wt% graphene in the MQL14 fluid was observed statistically (Table 10). According to the p-value (0.194) of Table 10, the graphene sheets did not result in statistical variations in the volume of material removed in the MQL15 fluid.

3.3. Ramp Milling Tests

Following the Coulomb friction model, the ramp’s central region showed a linear relationship between the evaluated forces [9,11,14]. Therefore, after finding the region of linear friction that obeys Coulomb’s law of friction, as performed by [14] and illustrated in Figure 16, it is possible to calculate the COF on the slope region between the tool and the workpiece by Equation (1) [16], where α is the side rake angle.
The machining force (FU) was calculated using Equation (2) [66] with the measurement of the cutting force (Fc), feed force (Ff), and passive force (Fp) by the Kistler dynamometer.
1 η µ n = tan ( α + tan 1 ( FN / FT ) ) n
FU = F c 2 +   F f 2 + F ap 2
Figure 17 shows the results of the machining forces (F U ) and the friction coefficient (COF) for the various lubri-cooling conditions used. The dry cut showed high COF and low F U . This result can be explained based on the friction and the heat generated in the cutting zone, which reduces the shear resistance of the material. Contrarily, when the cut is performed under low-pressure flood cooling conditions, the high amount of cutting oil lubricates while dissipating the heat generated in the cutting zones, resulting in low COF and high F U .
Corroborating with the tribological reciprocating sliding tests in Section 3.2, the milling tests with the MQL15 and MQL14 oils (pure and with graphene additions) showed lower COF. However, the F U was relatively higher than when using the cutting oil LB1000, with the lower heat generation’s probable explanation. The COF values determined by the open tribometer tests are higher because they represent the conditions closest to the actual machining, where the chip speed and the load at the machining interfaces are higher. Furthermore, even using 6 bar air pressure in the MQL system, it is not guaranteed that the lubricant will fully reach the machining interfaces to the point of fully forming the tribofilm, a condition guaranteed in the experiments with conventional tribometer (reciprocating tests), where a micro drop of fluid was placed between the tribological pair, guaranteeing a film of fluid from the beginning of the experiment until its rupture. These results are expressive and corroborate with the results obtained by [14], which indicated the reciprocating sliding tests’ potential to represent the machining tribosystem under a low depth of cut.
The surface roughness results of the milling ramp tests are shown in Figure 18. The addition of graphene sheets to the oils decreased the Ra parameters in the experiments, mainly with the dispersion of 0.1 wt%. This decrease can be explained by increasing nanoparticle concentration and the degree of chemical interaction between the particles and the newly formed surface, increasing the protective film between the tribological pairs and surface quality [26]. According to ANOVA and Tukey’s test (95% confidence interval) shown in Table 11, there were significant differences in the Ra of the vegetable cutting fluids and mineral fluid and the dispersion of graphene sheets compared to pure fluids.

4. Conclusions

This study investigated changes in the thermos-physical properties of the oils, one mineral and two vegetable-based, with and without the addition of graphene nanosheets at proportions of 0.05 wt% and 0.1 wt%. In addition, the behavior of the friction coefficient determined by progressive load reciprocate sliding tests and the conditions generated in the tribosystems of the chip-tool-workpiece interfaces during the ramp milling tests with the application of the oils by MQL were also studied. The main results allowed the following conclusions to be drawn:
  • Graphene sheets alter the van der Waals forces and, consequently, the fluids’ molecular movement alters the nanofluids’ thermo-physical properties. Consequently, a viscosity decrease of the mineral fluid MQL14 and an increase in the vegetable-based fluids MQL15 and LB1000 were observed. Furthermore, an increase in the wettability of the mineral fluid MQL14 was also verified with the addition of graphene nanosheets, reaching 62.88% and 38.10% for the mixture with 0.05 wt% and 0.1 wt% of graphene, respectively. However, as noted in Section 3.3, this variation did not significantly change its tribological behavior but ensured a greater load capacity over time without deteriorating the formed tribofilm.
  • Cutting oils with and without graphene showed better COF in reciprocating and ramp milling tests (open tribometer) than in dry conditions. The COF values determined by the reciprocating sliding tests were lower than those determined by the machining tests. This can be explained by combining lower loads and smaller sliding distances, resulting in a tribosystem that does not fully represent the machining conditions.
  • Concerning the vegetable-based oils, considered ecologically less aggressive to the environment, the MQL15 showed better lubricating properties in the milling ramp tests than the LB1000 oil, with better conditions for tribosystems chip-tool-workpiece interfaces. The MQL15 also outperformed LB1000 concerning the number of cycles, applied load, COF, surface roughness, and volume of material removed from the wear track in the reciprocating tests.
  • The vegetable-based cutting fluids, especially graphene nanoparticles, have a high potential to increase the machining process efficiency and sustainability.

Author Contributions

Conceptualization, A.R.M. and V.B.; methodology, V.B., A.B.I. and A.R.M.; validation, V.B. and L.R.R.d.S.; formal analysis, V.B. and L.R.R.d.S.; resources, R.V.G.; data curation, V.B. and L.R.R.d.S.; writing—original draft preparation, V.B., R.B.d.S., N.K. and L.R.R.d.S.; writing—review and editing, V.B., N.K. and L.R.R.d.S. All authors have read and agreed to the published version of the manuscript.

Funding

This study was financed in part by the Coordenação de Aperfeiçoamento de Pessoal de Nível Superior—Brasil (CAPES)—Finance Code 001 and CNPq.

Data Availability Statement

Not applicable.

Acknowledgments

The authors are grateful to the Brazilian research agencies CNPq, FAPEMIG and Coordenação de Aperfeiçoamento de Pessoal de Nível Superior—Brasil (CAPES)—Finance Code 001, for their financial support. The authors are also grateful for Pontifícia Universidade Católica do Paraná—PUCPR do Brazil and the Federal University of Uberlândia for their technical support.

Conflicts of Interest

The authors declare no conflict of interest.

References

  1. Neugebauer, R.; Bouzakis, K.-D.; Denkena, B.; Klocke, F.; Sterzing, A.; Tekkaya, A.; Wertheim, R. Velocity effects in metal forming and machining processes. CIRP Ann.-Manuf. Technol. 2011, 60, 627–650. [Google Scholar] [CrossRef]
  2. Puls, H.; Klocke, F.; Lung, D. Experimental investigation on friction under metal cutting conditions. Wear 2014, 310, 63–71. [Google Scholar] [CrossRef]
  3. Melkote, S.N.; Grzesik, W.; Outeiro, J.; Rech, J.; Schulze, V.; Attia, H.; Arrazola, P.-J.; M’Saoubi, R.; Saldana, C. Advances in material and friction data for modelling of metal machining. CIRP Ann.-Manuf. Technol. 2017, 66, 731–754. [Google Scholar] [CrossRef] [Green Version]
  4. Akmal, M.; Layegh, K.E.; Lazoglu, I.; Akgün, A.; Yavaş, Ç. Friction Coefficients on Surface Finish of AlTiN Coated Tools in the Milling of Ti6Al4V. Procedia CIRP 2017, 58, 596–600. [Google Scholar] [CrossRef]
  5. Grzesik, W.; Rech, J.; Żak, K. Determination of friction in metal cutting with tool wear and flank face effects. Wear 2014, 317, 8–16. [Google Scholar] [CrossRef]
  6. Schulze, V.; Michna, J.; Schneider, J.; Gumbsch, P. Modelling of cutting induced surface phase transformations considering friction effects. Procedia Eng. 2011, 19, 331–336. [Google Scholar] [CrossRef]
  7. Vale, J.L.D.; Cortz, M.; Bertolini, V.M.S.; Da Silva, C.H.; Pintaude, G. Comparison of scratch resistance of lamellar and compacted graphite irons used in cylinder liners. J. Braz. Soc. Mech. Sci. Eng. 2017, 39, 3981–3988. [Google Scholar] [CrossRef]
  8. Olsson, M.; Söderberg, S.; Jacobson, S.; Hogmark, S. Simulation of cutting tool wear by a modified pin-on-disc test. Int. J. Mach. Tools Manuf. 1989, 29, 377–390. [Google Scholar] [CrossRef]
  9. Brocail, J.; Watremez, M.; Dubar, L. Identification of a friction model for modelling of orthogonal cutting. Int. J. Mach. Tools Manuf. 2010, 50, 807–814. [Google Scholar] [CrossRef]
  10. Smolenicki, D.; Boos, J.; Kuster, F.; Roelofs, H.; Wyen, C. In-process measurement of friction coefficient in orthogonal cutting. CIRP Ann.-Manuf. Technol. 2014, 63, 97–100. [Google Scholar] [CrossRef] [Green Version]
  11. Grzesik, W.; Żak, K. Friction quantification in the oblique cutting with CBN chamfered tools. Wear 2013, 304, 36–42. [Google Scholar] [CrossRef]
  12. Özel, T. The influence of friction models on finite element simulations of machining. Int. J. Mach. Tools Manuf. 2006, 46, 518–530. [Google Scholar] [CrossRef]
  13. Molinari, A.; Cheriguene, R.; Miguelez, H. Numerical and analytical modeling of orthogonal cutting: The link between local variables and global contact characteristics. Int. J. Mech. Sci. 2011, 53, 183–206. [Google Scholar] [CrossRef] [Green Version]
  14. da Silva, L.; Ruzzi, R.; Teles, V.; Sales, W.; Guesser, W.; Machado, A. Analysis of the coefficient of friction at the workpiece-tool interface in milling of high strength compacted graphite cast irons. Wear 2019, 426–427, 1646–1657. [Google Scholar] [CrossRef]
  15. Egaña, A.; Rech, J.; Arrazola, P.J. Characterization of Friction and Heat Partition Coefficients during Machining of a TiAl6V4 Titanium Alloy and a Cemented Carbide. Tribol. Trans. 2012, 55, 665–676. [Google Scholar] [CrossRef]
  16. Ozlu, E.; Budak, E.; Molinari, A. Analytical and experimental investigation of rake contact and friction behavior in metal cutting. Int. J. Mach. Tools Manuf. 2009, 49, 865–875. [Google Scholar] [CrossRef] [Green Version]
  17. Abdelali, H.B.; Claudin, C.; Rech, J.; Salem, W.B.; Kapsa, P.; Dogui, A. Experimental characterization of friction coefficient at the tool–chip–workpiece interface during dry cutting of AISI 1045. Wear 2012, 286-287, 108–115. [Google Scholar] [CrossRef]
  18. Salur, E.; Kuntoğlu, M.; Aslan, A.; Pimenov, D.Y. The Effects of MQL and Dry Environments on Tool Wear, Cutting Temperature, and Power Consumption during End Milling of AISI 1040 Steel. Metals 2021, 11, 1674. [Google Scholar] [CrossRef]
  19. Sen, B.; Gupta, M.K.; Mia, M.; Pimenov, D.Y.; Mikołajczyk, T. Performance Assessment of Minimum Quantity Castor-Palm Oil Mixtures in Hard-Milling Operation. Materials 2021, 14, 198. [Google Scholar] [CrossRef]
  20. Mia, M.; Gupta, M.K.; Singh, G.; Królczyk, G.; Pimenov, D.Y. An approach to cleaner production for machining hardened steel using different cooling-lubrication conditions. J. Clean. Prod. 2018, 187, 1069–1081. [Google Scholar] [CrossRef]
  21. Machado, A.; Wallbank, J. The effect of extremely low lubricant volumes in machining. Wear 1997, 210, 76–82. [Google Scholar] [CrossRef]
  22. Liao, Y.; Lin, H. Mechanism of minimum quantity lubrication in high-speed milling of hardened steel. Int. J. Mach. Tools Manuf. 2007, 47, 1660–1666. [Google Scholar] [CrossRef]
  23. Wang, X.; Li, C.; Zhang, Y.; Ding, W.; Yang, M.; Gao, T.; Cao, H.; Xu, X.; Wang, D.; Said, Z.; et al. Vegetable oil-based nanofluid minimum quantity lubrication turning: Academic review and perspectives. J. Manuf. Process. 2020, 59, 76–97. [Google Scholar] [CrossRef]
  24. Gajrani, K.K.; Suvin, P.; Kailas, S.V.; Mamilla, R.S. Thermal, rheological, wettability and hard machining performance of MoS2 and CaF2 based minimum quantity hybrid nano-green cutting fluids. J. Mater. Process. Technol. 2019, 266, 125–139. [Google Scholar] [CrossRef]
  25. Maruda, R.W.; Krolczyk, G.M.; Wojciechowski, S.; Powalka, B.; Klos, S.; Szczotkarz, N.; Matuszak, M.; Khanna, N. Evaluation of turning with different cooling-lubricating techniques in terms of surface integrity and tribologic properties. Tribol. Int. 2020, 148, 106334. [Google Scholar] [CrossRef]
  26. Sayuti, M.; Sarhan, A.A.D.; Hamdi, M. An investigation of optimum SiO2 nanolubrication parameters in end milling of aerospace Al6061-T6 alloy. Int. J. Adv. Manuf. Technol. 2013, 67, 833–849. [Google Scholar] [CrossRef]
  27. Singh, H.; Sharma, V.S.; Dogra, M. Exploration of graphene assisted vegetables oil based minimum quantity lubrication for surface grinding of TI-6AL-4V-ELI. Tribol. Int. 2020, 144, 106113. [Google Scholar] [CrossRef]
  28. Ji, J.; Li, Y.; Peng, W.; Zhang, G.; Zhang, F.; Fan, X. Advanced Graphene-Based Binder-Free Electrodes for High-Performance Energy Storage. Adv. Mater. 2015, 27, 5264–5279. [Google Scholar] [CrossRef]
  29. Uysal, M.; Akbulut, H.; Tokur, M.; Algül, H.; Çetinkaya, T. Structural and sliding wear properties of Ag/Graphene/WC hybrid nanocomposites produced by electroless co-deposition. J. Alloys Compd. 2016, 654, 185–195. [Google Scholar] [CrossRef]
  30. Park, K.-H.; Ewald, B.; Kwon, P.Y. Effect of Nano-Enhanced Lubricant in Minimum Quantity Lubrication Balling Milling. J. Tribol. 2011, 133, 031803. [Google Scholar] [CrossRef]
  31. Uysal, A. An experimental study on cutting temperature and burr in milling of ferritic stainless steel under MQL using nano graphene reinforced cutting fluid. Adv. Mater. Proc. 2018, 2, 560–563. [Google Scholar] [CrossRef]
  32. Huang, S.; He, A.; Yun, J.-H.; Xu, X.; Jiang, Z.; Jiao, S.; Huang, H. Synergistic tribological performance of a water based lubricant using graphene oxide and alumina hybrid nanoparticles as additives. Tribol. Int. 2019, 135, 170–180. [Google Scholar] [CrossRef]
  33. Wang, L.; Gong, P.; Li, W.; Luo, T.; Cao, B. Mono-dispersed Ag/Graphene nanocomposite as lubricant additive to reduce friction and wear. Tribol. Int. 2020, 146, 106228. [Google Scholar] [CrossRef]
  34. Abbas, A.T.; Gupta, M.K.; Soliman, M.S.; Mia, M.; Hegab, H.; Luqman, M.; Pimenov, D.Y. Sustainability assessment associated with surface roughness and power consumption characteristics in nanofluid MQL-assisted turning of AISI 1045 steel. Int. J. Adv. Manuf. Technol. 2019, 105, 1311–1327. [Google Scholar] [CrossRef]
  35. Dubey, V.; Sharma, A.K.; Vats, P.; Pimenov, D.Y.; Giasin, K.; Chuchala, D. Study of a Multicriterion Decision-Making Approach to the MQL Turning of AISI 304 Steel Using Hybrid Nanocutting Fluid. Materials 2021, 14, 7207. [Google Scholar] [CrossRef] [PubMed]
  36. Çamlı, K.Y.; Demirsöz, R.; Boy, M.; Korkmaz, M.E.; Yaşar, N.; Giasin, K.; Pimenov, D.Y. Performance of MQL and Nano-MQL Lubrication in Machining ER7 Steel for Train Wheel Applications. Lubricants 2022, 10, 48. [Google Scholar] [CrossRef]
  37. ASTM E8/E8M; Standard Test Methods for Tension Testing of Metallic Materials. ASTM Int.: West Conshohocken, PA, USA, 2013.
  38. ASTM E92-17; Standard Test Methods for Vickers Hardness and Knoop Hardness of Metallic Materials. ASTM Int.: West Conshohocken, PA, USA, 2009.
  39. Wang, Y.; Li, C.; Zhang, Y.; Li, B.; Yang, M.; Zhang, X.; Guo, S.; Liu, G. Experimental evaluation of the lubrication properties of the wheel/workpiece interface in MQL grinding with different nanofluids. Tribol. Int. 2016, 99, 198–210. [Google Scholar] [CrossRef]
  40. Zhang, Y.; Li, C.; Jia, D.; Li, B.; Wang, Y.; Yang, M.; Hou, Y.; Zhang, X. Experimental study on the effect of nanoparticle concentration on the lubricating property of nanofluids for MQL grinding of Ni-based alloy. J. Mater. Process. Technol. 2016, 232, 100–115. [Google Scholar] [CrossRef]
  41. De Oliveira, D.; Da Silva, R.; Gelamo, R. Influence of multilayer graphene platelet concentration dispersed in semi-synthetic oil on the grinding performance of Inconel 718 alloy under various machining conditions. Wear 2019, 426–427, 1371–1383. [Google Scholar] [CrossRef]
  42. ITW Rocol®. Technical Data Sheet Accu-Lube LB-1000. 2008. Available online: https://itwpf.com.br/produto/accu-lube-lb-1000/ (accessed on 2 August 2022).
  43. Specialmix Industrial Ltda. Fispq Mql15-Ficha de Informações de Segurança de Produtos Químicos 2018. Available online: https://www.specialmix.com.br/busca/?q=mql15 (accessed on 5 March 2021).
  44. Specialmix Industrial Ltda. Fispq Mql14-Ficha de Informações de Segurança de Produtos Químicos 2013. Available online: https://www.specialmix.com.br/busca/?q=mql14 (accessed on 24 February 2021).
  45. Augusto, G.D.S.; Scarminio, J.; da Silva, P.R.C.; de Siervo, A.; Rout, C.S.; Rouxinol, F.; Gelamo, R.V. Flexible metal-free supercapacitors based on multilayer graphene electrodes Gabriel. Electrochim. Acta 2018, 285, 241–253. [Google Scholar] [CrossRef]
  46. de Paiva, R.L.; Ruzzi, R.D.S.; De Oliveira, L.R.; Filho, E.P.B.; Neto, L.M.G.; Gelamo, R.V.; Da Silva, R.B. Experimental study of the influence of graphene platelets on the performance of grinding of SAE 52100 steel. Int. J. Adv. Manuf. Technol. 2020, 110, 1–12. [Google Scholar] [CrossRef]
  47. Khare, R.T.; Gelamo, R.V.; More, M.A.; Late, D.J.; Rout, C.S. Enhanced field emission of plasma treated multilayer graphene. Appl. Phys. Lett. 2015, 107, 123503. [Google Scholar] [CrossRef]
  48. Dato, A.; Radmilovic, V.; Lee, Z.; Phillips, J.; Frenklach, M. Substrate-Free Gas-Phase Synthesis of Graphene Sheets. Nano Lett. 2008, 8, 2012–2016. [Google Scholar] [CrossRef] [PubMed]
  49. Samuel, J.; Rafiee, J.; Dhiman, P.; Yu, Z.-Z.; Koratkar, N. Graphene Colloidal Suspensions as High Performance Semi-Synthetic Metal-Working Fluids. J. Phys. Chem. C 2010, 115, 3410–3415. [Google Scholar] [CrossRef]
  50. Ferrari, A.C.; Meyer, J.C.; Scardaci, V.; Casiraghi, C.; Lazzeri, M.; Mauri, F.; Piscanec, S.; Jiang, D.; Novoselov, K.S.; Roth, S.; et al. Raman spectrum of graphene and graphene layers. Phys. Rev. Lett. 2006, 97, 187401. [Google Scholar] [CrossRef] [PubMed] [Green Version]
  51. Hernandez, Y.; Nicolosi, V.; Lotya, M.; Blighe, F.M.; Sun, Z.; De, S.; McGovern, I.T.; Holland, B.; Byrne, M.; Gun’Ko, Y.K.; et al. High-yield production of graphene by liquid-phase exfoliation of graphite. Nat. Nanotechnol. 2008, 3, 563–568. [Google Scholar] [CrossRef] [Green Version]
  52. ASTM D445-18; Standard Test Method for Kinematic Viscosity of Transparent and Opaque Liquids (and Calculation of Dynamic Viscosity). ASTM Stand.: West Conshohocken, PA, USA, 2018.
  53. ASTM D2270-10; Standard Practice for Calculating Viscosity Index from Kinematic Viscosity at 40 °C and 100 °C. ASTM Int.: West Conshohocken, PA, USA, 2016.
  54. Junior, A.S.A.; Sales, W.; da Silva, R.B.; Costa, E.S.; Machado, Á. Lubri-cooling and tribological behavior of vegetable oils during milling of AISI 1045 steel focusing on sustainable manufacturing. J. Clean. Prod. 2017, 156, 635–647. [Google Scholar] [CrossRef]
  55. ASTM G133-05; Linearly Reciprocating Ball-on-Flat Sliding Wear. ASTM Int.: West Conshohocken, PA, USA, 2016.
  56. Dutra, R.M.A. Controle e Validação de um Microtribômetro Instrumentado para Observar a Evolução da Marca de Desgaste via Microscopia Óptica. 2017. Available online: https://repositorio.ufu.br/bitstream/123456789/18937/1/ControleValidacaoMicrotribometro.pdf (accessed on 10 June 2021).
  57. Richetti, A.; Machado, Á.R.; Da Silva, M.; Ezugwu, E.; Bonney, J. Influence of the number of inserts for tool life evaluation in face milling of steels. Int. J. Mach. Tools Manuf. 2004, 44, 695–700. [Google Scholar] [CrossRef]
  58. ISO 4288; Geometrical Product Especifications (GPS)-Surface Texture: Prpfile Method-Rules and Procedures for the Assessment of Surface Texture. ABNT NBR: Curitiba, Brazil, 2008.
  59. Bai, X.; Li, C.; Dong, L.; Yin, Q. Experimental evaluation of the lubrication performances of different nanofluids for minimum quantity lubrication (MQL) in milling Ti-6Al-4V. Int. J. Adv. Manuf. Technol. 2019, 101, 2621–2632. [Google Scholar] [CrossRef]
  60. Vilar, E.O.; Segundo, J.E.D.V. Grafeno: Uma revisão sobre propriedades, mecanismos de produção e potenciais aplicações em sistemas energéticos. Rev. Eletrônica Mater. Process. 2016, 11, 54–57. [Google Scholar]
  61. Singh, R.; Dureja, J.; Dogra, M.; Gupta, M.K.; Mia, M.; Song, Q. Wear behavior of textured tools under graphene-assisted minimum quantity lubrication system in machining Ti-6Al-4V alloy. Tribol. Int. 2020, 145, 106183. [Google Scholar] [CrossRef]
  62. Blau, P.J. How common is the steady-state? The implications of wear transitions for materials selection and design. Wear 2015, 332–333, 1120–1128. [Google Scholar] [CrossRef] [Green Version]
  63. Vergne, C.; Boher, C.; Levaillant, C.; Gras, R. Analysis of the friction and wear behavior of hot work tool scale: Application to the hot rolling process. Wear 2001, 250–251, 322–333. [Google Scholar] [CrossRef] [Green Version]
  64. Milan, J.; Carvalho, M.; Xavier, R.; Franco, S.; De Mello, J. Effect of temperature, normal load and pre-oxidation on the sliding wear of multi-component ferrous alloys. Wear 2005, 259, 412–423. [Google Scholar] [CrossRef]
  65. dos Santos, M.; Costa, H.; De Mello, J. Potentiality of triboscopy to monitor friction and wear. Wear 2015, 332–333, 1134–1144. [Google Scholar] [CrossRef]
  66. Machado, A.R.; Abrão, A.M.; Coelho, R.T.; Silva, M.B. Da Teoria da Usinagem dos Materiais, 3rd ed.; Editora Edgard Blucher: São Paulo, Brazil, 2015; ISBN 978-85-212-0452-7. [Google Scholar]
Figure 1. Microstructure of the workpiece material.
Lubricants 10 00193 g001
Figure 2. SEM images of the graphene sheets.
Lubricants 10 00193 g002
Figure 3. TEM images of the graphene particles: (a) multilayers; (b) electron diffraction of the multilayers.
Lubricants 10 00193 g003
Figure 4. (a) Universal tribometer Plint® model TE67; (b) tribometer clamping base; (c) laser interferometer.
Lubricants 10 00193 g004
Figure 5. (a) Experimental setup showing the dynamometer workpiece, cutting tool, and fluid nozzles; (b) view of the ramp-milled surface; (c) dimensions of insert AOMT123608PEER-M and rod APX3000R253SA25SA for fixing the inserts.
Lubricants 10 00193 g005
Figure 6. (a) Kinematic viscosity and (b) dynamic viscosity of the cutting fluids.
Lubricants 10 00193 g006
Figure 7. Thermal properties of the cutting fluids: (a) thermal conductivity; (b) thermal diffusivity.
Lubricants 10 00193 g007
Figure 8. (a) Contact angle of the cutting oils LB1000, MQL15, and MQL14. (b) Boxplot graphs of the values established in the last 50 measurement points. (c) The contact angle of all cutting oils at 5 s of the test.
Lubricants 10 00193 g008
Figure 9. Triboscopy maps of the reciprocating sliding tests with progressive loads for the several lubri-cooling conditions tested: (a,b) dry, (c,d) pure MQL14, (e,f) pure MQL15, and (g,h) pure LB1000.
Lubricants 10 00193 g009
Figure 10. General results of the reciprocating sliding tests with progressive loads: (a) coefficient of friction (COF); (b) contact potential (POT); (c) the number of cycles supported by the oil film.
Lubricants 10 00193 g010
Figure 11. Three-dimensional profiles of the wear tracks measured using the SEM images for dry testing.
Lubricants 10 00193 g011
Figure 12. Three-dimensional profiles of the wear tracks measured using the SEM images for MQL14 fluids.
Lubricants 10 00193 g012
Figure 13. Three-dimensional profiles of the wear tracks measured using the SEM images for MQL15 fluids.
Lubricants 10 00193 g013
Figure 14. Three-dimensional profiles of the wear tracks measured using the SEM images for LB1000 fluids.
Lubricants 10 00193 g014
Figure 15. Volume of material removed (µm3/µm2).
Lubricants 10 00193 g015
Figure 16. Identification of the region that obeys the Coulomb friction model in ramp milling [14]. (a) Tangential and normal forces during the whole ramp path. (b) The central region of the ramp was chosen for evaluation.
Lubricants 10 00193 g016
Figure 17. Shows the machining force and friction coefficient obtained in the ramp milling tests with several lubri-cooling conditions.
Lubricants 10 00193 g017
Figure 18. Illustration of Ra variations for dry and fluid test conditions.
Lubricants 10 00193 g018
Table 1. Cutting fluids characteristics [42,43,44].
CharacteristicsMQL14MQL15LB1000
ColorLight greenRedLight blue
Flashpoint (ASTM D92) (°C)>250<180>204
Freezing point (°C)−10−10−15
Boiling point (°C)>270>270>279
density (20/4 °C) (kg/L)0.9020.9200.930
Solubility in waterInsolubleInsolubleInsoluble
Table 2. Cutting parameters for the open-tribometer tests.
Fixed Input Parameters
Work Material: AISI 1045 normalized steel with 100 mm of width, 130 mm of length, and 10 mm of height.
Radial depth of cut (ae): 1.0 × DC (cutter diameter = 25 mm).
Axial depth of cut (ap): 100 µm to zero.
Cutting speed (vc): 200 m/min.
Feed rate (fz): 0.1 mm/tooth.
Flow rate of the cutting fluid in MQL: 45 mL/h.
Air pressure of the MQL: 6 bar.
MQL equipment: Bielomatik B1-210.
General Conditions of the Test
 1-
Dry.
 2-
Flood with 39.52 mL/s of the emulsifiable fluid VASCO 1000 at a concentration of 5%.
 3-
MQL with MQL14, MQL15, and LB1000 oils.
 4-
MQL with MQL14, MQL15, and LB1000 oils with the addition of 0.05 wt%. of Graphene.
 5-
MQL with MQL14, MQL15, and LB1000 oils with the addition of 0.1 wt%. of Graphene.
Table 3. ANOVA for kinematic viscosity and dynamic viscosity.
Kinematic Viscosity
Sum of SquaresDFMean SquareF Valuep-valueF critical
Model1607.7358200.966140.5330.0002.208
Error0.051360.0014
Total1607.78744
Dynamic Viscosity
Sum of SquaresDFMean SquareF Valuep-valueF critical
Model1463.2858182.910162.2440.0002.208
Error0.040360.001
Total1463.32644
Table 4. ANOVA for diffusivity and conductivity thermal.
Thermal Diffusivity
Sum of SquaresDFMean SquareF Valuep-valueF critical
Model5.45580.681142.6530.0002.115
Error0.258544.70 × 10−3
Total5.71362
Thermal Conductivity
Sum of SquaresDFMean SquareF Valuep-valueF critical
Model1.77180.22114,948.80.0002.118
Error7.85 × 10−4541.48 × 10−5
Total1.77162
Table 5. Tukey test for diffusivity and conductivity thermal.
Tukey Test
PairsThermal ConductivityThermal Diffusivity
Mean Differencep-ValueMean Differencep-Value
LB1000-0.1G/LB1000-0.05G 0.033>0.05
MQL15/LB1000-0.05G 0.014>0.05
MQL15/LB1000-0.1G −0.018>0.05
MQL15-0.05G/LB1000−0.001>0.05
MQL15-0.05G/LB1000-0.05G −0.026>0.05
MQL15-0.05G/LB1000-0.1G −0.059>0.05
MQL15-0.05G/MQL15 −0.040>0.05
MQL15-0.1G/LB1000
MQL15-0.1G/LB1000-0.05G 0.006>0.05
MQL15-0.1G/LB1000-0.1G −0.027>0.05
MQL15-0.1G/MQL15 −0.008>0.05
MQL15-0.1G/MQL15-0.05G 0.032>0.05
MQL14-0.05G/MQL14 0.024>0.05
MQL14-0.1G/MQL14 −0.025>0.05
MQL14-0.1G/MQL14-0.05G −0.049>0.05
Table 6. Tukey test for pure fluids LB1000, MQL15, and MQL14.
Tukey Test for Wettability of Pure Fluids
Peer ComparisonMean Differencep-Value
MQL15/LB1000−1.25400.000
MQL14/LB1000−10.78810.000
MQL14/MQL15−9.53400.000
Table 7. ANOVA for pure fluids MQL14, MQL15, and LB1000 with 5 s in experiments.
Fluids MQL14
Sum of SquaresDFMean SquareF Valuep-valueF critical
Model405.2262202.61360.6290.0003.354
Error90.228273.341
Total495.45529
Fluids MQL15
Sum of SquaresDFMean SquareF Valuep-valueF critical
Model25.093212.5462.4990.0993.327
Error145.591275.02
Total170.68429
Fluids LB1000
Sum of SquaresDFMean SquareF Valuep-valueF critical
Model10.2725.1351.9310.1773.633
Error42.531272.658
Total52.80129
Table 8. p-value for all fluids.
The p-Value for Experimental Conditions
Experiment ConditionsMaximum ForceCOFPOTCycles
MQL15 fluids0.5780.0040.9880.798
MQL14 fluids 0.8380.268
LB1000 fluids0.1250.6780.4960.173
Table 9. Average maximum forces applied during the progressive load reciprocate sliding tests.
DryLB1000 PureLB1000 0.05 wt%LB1000 0.1 wt%MQL15 PureMQL15 0.05 wt%MQL15 0.1 wt%MQL14 PureMQL14 0.05 wt%MQL14 0.1 wt%
Force (N)13.7373.2573.2566.3886.891.5689.27116.74116.74116.74
Table 10. p-value for the volume of material removed from the reciprocate tracks.
Fluids MQL14
Sum of SquaresDFMean SquareF Valuep-valueF critical
Model1.04 × 101325.20 × 10126.2560.0345.143
Error4.99 × 101268.32 × 1011
Total1.54 × 10138
Fluids MQL15
Sum of SquaresDFMean SquareF Valuep-valueF critical
Model4.10 × 101322.05 × 10132.1730.1945.143
Error5.65 × 101369.42 × 1012
Total9.75 × 10138
Fluids LB1000
Sum of SquaresDFMean SquareF Valuep-valueF critical
Model6.30 × 101323.15 × 101325.7020.0015.143
Error7.35 × 101261.23 × 1012
Total7.04 × 10138
Table 11. p-value and comparison between pairs of surface roughness (Ra) of ramp milling.
Experiment Conditions under Analysisp-ValueStatistically Different Pairs
Flood, dry and MQL15 fluids0.000MQL15 > flood
MQL15 > dry
MQL15 > MQL15-0.05G
MQL15 > MQL15-0.1G
Flood, dry and MQL14 fluids5.34 × 10−3MQL14 > MQL14-0.05G
MQL14 > MQL14-0.1G
Flood, dry and LB1000 fluids0.000LB1000 > dry
LB1000-0.05G > dry
LB1000 > LB1000-0.1G
Publisher’s Note: MDPI stays neutral with regard to jurisdictional claims in published maps and institutional affiliations.

