Metallographic Study and Sliding Wear Optimization of Nano Si3N4 Reinforced High-Strength Al Metal Matrix Composites

 ,
,  ,
,  and
and
Abstract
:1. Introduction
2. Materials and Methods
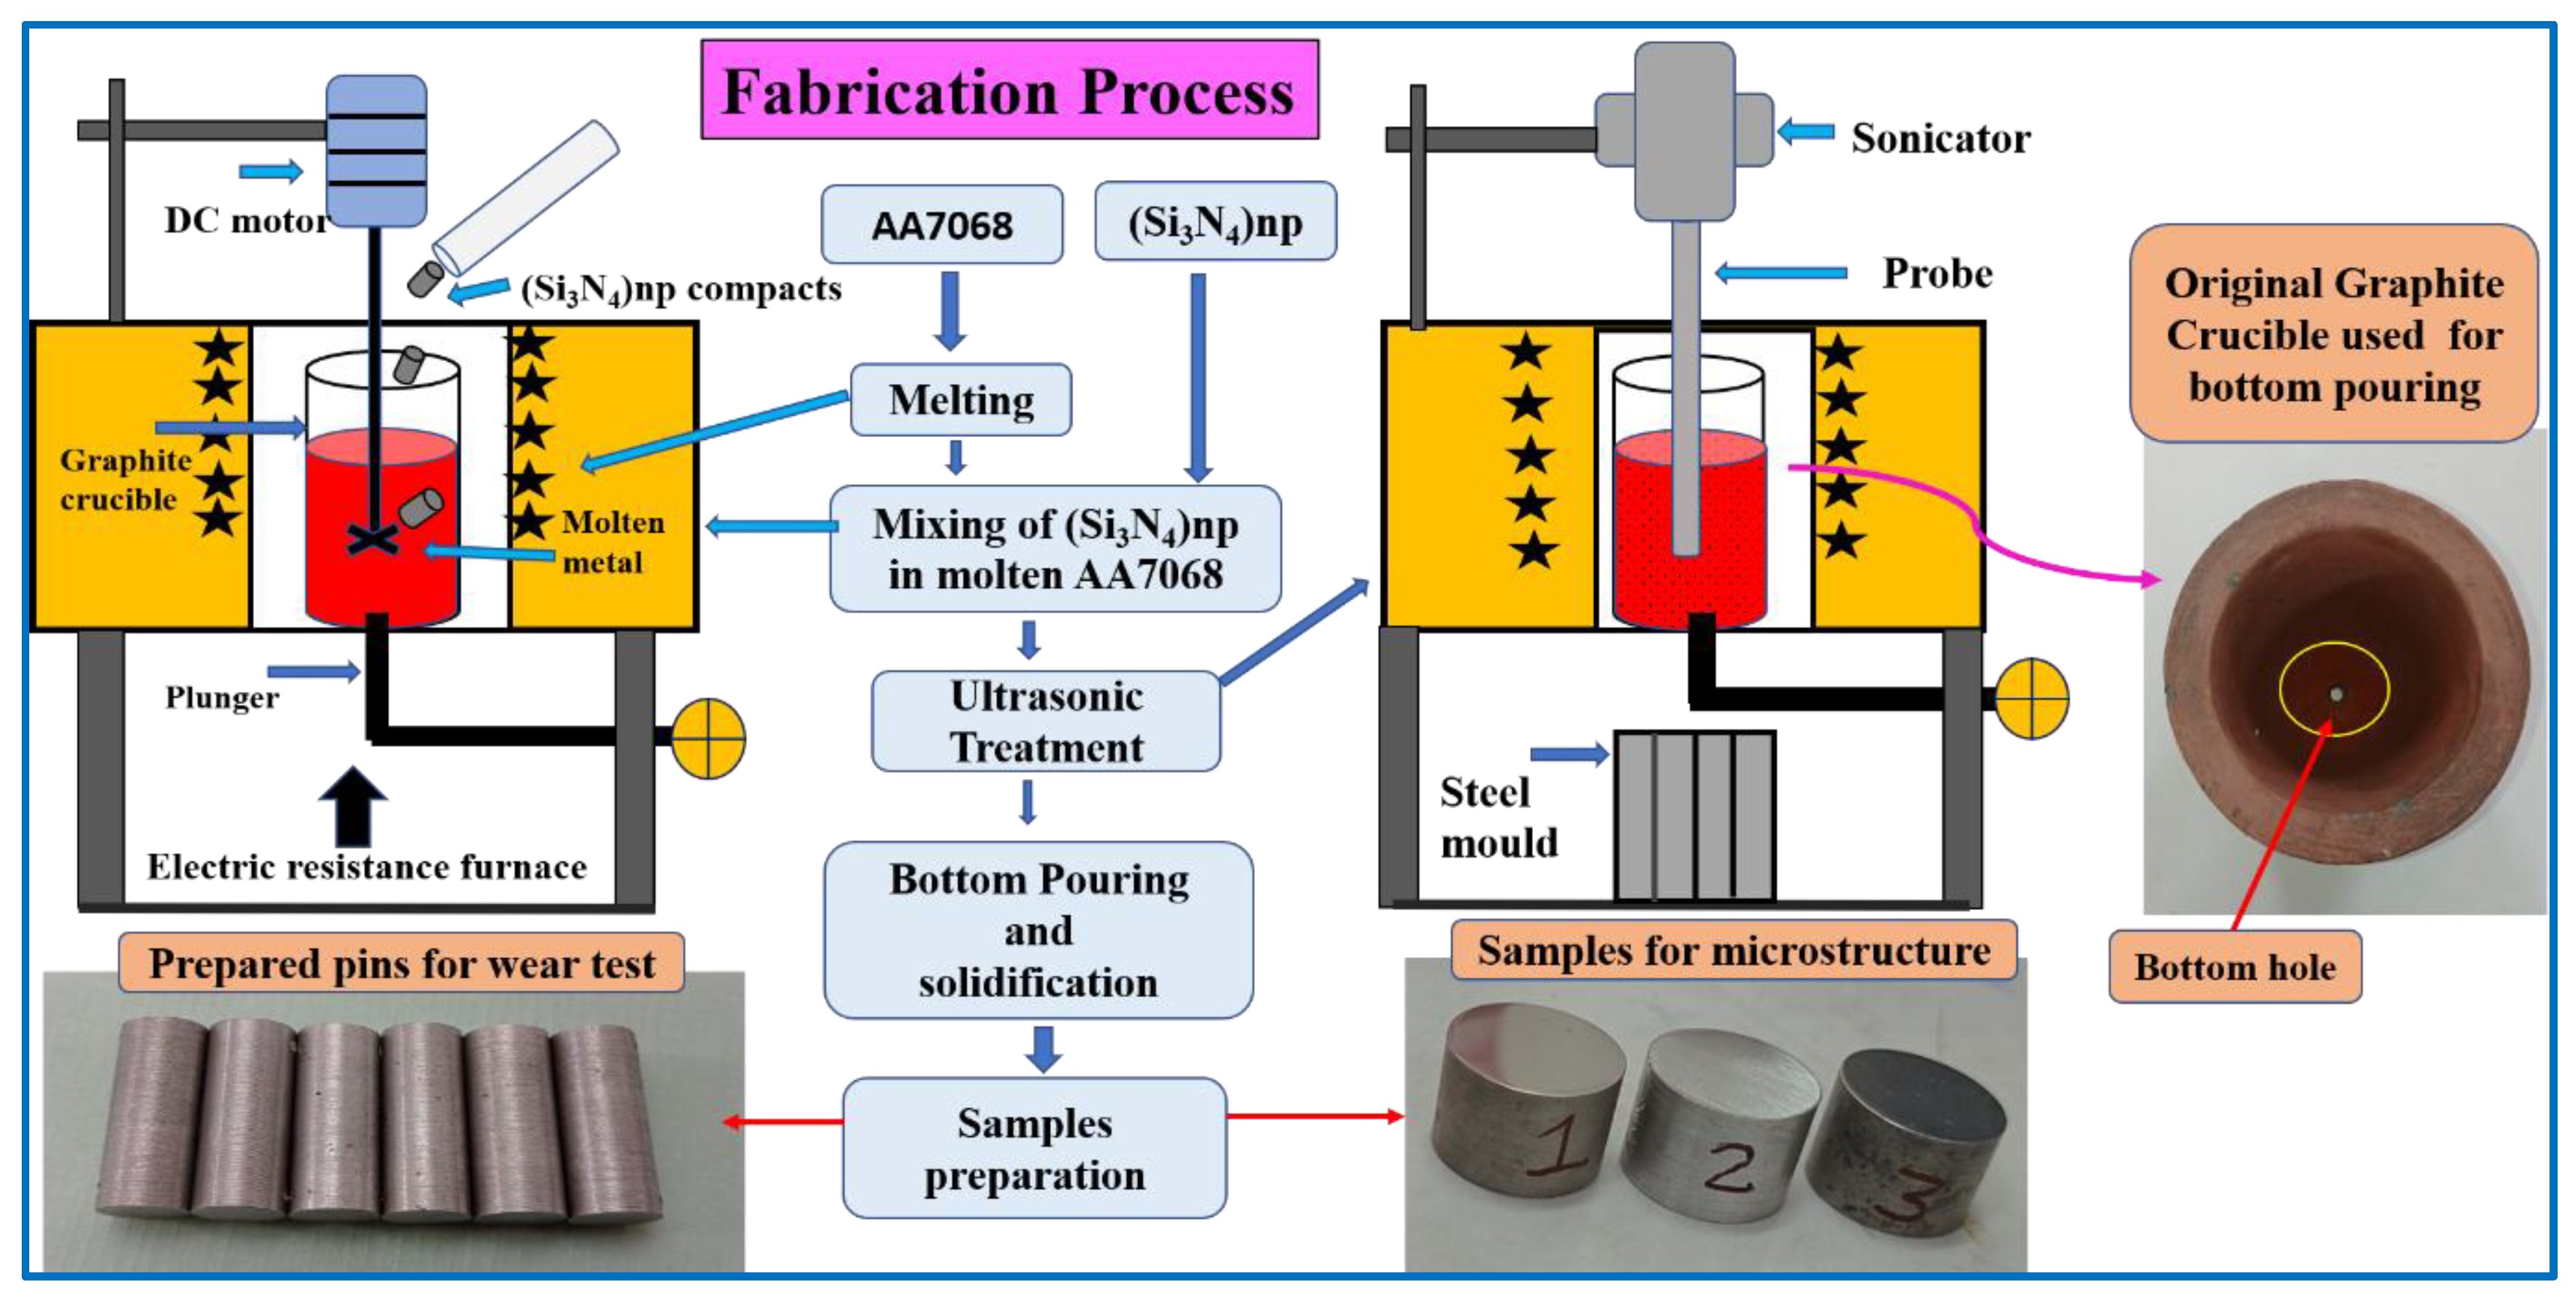
2.1. Raw Materials and Fabrication
2.2. Characterization Methodology
2.3. Taguchi Modeling
3. Results and Discussion
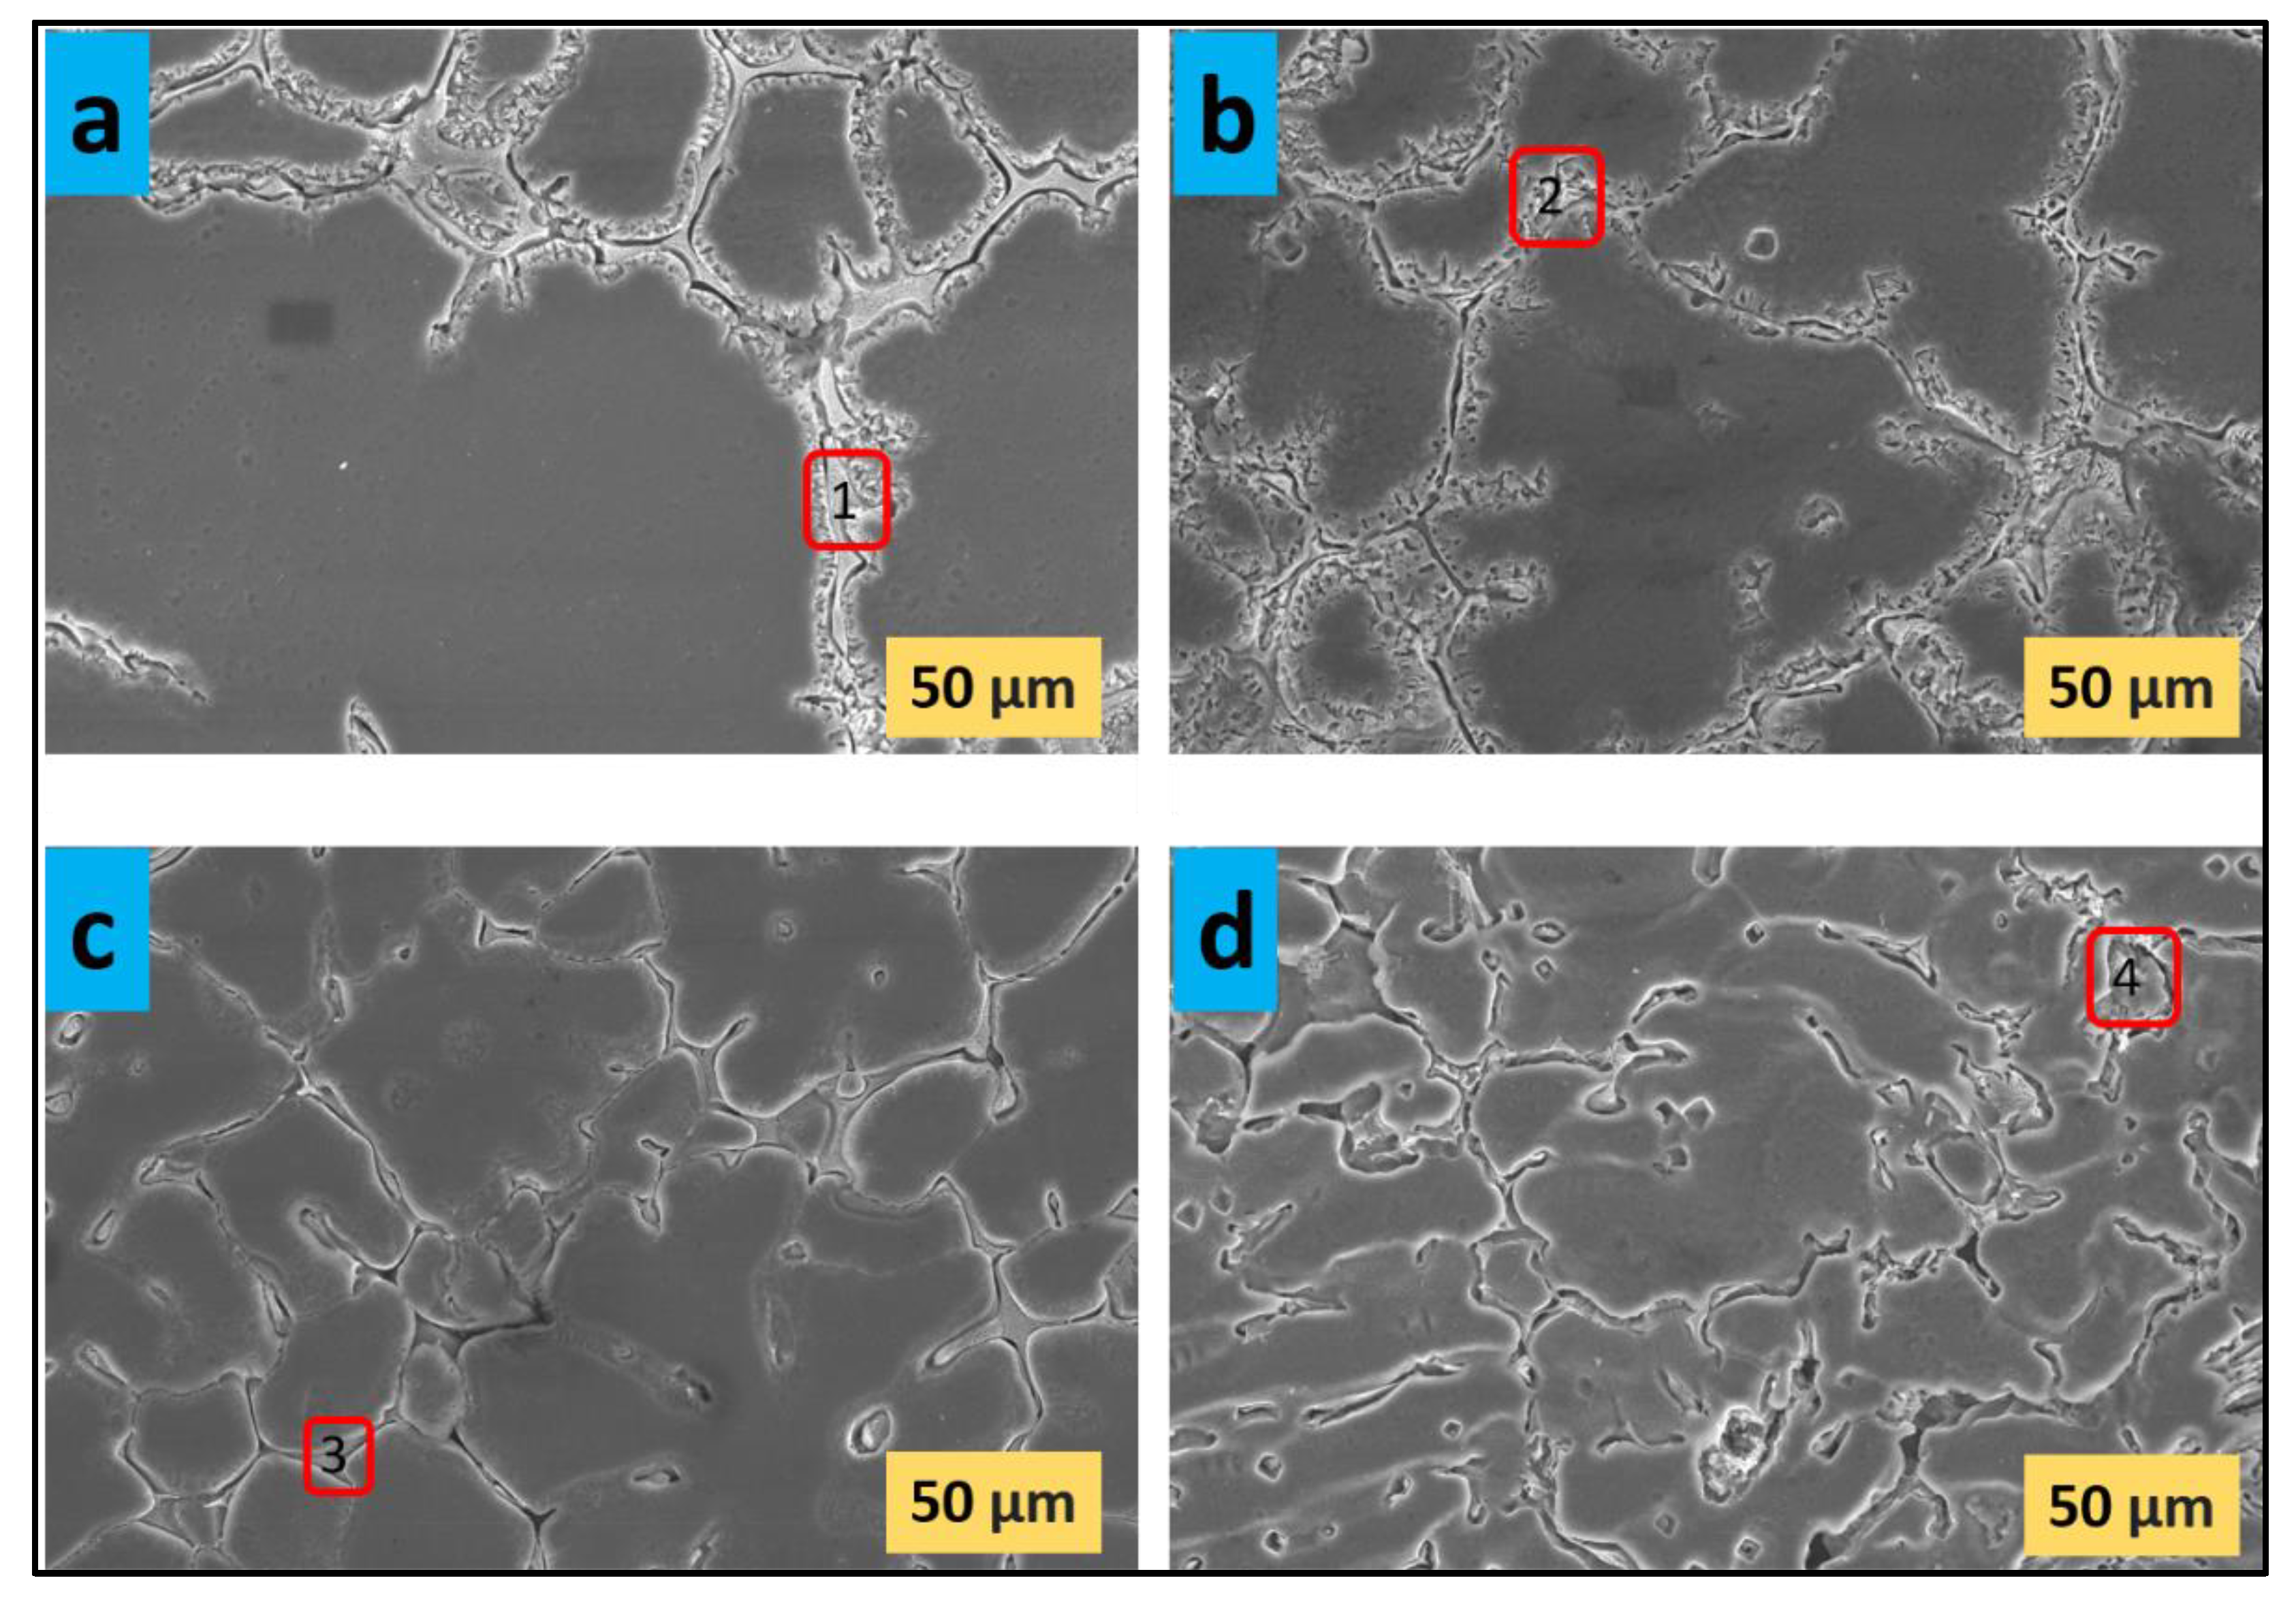
3.1. Microstructural Developments
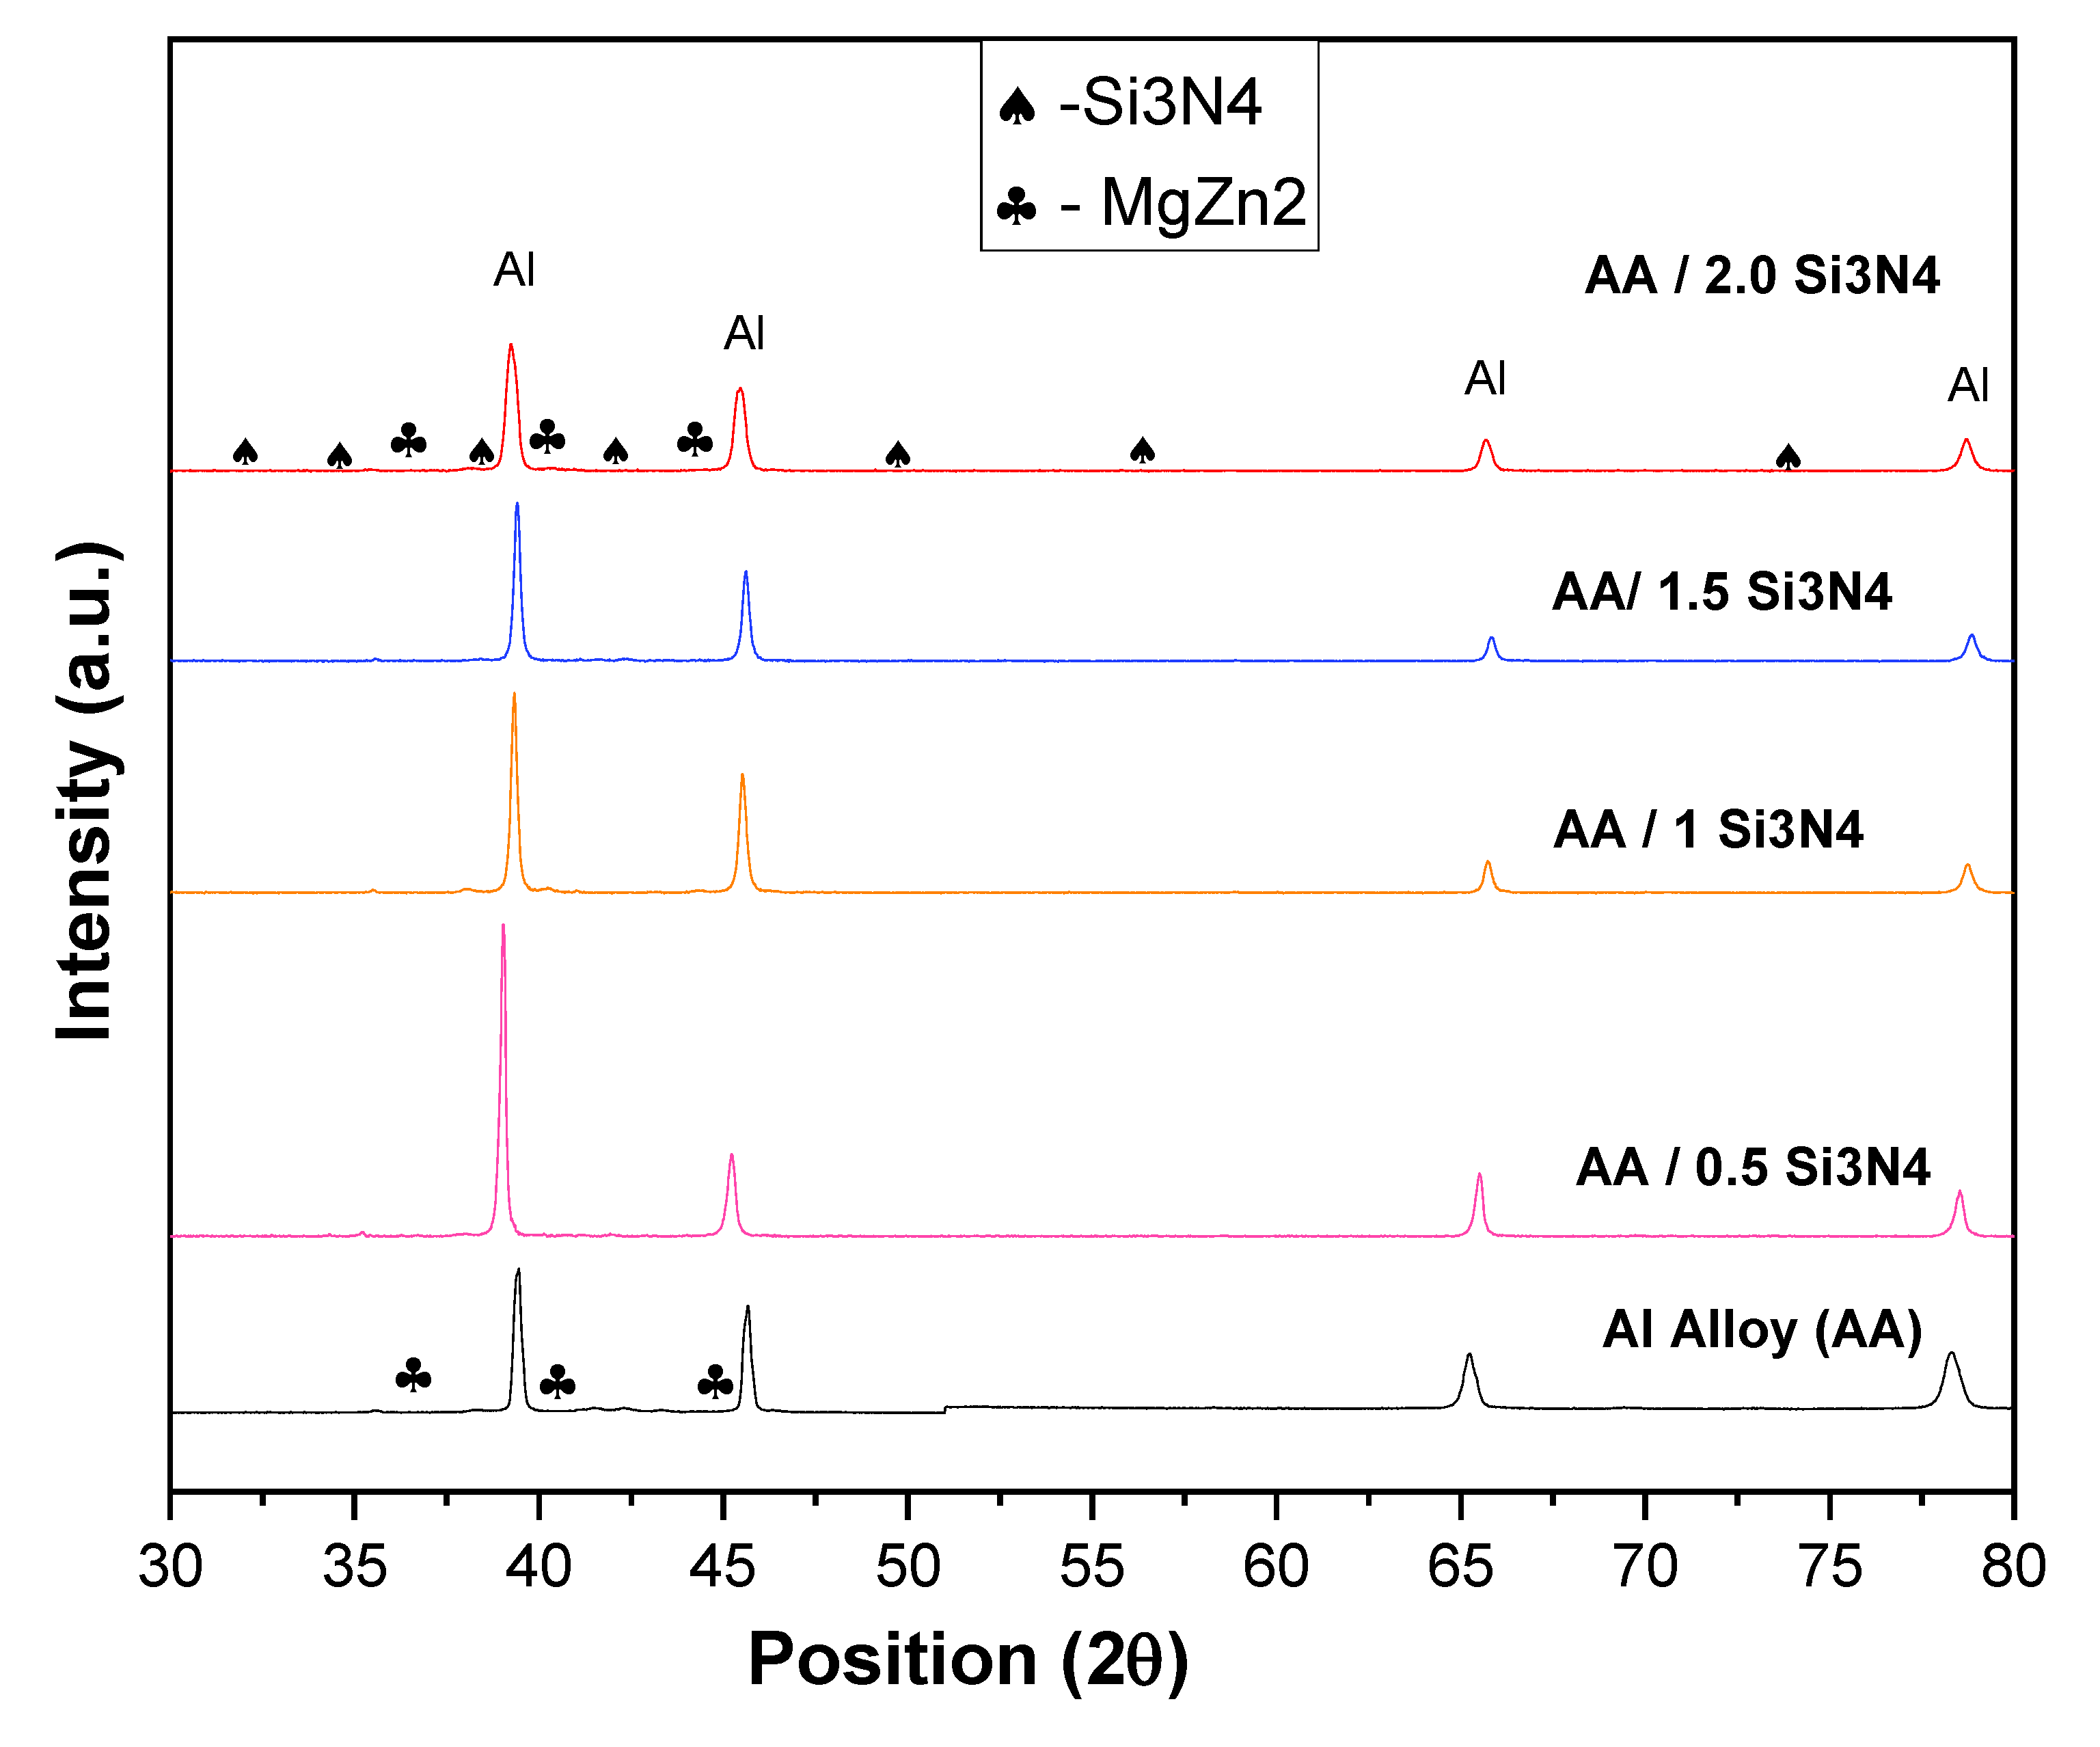
3.2. X-ray Diffraction (XRD) Analysis
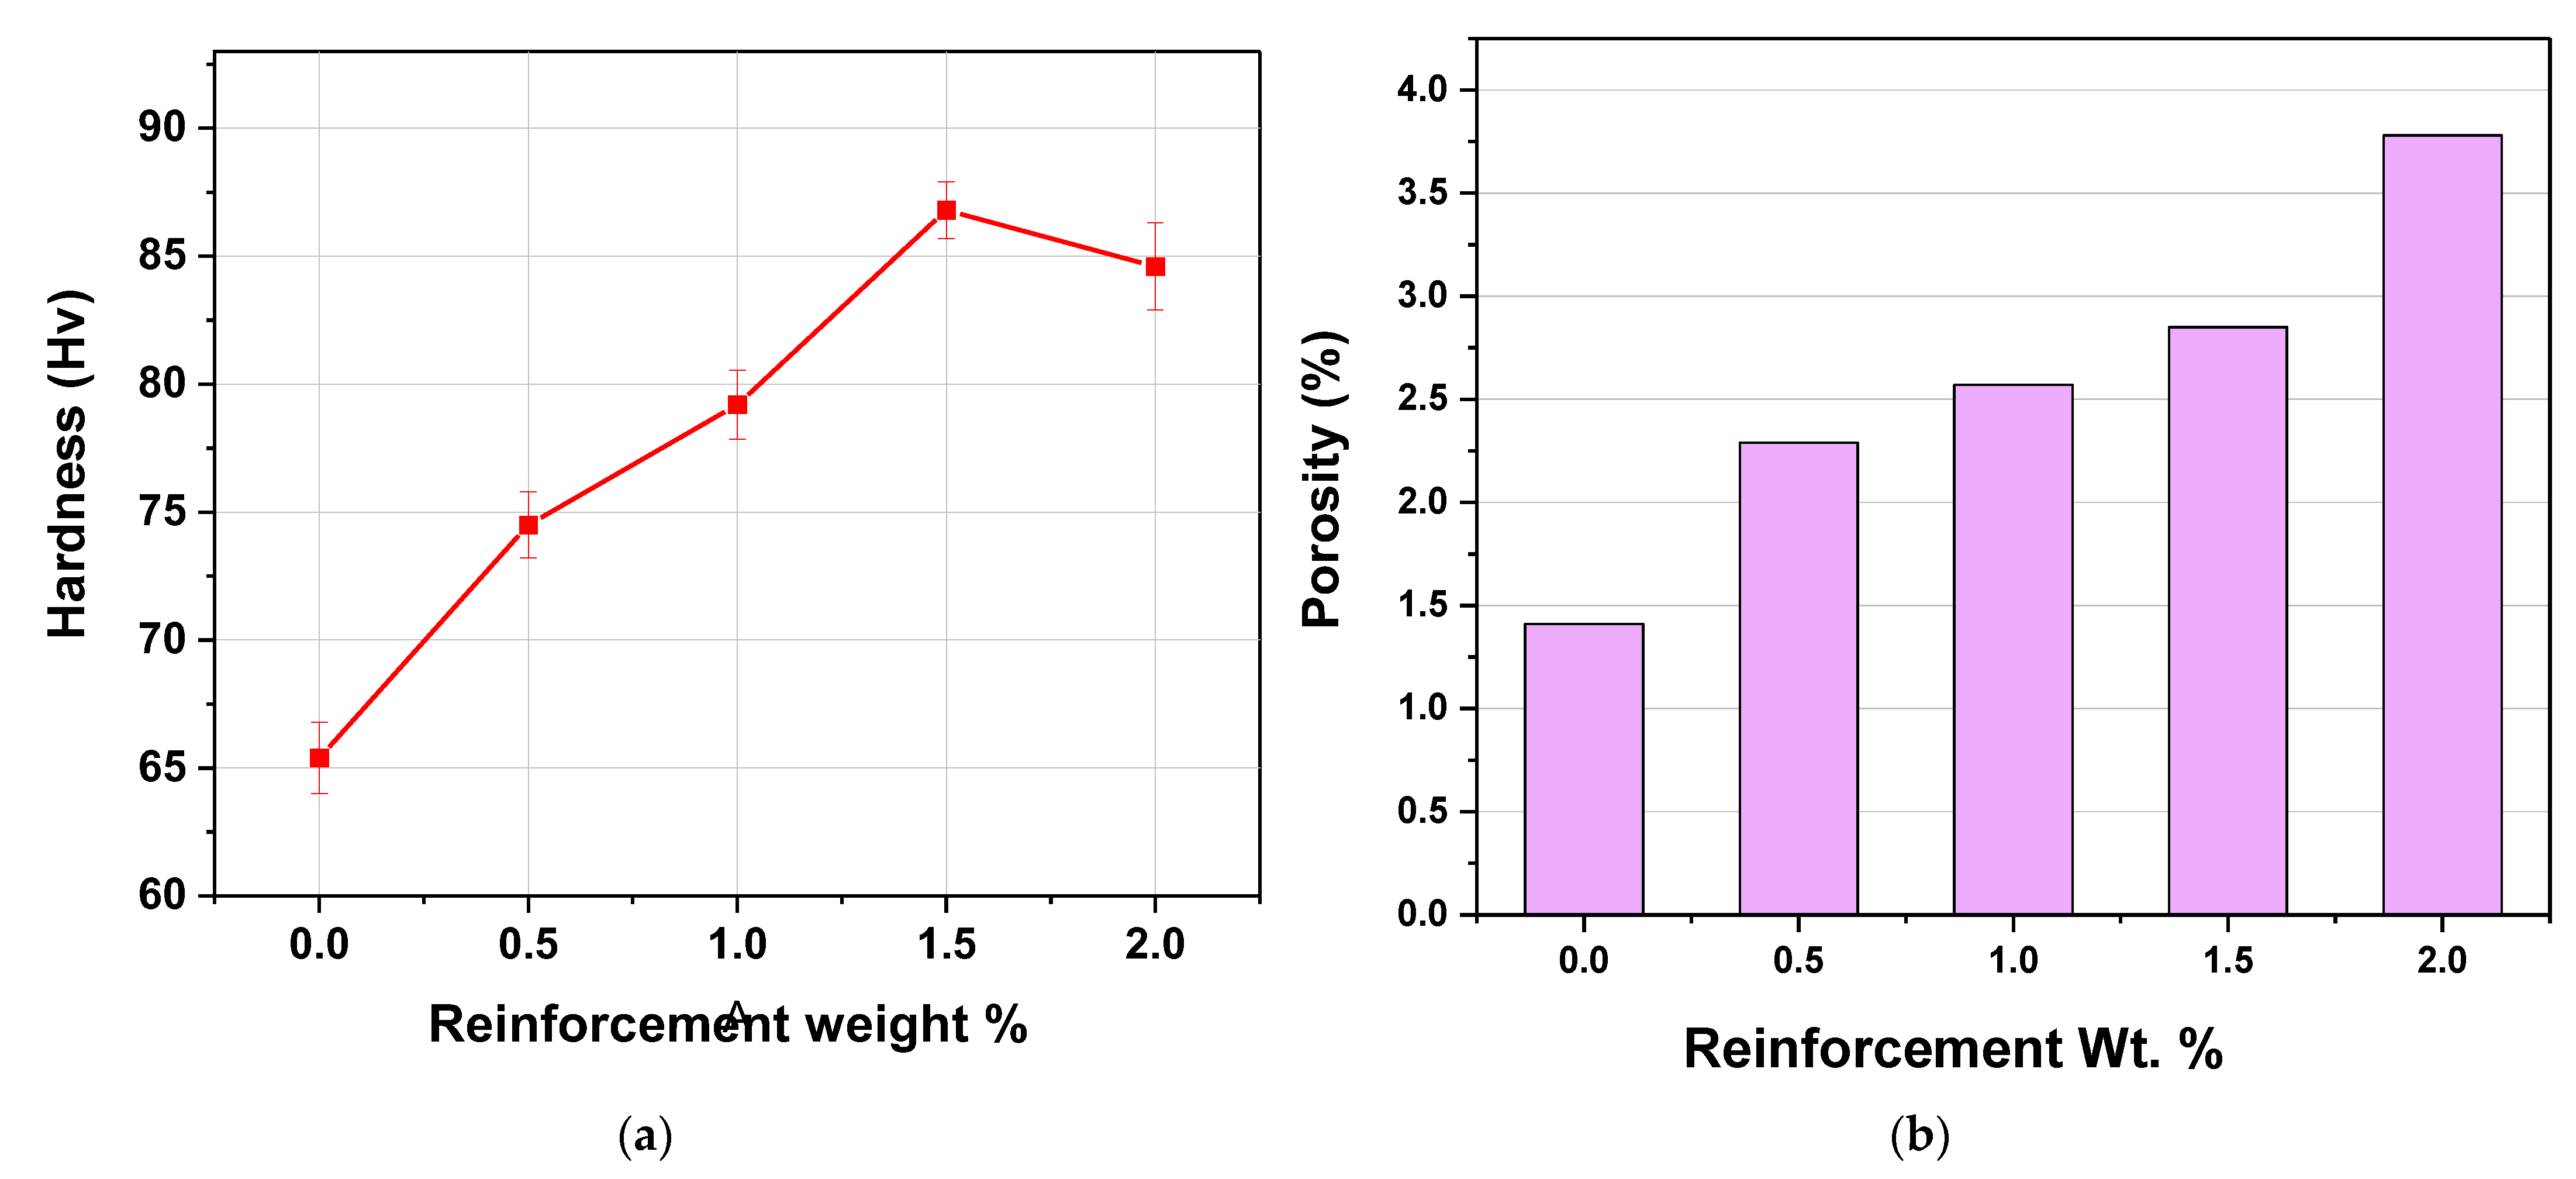
3.3. Micro Hardness and Porosity
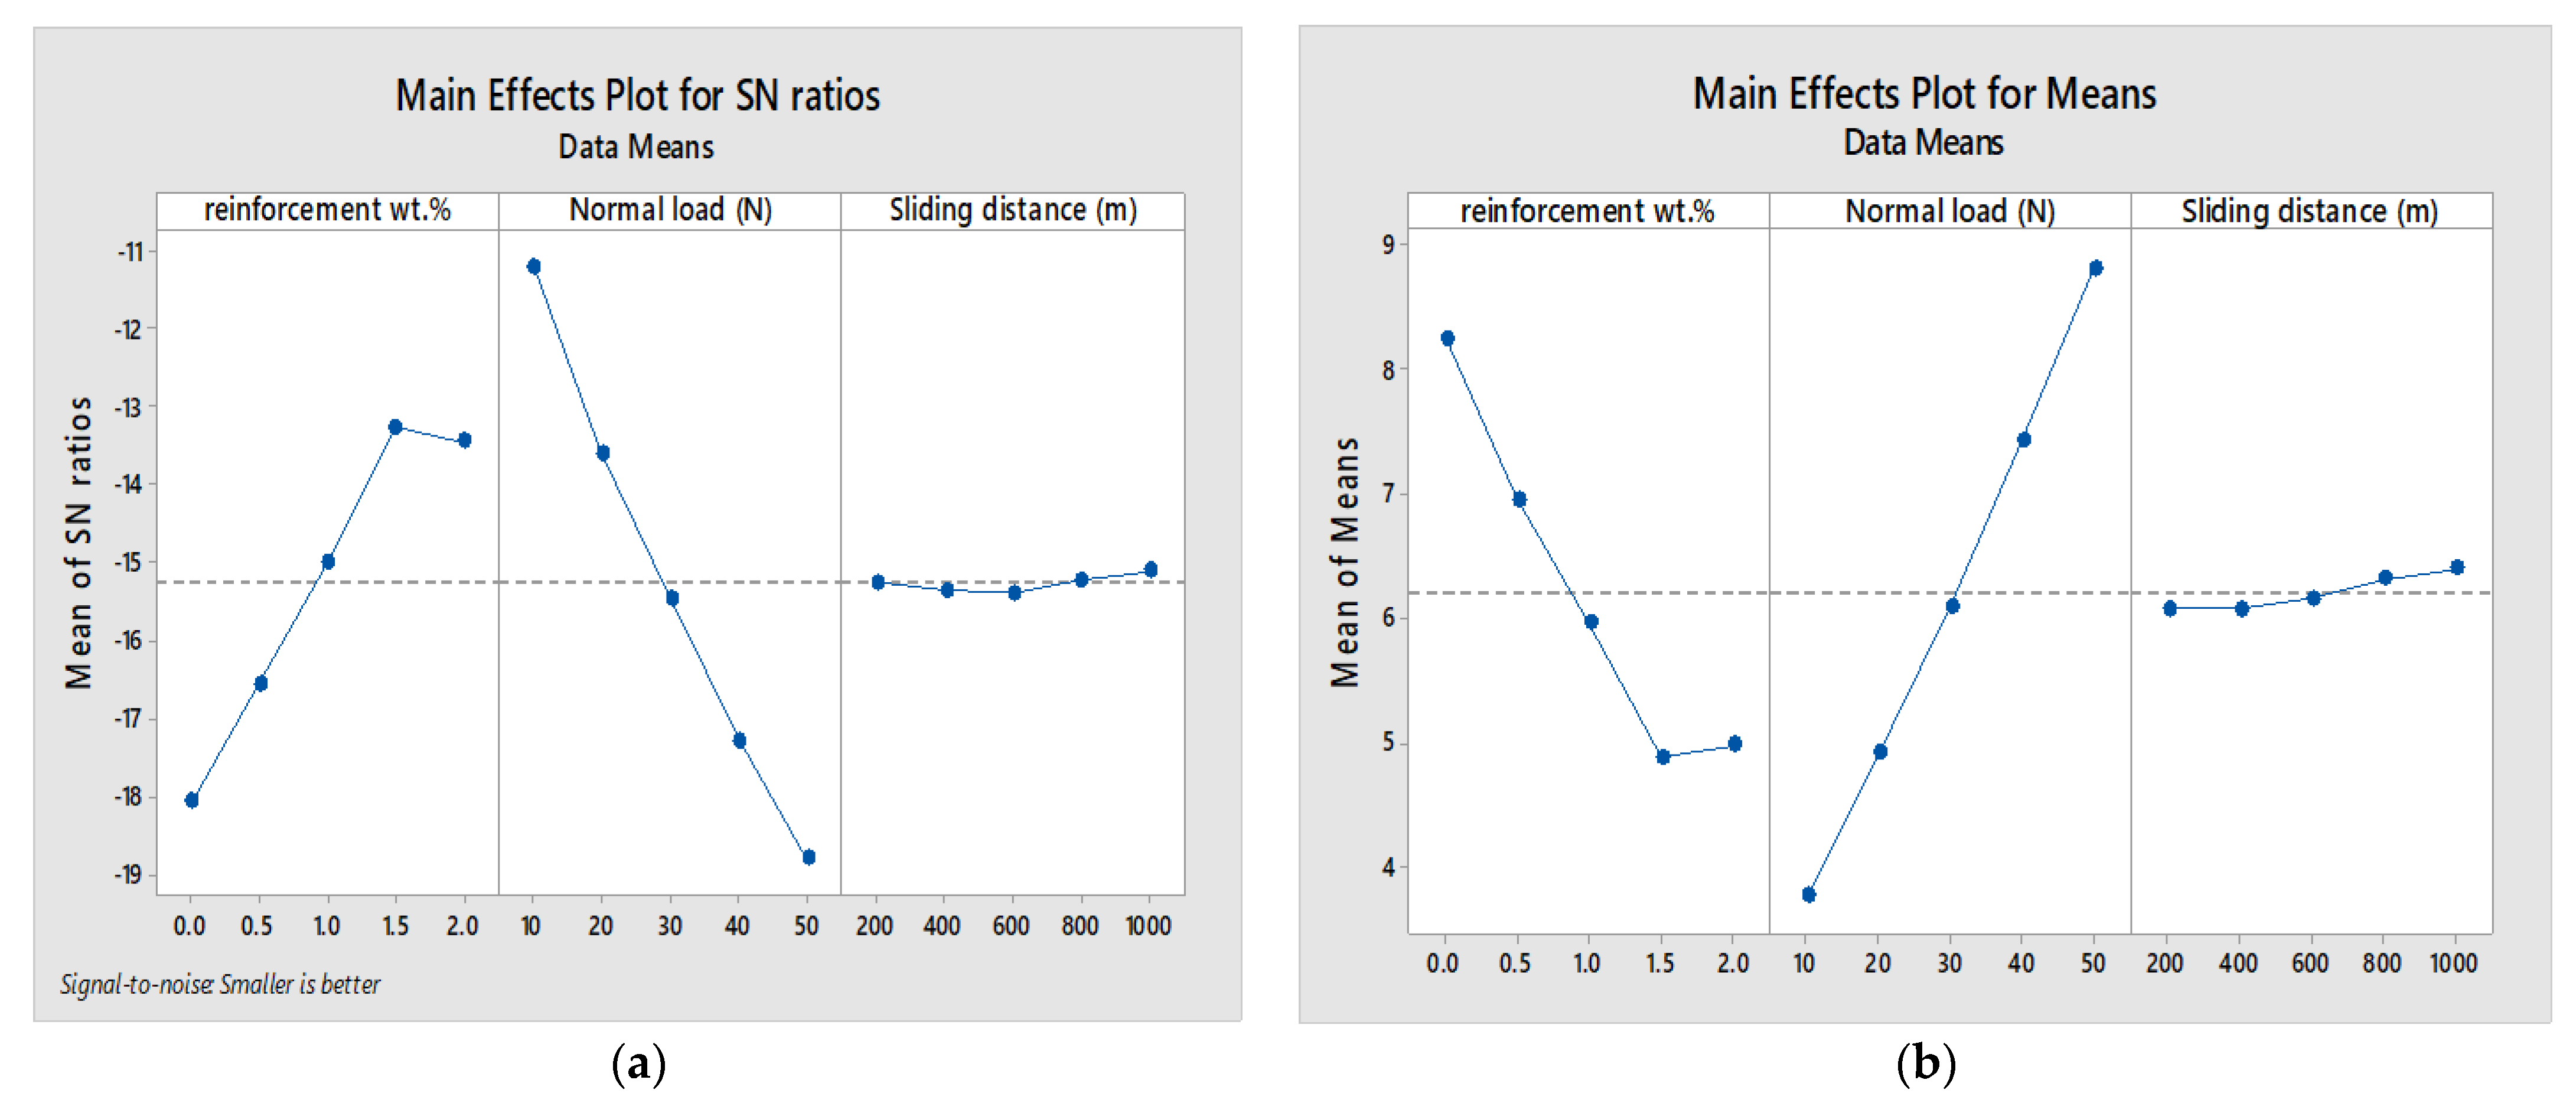
3.4. SNR Analysis
3.5. Analysis of Variance and Its Utility
3.6. Regression Modeling
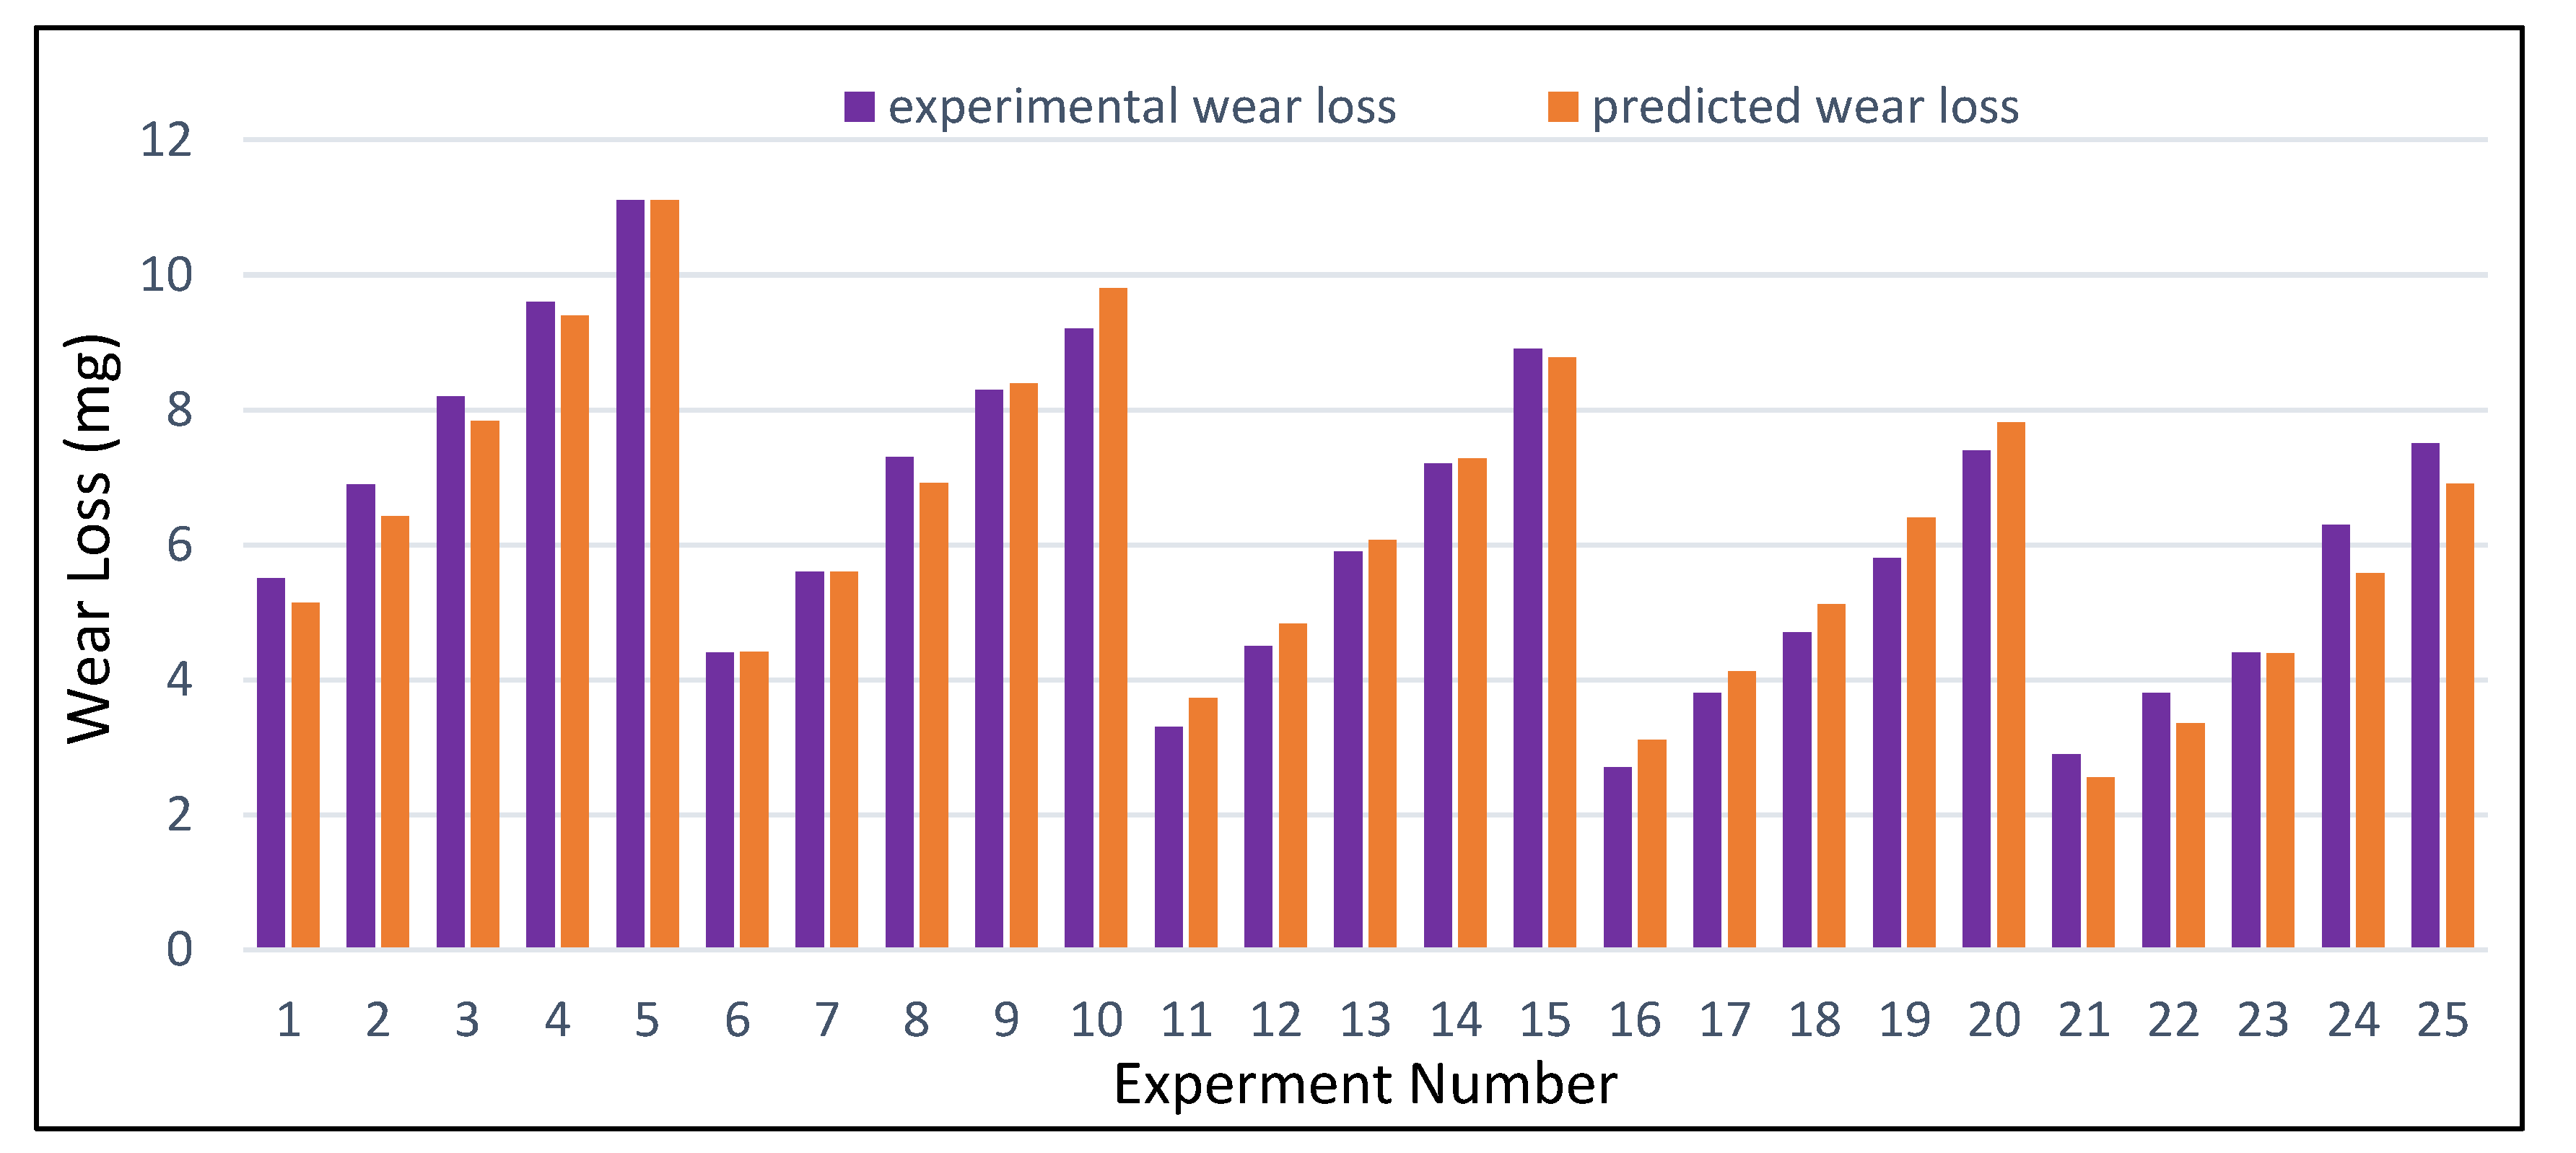
3.7. Confirmation Experiment
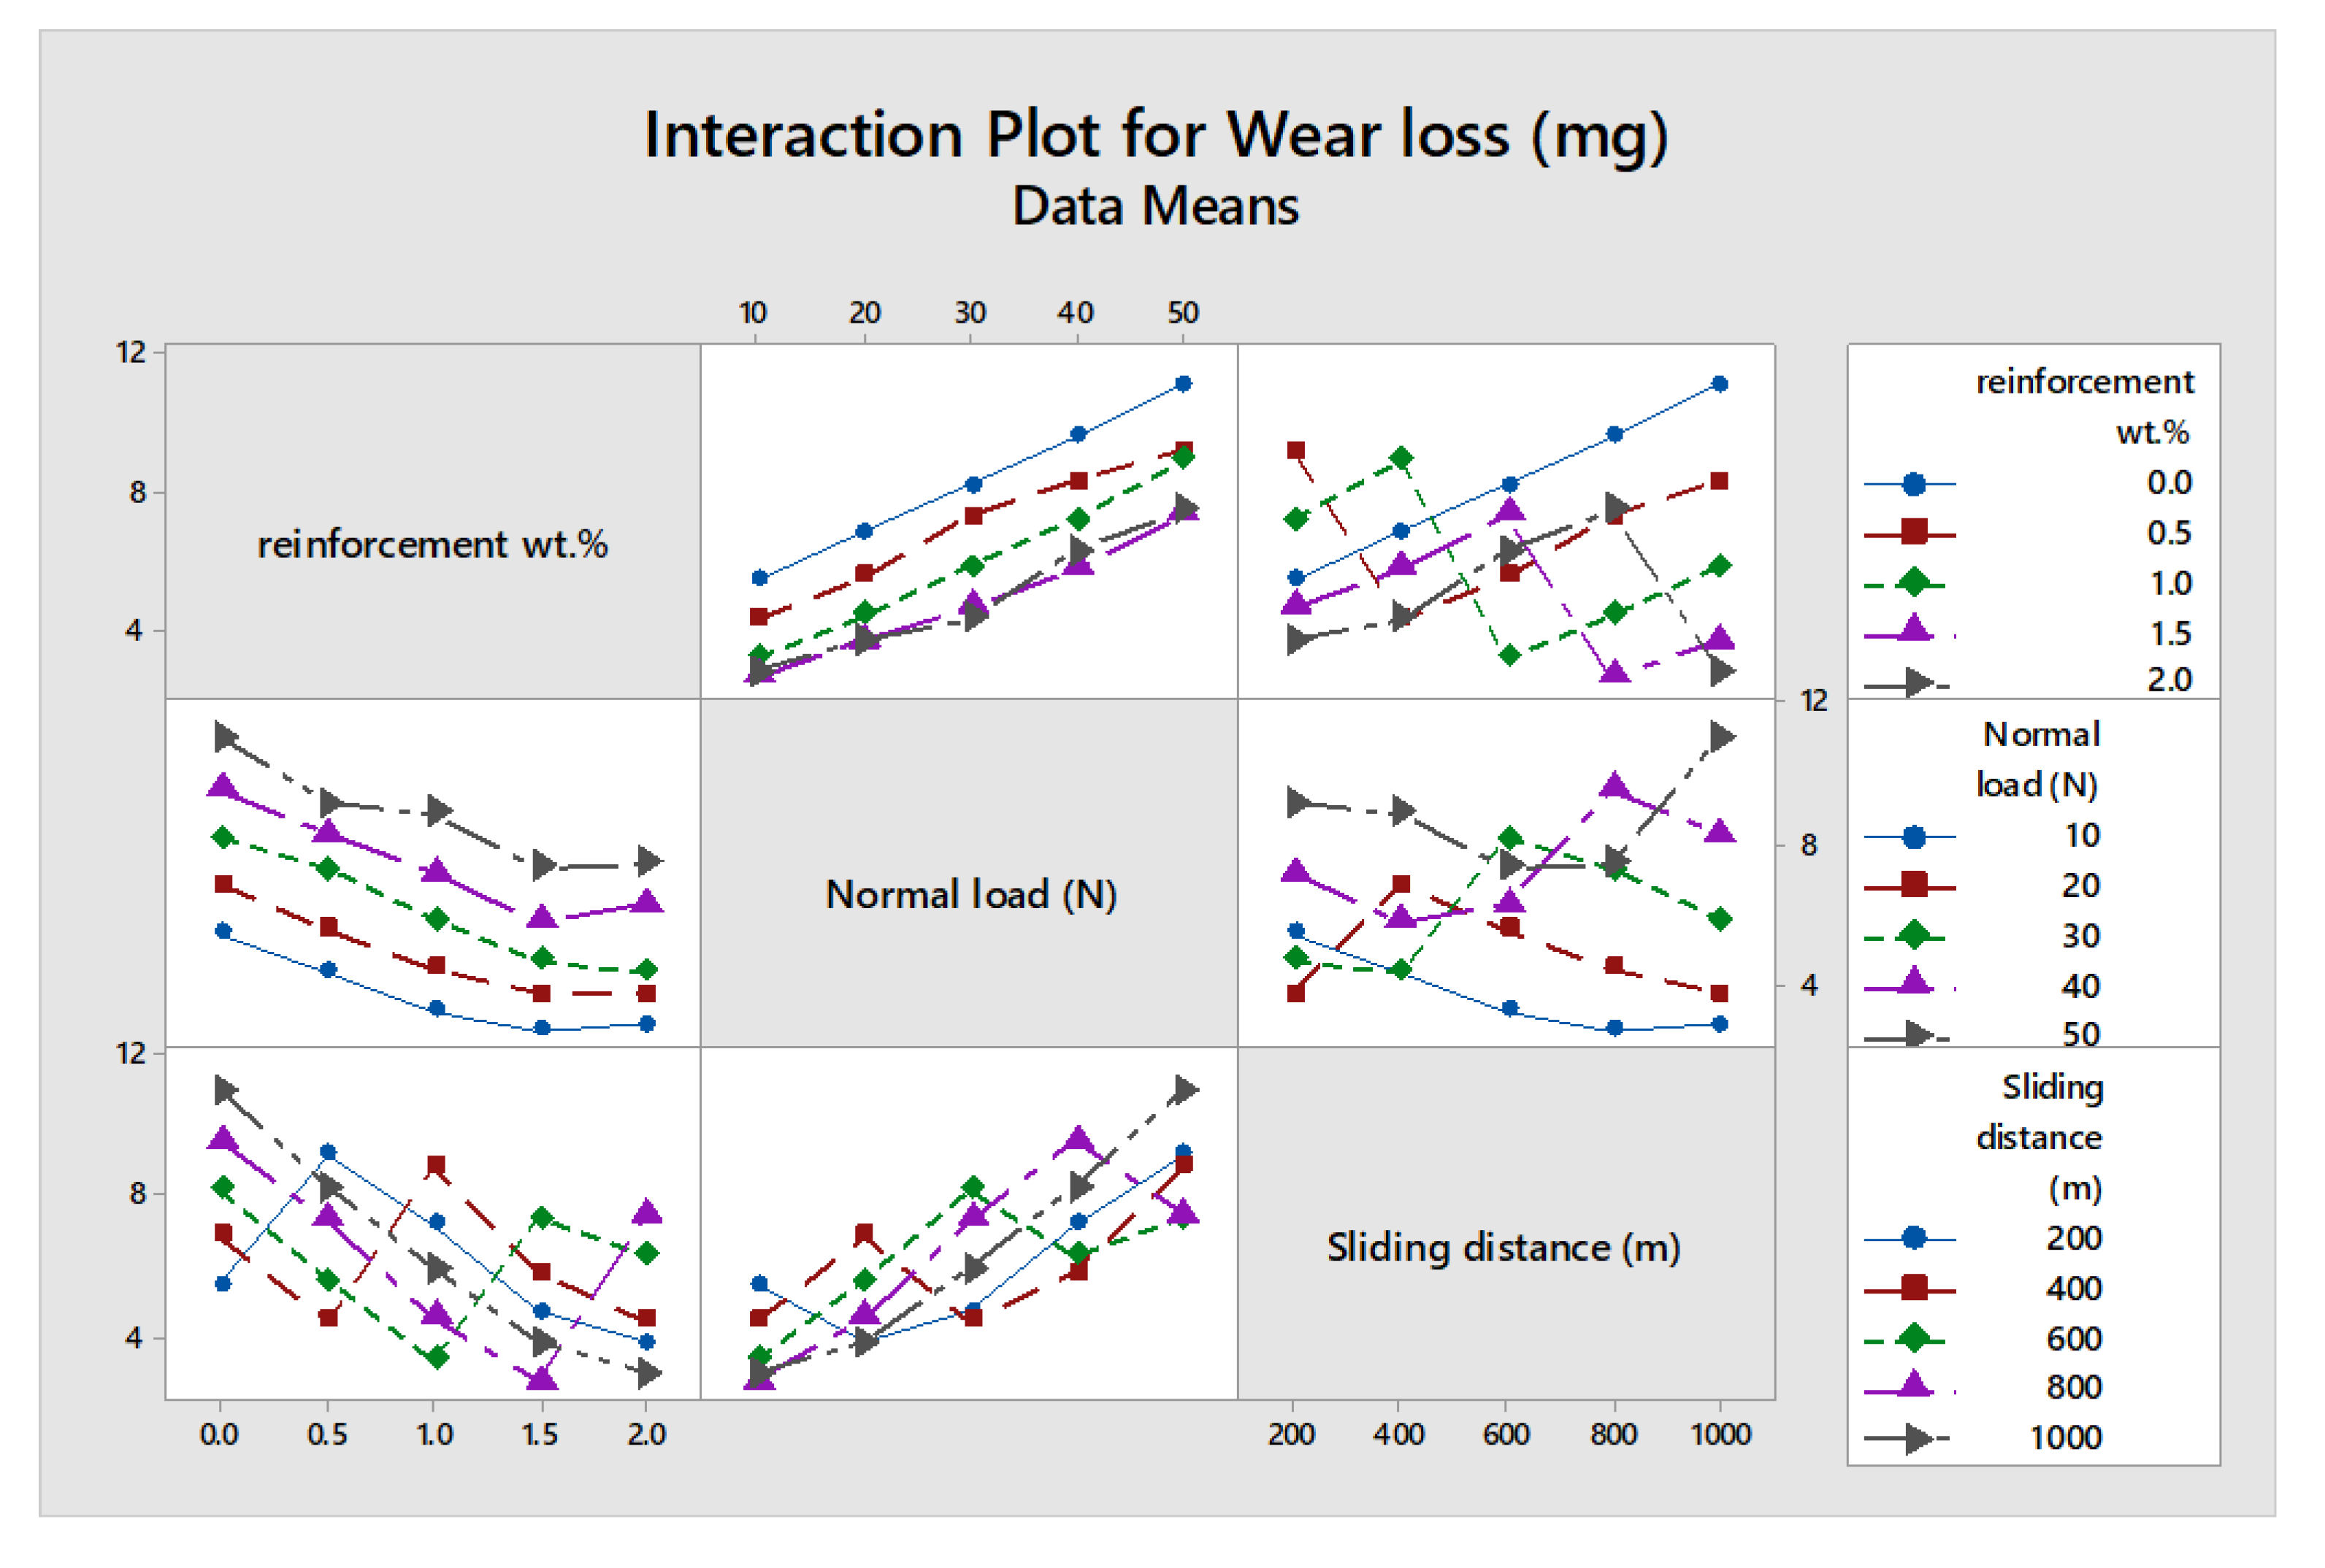
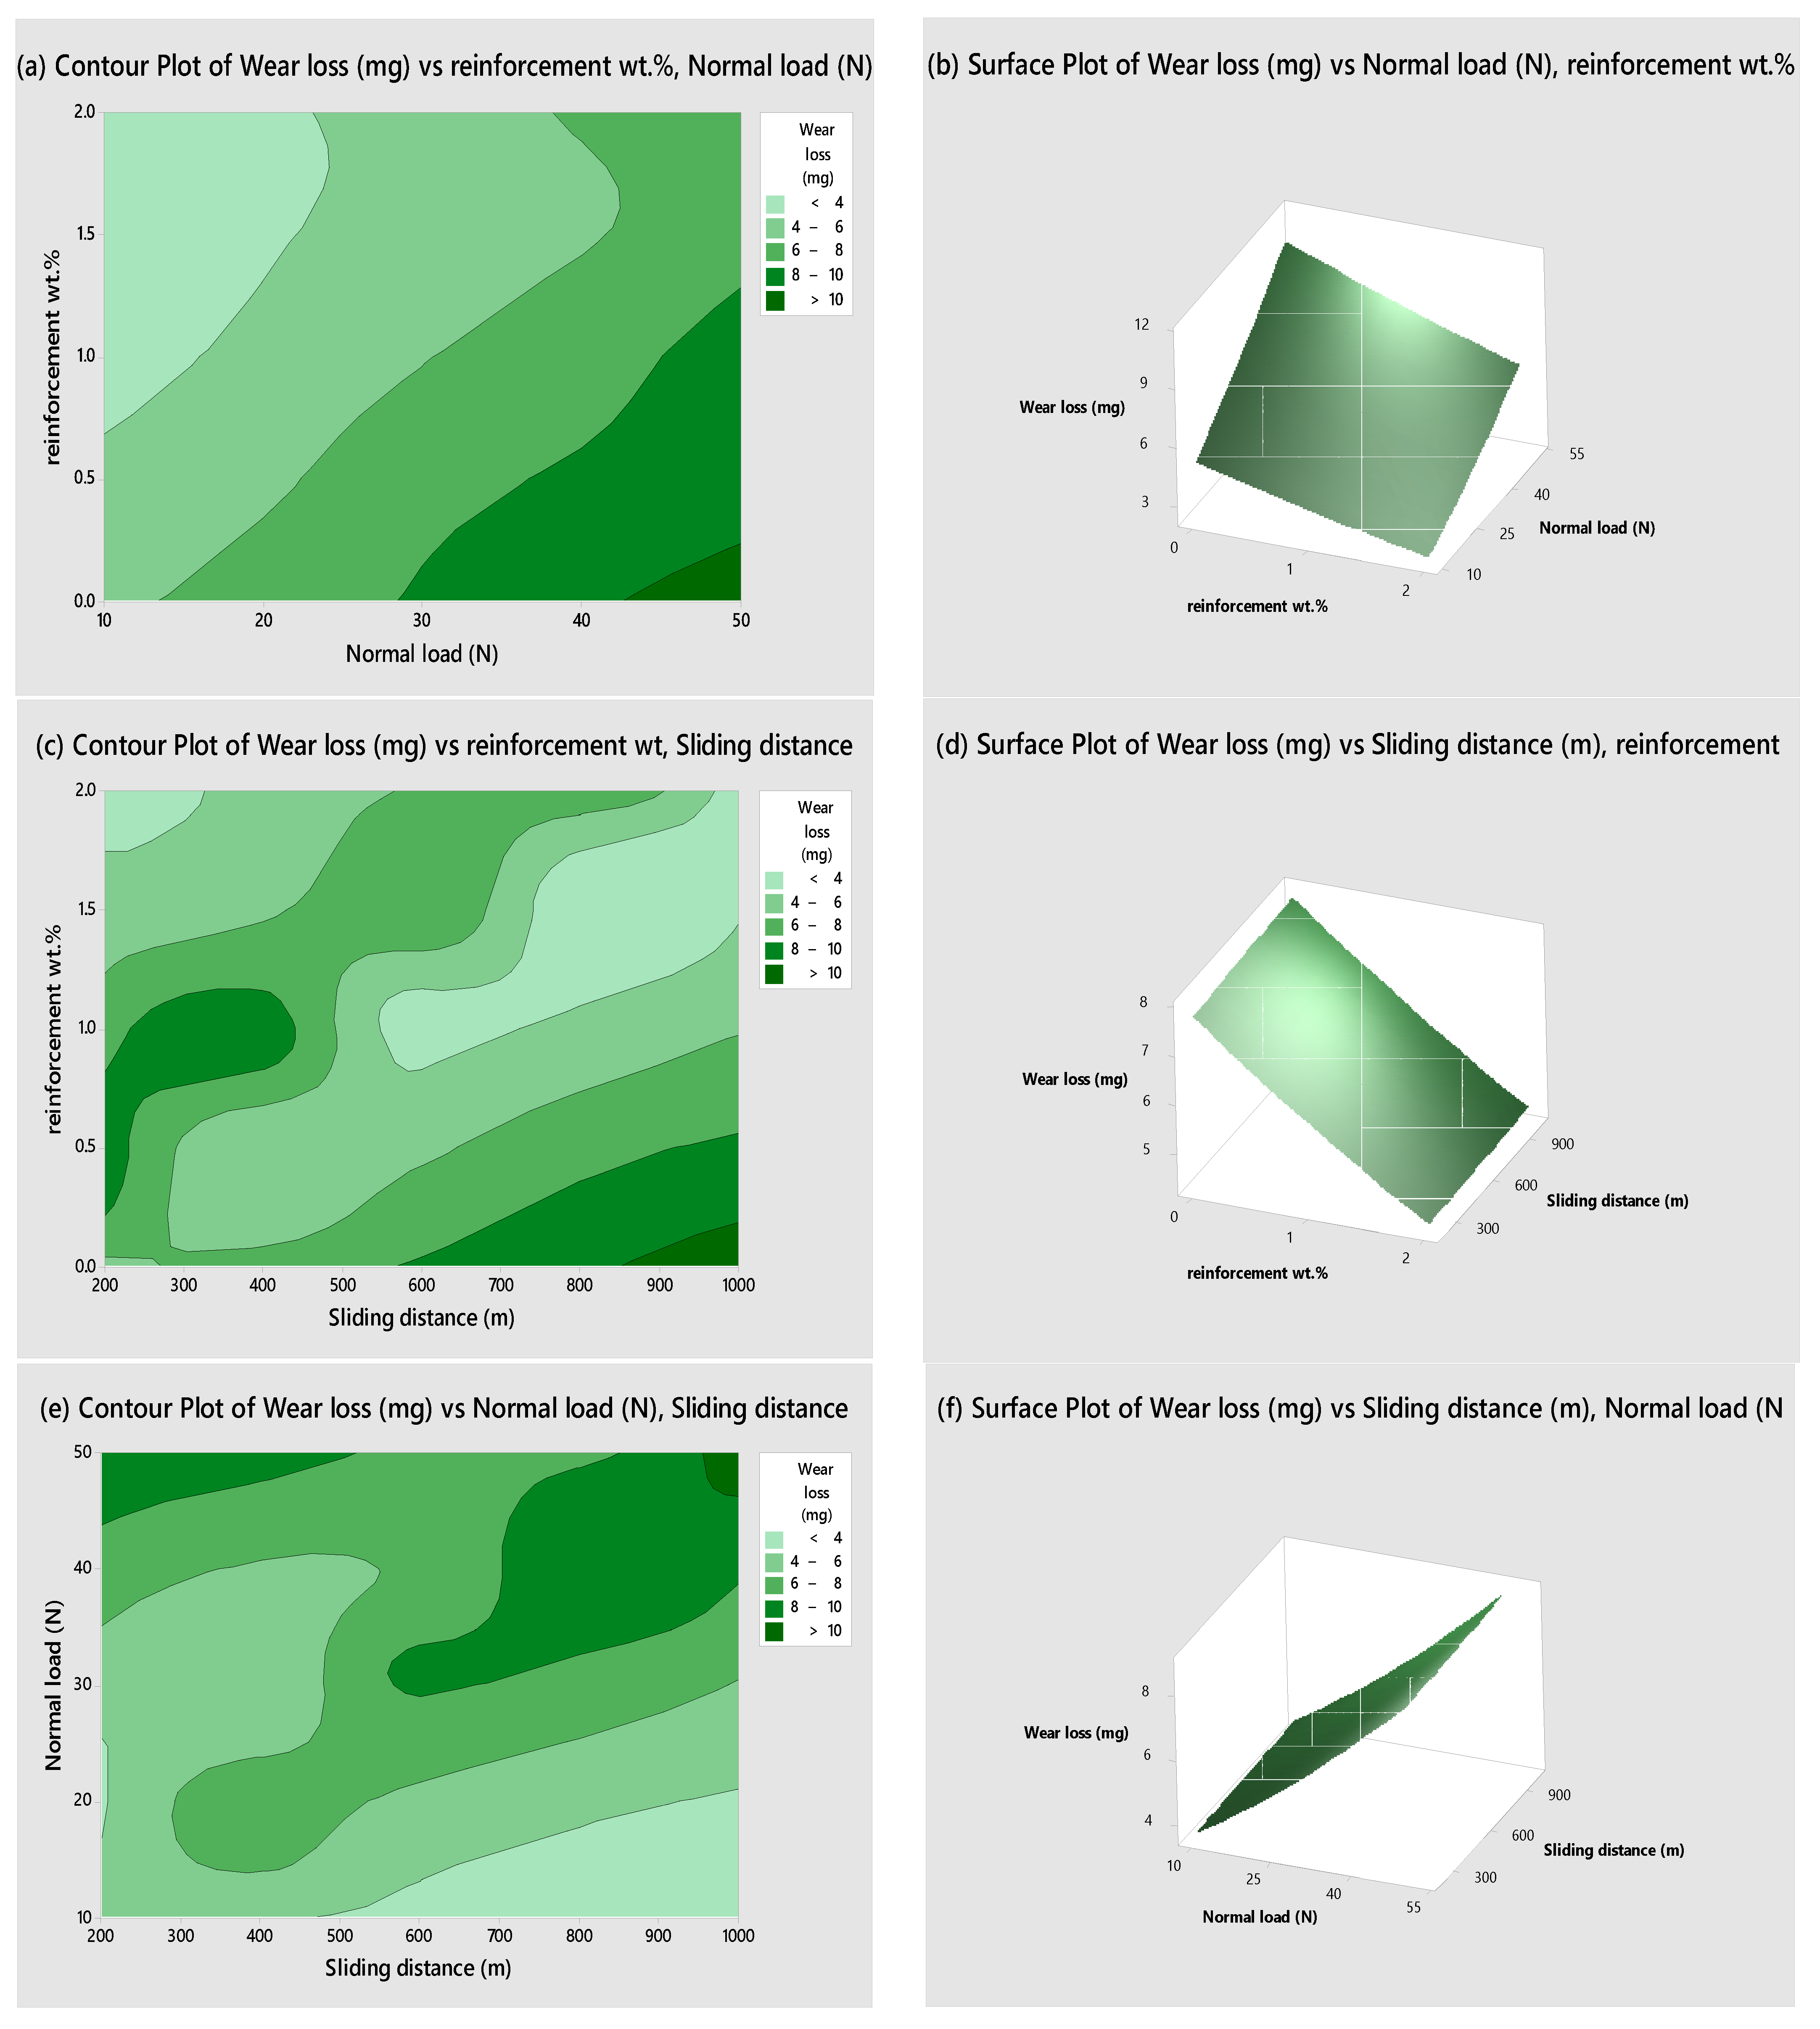
3.8. Contour and Surface Plots
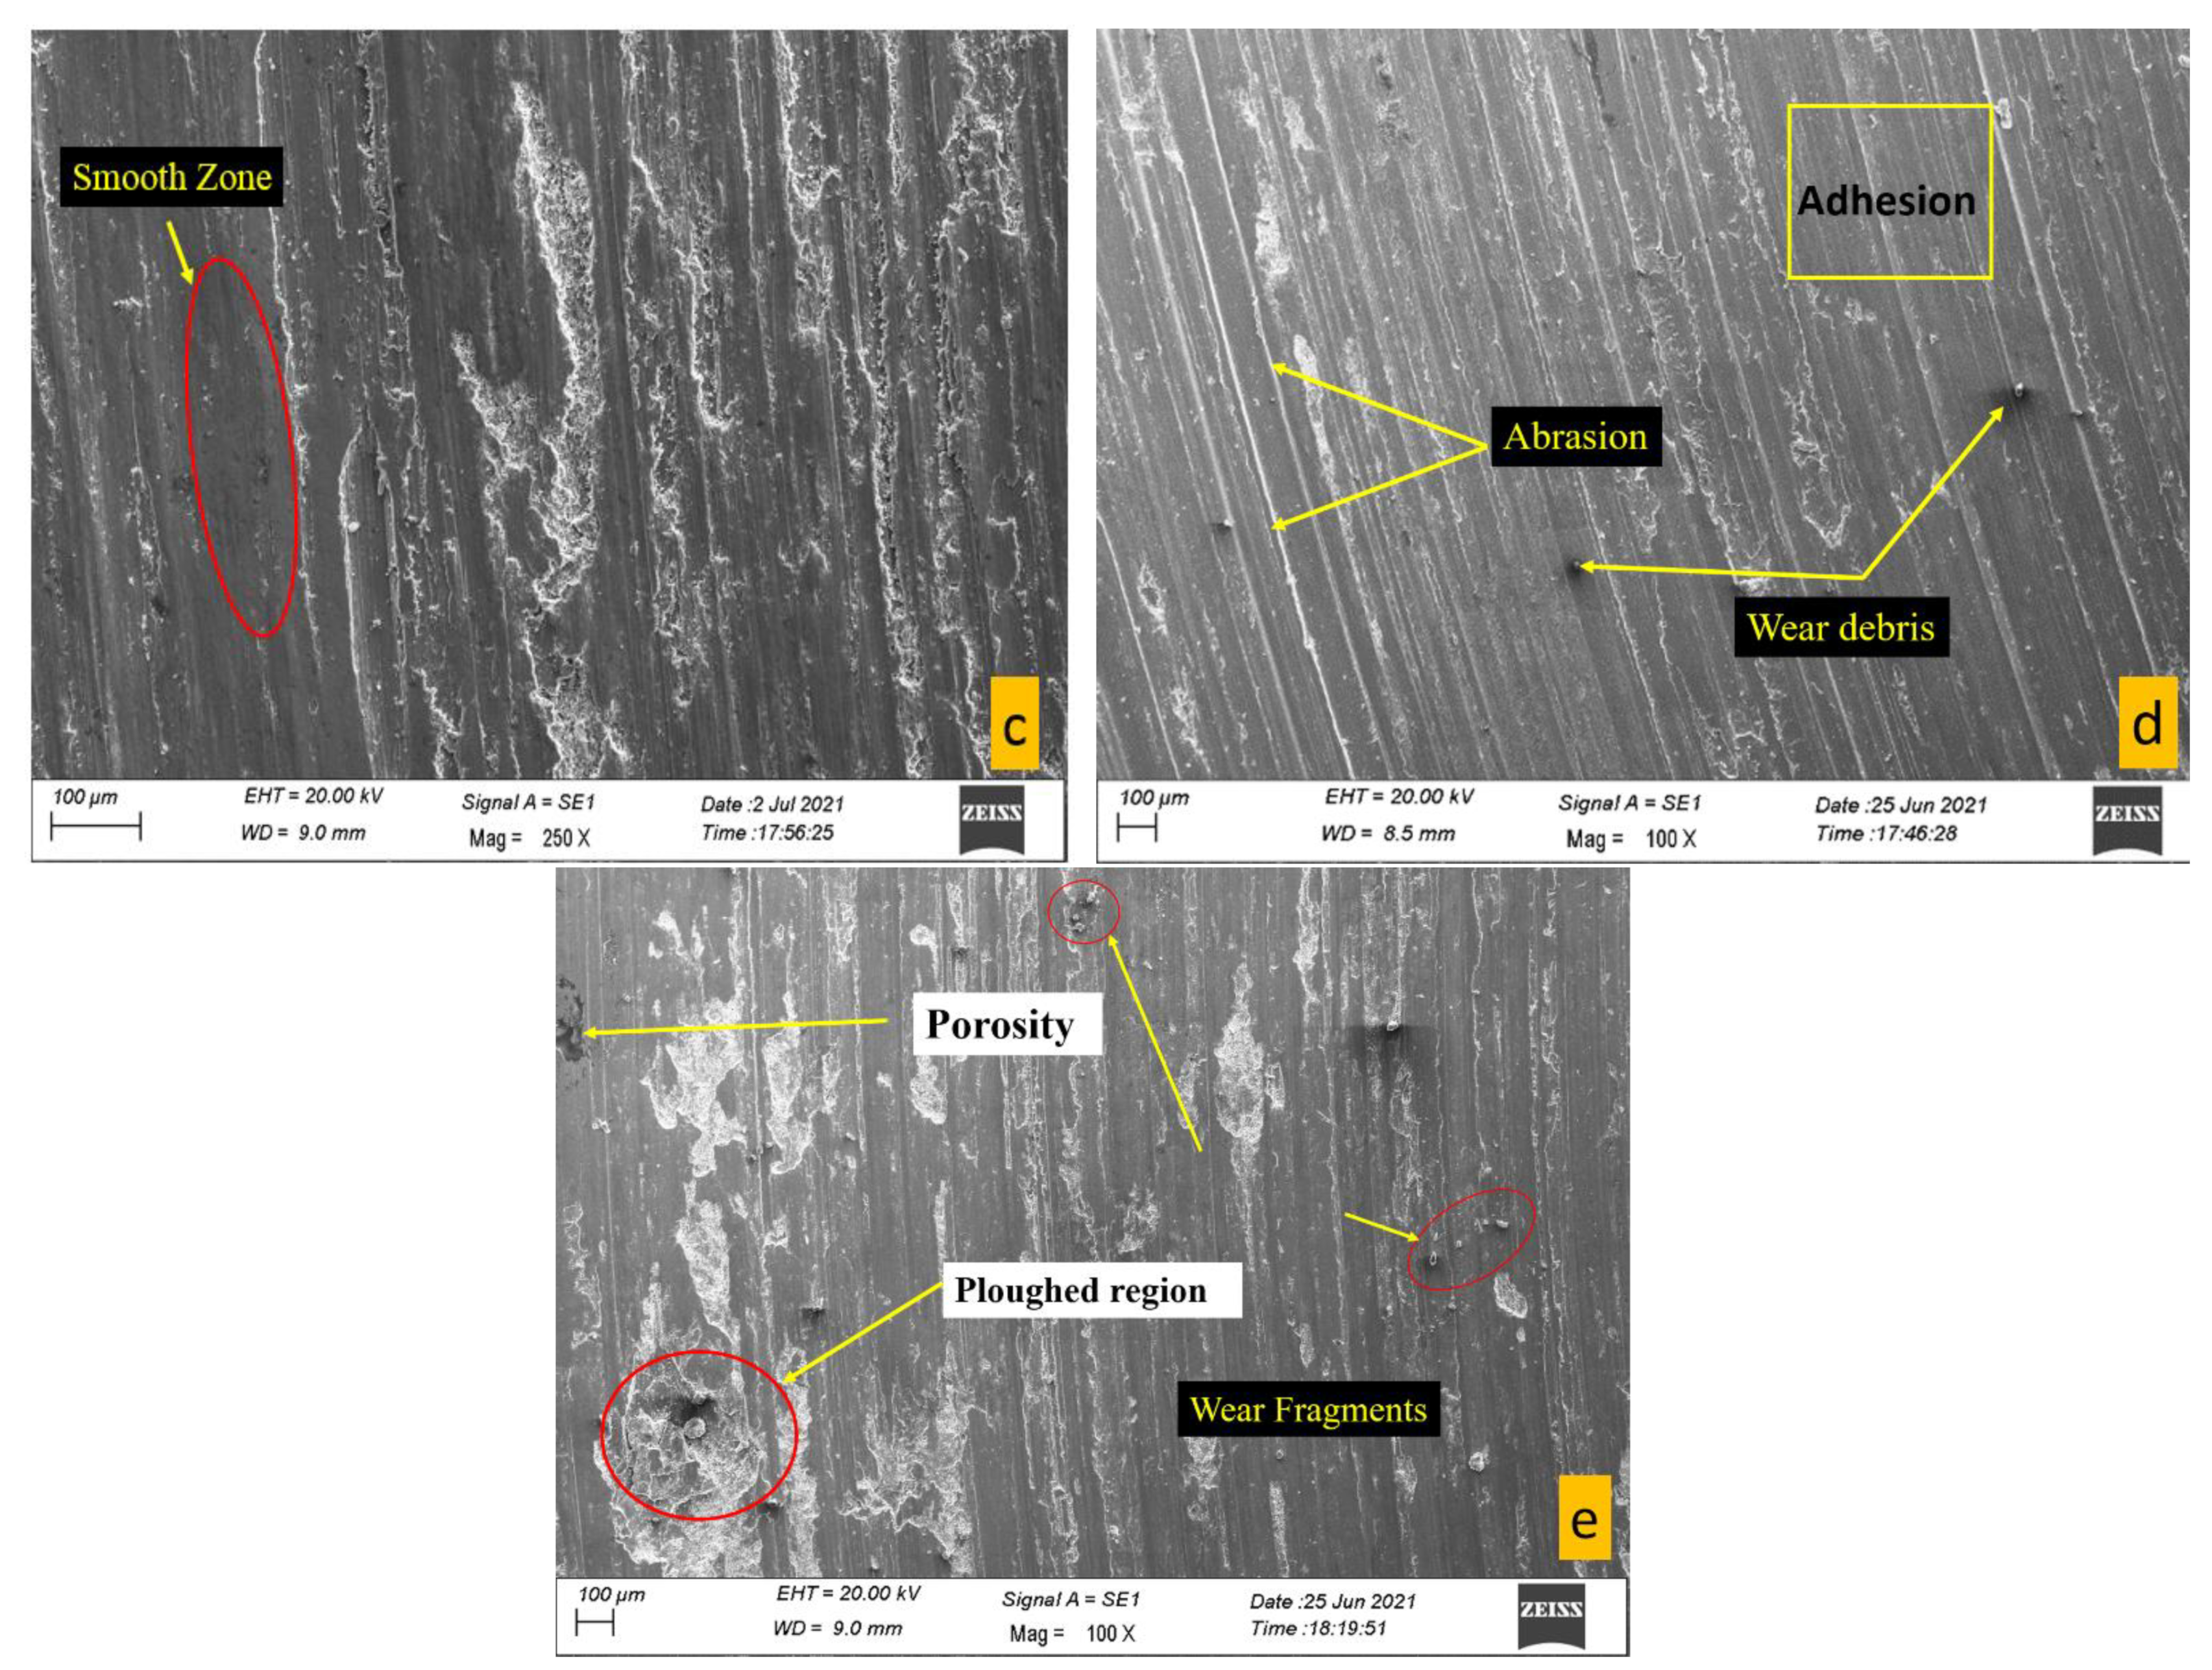
3.9. Worn Surface Study
4. Conclusions
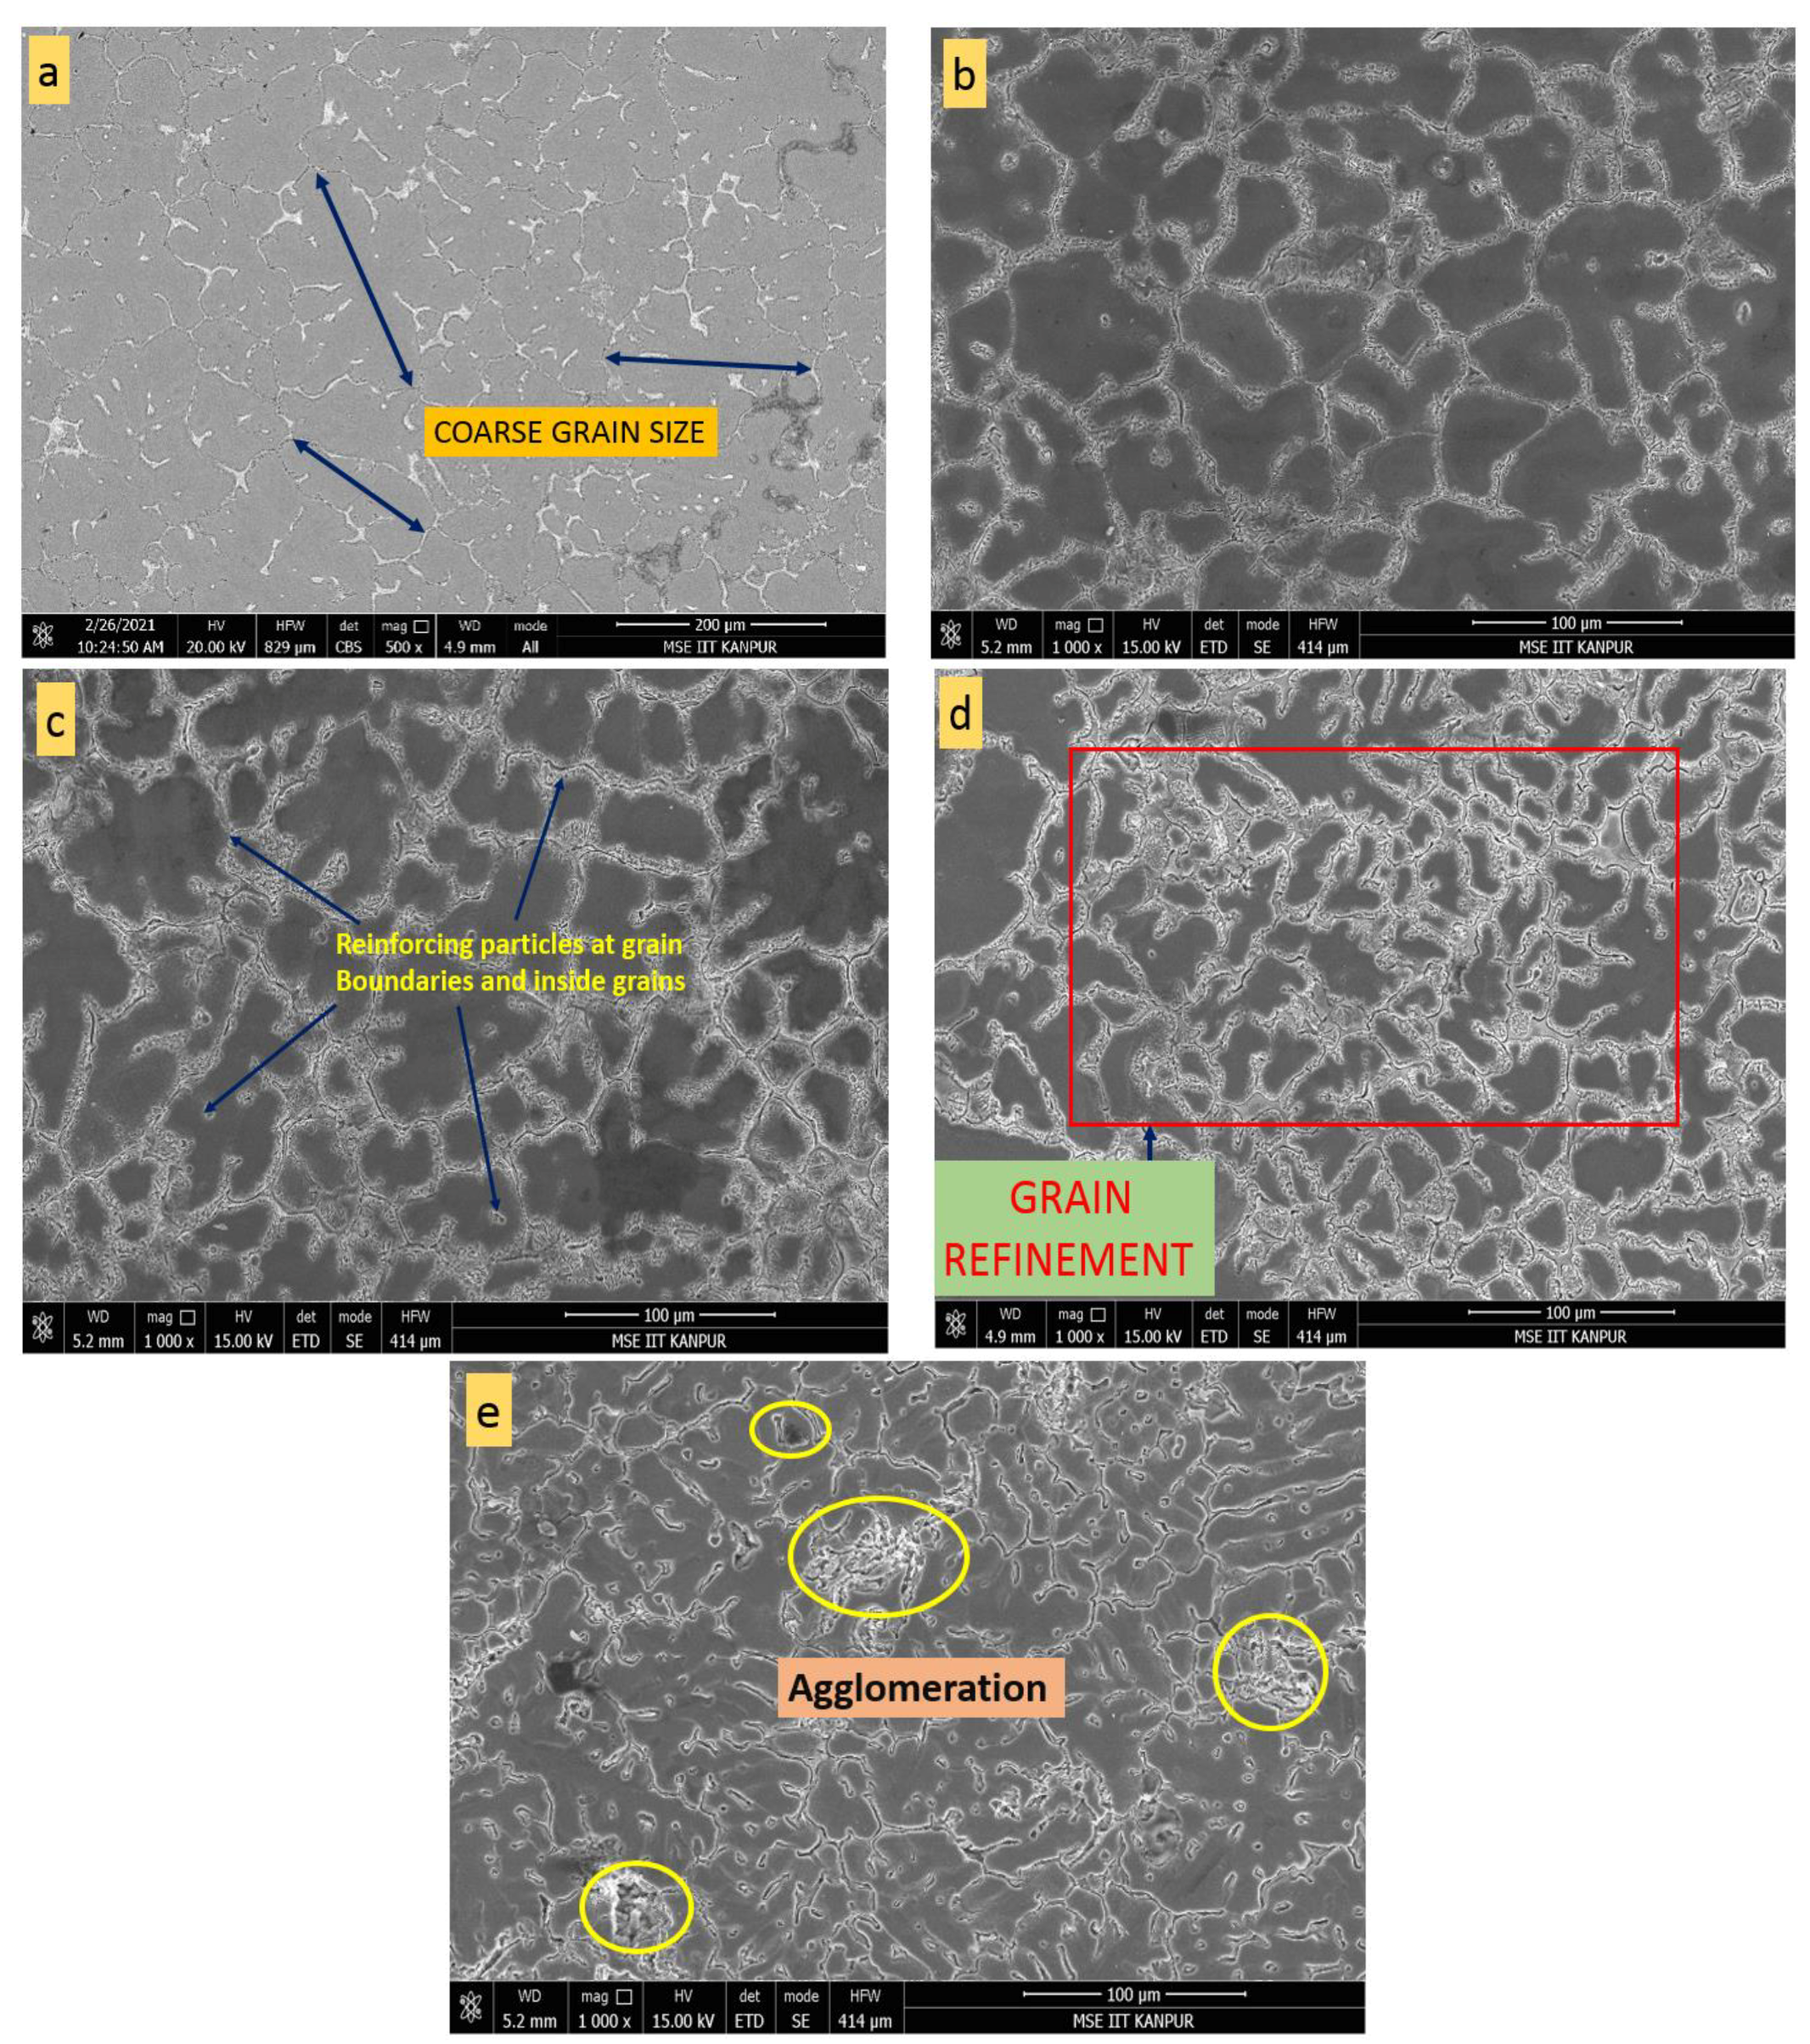
- The FESEM results revealed the presence of Si3N4 particles in the alloy, and reinforcement is homogeneously dispersed in the matrix alloy from 0.5 to 1.5 wt.%. In contrast, agglomeration of fine particles was found in nanocomposites reinforced with 2 wt.% Si3N4.
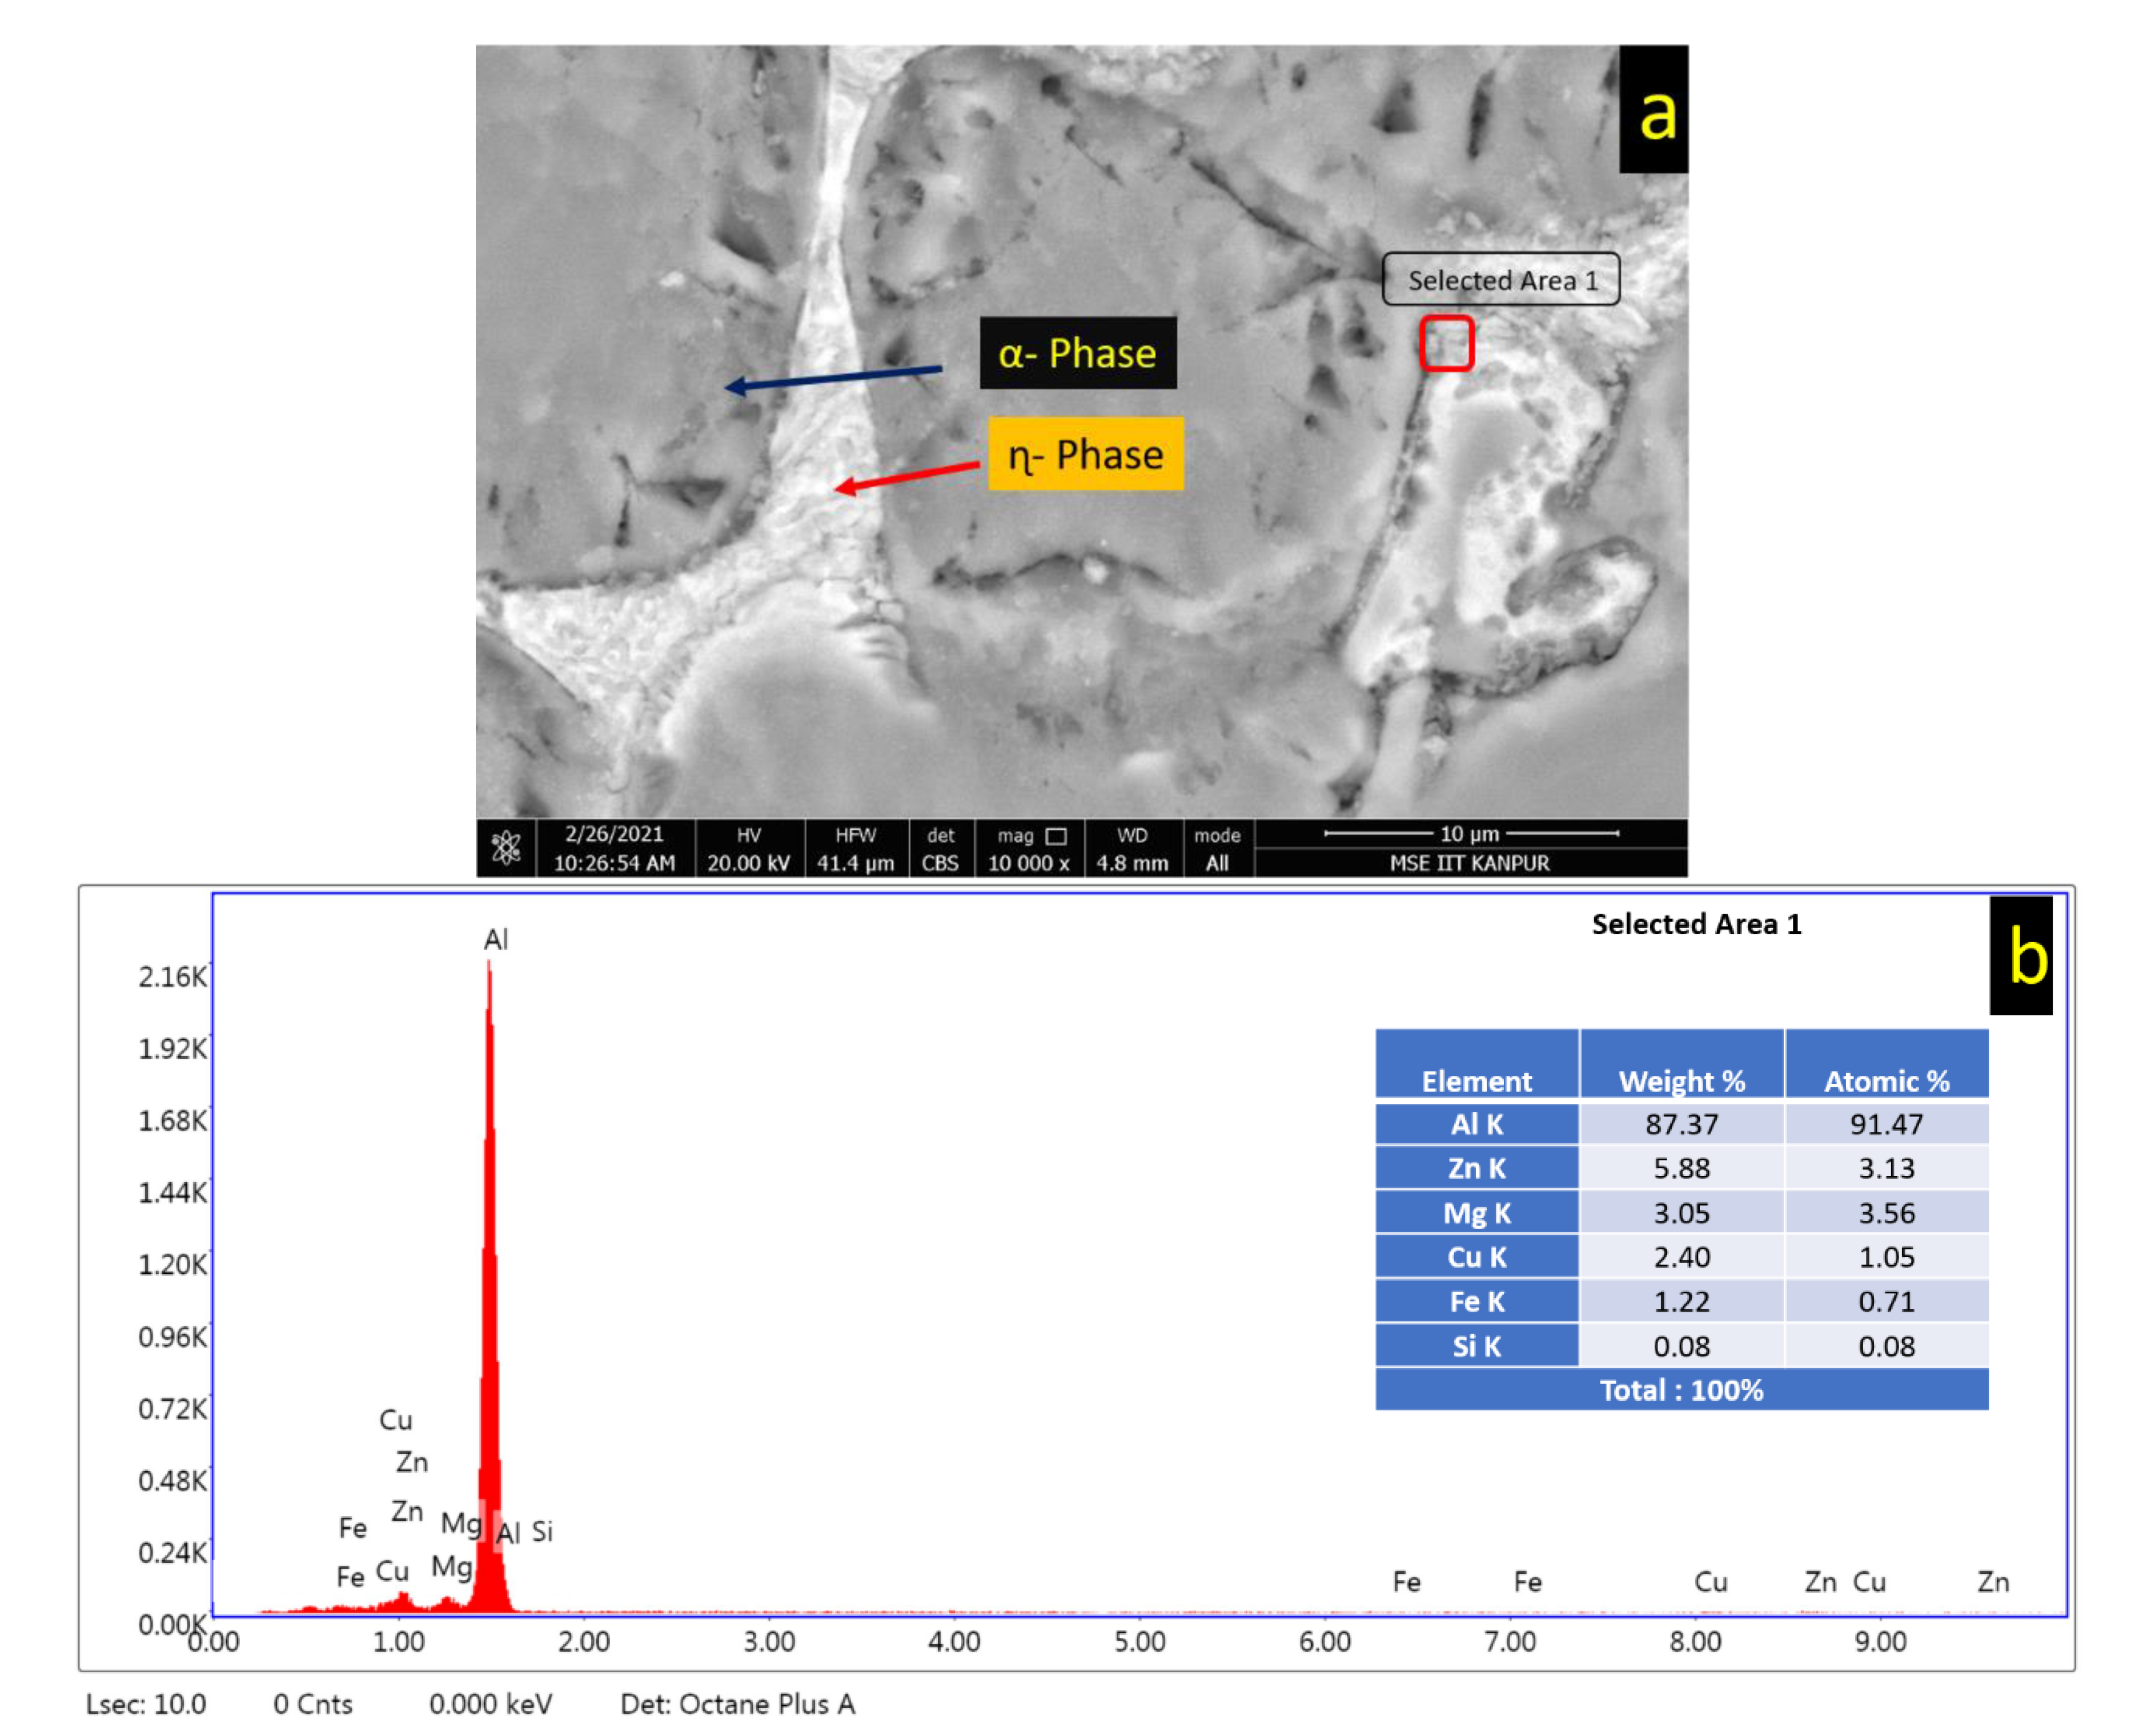
- From the microstructure analysis, α-Al and η-MgZn2 eutectic phases were observed in cast 7068 aluminum alloy, and coarse grains of the matrix were significantly refined with the incorporation of Si3N4 nanoparticles.
- Improvement in hardness was noticed up to 1.5 wt.%, and it reduced at 2 wt.% due to the clustering of particles. The hardness of the alloy significantly increased (32.72%) with the addition of 1.5 wt.% Si3N4 due to the combined effect of uniform dispersion of nanoparticles and increased load-bearing capacity by Si3N4.
- Normal load produces the highest percent contribution, 65.67%, on wear loss; wt.% of reinforcement creates the second most influencing contribution of 33.23%, and a minor contribution was noticed for sliding distance.
- The optimum levels of each factor are 1.5 wt.% Si3N4 reinforcement, 10 N normal load, and 400 m sliding distance. The confirmation wear test observed a minimum wear loss of 2.67 mg on optimum parameters.
- It is observed from the worn micrograph study that abrasion is the dominating wear mechanism resulting from three-body abrasion. The secondary wear mechanism is fatigue spallation started at the alloy metallic matrix and ceramic reinforcement interfaces and adhesive smearing of nanocomposites.
Author Contributions
Funding
Institutional Review Board Statement
Informed Consent Statement
Data Availability Statement
Acknowledgments
Conflicts of Interest
References
- Rao, T.B. Microstructural, mechanical, and wear properties characterization and strengthening mechanisms of Al7075/SiCnp composites processed through ultrasonic cavitation assisted stir-casting. Mater. Sci. Eng. A 2020, 805, 140553. [Google Scholar] [CrossRef]
- Ghandvar, H.; Farahany, S.; Idris, J. Wettability Enhancement of SiCp in Cast A356/SiCp Composite Using Semisolid Process. Mater. Manuf. Process. 2015, 30, 1442–1449. [Google Scholar] [CrossRef]
- Srivastava, N.; Chaudhari, G. Strengthening in Al alloy nano composites fabricated by ultrasound assisted solidification technique. Mater. Sci. Eng. A 2016, 651, 241–247. [Google Scholar] [CrossRef]
- Mistry, J.M.; Gohil, P.P. Experimental investigations on wear and friction behaviour of Si3N4p reinforced heat-treated aluminium matrix composites produced using electromagnetic stir casting process. Compos. Part B Eng. 2018, 161, 190–204. [Google Scholar] [CrossRef]
- Chen, Z.; Sun, G.; Wu, Y.; Mathon, M.; Borbely, A.; Chen, D.; Ji, G.; Wang, M.; Zhong, S.; Wang, H. Multi-scale study of microstructure evolution in hot extruded nano-sized TiB 2 particle reinforced aluminum composites. Mater. Des. 2017, 116, 577–590. [Google Scholar] [CrossRef]
- Sheelwant, A.; Dutta, S.; Sonti, K.S.M.; Narala, S.K.R. Processing and performance assessment of particulate TiB2 reinforced aluminum MMC developed via a novel hybrid ultrasonic casting system. Mater. Manuf. Process. 2021, 37, 186–196. [Google Scholar] [CrossRef]
- Zhou, D.; Qiu, F.; Jiang, Q. The nano-sized TiC particle reinforced Al–Cu matrix composite with superior tensile ductility. Mater. Sci. Eng. A 2015, 622, 189–193. [Google Scholar] [CrossRef]
- Sivaraj, M.; Selvakumar, N. Experimental Analysis of Al–TiC Sintered Nanocomposite on EDM Process Parameters Using ANOVA. Mater. Manuf. Process. 2015, 31, 802–812. [Google Scholar] [CrossRef]
- Joshua, K.J.; Vijay, S.; Selvaraj, D.P. Effect of nano TiO2 particles on microhardness and microstructural behavior of AA7068 metal matrix composites. Ceram. Int. 2018, 44, 20774–20781. [Google Scholar] [CrossRef]
- Alipour, M.; Eslami-Farsani, R. Synthesis and characterization of graphene nanoplatelets reinforced AA7068 matrix nanocomposites produced by liquid metallurgy route. Mater. Sci. Eng. A 2017, 706, 71–82. [Google Scholar] [CrossRef]
- Chak, V.; Chattopadhyay, H.; Dora, T.L. Application of solid processing routes for the synthesis of graphene-aluminum composites—A review. Mater. Manuf. Process. 2021, 36, 1219–1235. [Google Scholar] [CrossRef]
- Turan, M.E.; Aydin, F.; Sun, Y.; Zengin, H.; Akinay, Y. Wear resistance and tribological properties of GNPs and MWCNT reinforced AlSi18CuNiMg alloys produced by stir casting. Tribol. Int. 2021, 164, 107201. [Google Scholar] [CrossRef]
- Prakash, C.; Senthil, P.; Manikandan, N.; Palanisamy, D. Investigations on machinability characteristics of Cast Aluminum Alloy based (LM 26+Graphite+Fly ash) Hybrid Metal Matrix Composites for automobile components. Mater. Manuf. Process. 2022, 137, 748–763. [Google Scholar] [CrossRef]
- Madhusudhan, M.; Naveen, G.; Mahesha, K. Mechanical Characterization of AA7068-ZrO 2 reinforced Metal Matrix Composites. Mater. Today Proc. 2017, 4, 3122–3130. [Google Scholar] [CrossRef]
- Etemadi, R.; Wang, B.; Pillai, K.M.; Niroumand, B.; Omrani, E.; Rohatgi, P. Pressure infiltration processes to synthesize metal matrix composites—A review of metal matrix composites, the technology and process simulation. Mater. Manuf. Process. 2018, 33, 1261–1290. [Google Scholar] [CrossRef]
- Kumar, N.; Gautam, G.; Gautam, R.K.; Mohan, A.; Mohan, S. A Study on Mechanical Properties and Strengthening Mechanisms of AA5052/ZrB2 In Situ Composites. J. Eng. Mater. Technol. 2016, 139, 011002. [Google Scholar] [CrossRef]
- Basumallick, A.; Ghosh, S. Processing of In Situ Aluminium Matrix Composites by Micropyretic Reactive Sintering. Mater. Manuf. Process. 2007, 22, 692–695. [Google Scholar] [CrossRef]
- Bajakke, P.; Malik, V.; Deshpande, A.S. Particulate metal matrix composites and their fabrication via friction stir processing—A review. Mater. Manuf. Process. 2019, 34, 833–881. [Google Scholar] [CrossRef]
- Winnicki, M.; Malachowska, A.; Piwowarczyk, T.; Rutkowska-Gorczyca, M.; Ambroziak, A. The bond strength of Al+Al2O3 cermet coatings deposited by low-pressure cold spraying. Arch. Civ. Mech. Eng. 2016, 16, 743–752. [Google Scholar] [CrossRef]
- Ghassemieh, E. Materials in Automotive Application, State of the Art and Prospects. New Trends Dev. Automot. Ind. 2011, 20, 365–394. [Google Scholar] [CrossRef] [Green Version]
- Srivastava, N.; Chaudhari, G. Microstructural evolution and mechanical behavior of ultrasonically synthesized Al6061-nano alumina composites. Mater. Sci. Eng. A 2018, 724, 199–207. [Google Scholar] [CrossRef]
- Chak, V.; Chattopadhyay, H. Fabrication and heat treatment of graphene nanoplatelets reinforced aluminium nanocomposites. Mater. Sci. Eng. A 2020, 791, 139657. [Google Scholar] [CrossRef]
- Tavoosi, M.; Karimzadeh, F.; Enayati, M.; Heidarpour, A. Bulk Al–Zn/Al2O3 nanocomposite prepared by reactive milling and hot pressing methods. J. Alloys Compd. 2009, 475, 198–201. [Google Scholar] [CrossRef]
- Yuan, D.; Yang, X.; Wu, S.; Lü, S.; Hu, K. Development of high strength and toughness nano-SiCp/A356 composites with ultrasonic vibration and squeeze casting. J. Mater. Process. Technol. 2019, 269, 1–9. [Google Scholar] [CrossRef]
- Yigezu, B.S.; Jha, P.K.; Mahapatra, M.M. The Key Attributes of Synthesizing Ceramic Particulate Reinforced Al-Based Matrix Composites through Stir Casting Process: A Review. Mater. Manuf. Process. 2013, 28, 969–979. [Google Scholar] [CrossRef]
- Lan, J.; Yang, Y.; Li, X. Microstructure and microhardness of SiC nanoparticles reinforced magnesium composites fabricated by ultrasonic method. Mater. Sci. Eng. A 2004, 386, 284–290. [Google Scholar] [CrossRef]
- Hu, K.; Yuan, D.; Lü, S.-L.; Wu, S.-S. Effects of nano-SiCp content on microstructure and mechanical properties of SiCp/A356 composites assisted with ultrasonic treatment. Trans. Nonferrous Met. Soc. China 2018, 28, 2173–2180. [Google Scholar] [CrossRef]
- Yang, X.; Wu, S.; Lü, S.; Hao, L.; Fang, X. Refinement of LPSO structure in Mg-Ni-Y alloys by ultrasonic treatment. Ultrason. Sonochemistry 2018, 40, 472–479. [Google Scholar] [CrossRef]
- Yang, Y.; Lan, J.; Li, X. Study on bulk aluminum matrix nano-composite fabricated by ultrasonic dispersion of nano-sized SiC particles in molten aluminum alloy. Mater. Sci. Eng. A 2004, 380, 378–383. [Google Scholar] [CrossRef]
- Mohanavel, V.; Ali, K.A.; Prasath, S.; Sathish, T.; Ravichandran, M. Microstructural and tribological characteristics of AA6351/Si3N4 composites manufactured by stir casting. J. Mater. Res. Technol. 2020, 9, 14662–14672. [Google Scholar] [CrossRef]
- Sharma, N.; Khanna, R.; Singh, G.; Kumar, V. Fabrication of 6061 aluminum alloy reinforced with Si3N4/n-Gr and its wear performance optimization using integrated RSM-GA. Part. Sci. Technol. 2016, 35, 731–741. [Google Scholar] [CrossRef]
- Ambigai, R.; Prabhu, S. Optimization of friction and wear behaviour of Al–Si 3 N 4 nano composite and Al–Gr–Si3N4 hybrid composite under dry sliding conditions. Trans. Nonferrous Met. Soc. China 2017, 27, 986–997. [Google Scholar] [CrossRef]
- Bhuvanesh, D.; Radhika, N. Experimental investigation on tribological characteristics of silicon nitride reinforced Aluminium metal matrix composites. J. Eng. Sci. Technol. 2017, 12, 1295–1306. [Google Scholar]
- Sathish, T.; Karthick, S. Wear behaviour analysis on aluminium alloy 7050 with reinforced SiC through taguchi approach. J. Mater. Res. Technol. 2020, 9, 3481–3487. [Google Scholar] [CrossRef]
- Kumar, G.; Panigrahy, P.P.; Nithika, S.; Pramod, R.; Rao, C. Assessment of mechanical and tribological characteristics of Silicon Nitride reinforced aluminum metal matrix composites. Compos. Part B Eng. 2019, 175, 107138. [Google Scholar] [CrossRef]
- Veličković, S.; Stojanović, B.; Babić, M.; Bobic, I. Optimization of tribological properties of aluminum hybrid composites using Taguchi design. J. Compos. Mater. 2016, 51, 2505–2515. [Google Scholar] [CrossRef]
- Parveen, A.; Chauhan, N.R.; Suhaib, M. Study of Si3N4 reinforcement on the morphological and tribo-mechanical behaviour of aluminium matrix composites. Mater. Res. Express 2018, 6, 042001. [Google Scholar] [CrossRef]
- Miloradović, N.; Vujanac, R.; Stojanović, B.; Pavlović, A. Dry sliding wear behaviour of ZA27/SiC/Gr hybrid composites with Taguchi optimization. Compos. Struct. 2021, 264, 113658. [Google Scholar] [CrossRef]


| Material | Composition (%) |
|---|---|
| Zn | 7.9 |
| Mg | 3.1 |
| Cu | 2 |
| Fe | 0.15 |
| Si | 0.12 |
| Al | balance |
| Parameters | Approximate Range |
|---|---|
| Size | 28.59 nm to 80.13 nm (avg. dia. 4.36 nm) |
| Molecular weight | 140.2833 g/mol |
| Density | 3520 Kg/m3 |
| Melting point | 1900 °C |
| Color | Off-white |
| Purity | 99.9% |
| Factors | L-1 | L-2 | L-3 | L-4 | L-5 |
|---|---|---|---|---|---|
| Reinforcement Wt.% | 0 | 0.5 | 1 | 1.5 | 2 |
| Load (N) | 10 | 20 | 30 | 40 | 50 |
| Sliding distance (m) | 200 | 400 | 600 | 800 | 1000 |
| Wear Loss (mg) | |||||||
|---|---|---|---|---|---|---|---|
| Exp. No. | Reinforcement wt.% | Normal Load (N) | Sliding Distance (m) | Experimental | Predicted | % Error | SNR |
| 1 | 0.0 | 10 | 200 | 5.50 | 5.14 | 6.50 | −14.8073 |
| 2 | 0.0 | 20 | 400 | 6.89 | 6.42 | 6.83 | −16.7644 |
| 3 | 0.0 | 30 | 600 | 8.20 | 7.84 | 4.42 | −18.2763 |
| 4 | 0.0 | 40 | 800 | 9.60 | 9.40 | 2.12 | −19.6454 |
| 5 | 0.0 | 50 | 1000 | 11.10 | 11.10 | 0.02 | −20.9065 |
| 6 | 0.5 | 10 | 400 | 4.40 | 4.41 | −0.19 | −12.8691 |
| 7 | 0.5 | 20 | 600 | 5.60 | 5.60 | 0.07 | −14.9638 |
| 8 | 0.5 | 30 | 800 | 7.30 | 6.92 | 5.14 | −17.2665 |
| 9 | 0.5 | 40 | 1000 | 8.30 | 8.39 | −1.14 | −18.3816 |
| 10 | 0.5 | 50 | 200 | 9.20 | 9.80 | −6.57 | −19.2758 |
| 11 | 1.0 | 10 | 600 | 3.30 | 3.73 | −13.06 | −10.3703 |
| 12 | 1.0 | 20 | 800 | 4.50 | 4.83 | −7.31 | −13.0643 |
| 13 | 1.0 | 30 | 1000 | 5.90 | 6.07 | −2.85 | −15.4170 |
| 14 | 1.0 | 40 | 200 | 7.20 | 7.28 | −1.05 | −17.1466 |
| 15 | 1.0 | 50 | 400 | 8.90 | 8.78 | 1.34 | −18.9878 |
| 16 | 1.5 | 10 | 800 | 2.82 | 3.11 | −15.19 | −8.6273 |
| 17 | 1.5 | 20 | 1000 | 3.80 | 4.12 | −8.39 | −11.5957 |
| 18 | 1.5 | 30 | 200 | 4.70 | 5.12 | −8.99 | −13.4420 |
| 19 | 1.5 | 40 | 400 | 5.80 | 6.40 | −10.29 | −15.2686 |
| 20 | 1.5 | 50 | 600 | 7.40 | 7.81 | −5.58 | −17.3846 |
| 21 | 2.0 | 10 | 1000 | 2.90 | 2.55 | 12.22 | −9.2480 |
| 22 | 2.0 | 20 | 200 | 3.80 | 3.35 | 11.93 | −11.5957 |
| 23 | 2.0 | 30 | 400 | 4.40 | 4.39 | 0.22 | −12.8691 |
| 24 | 2.0 | 40 | 600 | 6.30 | 5.58 | 11.50 | −15.9868 |
| 25 | 2.0 | 50 | 800 | 7.50 | 6.90 | 7.98 | −17.5012 |
| AA7068/0.5 wt.% Si3N4 Location (1) | AA7068/1.0 wt.% Si3N4 Location (2) | AA7068/1.5 wt.% Si3N4 Location (3) | AA7068/2.0 wt.% Si3N4 Location (4) | |||||
|---|---|---|---|---|---|---|---|---|
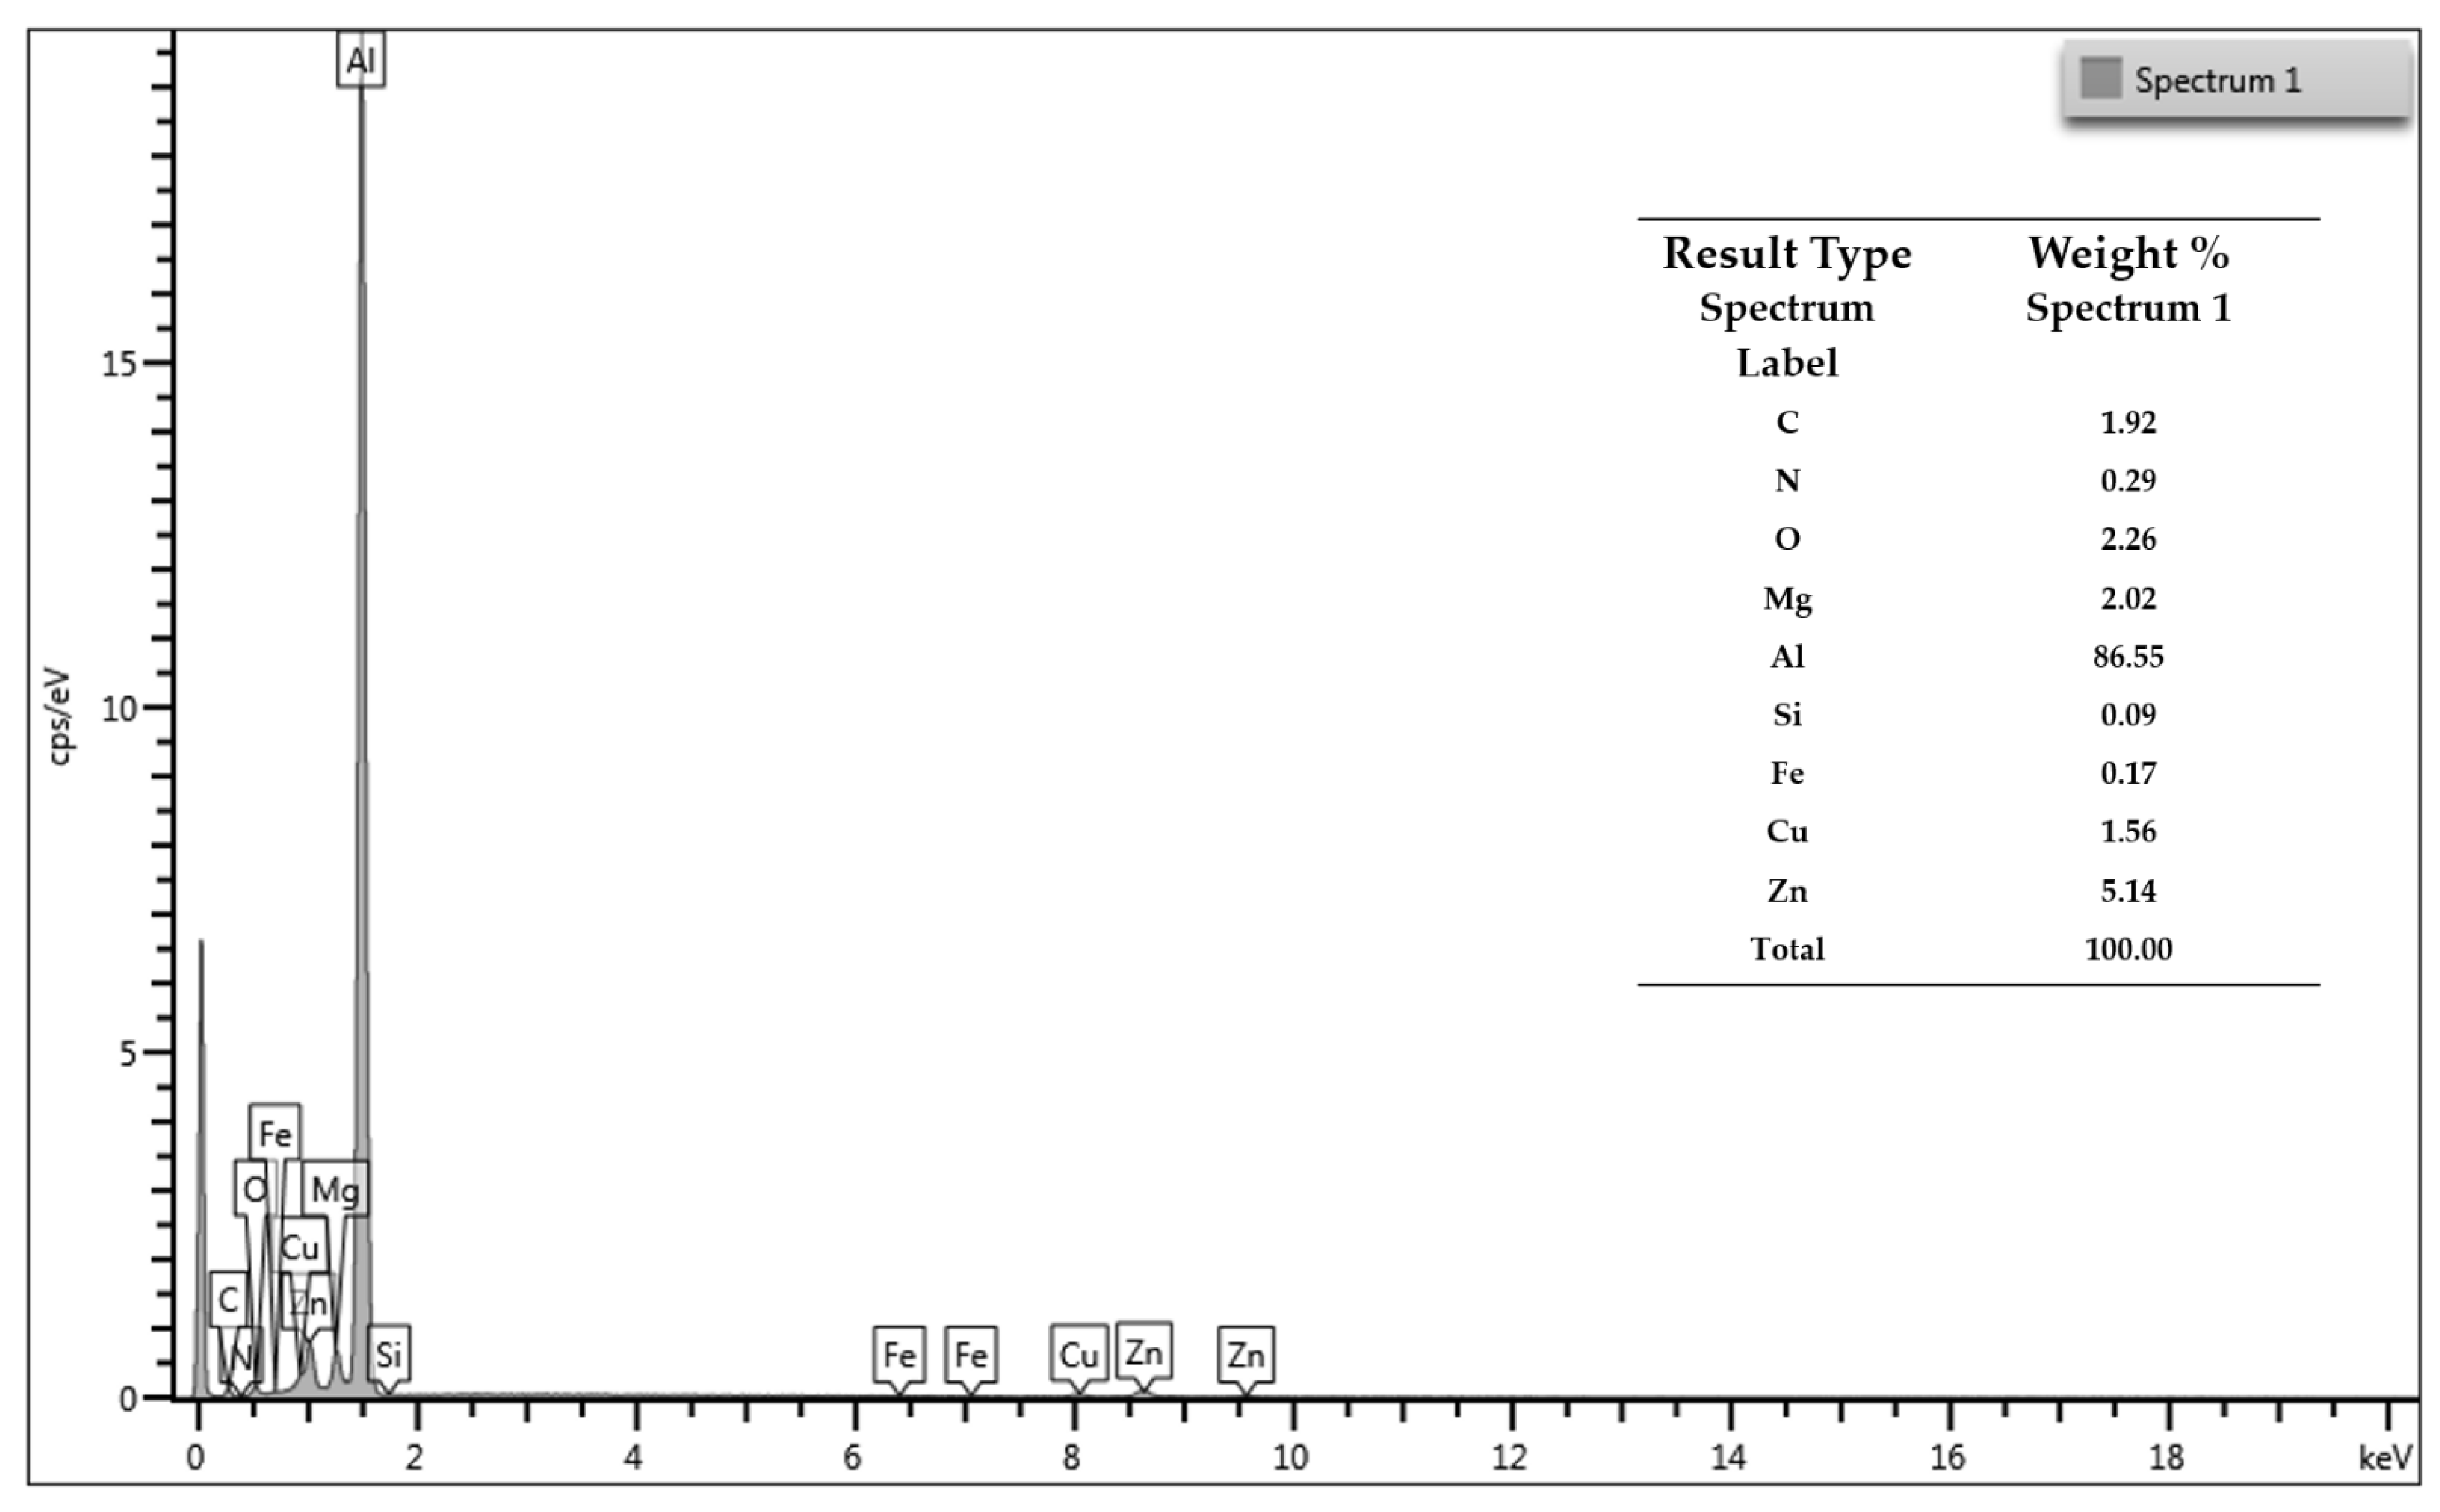
| Elements | Weight % | Atomic % | Weight % | Atomic % | Weight % | Atomic % | Weight % | Atomic % |
| N K | 0.61 | 1.24 | 1.15 | 2.29 | 1.74 | 3.51 | 2.37 | 4.81 |
| Mg K | 4.22 | 4.92 | 3.00 | 3.46 | 2.78 | 3.22 | 2.80 | 3.28 |
| Al K | 84.98 | 89.21 | 86.89 | 90.18 | 84.32 | 88.22 | 81.86 | 86.31 |
| Si K | 0.03 | 0.03 | 0.07 | 0.07 | 0.16 | 0.16 | 0.18 | 0.18 |
| Fe K | 1.52 | 0.77 | 1.41 | 0.71 | 2.10 | 1.06 | 1.80 | 0.91 |
| Cu K | 1.97 | 0.88 | 2.13 | 0.94 | 3.60 | 1.60 | 4.45 | 1.99 |
| Zn K | 6.67 | 2.89 | 5.35 | 2.29 | 5.29 | 2.28 | 6.84 | 2.97 |
| Total = 100% | Total = 100% | Total = 100% | Total = 100% | |||||
| Level | Reinforcement wt.% | Normal Load (N) | Sliding Distance (m) |
|---|---|---|---|
| 1 | 8.258 | 3.760 | 6.080 |
| 2 | 6.960 | 4.918 | 6.078 |
| 3 | 5.960 | 6.100 | 6.160 |
| 4 | 4.880 | 7.440 | 6.320 |
| 5 | 4.980 | 8.820 | 6.400 |
| Delta | 3.378 | 5.060 | 0.322 |
| Rank | 2 | 1 | 3 |
| Source | DF | Seq. SS | Contribution | Ad. SS | Ad. MS | F | P |
|---|---|---|---|---|---|---|---|
| Reinforcement wt.% | 4 | 40.505 | 33.23% | 40.5054 | 10.1263 | 133.52 | 0.000 |
| Normal load (N) | 4 | 80.044 | 65.67% | 80.0442 | 20.0110 | 263.84 | 0.000 |
| Sliding distance (m) | 4 | 0.425 | 0.35% | 0.4250 | 0.1062 | 1.40 | 0.292 |
| Error | 12 | 0.910 | 0.75% | 0.9101 | 0.0758 | ||
| Total | 24 | 121.885 | 100.00% |
| S | R-sq | R-sq (adj) | PRESS | R-sq (pred) |
|---|---|---|---|---|
| 0.275398 | 99.25% | 98.51% | 3.95021 | 96.76% |
| Wear Loss (mg) | ||||||
|---|---|---|---|---|---|---|
| Control Variables | Optimized Value | Test No. | Experimental | Predicted | Error (%) | SNR |
| Reinforcement wt.% | 1.5 | 1 | 2.45 | −25.10 | ||
| Load (N) | 10 | 2 | 2.21 | 3.065 | −38.68 | −8.530 |
| Sliding distance (m) | 400 | 3 | 3.11 | 1.44 | ||
| 4 | 2.73 | −12.27 | ||||
| 5 | 2.86 | −7.16 | ||||
| Average | 2.67 | 3.065 | −14.79 | −8.530 | ||
Publisher’s Note: MDPI stays neutral with regard to jurisdictional claims in published maps and institutional affiliations. |
© 2022 by the authors. Licensee MDPI, Basel, Switzerland. This article is an open access article distributed under the terms and conditions of the Creative Commons Attribution (CC BY) license (https://creativecommons.org/licenses/by/4.0/).
Share and Cite
Kumar, A.; Rana, R.S.; Purohit, R.; Saxena, K.K.; Xu, J.; Malik, V. Metallographic Study and Sliding Wear Optimization of Nano Si3N4 Reinforced High-Strength Al Metal Matrix Composites. Lubricants 2022, 10, 202. https://doi.org/10.3390/lubricants10090202
Kumar A, Rana RS, Purohit R, Saxena KK, Xu J, Malik V. Metallographic Study and Sliding Wear Optimization of Nano Si3N4 Reinforced High-Strength Al Metal Matrix Composites. Lubricants. 2022; 10(9):202. https://doi.org/10.3390/lubricants10090202
Chicago/Turabian StyleKumar, Ashish, Ravindra Singh Rana, Rajesh Purohit, Kuldeep K. Saxena, Jinyang Xu, and Vinayak Malik. 2022. "Metallographic Study and Sliding Wear Optimization of Nano Si3N4 Reinforced High-Strength Al Metal Matrix Composites" Lubricants 10, no. 9: 202. https://doi.org/10.3390/lubricants10090202
APA StyleKumar, A., Rana, R. S., Purohit, R., Saxena, K. K., Xu, J., & Malik, V. (2022). Metallographic Study and Sliding Wear Optimization of Nano Si3N4 Reinforced High-Strength Al Metal Matrix Composites. Lubricants, 10(9), 202. https://doi.org/10.3390/lubricants10090202