Article

Experimental Analysis of Frictional Performance of EN AW-2024-T3 Alclad Aluminium Alloy Sheet Metals in Sheet Metal Forming

by
Tomasz Trzepieciński
Department of Manufacturing Processes and Production Engineering, Rzeszow University of Technology, al. Powst. Warszawy 8, 35-959 Rzeszów, Poland
Lubricants 2023, 11(1), 28; https://doi.org/10.3390/lubricants11010028
Submission received: 16 December 2022 / Revised: 8 January 2023 / Accepted: 9 January 2023 / Published: 10 January 2023

Abstract

:
Friction occurring in the area of contact between the sheet metal and the tool in sheet metal forming is one of the factors determining the quality of the surface of the drawpiece and the formability of the workpiece. Knowledge of the friction conditions allows the optimal forming conditions to be determined in terms of lubrication and applied pressures. The article presents the results of experimental studies of friction in EN AW-2024-T3 Alclad sheets using a special device simulating the sheet–tool contact in the blank-holder area during SMF. The friction tests were carried out at various pressures, under dry friction, and with the use of typical oils with a wide range of viscosity. The effect of the friction process parameters on the COF and surface roughness parameters Rsk and Rku was analysed using analysis of variance. The model F-values imply that the regression models for all the output parameters were significant. A monotonic decrease in the COF with an increase in the mean contact pressure and lubricant viscosity was observed for both dry and lubricated conditions. DELVAC 1340 engine oil with the highest viscosity significantly lowered the COF. The lubrication efficiency with LAN46 machine oil and LVH22 hydraulic oil showed an upward trend with an increasing mean contact pressure. In general, friction reduces the value of average roughness, Ra, and skewness, Rsk. Meanwhile, friction under contact pressures in the analysed range (4.4–11.7 MPa) causes an increase in kurtosis, Rku.

1. Introduction

External friction is a phenomenon that generally resists the movement of one solid over the surface of another solid. In sheet metal-forming (SMF) processes, the workpiece is deformed in a stamping tool by means of stamp movement, or alternatively of a die. High pressures acting on the sheet material, which has a much lower yield stress than the tool material, cause a change in the initial topography of the sheet surface [1]. In the case of stamping components with complex geometry, the local state of stresses and strains changes during the forming process [2]. In most conventional SMF and incremental sheet forming (ISF) [3], the occurrence of friction is an undesirable phenomenon and causes increases in the forming force [4,5], uneven deformation in various zones of the drawpiece [1], reduction of the tool life [6], and lowering of the quality of the product surface [7,8]. The coefficient of friction (COF) is the quantitative factor for evaluating friction.
Due to the occurrence of different zones in the drawpiece which differ in the deformation rate and pressure, there are limitations in the determination of the COF value by commonly used methods. Over the years, a number of tribological tests have been worked out that are assigned to the simulation of friction conditions in selected regions of the drawpiece [9]. The strip drawing test is assigned to modelling the friction conditions under the blank-holder [10]. The bending under tension test simulates the friction conditions on the rounded edges of the die and the punch [11]. On the other hand, using the drawbead test, it is possible to determine the resistance of sheet metal displacement through the drawbead in the stamping die [12,13]. The abovementioned tests can be performed under various temperature conditions.
One of the effective and most economical ways to reduce friction in SMF is lubrication. The most important properties of a lubricant from the point of view of its use in SMF processes are its viscosity and the resistance of the lubricating film to breaking up under the influence of high pressures [14]. The lubricant should meet a number of the requirements, including being easy to apply to the processed metal and the tool, having a high resistance to normal loads, and being easily removed from the surface of the product [15]. The purpose of using the lubricant is to reduce the energy losses necessary to overcome friction [16]. In cold plastic working processes, where the material is subject to high deformation, high speeds, and intense heat generation, the lubricant also has the task of cooling the tools. For the lubricant to effectively insulate the rubbing surfaces, it should have good viscosity and activity, which is the ability to create a protective layer on the friction surface [17]. Due to the appropriate viscosity, the grease does not leak from the contact point. Highly active and viscous lubricants provide conditions for mixed or fluid friction conditions [18,19]. During the deformation process, the lubricant reduces the unit pressure and improves the quality of the product surface [20,21,22].
Aluminium sheets exhibit the tendency to adhesive wear manifested by scuffing of the tool surfaces [23]. Galling is another strong mechanism of adhesive wear often observed in SMF that develops gradually as the workpiece adheres to the tool surface. This can change the surface topography of the drawpiece, tool geometry, increase the friction force, and consequently damage the product [24]. Up to 71% of the maintenance costs of the dies result from tackling the problem of preventing the scuffing phenomenon [25]. The adhesion of aluminium on tool surfaces shortens the tool life and reduces product quality [26,27]. Various experimental tests indicate that in the case of forming sheets of aluminium alloy, adhesive wear is also of great importance, consisting in local adhesion of the surface asperities in the micro-areas of plastic deformation of the surface layer [28,29]. Friction tests conducted by Trzepieciński and Lemu [13] on EN AW-5251 aluminium alloy sheets in the temper O, H14, H16, and H22 have shown that surface textures either act as micro-traps for capturing wear debris or as micro-reservoirs that enhance lubrication. Xia et al. [30] tested EN AW-6061-T6 aluminium alloy sheets in the strip drawing test. The results show that the COF decreases with load and sliding speed. They validated variable COF models based on the normal load and sliding speed. Dou and Xia [31] performed pin-on-disk tests on EN AW-5052 aluminium alloy specimens to obtain the mechanism of influence of various factors on the COF. They found that the COF decreases with an increase in the normal load. The effects of contact pressure, sliding speed, and initial lubricant volume on the evolution of the COF and the lubricant breakdown phenomenon were experimentally studied by Yang et al. [32]. The test material selected was EN AW-7075 aluminium alloy. A decrease in the initial lubricant volume and increases in contact pressure and sliding speed accelerated the transition from the low-friction stage to the final breakdown stage, resulting in a shorter lubricant breakdown distance. Bellini et al. [33] analysed the evolution of the punch stroke versus COF when forming aluminium-magnesium-silicon 6060 alloy sheets. The experimental results highlight the dependence of the distance between the specimen centre and the necking point on the COF value assumed in numerical finite element-based simulations. Zavala et al. [34] investigated friction and wear effects in EN AW-1100 aluminium alloy components manufactured by single-point incremental forming. They concluded that friction between the sheet metal and tool surface plays an important role in material deformation. Najm et al. [35] tested various friction conditions in single-point incrementally formed EN AW-1100 aluminium alloy sheets. It was found that the use of grease instead of coolant oil generates homogeneous hardness values at different points of the same formed sheet. Recent developments in SMF of aluminium and aluminium alloy sheets, including in the context of friction conditions and surface roughness, have been discussed by Trzepieciński et al. [36] and Sigvant et al. [37], as well as Shih and Wilson [38].
In the aforementioned research activities, there were no investigations found on the frictional properties of EN AW-2024-T3 Alclad sheets processed in sheet metal forming. The influence of lubrication conditions and normal load on the COF of aluminium-magnesium-silicon family alloys in SMF processes is still unclear. In this article, the EN AW-2024-T3 Alclad sheets were tested using a specially designed tribological simulator. Strip specimens were tested under various contact pressures and friction conditions. Analysis of the effect of the friction conditions on the value of the coefficient of friction, effectiveness of lubrication, and change in the surface roughness of the metal sheets were also considered using analysis of variance.

2. Materials and Methods

2.1. Material

The test material was composed of 0.4 mm-thick EN AW-2024-T3 Alclad aluminium alloy sheets in the T3 temper condition. EN AW-2024-T3 material is one of the strongest 2xxx series alloys, the main alloying elements of which are copper and magnesium. The corrosion resistance of 2xxx series alloys is not as good as that of most other aluminium alloys, and therefore these sheet alloys are usually coated with high-purity alloys, typically Alclad. EN AW-2024-T3 aluminium alloy is widely used in the aerospace industry for fabrication of airplane skins.
The mechanical parameters of the sheets were determined in a uniaxial tensile test according to ISO 6892-1:2009 [39] on specimens cut along the rolling direction (0°) of the sheet metal. Three specimens were tested, and average values of mechanical parameters (Table 1) were determined. True stress–true strain curve determined based on the results of the average K and n values are shown in Figure 1. The basic surface roughness parameters and profile height (Figure 2) of the as-received surface of EN AW-2024T3 Alclad sheets were measured using a Hommel-Etamic T8000RC (Jenoptik, Jena, Germany) profilometer. The basic surface roughness parameters of the as-received sheet are as follows: Ra = 0.461 μm, Rq = 0.549 μm, Rp = 1.10 μm, Rv = 1.18 μm, Rz = 2.28 μm, Rc = 1.04 μm, Rt = 2.74 μm, Rq = 0.549 μm, Rsk = 0.103, and Rku = 2.06.

2.2. Friction Testing Procedure

The friction tests were carried out by the strip drawing test (SDT). The SDT is used to determine the value of the COF. A friction simulator was designed and manufactured (Figure 2) for this purpose, and this was mounted in the holders of a uniaxial tensile testing machine. The test consists in pulling the sheet strip between two counter-samples with a rounded working surface which has a radius of R = 0.2 m. The counter-samples were made of 145Cr6 cold work tool steel. The left counter-sample was permanently mounted in the device. The right counter-sample, on the other hand, was integrated with a handle that moved horizontally in the body of the friction tester.
The normal (compressive) force, FN, was exerted by a deflected spring, the deflection of which was applied with a set screw (Figure 3). A polytetrafluoroethylene insert was placed between the surface of the set screw and the spring to minimise friction. Based on the spring calibration curve determined using a MultiTest 10-i versatile tensile and compression tester, the relationship between the deflection and the spring force was obtained in the form of the equation: FN = 5.0117x − 1.3783 (where x is the deflection of the spring). The spring calibration was determined for a spring deflection range between 1.5 and 10.5 mm. This deflection range corresponds to a pressure force in the range between approximately 6.1 and 44.7 N. According to the formulae proposed by ter Haar [40] (Equation (1)) for determination of the mean contact pressure (MCP) in a strip drawing test with rounded counter-samples, the range of pressure changes analysed is equivalent to the MCP range between 4.4 and 11.7 MPa. These pressure values correspond to the pressures arising in the processes of sheet metal forming [41,42,43,44].
p = π 4 · F N w · 2 E 1 E 2 E 2 · 1 ν 1 2 + E 1 · 1 ν 2 2 2 π R
where w is the strip width (w = 18 mm), R is the radius of the counter-sample (R = 200 mm), E1 and E2 are the Young’s moduli of the counter-sample (E1 = 210,000 MPa) and specimen (E2 = 70,000 MPa), respectively, and ν1 and ν2 are Poisson’s ratios of the counter-sample (ν1 = 0.3) and specimen (ν2 = 0.33), respectively.
Strips that were the 18 mm-wide and 260 mm-long (Figure 4), cut along the rolling direction of the sheet metal, were placed between the counter-samples. After setting the appropriate normal force, FN, with the help of the set screw, the upper handle of the testing machine started to move at a speed of 2 mm/min. The value of the tangential force (tangential force), FT, was recorded using the Zwick/Roell Z100 testing machine. The value of the COF was determined using Equation (2):
C O F = F T 2 F N
The studies analysed six levels of the mean contact pressure. The friction tests were carried out for surface lubrication with the use of three types of oils: LAN46 machine oil, DELVAC 1340 engine oil, and LHL32 hydraulic oil. Furthermore, dry friction conditions were analysed. These oils are widely available in the market and are cheap, and therefore they are commonly used in sheet metal-forming operations. Another criterion for the selection of the oils was the analysis of the lubrication efficiency of oils with a wide range of viscosities ranging from 21.9 mm2/s (LAN46) to 146 mm2/s (DELVAC 1340). The basic physical properties of the oils used are listed in Table 2. Before the friction tests, the surfaces of the as-received sheet metal were degreased using acetone.
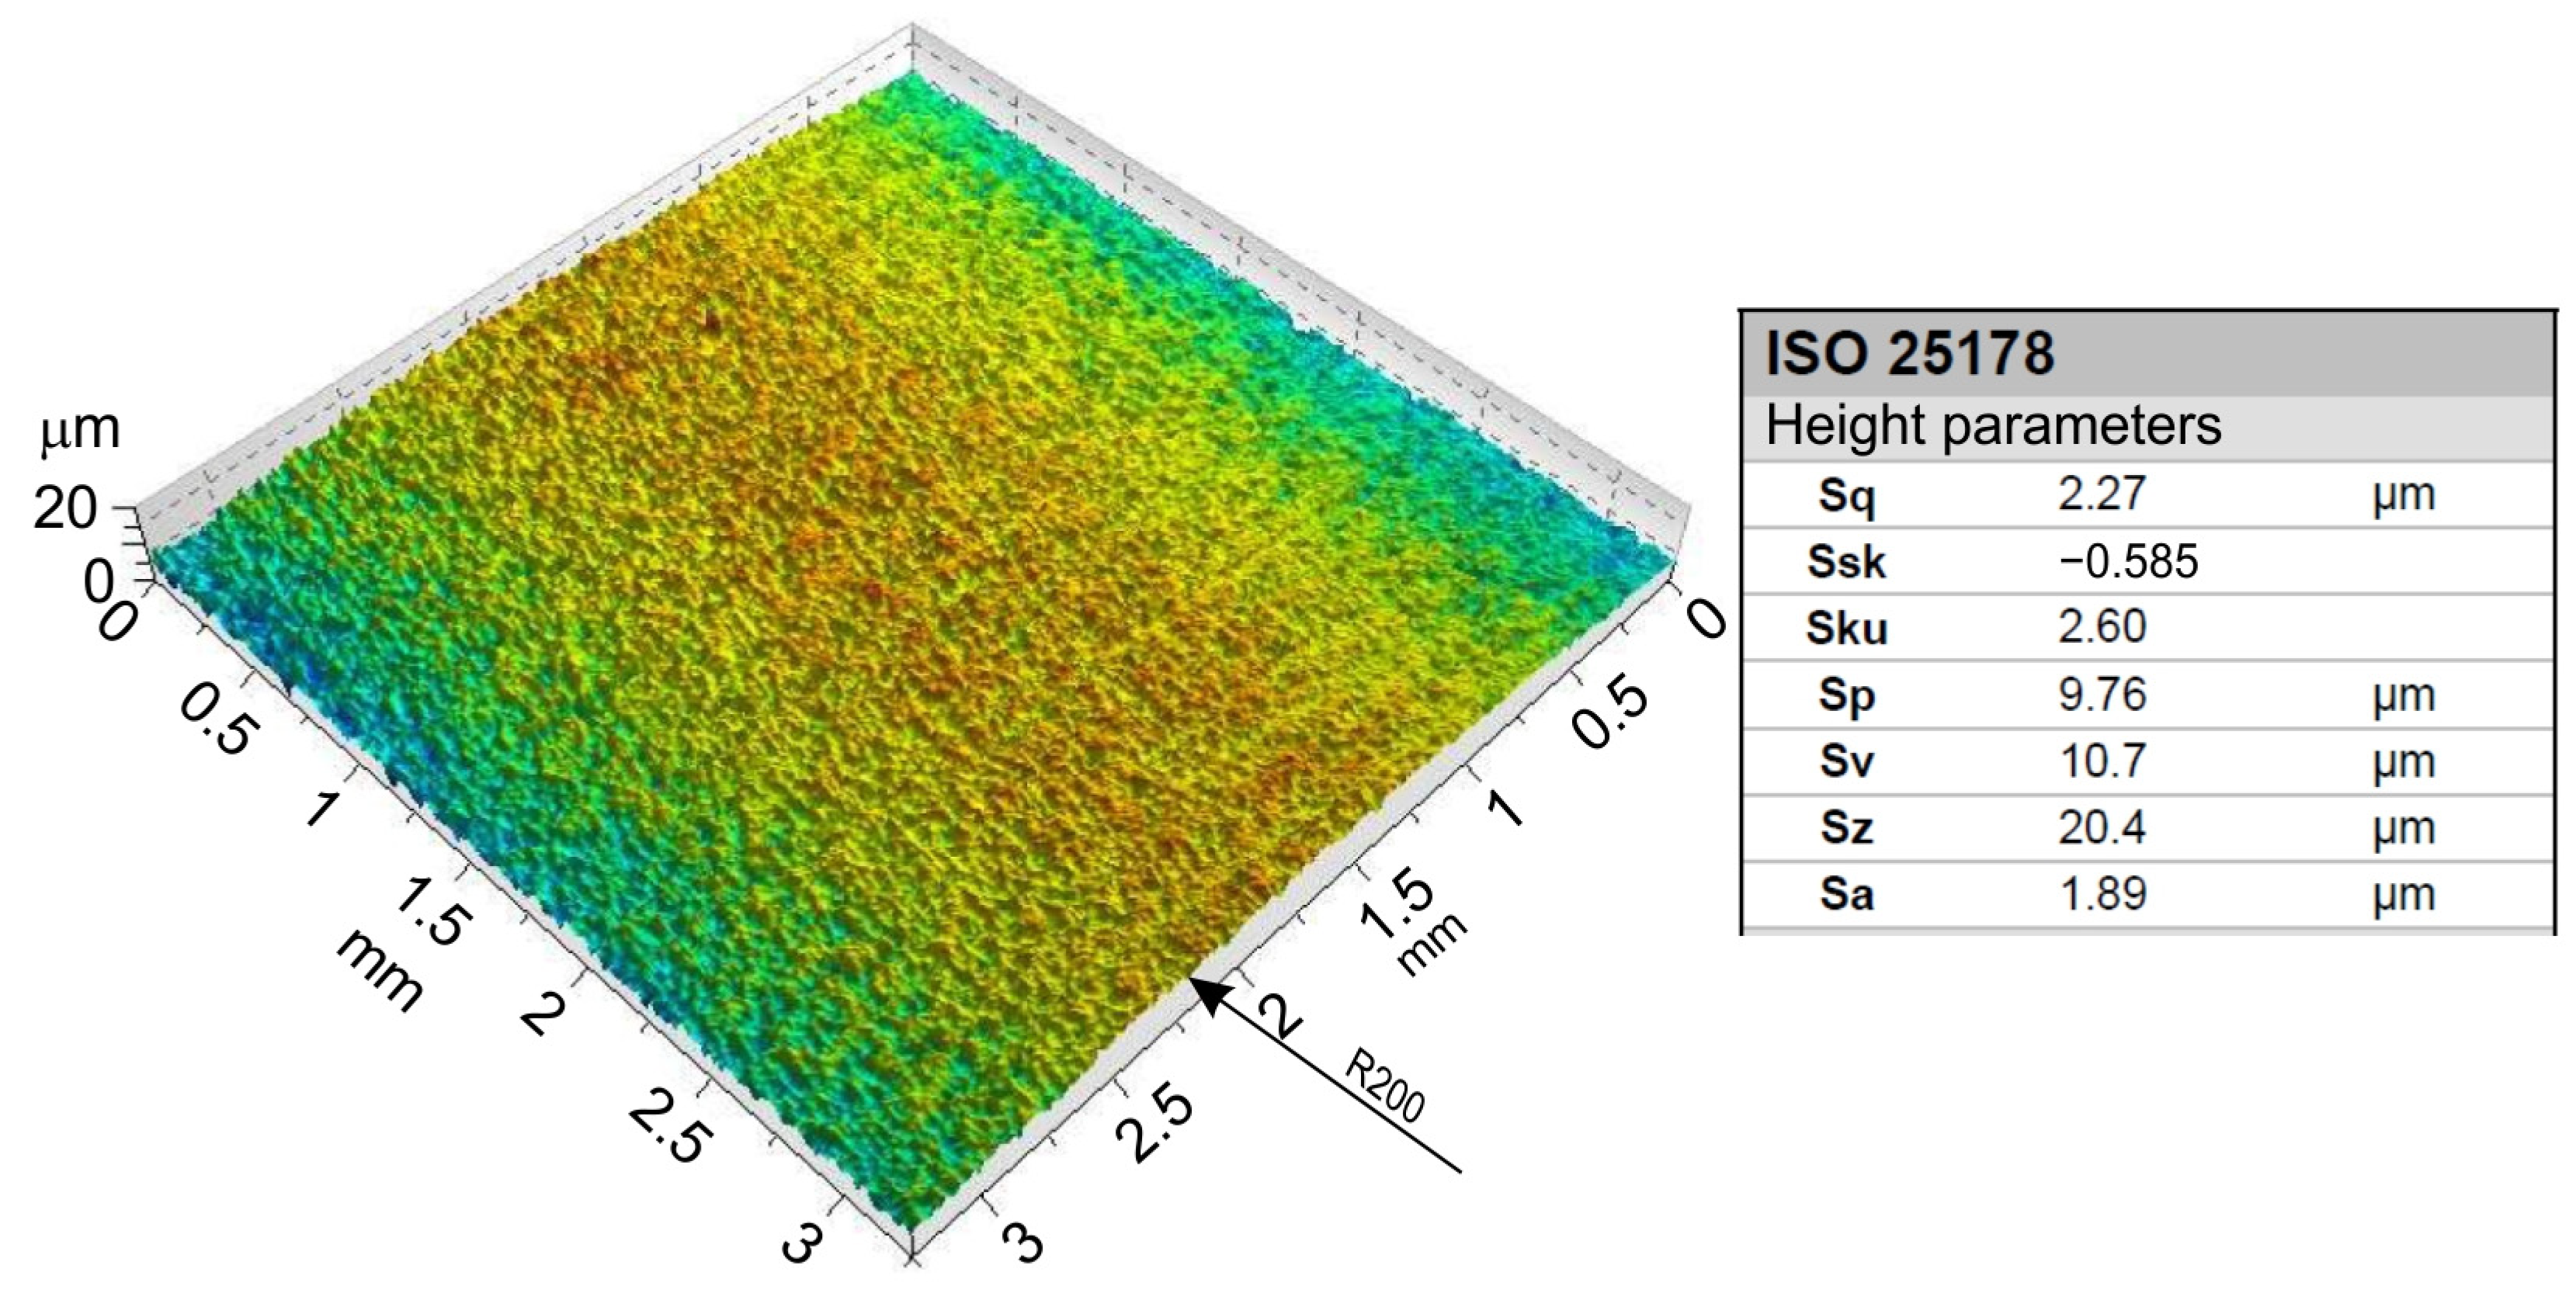
The surface topography and basic surface roughness parameters of the surface of the counter-samples are shown in Figure 5.

2.3. Analysis of Variance

In a multivariate schema, analysis of variance (ANOVA) checks if multiple input parameters affect the results of one dependent variable. This article used a polynomial quadratic regression model. The mean contact pressure and lubricant viscosity were selected as the independent variables. Viscosity is the basic physical quantity determining the physical properties of the lubricant [45].
By means of ANOVA, three models were constructed considering the following dependent variables: COF, kurtosis (Rku), and skewness (Rsk). For surface roughness, which has occasional deep valleys, a non-Gaussian distribution is a better choice [46]. For this reason, in the ANOVA shown in this paper, the focus is on the Rsk and Rku parameters, which Sedlaček et al. [47,48] found to be the most important roughness parameters in terms of tribological behaviour. Mean contact pressure directly influences the value of the COF [49,50].
The test of significance of the regression model was performed by calculating the F statistics at the significance level of α = 0.05.

3. Results and Discussion

3.1. Coefficient of Friction

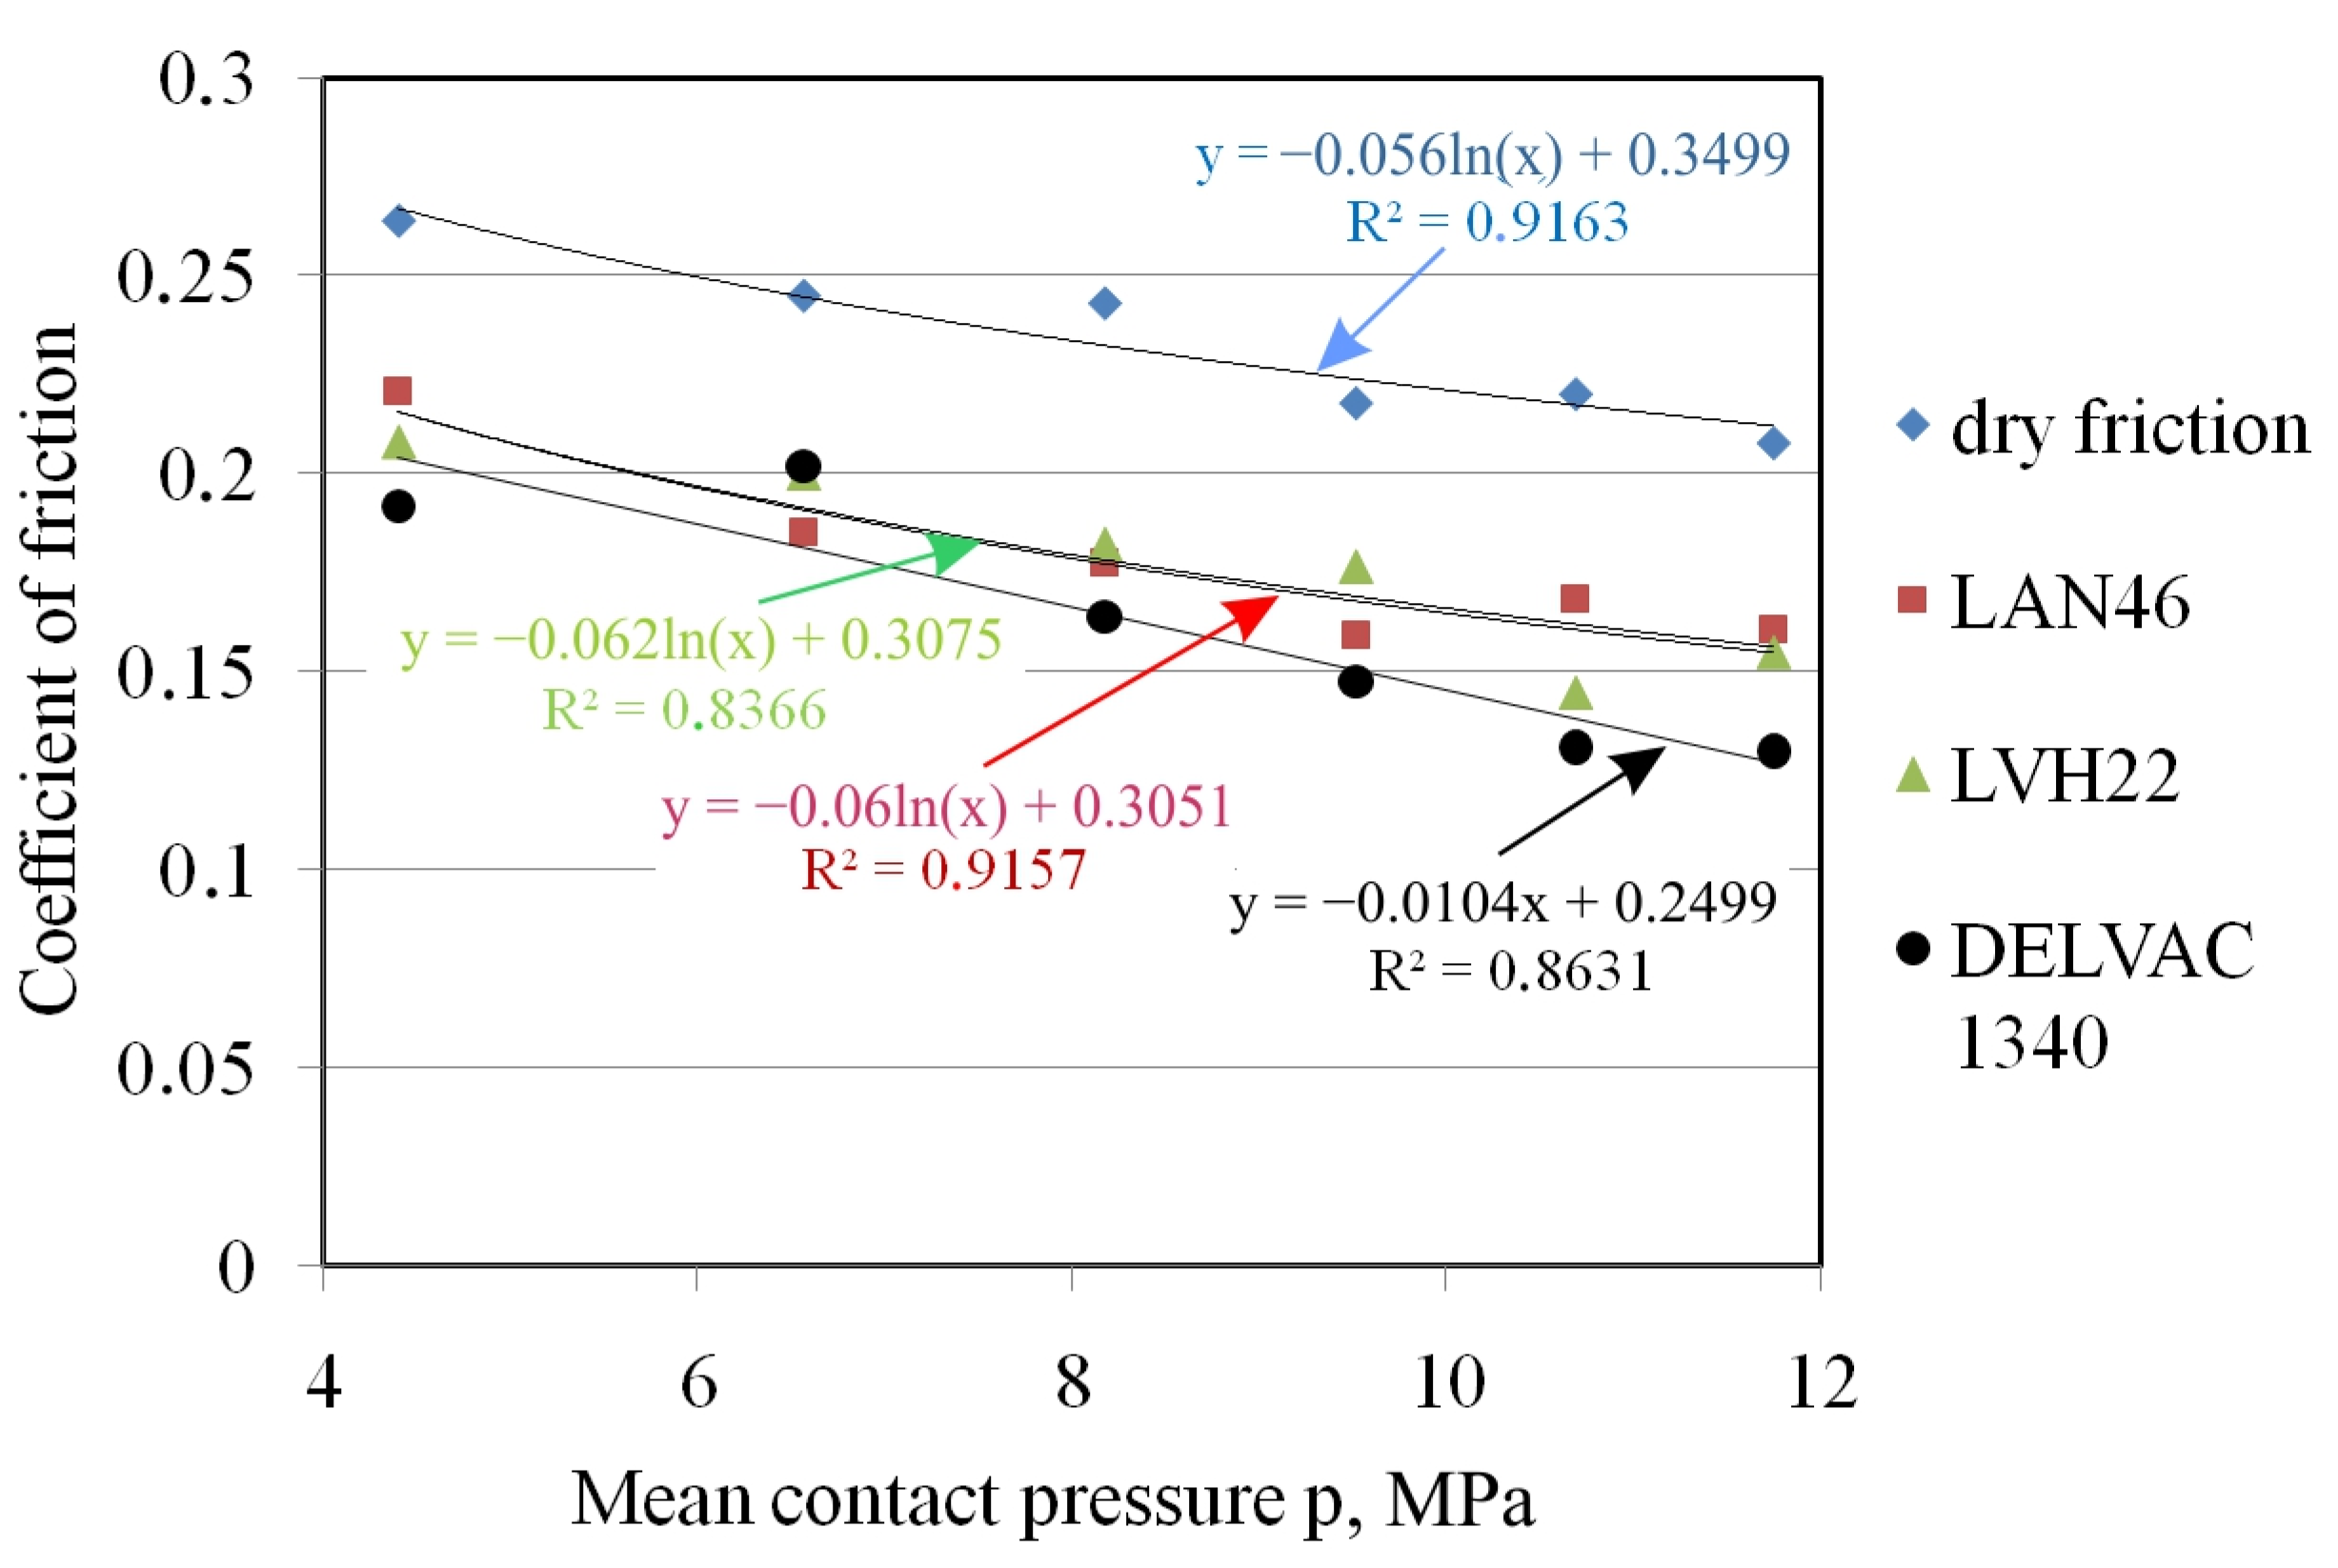
The value of the COF of sheet metal decreases with increasing mean contact pressure (Figure 6) [31]. This phenomenon is related to the non-linear relationship between the tangential force (friction) and the pressure force, which has also been confirmed by Dou et al. [31], Vollertsen et al. [42], and Kirkhorn et al. [43]. Under relatively small pressures, the contact status of friction pairs changes from relatively larger static friction to relatively smaller sliding friction. The surface asperities of the relatively softer material of sheet metal compared to the tool material plastically deform with the friction process. In the running-in stage, the frictional contact interface becomes less and less rough. Therefore, the mechanical overlapping of asperities is declining, and the COF decreases.
The rate of change of the COF with MCP was similar for all friction conditions analysed. DELVAC 1340 oil significantly lowered the COF over the entire range of contact pressures tested. This may be related to fact that this oil has the highest kinematic viscosity, which is more than three times greater than that of LAN46 oil and more than six times greater than that of LHV22 oil. The high viscosity of the lubricant at low sliding velocities does not significantly affect the internal friction appearing in the oil. On the other hand, the high value of the oil viscosity makes it difficult to break the lubricating film as a result of the impact of high pressures on the summits of the tool and sheet surface.
The F-value for the regression model of 23.15 (Table 3) implies that the ANOVA model for the coefficient of friction is significant. The significant model terms are lubricant viscosity (A), mean contact pressure (B), and the value of lubricant viscosity squared (A2). The significance of the terms was estimated based on p-values of less than 0.0500.
The R2-value for the ANOVA model created is about 0.86 (Table 4). The adequacy precision is greater than 4. Therefore, an adequacy precision of 16.817 indicates an adequate signal. The predicted R2 of 0.7434 is in reasonable agreement with the adjusted R2 of 0.8280 (Table 4).
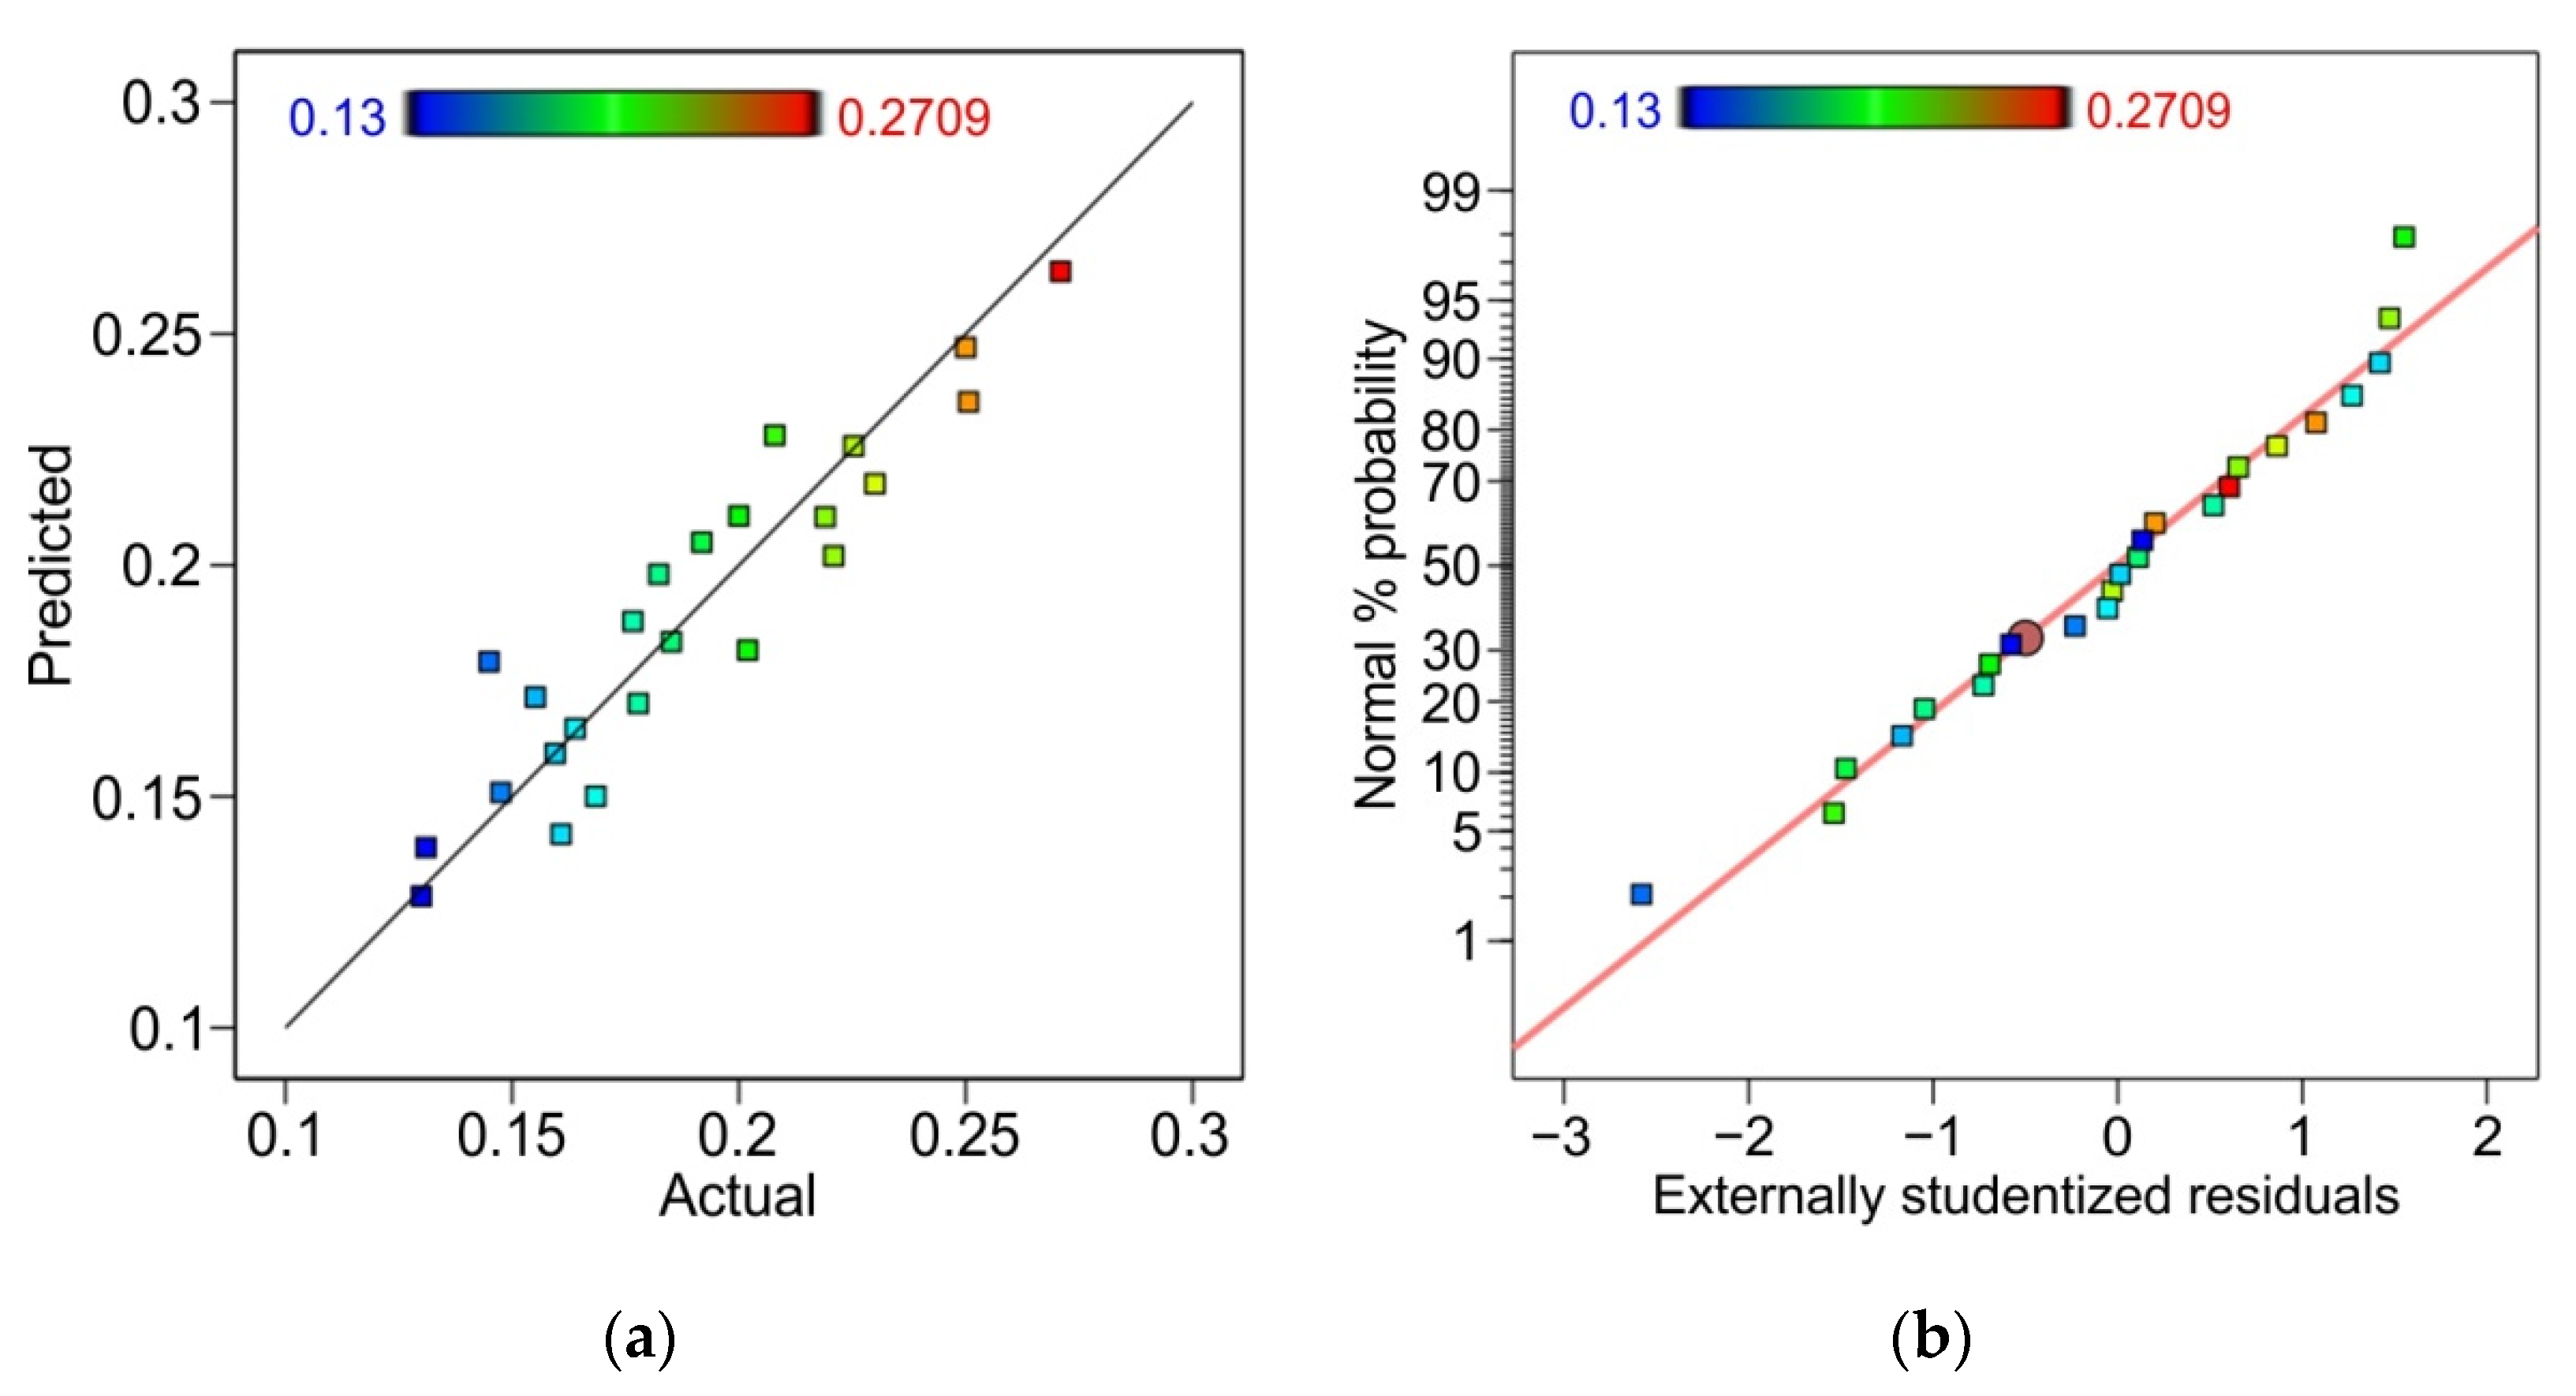
Figure 7a presents a plot for the coefficient of friction with predicted versus experimental values. Actual values are along a straight line inclined at 45° to the axis of the abscissa. The data are arranged proportionally along the line, which proves a good correlation between the experimental and predicted values of COF. The analysis is supplemented by the normal probability plot of externally studentised residuals also arranged along the straight line (Figure 7b). The normal probability plot indicated whether the residuals followed the normal probability distribution [51,52].
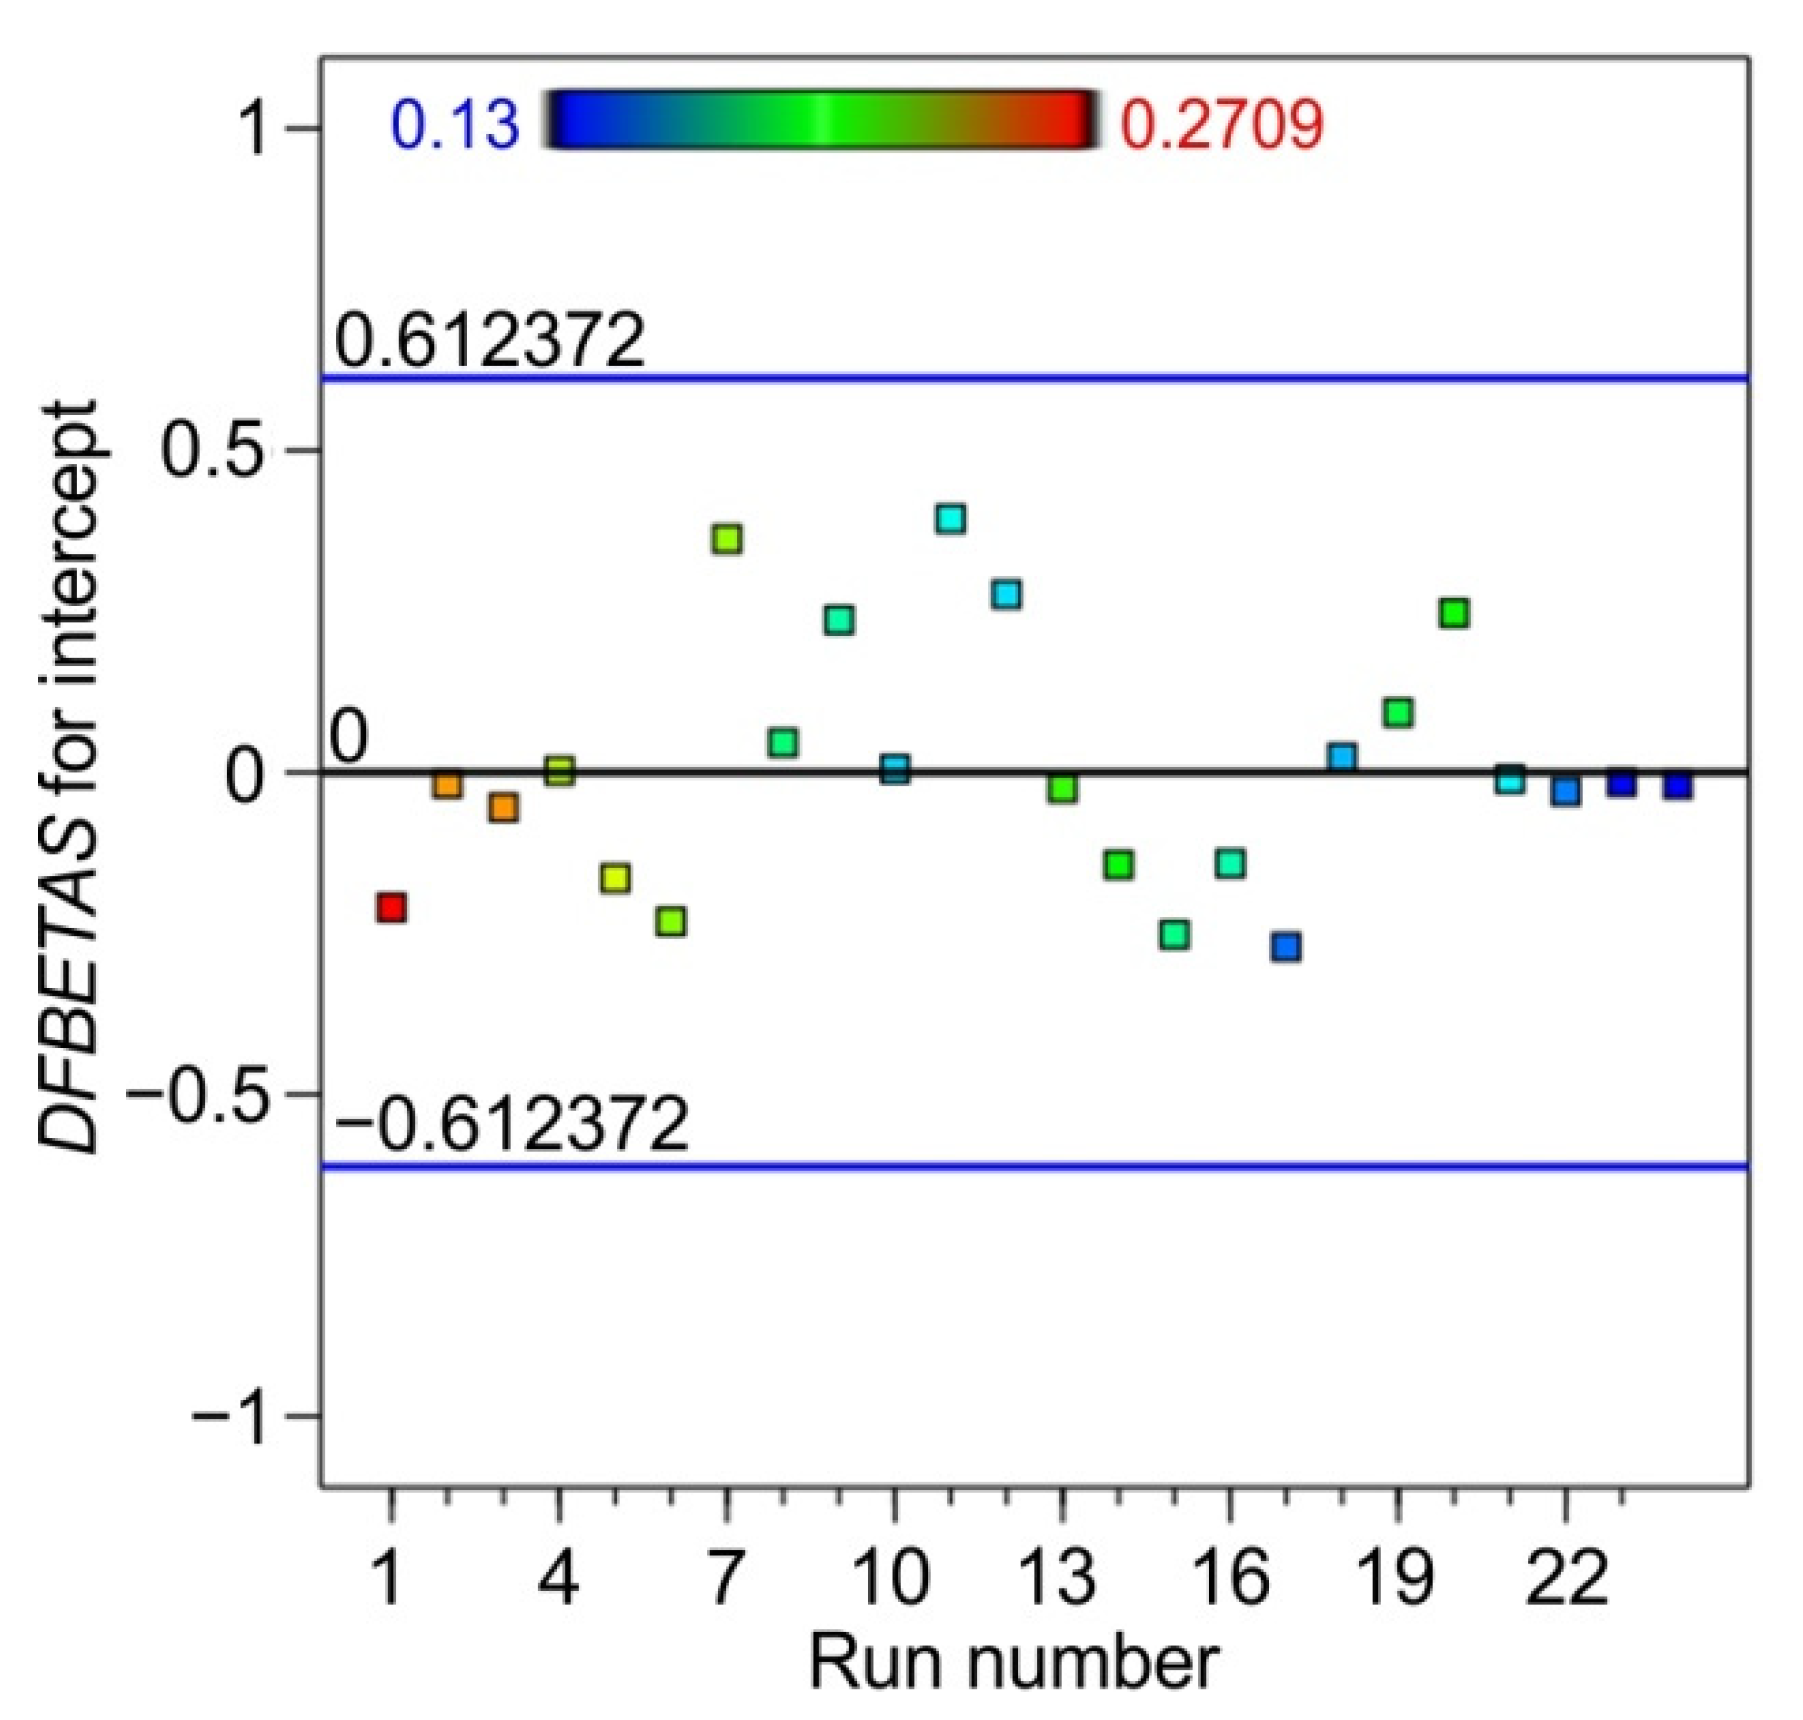
DFBETAS (difference in betas) is a deletion diagnostic where the influence of each run on a coefficient estimate is measured by deleting each run. Coefficients of DFBETAS (Equation (3)) were computed separately for each parameter in the regression model.
D F B E T A S = β ^ j β ^ j , i M S E i × c jj
where β ^ j ,   β ^ j , i are the j-th coefficients from the regression model calculated using all data and without the i-th observation, respectively, cjj is the j-th diagonal element of the (X’X)−1 matrix, and MSE(i) is the mean square error of the regression.
All design points did not have an excessive value outside of the feasible operating region (Figure 8), limited by ± 3 n (n is the number of runs in the design).
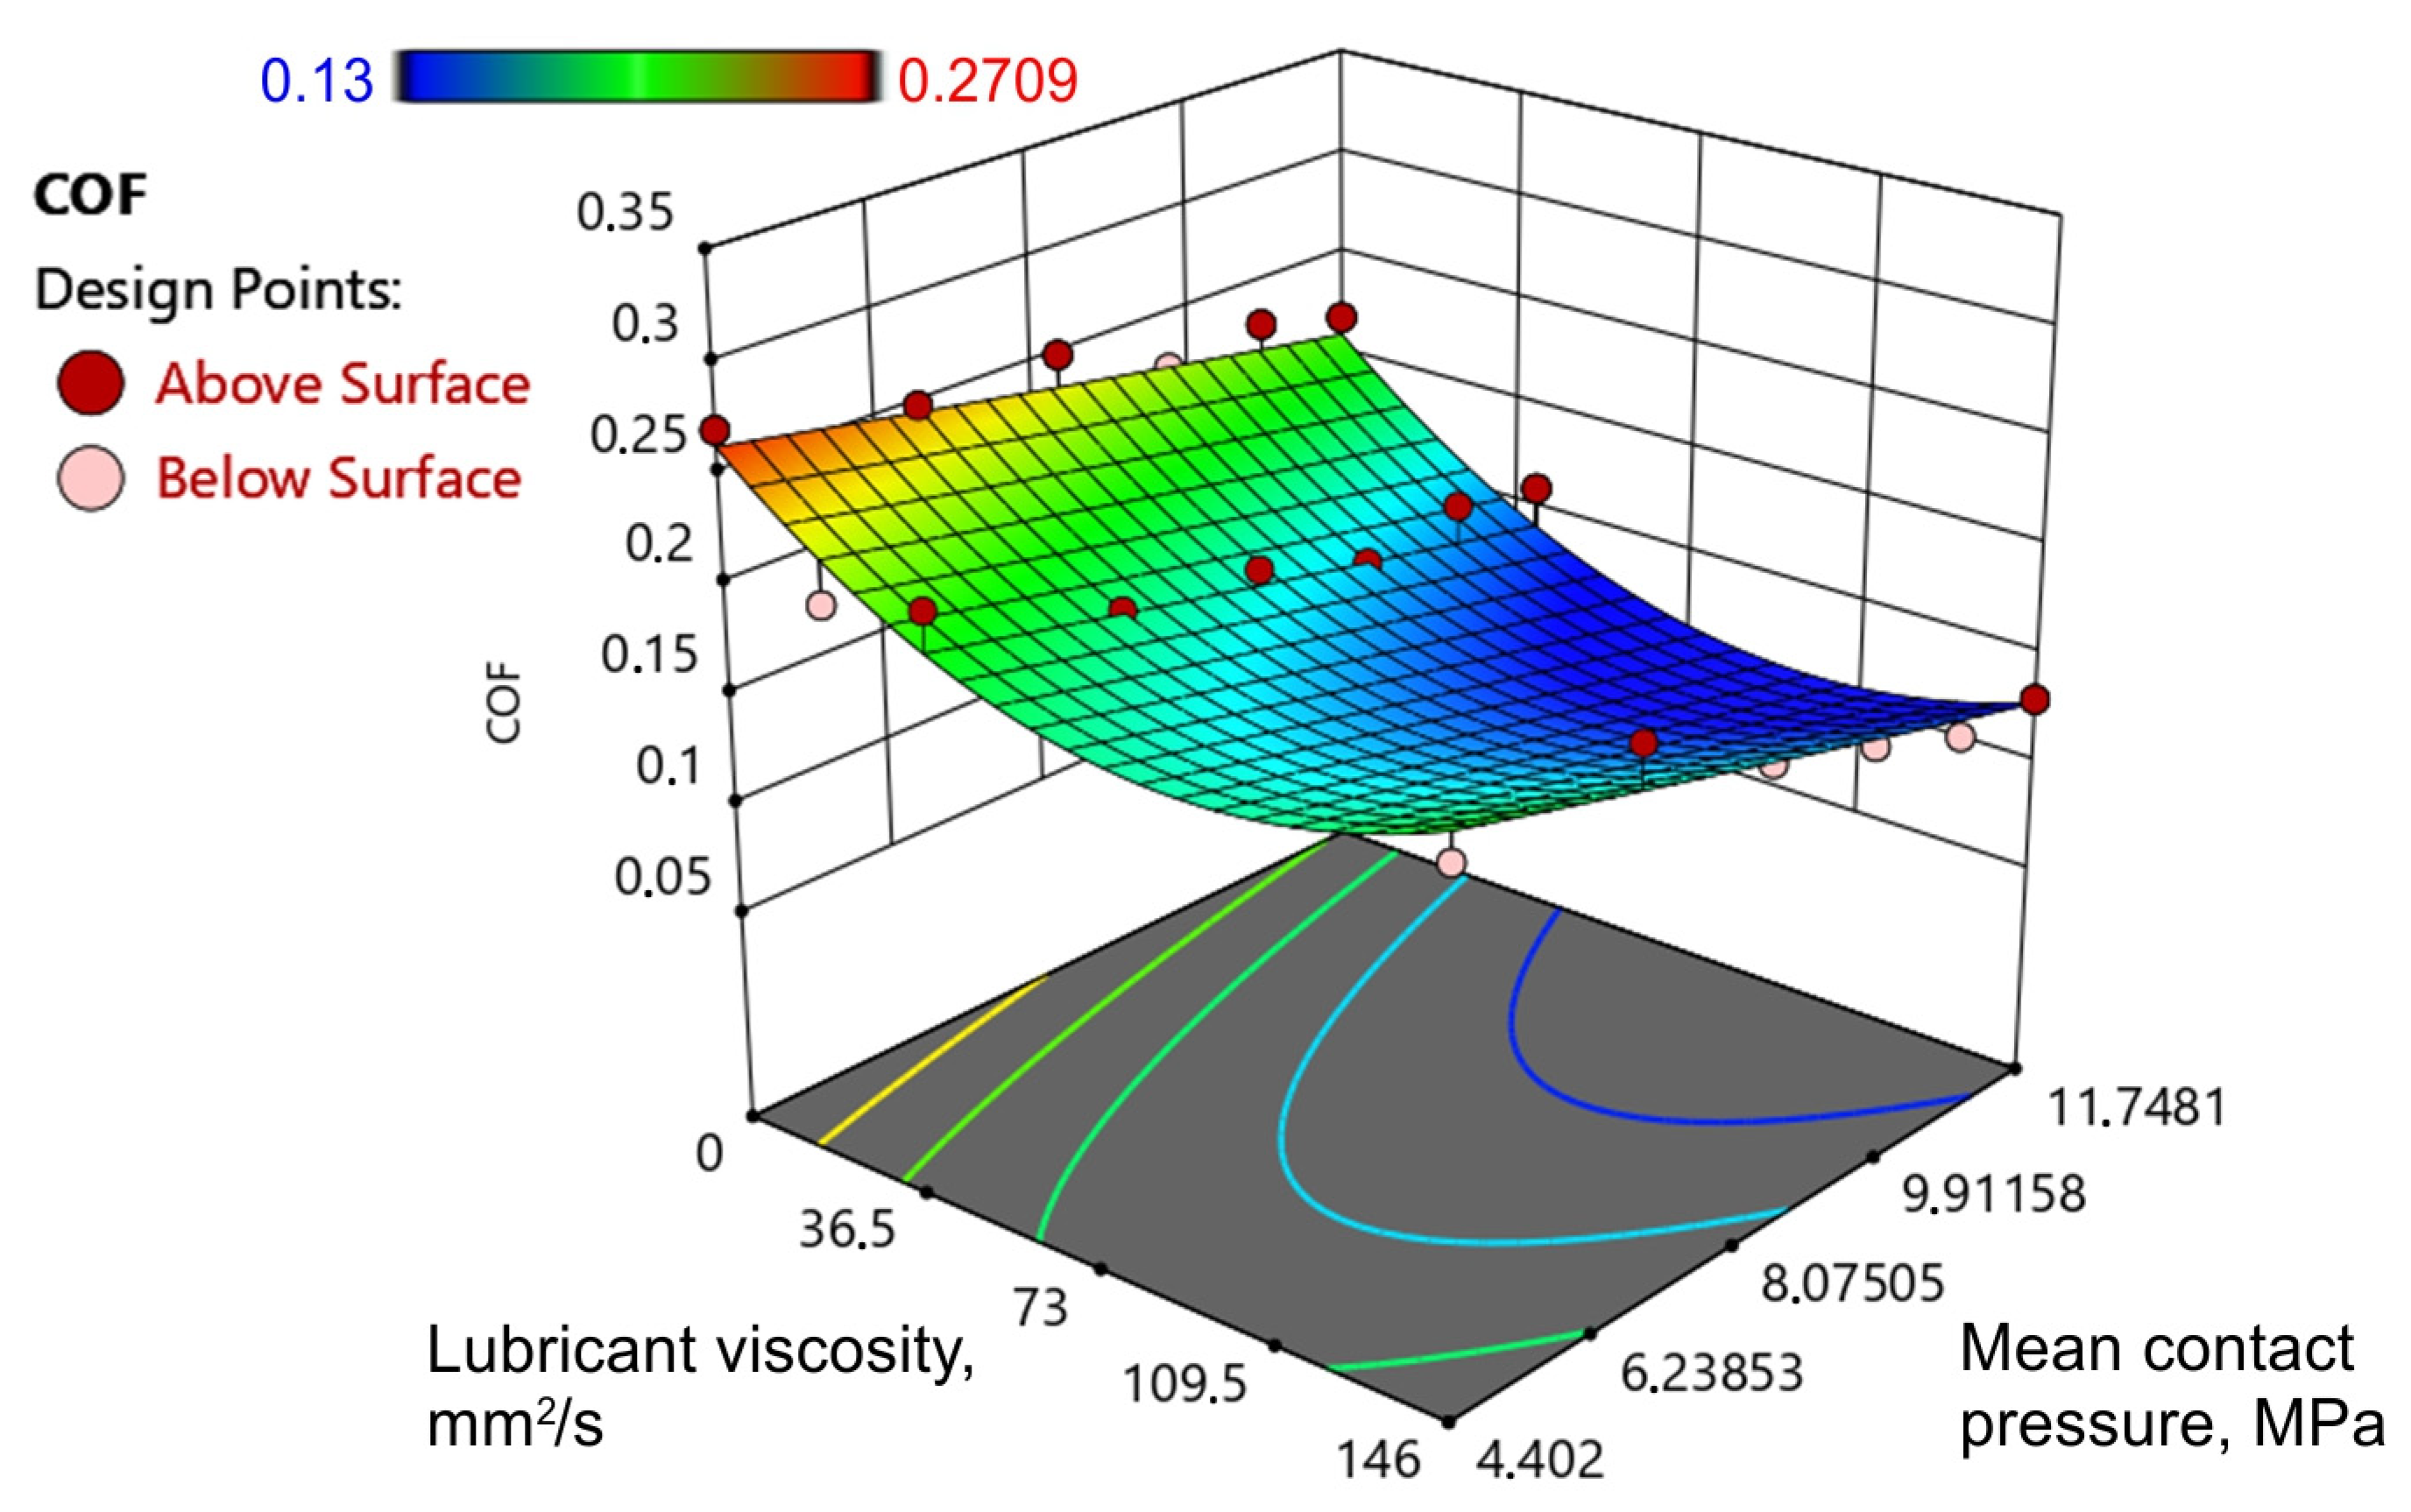
The response surface for COF is shown in Figure 9. The response surfaces showed that there was a monotonic decrease in the COF with an increase in MCP and lubricant viscosity. The minimum value of COF in the entire range of the MCP values investigated was observed with an oil viscosity of about 100 mm2/s. Viscosity determines the thickness and strength of the oil film, which is crucial to reduce friction and keep the metal surfaces at a distance. Low-viscosity oil has a high tendency to break its lubricating film [53]. In turn, too high a viscosity of the oil causes greater resistance to the movement of the oil layers and makes it difficult to properly fill the surface valleys with lubricant [54].

3.2. Effectiveness of Lubrication

Quantitative results of the effectiveness of lubrication of the oils used are shown in Figure 10. The quality of a given lubricant in reducing the friction value was determined using the lubrication efficiency coefficient determined by the relationship:
Effectivenes   of   lubrication = μ dry μ oil μ dry · 100 %
where μdry is the COF determined in dry friction conditions and μoil is the COF determined in lubricated conditions.
The lubrication efficiency with LAN46 oil and LVH22 oil showed an upward trend with increasing mean contact pressure. When using these oils, a local minimum of effectiveness of lubrication was observed at a pressure of 6.5 MPa. In the first step, there was a reduction in the height of the asperities of the roughness, but this reduction was too small to create closed lubricant pockets on the surface. The microscopic lubrication mechanisms induced by trapped lubricant in pockets of the workpiece surface has been studied by Bay et al. [54]. It was found that the hydrostatic pressure in closed lubricant pockets increases when the liquid pressure obtained suppresses further pocket deformation.
LAN46 oil has the most uniform tendency to reduce frictional resistance in the entire range of pressures investigated. This lubricant reduced the coefficient of friction by about 16–27%. After exceeding the pressure of 10 MPa, despite the twice higher viscosity of this oil as compared to the LHV22 oil, this lubricant decreased the COF value to the smallest extent. Viscosity defines the internal friction of the oil resulting from the fluid layers moving relative to each other during flow. In the pressure range between 8.2 and 11.7 MPa, DELVAC 1340 oil was the most effective in reducing the COF (32–40.5%).

3.3. Surface Roughness Parameters

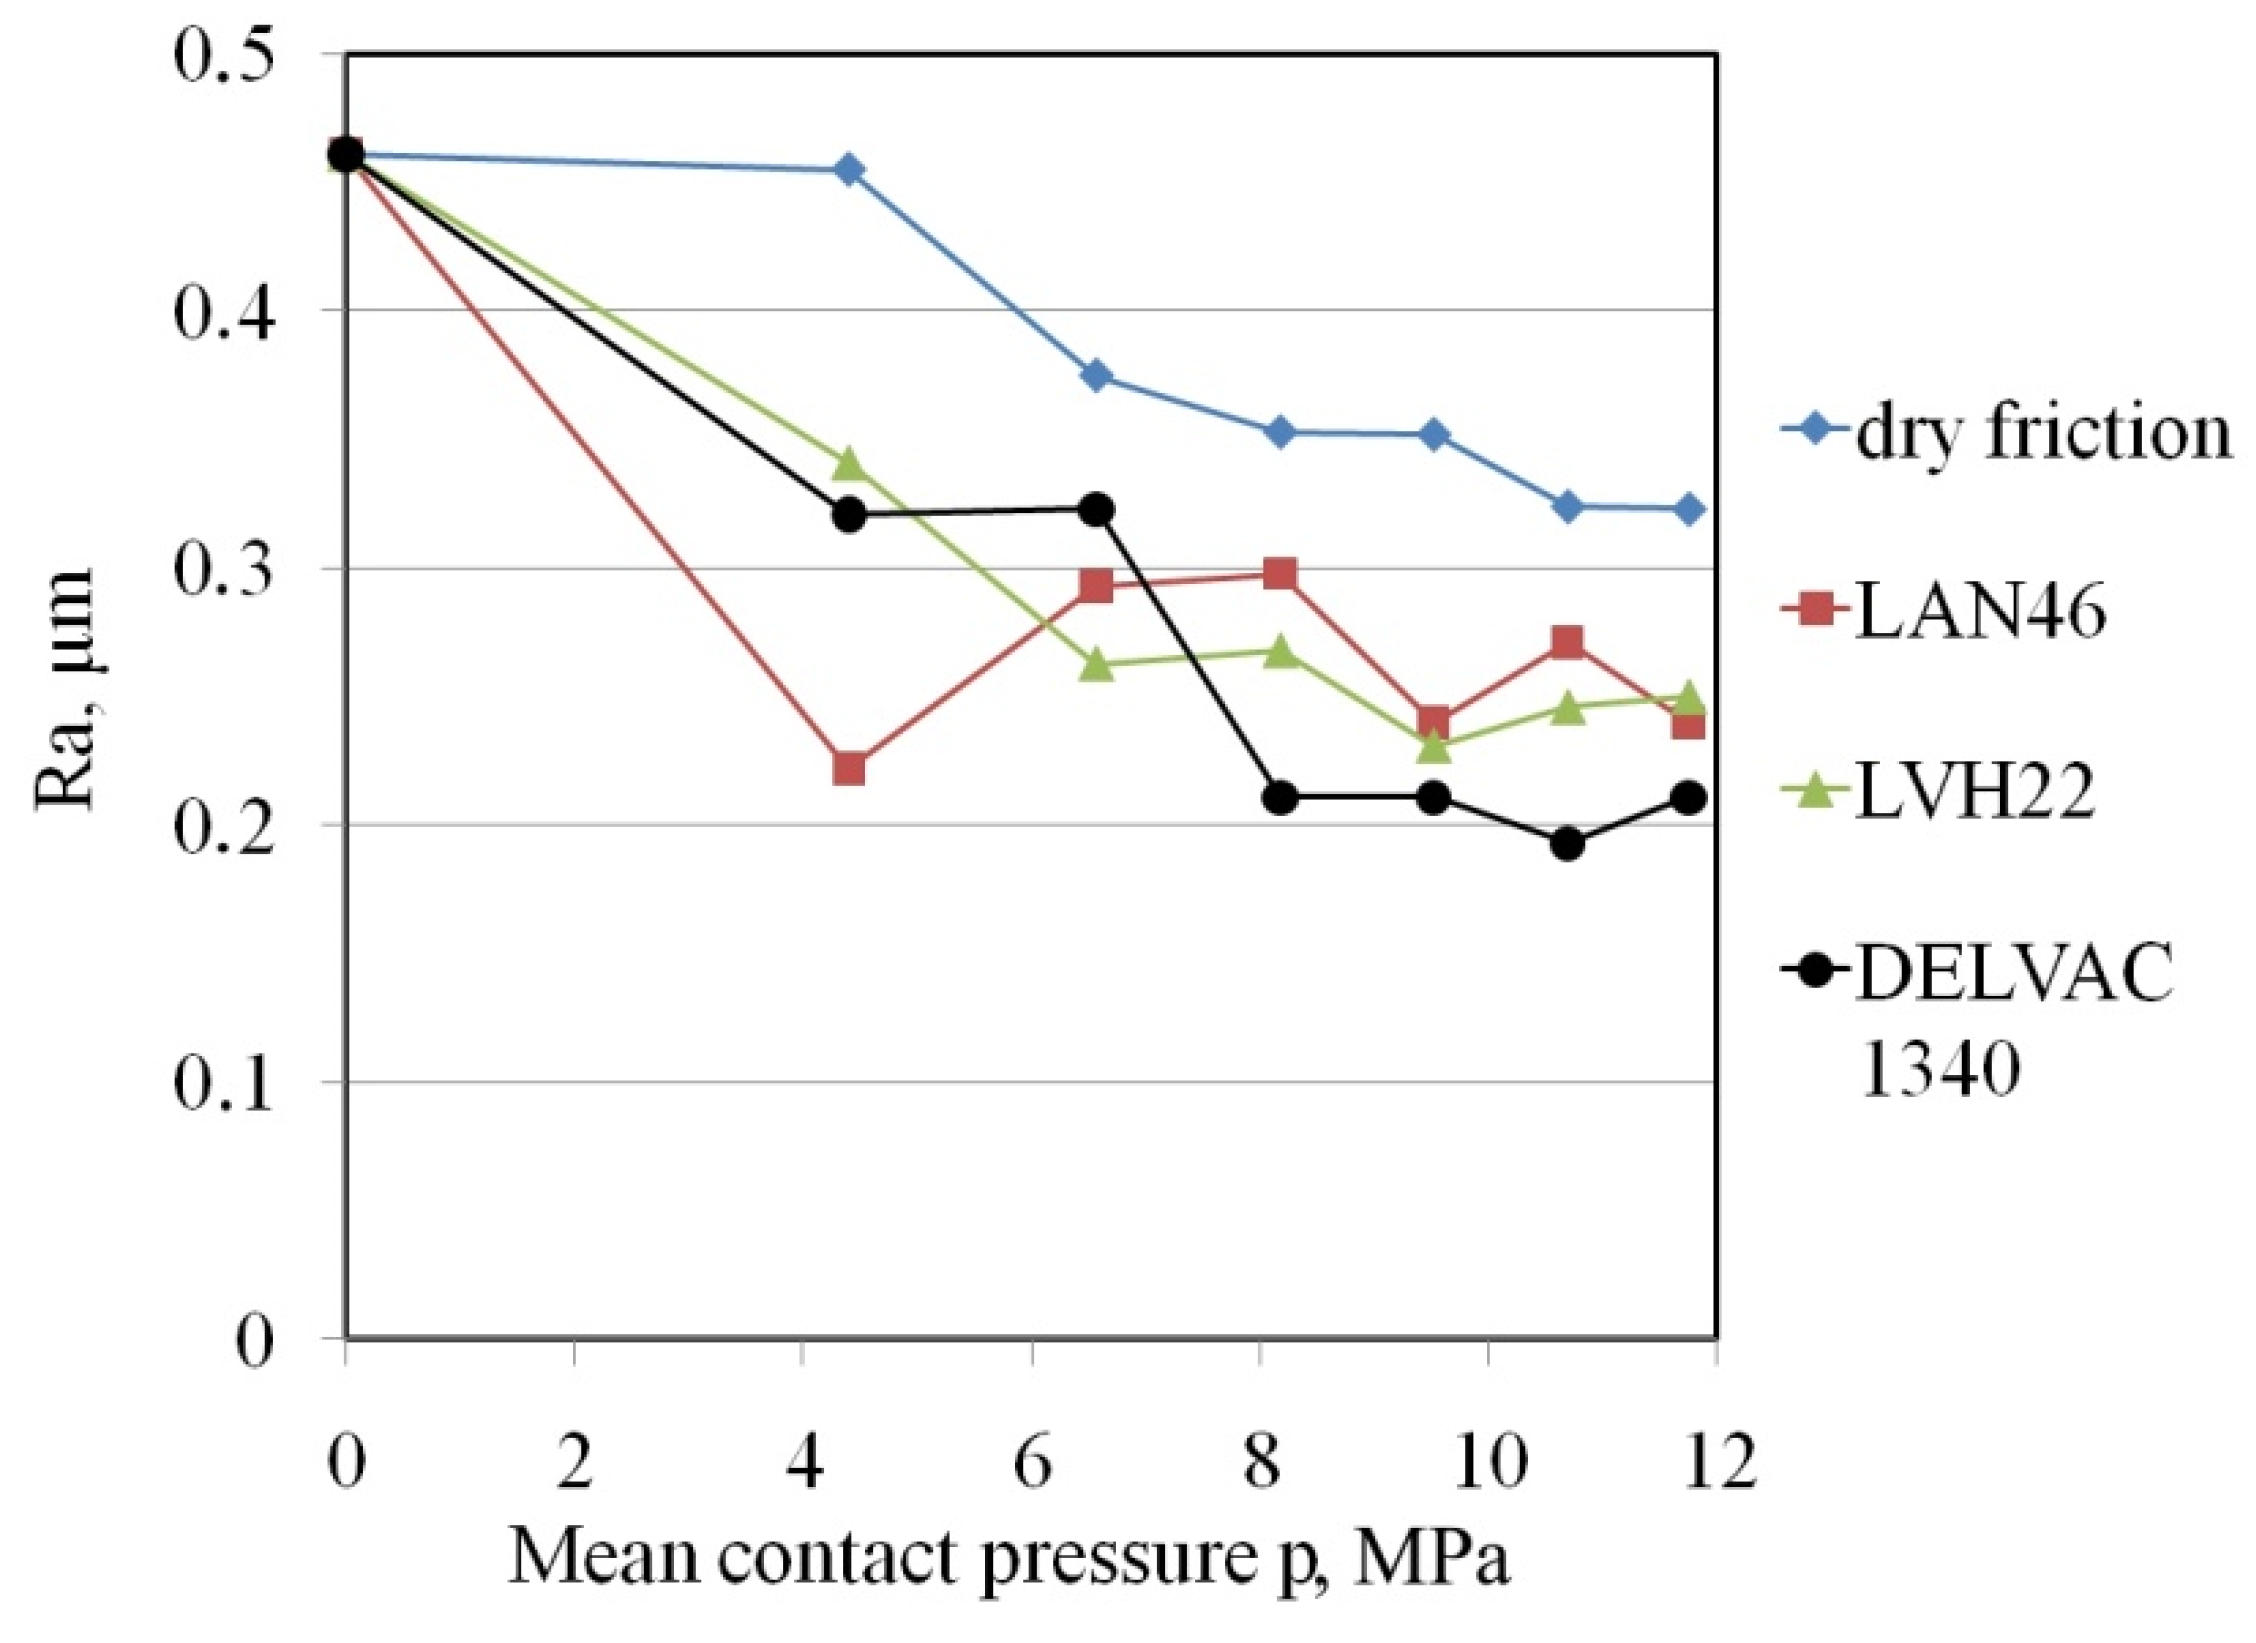
Changing the surface roughness of the sheet surface is an indispensable process accompanying the processes of sheet metal forming. When deforming a sheet of much lower strength and hardness compared to the tool material, the tool surface asperities cause a change in the sheet surface topography by flattening and/or roughening phenomena. In general, the friction reduces the value of average roughness, Ra (Figure 11). The smallest reduction of the Ra parameter in relation to the as-received sheet surface was observed for the lubrication conditions with DELVAC 1340 engine oil. The low surface roughness of the sheet makes the occurrence of closed lubricant pockets more likely. This is confirmed by the fact that, under the conditions of lubrication with this oil, sufficient pressure was generated in closed lubricant pockets, enabling the achievement of high lubrication efficiency (Figure 10).
The average surface roughness (Ra) is not sensitive to small changes in the profile height [43]. For a surface roughness with occasional deep valleys, a non-Gaussian distribution is a better choice. The surface, as-received, had positive skewness (high asperities that protrude above a flatter average). The friction process produces a change of skewness from positive to negative. This means that the surface has a smoother plateaux and deep valleys. After an initial decrease in the skewness value, the skewness value began to increase again towards the positive values after exceeding the pressure of about 6.5 MPa (Figure 12). This may be related to the increased share of ploughing of the sheet surface by asperities of the tool surface. Thus, slim grooves with smooth asperities were formed. As shown by Sedlaček et al. [55], a surface with negative skewness reduces friction in the presence of a lubricant. Plateau-like topographies resulted in lower friction [56].
Table 5 presents the ANOVA results of the skewness (Rsk) at a confidence interval of 95%. The model developed is adequate, and the model F-value of 6.41 implies the model is significant. Due to the p-value, A, B, and A2 are significant model terms. However, the product of lubricant viscosity and mean contact pressure (AB) is very close to the threshold of significance. The difference between predicted R2 and adjusted R2 is less than 0.2 (Table 6). Therefore, this difference is in reasonable statistical agreement.
Actual values of skewness (Rsk) lie along a straight line inclined at 45° to the axis of the abscissa (Figure 13a). Externally studentised residuals are also arranged along the straight line (Figure 13b). Both diagrams confirm a normal probability distribution of the data.
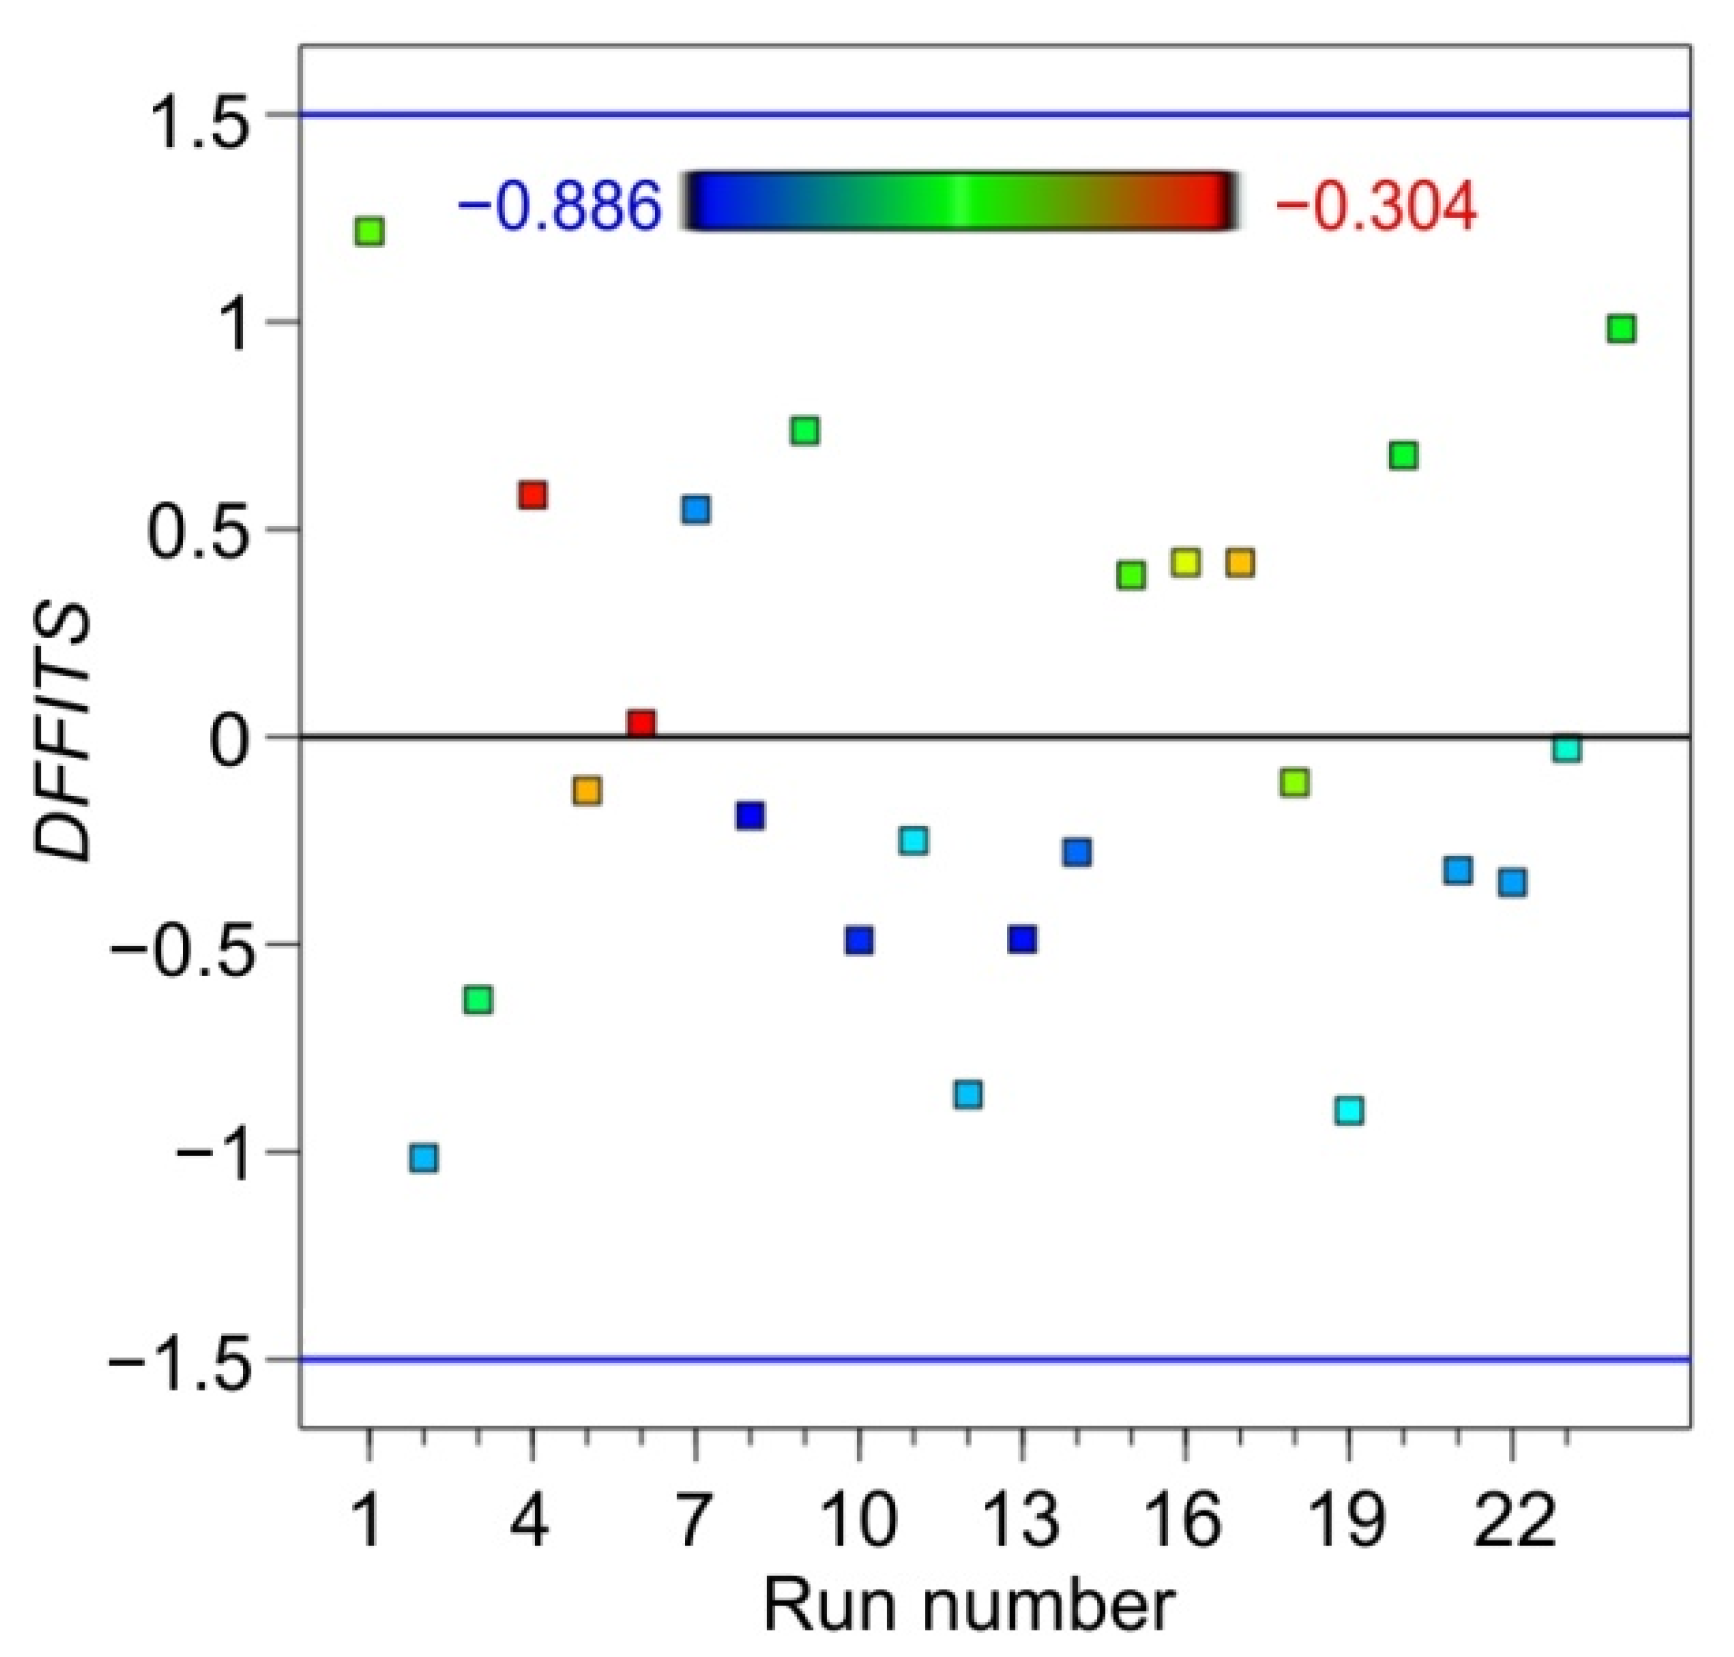
DFFITS (difference of fits) measures the effect of the i-th observation on the predicted value for a point when that point is left out of the regression (Equation (5)). The DFFITS statistic measures the change in each predicted value that occurs when that response is deleted.
D F F I T S = Y ¯ Y ^ i S i · leverage
where S(i) is the standard error estimated without the point in question, S(i) = σ ^ i 2 ( σ ^ is standard deviation), Y ^ i is the prediction for the point without the point included in the regression, and Y ¯ is the prediction for the point included in the regression model.
All the points in the statistical regression were located between limit lines ±1.53226 (Figure 14). Therefore, all points of the skewness (Rsk) were influential.
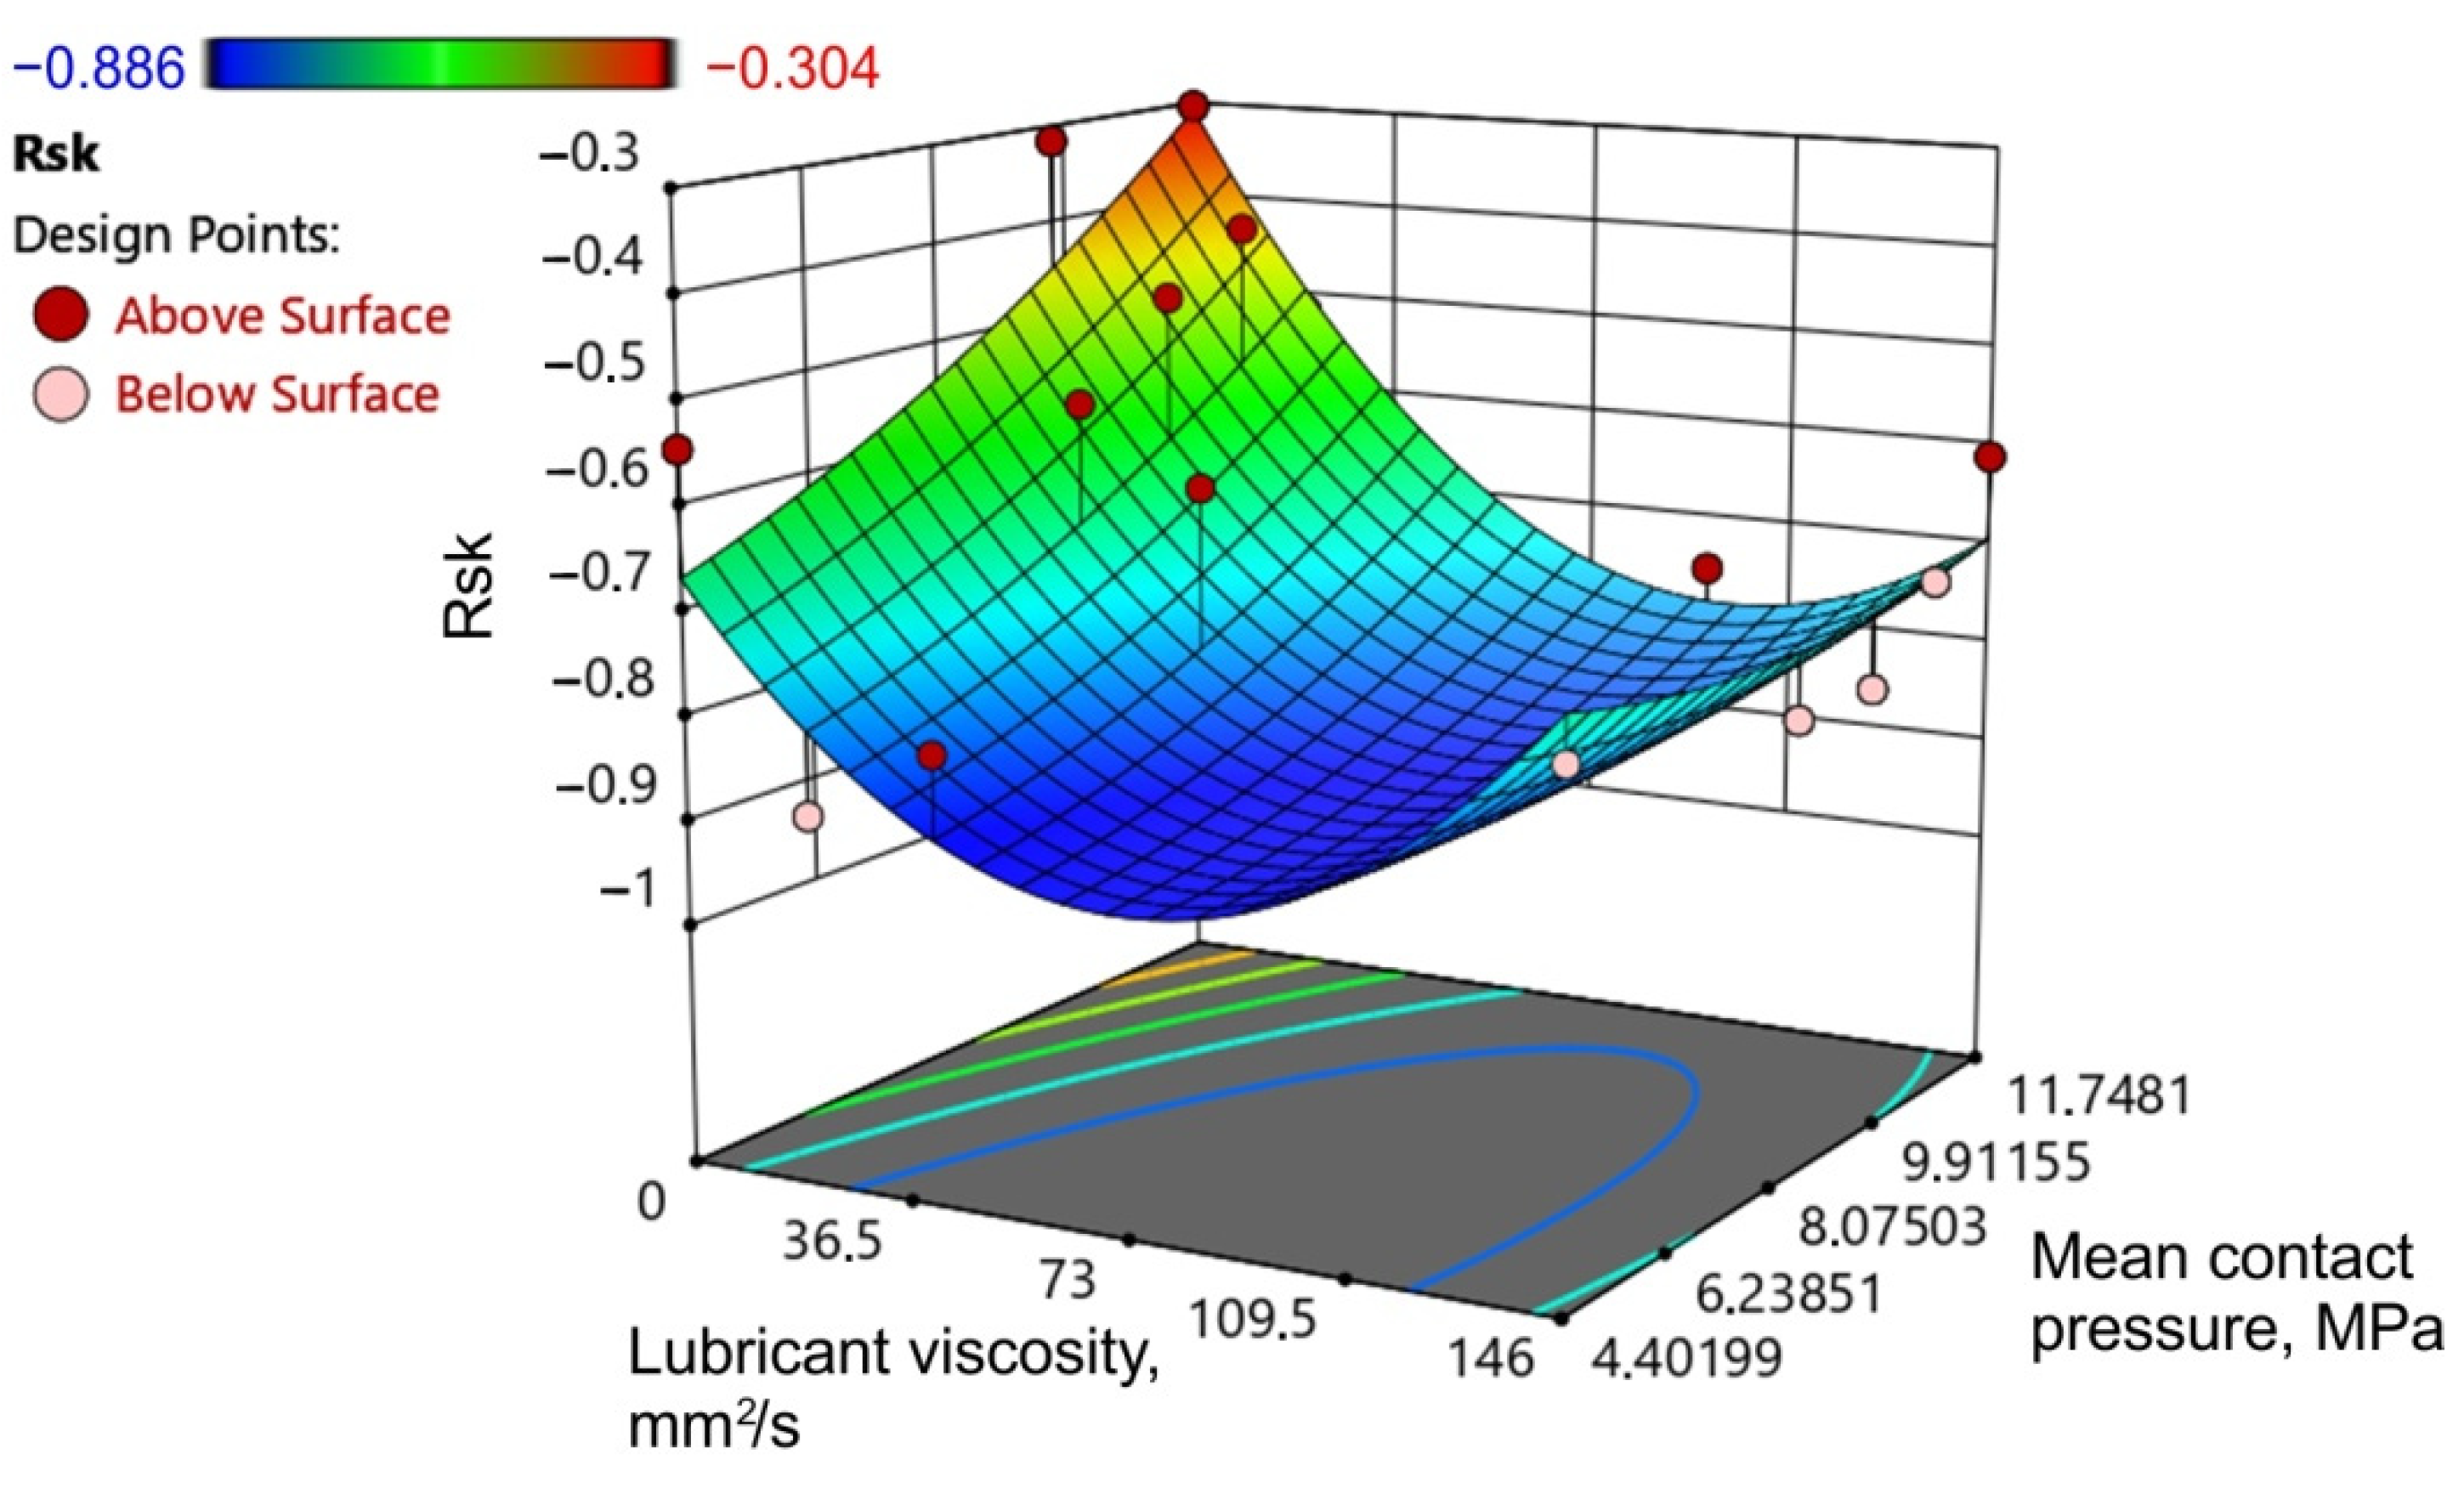
The response surface for skewness (Rsk) is shown in Figure 15. The character of the response surface implies the existence of a local minimum in the process within the range of lubricant viscosity and mean normal pressure. A local minimum of the response surface for skewness exists for MCP p = 4.61 MPa and lubricant viscosity η = 76.16 mm2/s. The ANOVA model is consistent with experimental results that showed a negative skewness of the surface after the friction process. A surface represented by more negative skewness is always reflected in a lower friction [47]. It was also confirmed by higher values of skewness of the surfaces tested under dry friction conditions. Under these conditions, the COF was greater than during lubricated conditions.
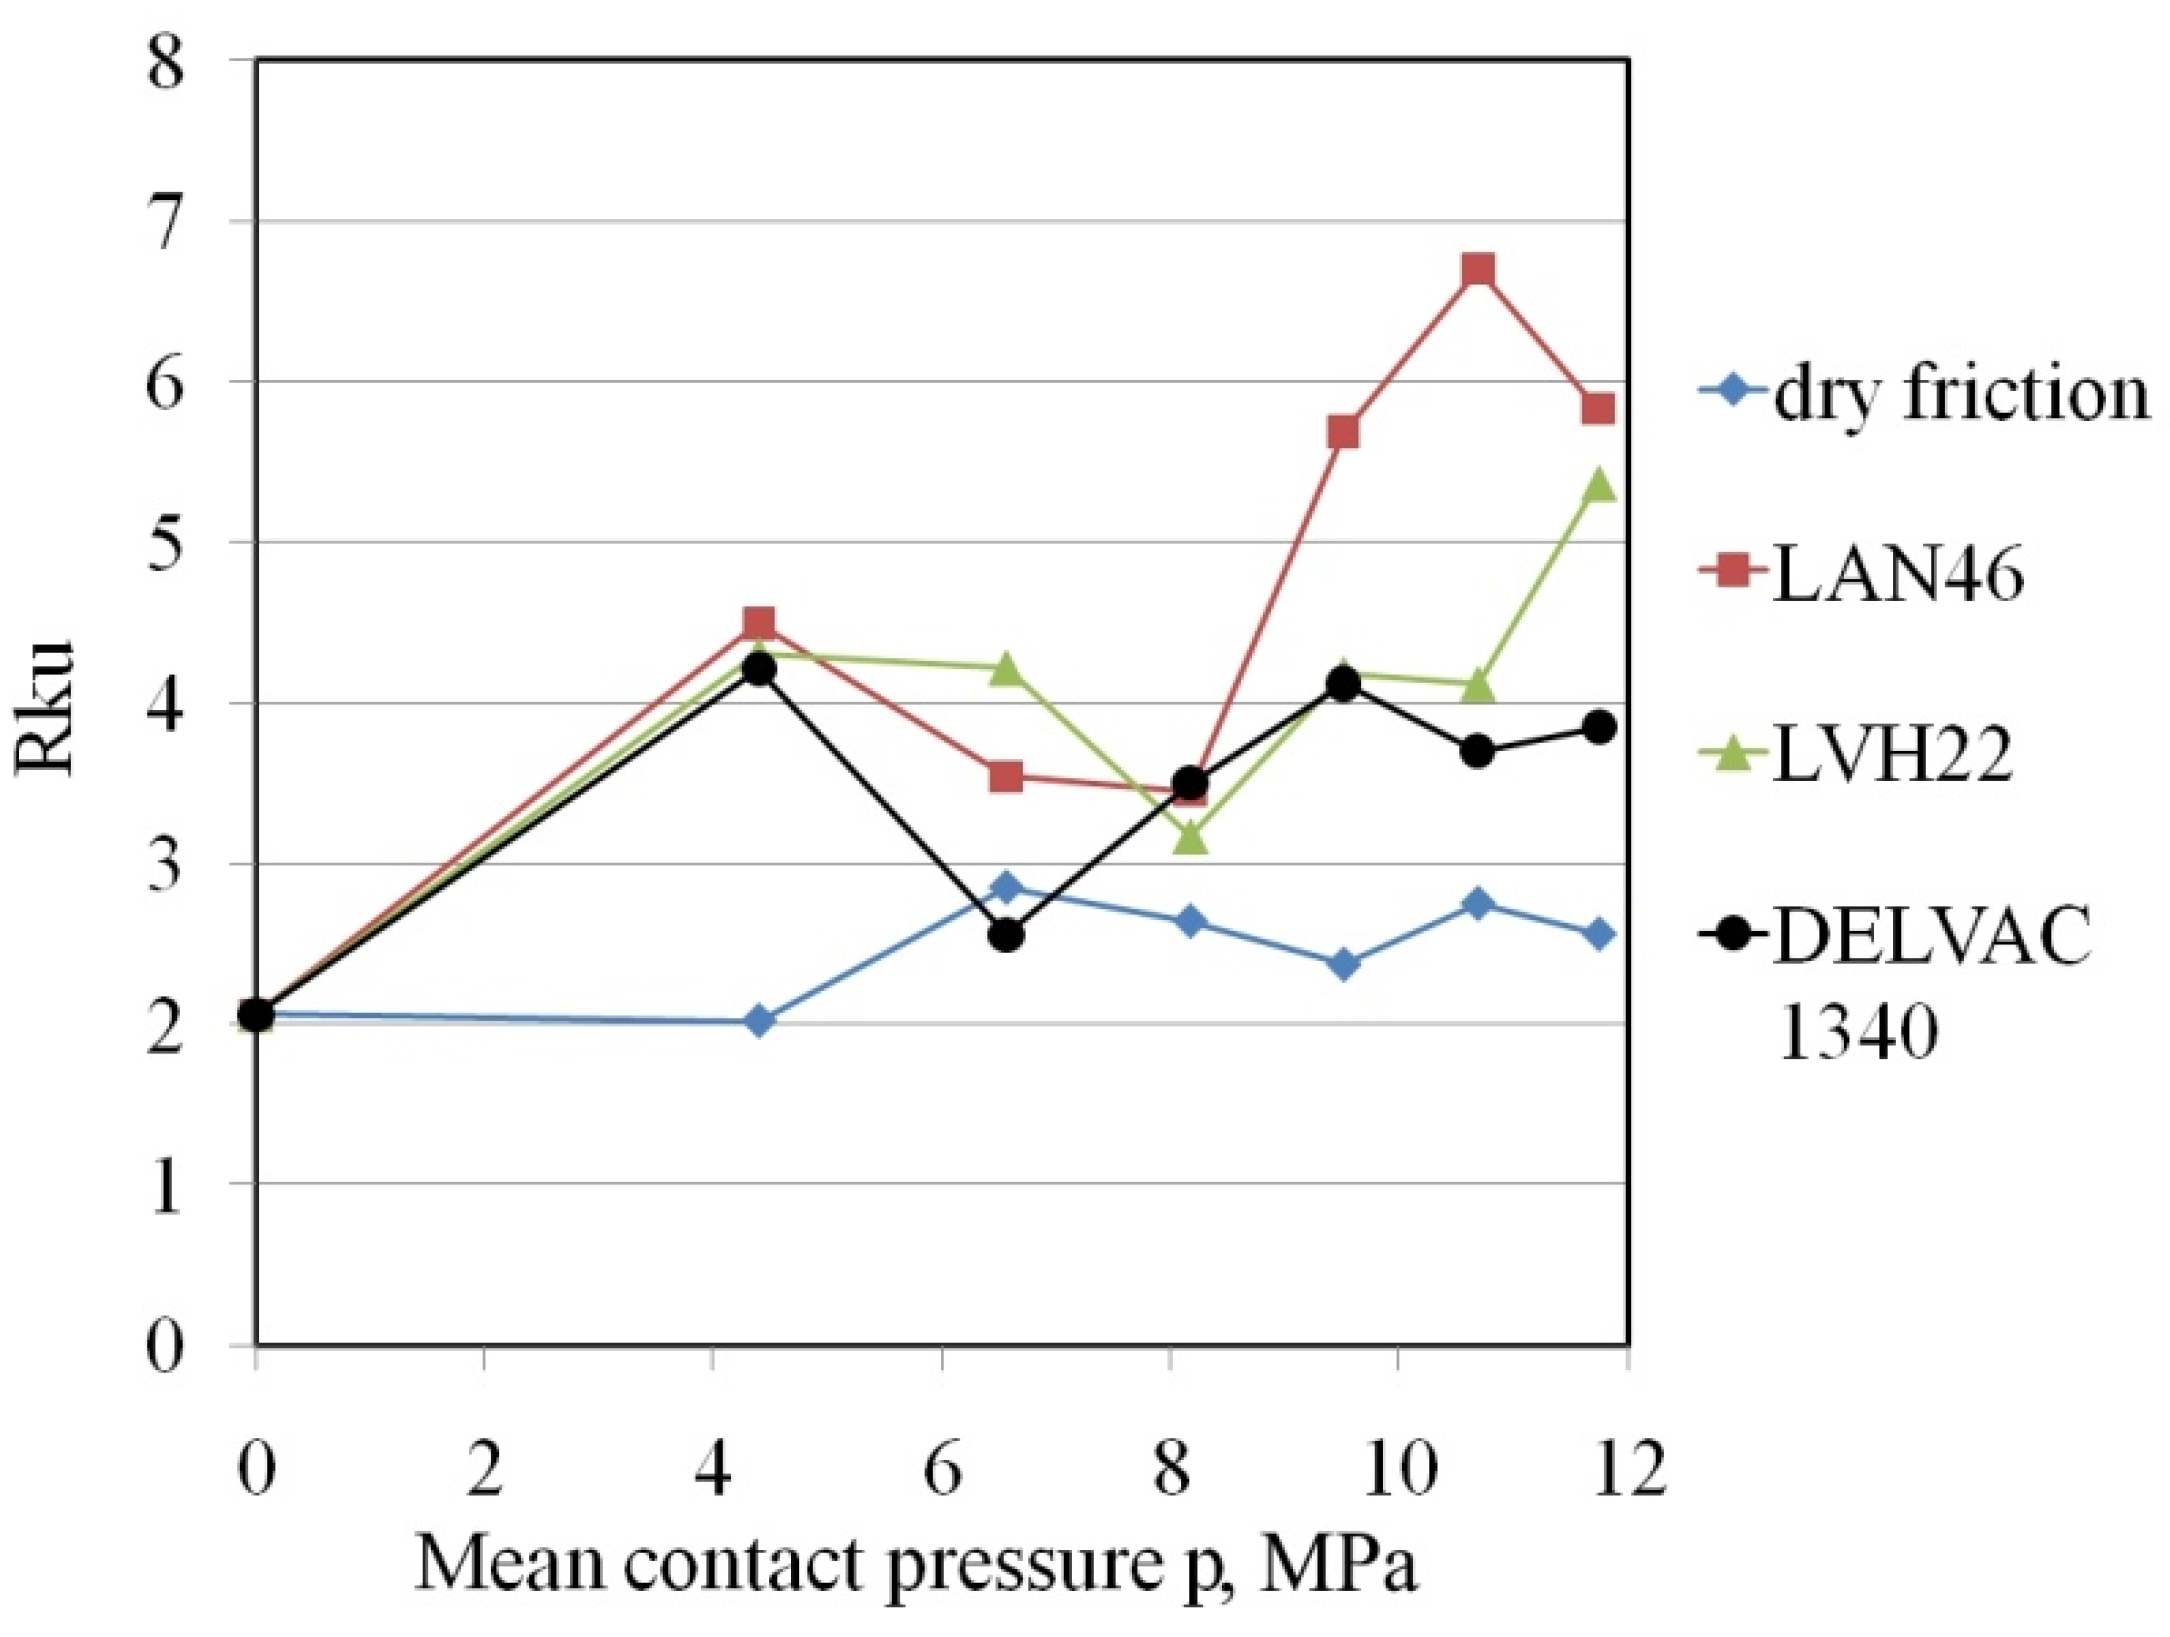
Surfaces with a kurtosis of more than 3 indicate many low valleys and high peaks [57]. This condition is met by the surfaces created after the friction process under lubrication conditions (Figure 16). Plateau-like topographies with small cavities (Figure 17) reflected a higher kurtosis [56]. In the range of pressures of 4–11 MPa, a trend of stabilisation of the Rku parameter was observed for the lubrication with DELVAC 1340 and LVH22 oils. The surface under friction with the use of LAN46 machine oil rapidly increased its Rku parameter after exceeding the pressure of 8 MPa. The surface roughness parameters Rku and Rsk are used to describe the surface roughness in mixed and boundary lubrication regimes. When the parameter Rsk becomes more negative and Rku is increasing, the COF, in general, tends to become smaller [46].
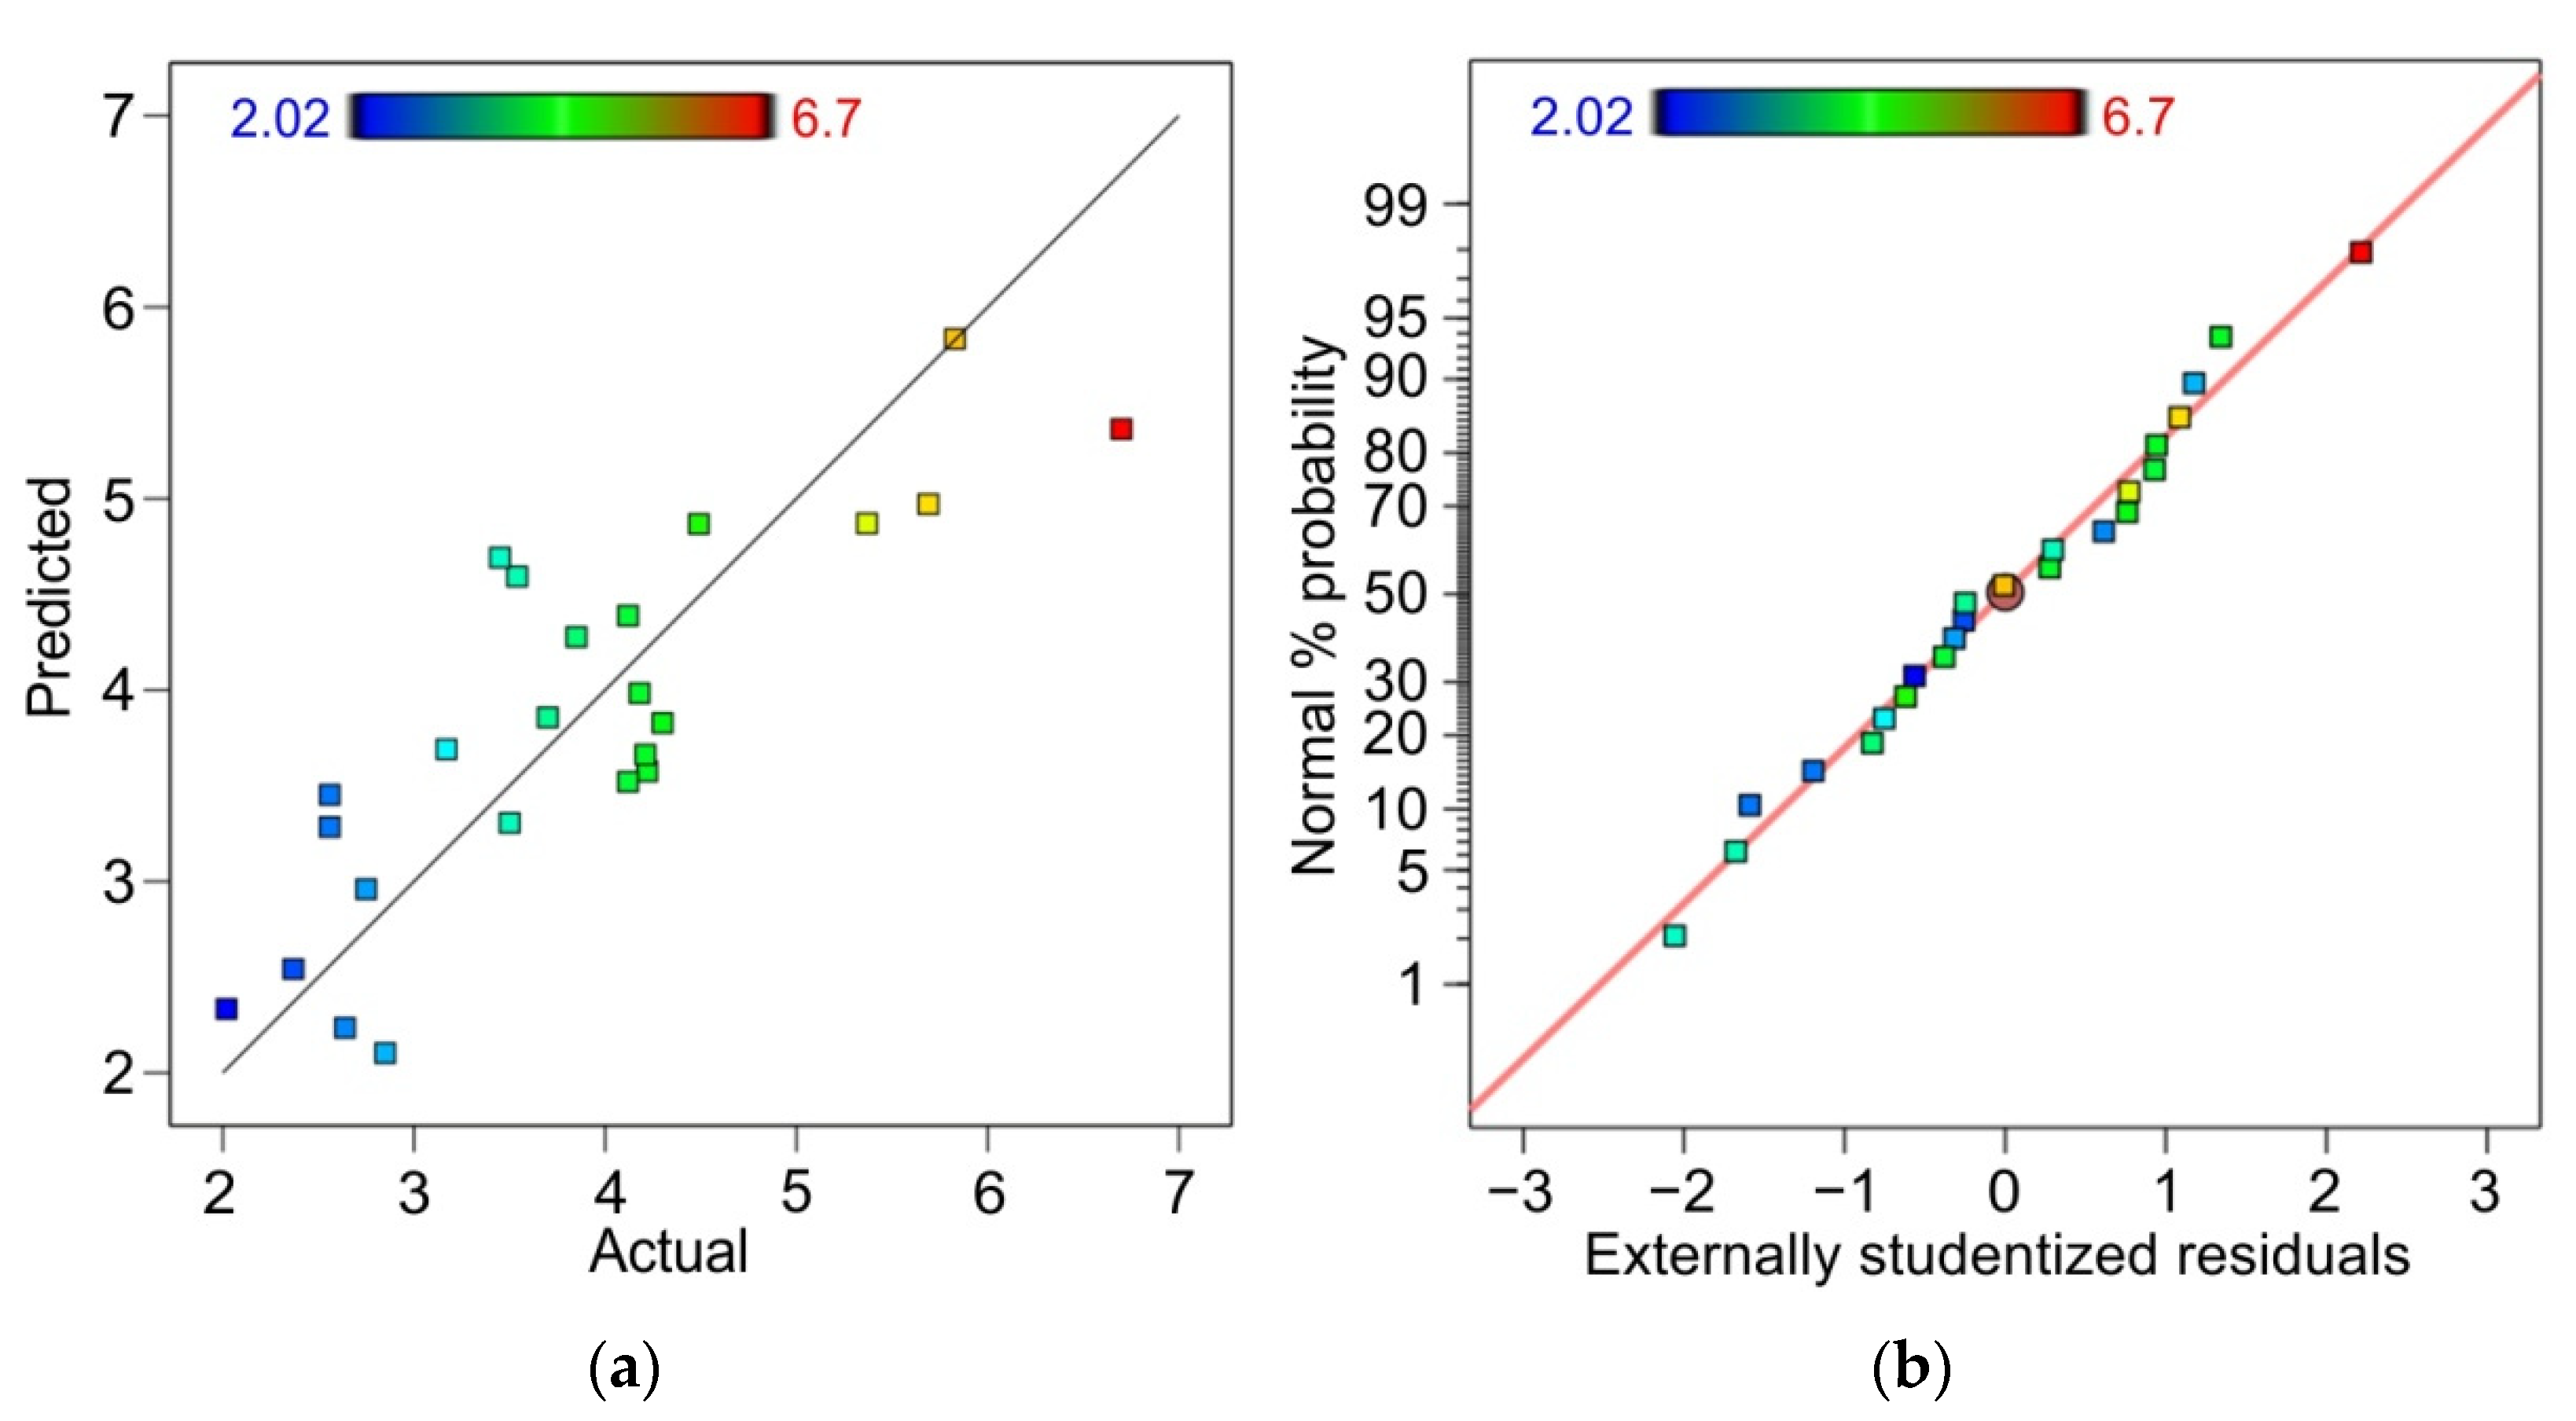
The model F-value of 8.65 (Table 7) implies that the ANOVA model for kurtosis (Rku) was significant. Lubricant viscosity (A) and the lubricant viscosity squared (A2) were significant model terms. The significance of the terms was estimated based on p-values of less than 0.0500. The coefficient of determination, R2, for the ANOVA model was about 0.7062 (Table 8). The adequacy precision was greater than 4. Therefore, an adequacy precision of 10.282 indicates an adequate signal.
Similar to the distribution of the predicted versus actual response for skewness and COF, the actual values for kurtosis (Rku) were also arranged along a straight line inclined at 45° to the axis of the abscissa (Figure 18a). Externally studentised residuals were also arranged along the straight line (Figure 18b), confirming a normal probability distribution of the data. The residuals were not clearly inclined to be linear rather than an “S-shaped” line.
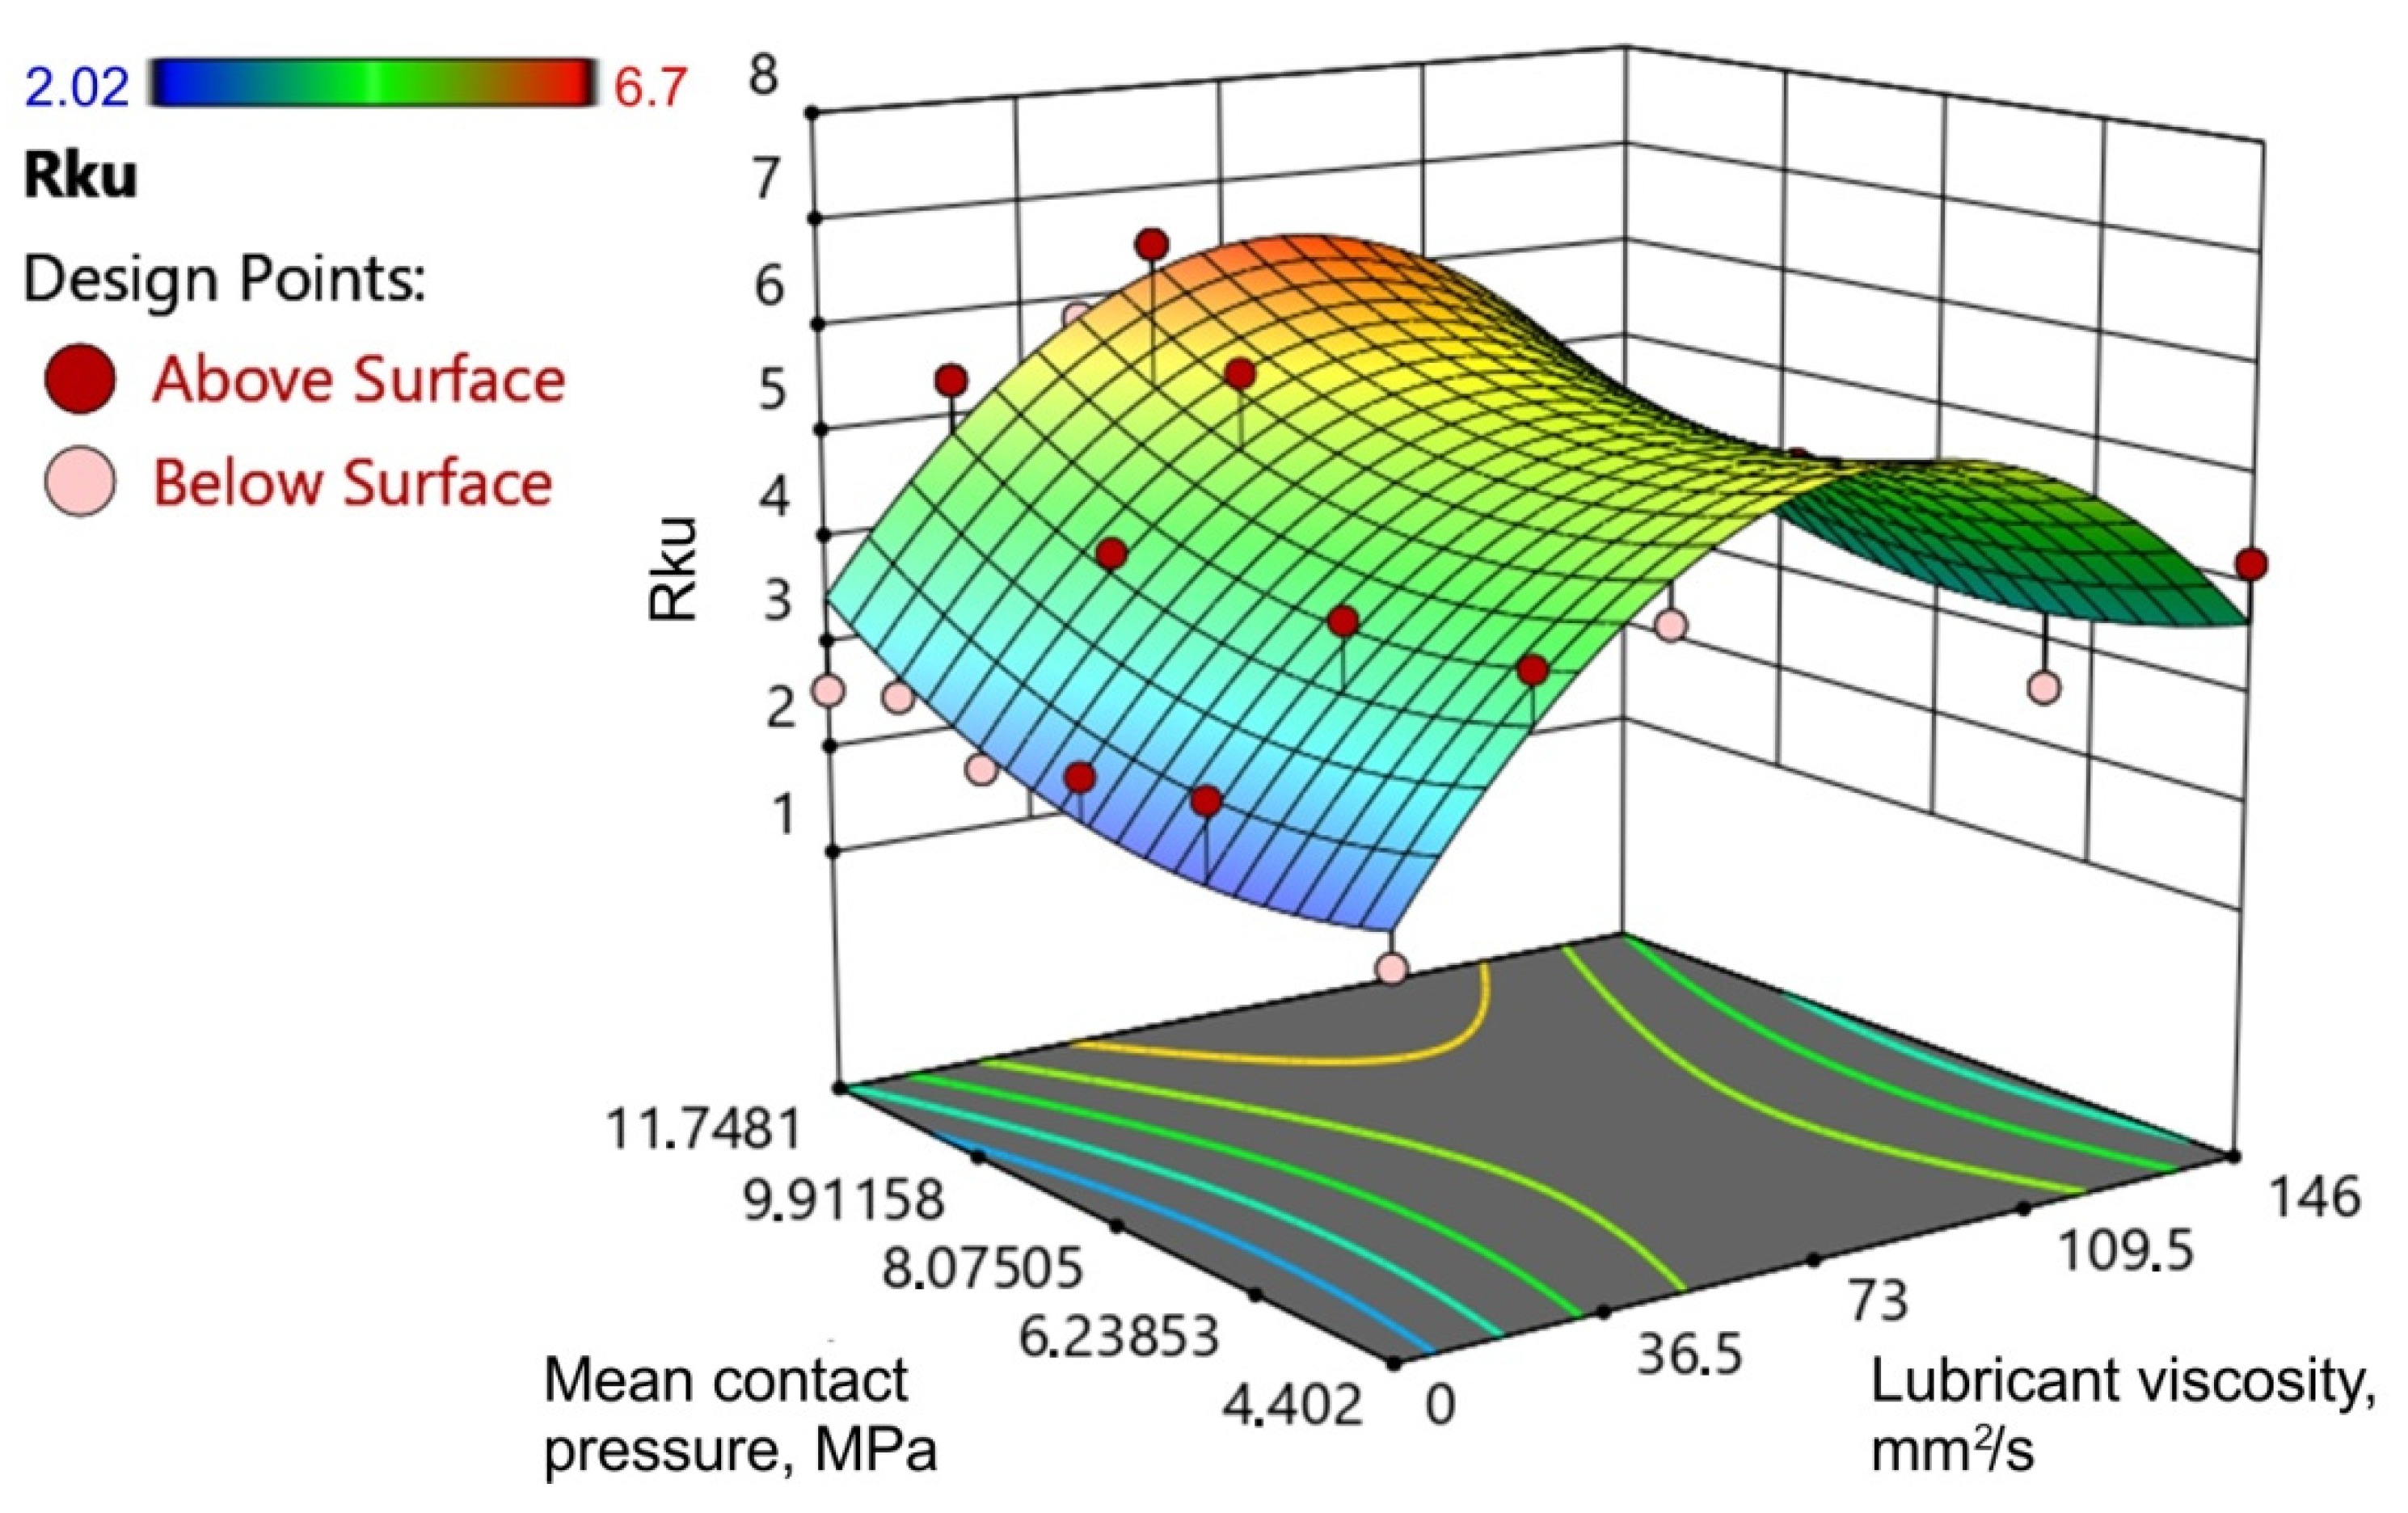
The response surface for kurtosis (Rku) is shown in Figure 19. There is a clear relation between response surfaces for kurtosis (Rku) and skewness (Rsk). For the range of changes in the input parameters that were analysed, the maximum skewness values (Rsk) (Figure 15) corresponded to the areas of minimum kurtosis values (Rku) (Figure 19). In general, mean contact pressure affected kurtosis (Rku) to a lesser extent than lubricant viscosity. As the viscosity of the oil increased, the value of kurtosis (Rku) increased, and after reaching the maximal value for a viscosity range of about η = 70–75 mm2/s, the kurtosis value decreased again with increasing pressure.

4. Conclusions

This article presented the results of friction tests to determine the value of the COF of EN AW-2024-T3 sheets using the strip drawing test with rounded counter-samples. The results of experimental research and ANOVA allowed the following main conclusions to be drawn:
  • A decrease in COF was observed with an increase in mean contact pressure and lubricant viscosity.
  • Based on the COF trend line with mean contact pressure, it was found that LAN46 machine oil and LVH22 hydraulic oil with similar viscosity reduced the coefficient of friction to the same extent in the entire range of contact pressures tested.
  • DELVAC 1340 engine oil with the highest viscosity significantly lowered the value of the COF in the entire range of contact pressures tested.
  • The lubrication efficiency with LAN46 machine oil and LVH22 hydraulic oil showed an upward trend with increasing mean contact pressure.
  • The F-value of all models for COF, Rsk, and Rku analysed implies that the ANOVA models were significant. Moreover, the predicted R2 was in reasonable statistical agreement with the adjusted R2. In all models, kinematic viscosity was the most significant factor (p-values less than 0.0500) affecting the output (explained) parameter.
  • Friction reduced the values of average roughness (Ra) and skewness (Rsk). Meanwhile, friction under contact pressure in the analysed range (4.4–11.7 MPa) caused an increase in kurtosis (Rku).
  • In general, mean contact pressure affected kurtosis (Rku) to a lesser extent than lubricant viscosity.
Friction occurring in sheet metal forming is one of the main technological parameters limiting the deep drawing process; therefore, the appropriate selection of a lubricant is one of the basic tasks for technologists. The coefficient of friction of plastically deformed sheets should be determined using special tests that represent the friction conditions occurring in SMF. In this article, a specially designed tribological simulator of the strip drawing test was used. This made it possible to test sheet metals of various thicknesses under various pressures and lubrication conditions. The choice of lubricant with a specific viscosity should depend on the surface roughness of the workpiece and the contact pressures. In addition, the grade of the sheet metal formed should be considered. Aluminium and aluminium alloy sheets show a strong tendency to galling. The tests showed that LAN46 and LVH22 oils showed similar lubrication efficiency in the entire range of the mean contact pressures analysed. However, with increasing the mean contact pressure over 8.2 MPa, the lubrication efficiency of these oils decreased. The significantly higher-viscosity oil (DELVAC 1340) retained its beneficial properties in reducing the coefficient of friction over the entire range of pressures analysed. If the roughness of the sheet metal after the forming process is an important factor, DELVAC 1340 oil should be used. This lubricant provided the lowest mean roughness in the pressure range of 8.2–11.7 MPa.

Funding

This research received no external funding.

Data Availability Statement

Data is contained within the article.

Conflicts of Interest

The authors declare no conflict of interest.

References

  1. Wang, W.; Zhao, Y.; Wang, Z.; Hua, M.; Wei, X. A study on variable friction model in sheet metal forming with advanced high strength steels. Tribol. Int. 2016, 93, 17–28. [Google Scholar] [CrossRef]
  2. Evin, E.; Németh, S.; Vyrostek, M. Evaluation of Friction Coefficient of Stamping. Acta Mech. Slovaca 2014, 18, 20–27. [Google Scholar] [CrossRef] [Green Version]
  3. Trzepieciński, T.; Oleksik, V.; Pepelnjak, T.; Najm, S.M.; Paniti, I.; Maji, K. Emerging Trends in Single Point Incremental Sheet Forming of Lightweight Metals. Metals 2021, 11, 1188. [Google Scholar] [CrossRef]
  4. Trzepieciński, T. 3D elasto-plastic FEM analysis of the sheet drawing of anisotropic steel sheet. Arch. Civ. Mech. Eng. 2010, 10, 95–106. [Google Scholar] [CrossRef]
  5. Slota, J.; Šiser, M. Influence of friction condition on failure location of AA5754 aluminium sheet in Nakajima test. Zeszyty Naukowe Politechniki Rzeszowskiej Mechanika 2018, 35, 57–66. [Google Scholar] [CrossRef] [Green Version]
  6. Lindvall, F.W. On tool steel, surface preparation, contact geometry and wear in sheet metal forming. Licentiate Thesis, Karlstad University Studies, Karlstad, Sweeden, 2011; p. 64. [Google Scholar]
  7. Trzepieciński, T.; Szpunar, M.; Ostrowski, R. Split-Plot I-Optimal Design Optimisation of Combined Oil-Based and Friction Stir Rotation-Assisted Heating in SPIF of Ti-6Al-4V Titanium Alloy Sheet under Variable Oil Pressure. Metals 2022, 12, 113. [Google Scholar] [CrossRef]
  8. Puchlerska, S.; Żaba, K.; Pyzik, J.; Pieja, T.; Trzepieciński, T. Statistical Analysis and Optimisation of Data for the Design and Evaluation of the Shear Spinning Process. Materials 2021, 14, 6099. [Google Scholar] [CrossRef] [PubMed]
  9. Reddy, A.C. Conventional deep drawing vs incremental deep drawing. Available online: https://jntuhceh.ac.in/web/tutorials/faculty/1676_isf-process.pdf (accessed on 4 October 2022).
  10. Jewvattanarak, P.; Mahayotsanun, N.; Dohda, K.; Ngernbamrung, S.; Dohda, K. Tribological effects of chlorine-free lubricant in strip drawing of advanced high strength steel. Proc. Inst. Mech. Eng. Part J J. Eng. Tribol. 2016, 230, 974–982. [Google Scholar] [CrossRef]
  11. Lemu, H.G.; Trzepieciński, T. Numerical and Experimental Study of Frictional Behavior in Bending Under Tension Test. Strojniški vestnik—J. Mech. Eng. 2013, 59, 41–49. [Google Scholar] [CrossRef]
  12. Trzepieciński, T.; Fejkiel, R.; Kubit, A. Experimental evaluation of value of friction coefficient in the drawbead region. Zeszyty Naukowe Politechniki Rzeszowskiej Mechanika 2018, 35, 77–85. [Google Scholar] [CrossRef]
  13. Trzepieciński, T.; Lemu, H.G. Frictional Conditions of AA5251 Aluminium Alloy Sheets Using Drawbead Simulator Tests and Numerical Methods. Strojniški Vestnik—J. Mech. Eng. 2014, 60, 51–60. [Google Scholar] [CrossRef] [Green Version]
  14. Evin, E.; Tomáš, M. Influence of Friction on the Formability of Fe–Zn-Coated IF Steels for Car Body Parts. Lubricants 2022, 10, 297. [Google Scholar] [CrossRef]
  15. Shisode, M.P.; Hazrati, J.; Mishra, T.; de Rooij, M.; van den Boogaard, T. Modeling Mixed Lubrication Friction for Sheet Metal Forming Applications. Procedia Manuf. 2020, 47, 586–590. [Google Scholar] [CrossRef]
  16. Sulaiman, M.H.; Farahana, R.N.; Bienk, K.; Nielsen, C.V.; Bay, N. Effects of DLC/TiAlN-coated die on friction and wear in sheet-metal forming under dry and oil-lubricated conditions: Experimental and numerical studies. Wear 2019, 438, 203040. [Google Scholar] [CrossRef]
  17. Skoblik, R.; Wilczewski, L. Technologia metali. Laboratorium; Wydawnistwo Politechniki Gdańskiej: Gdańsk, Poland, 2006. [Google Scholar]
  18. Shisode, M.; Hazrati, J.; Mishra, T.; de Rooij, M.; ten Horn, C.; van Beeck, J.; van den Boogaard, T. Modeling boundary friction of coated sheets in sheet metal forming. Tribol. Int. 2021, 153, 106554. [Google Scholar] [CrossRef]
  19. Noder, J.; George, R.; Butcher, C.; Worswick, M.J. Friction characterization and application to warm forming of a high strength 7000-series aluminum sheet. J. Mater. Process. Technol. 2021, 293, 117066. [Google Scholar] [CrossRef]
  20. Gierzyńska, M. Tarcie, zużycie i smarowanie w obróbce plastycznej metali; Wydawnictwa Naukowo-Techniczne: Warszawa, Poland, 1983. [Google Scholar]
  21. Shisode, M.; Hazrati, J.; Mishra, T.; de Rooij, M.; van den Boogaard, T. Mixed lubrication friction model including surface texture effects for sheet metal forming. J. Mater. Process. Technol. 2021, 291, 117035. [Google Scholar] [CrossRef]
  22. Zhang, Q.; Mei, T.; Zhang, D.; Cao, M.; Han, B. Preparation of chemically etched surface texture and its friction characteristics in sheet forming. Procedia Manufacturing 2020, 50, 439–443. [Google Scholar] [CrossRef]
  23. Zabala, A.; Galdos, L.; Childs, C.; Llavori, I.; Aginagalde, A.; Mendiguren, J.; Saenz de Argandoña, E. The Interaction between the Sheet/Tool Surface Texture and the Friction/Galling Behaviour on Aluminium Deep Drawing Operations. Metals 2021, 11, 979. [Google Scholar] [CrossRef]
  24. Button, S.T. Tribology in Manufacturing Technology; Springer: Berlin, Germany, 2013; pp. 103–120. [Google Scholar]
  25. Hou, Y.K.; Yu, Z.Q.; Li, S.H. Galling failure analysis in sheet metal forming process. J. Shanghai Jiaotong Univ. 2010, 15, 245–249. [Google Scholar] [CrossRef]
  26. Pelcastre, L.; Hardell, J.; Prakash, B. Galling mechanisms during interaction of tool steel and Al–Si coated ultra-high strength steel at elevated temperature. Tribol. Int. 2013, 67, 263–271. [Google Scholar] [CrossRef]
  27. Podgornik, B.; Kafexhiu, F.; Kosec, T.; Jerina, J.; Kalin, M. Friction and anti-galling properties of hexagonal boron nitride (h-BN) in aluminium forming. Wear 2017, 388, 2–8. [Google Scholar] [CrossRef]
  28. Dharavath, B.; Varma, D.; Singh, S.K.; Naik, M.T. Understanding frictional behaviour of ASS316L in sheet metal forming. Mater. Today: Proc. 2021, 44, 2855–2858. [Google Scholar] [CrossRef]
  29. Zabala, A.; de Argandoña, E.S.; Cañizares, D.; Llavori, I.; Otegi, N.; Mendiguren, J. Numerical study of advanced friction modelling for sheet metal forming: Influence of the die local roughness. Tribol. Int. 2022, 165, 107259. [Google Scholar] [CrossRef]
  30. Xia, J.; Zhao, J.; Dou, S. Friction Characteristics Analysis of Symmetric Aluminum Alloy Parts in Warm Forming Process. Symmetry 2022, 14, 166. [Google Scholar] [CrossRef]
  31. Dou, S.; Xia, J. Analysis of Sheet Metal Forming (Stamping Process): A Study of the Variable Friction Coefficient on 5052 Aluminum Alloy. Metals 2019, 9, 853. [Google Scholar] [CrossRef] [Green Version]
  32. Yang, X.; Zhang, Q.; Zheng, Y.; Liu, X.; Politis, D.; El Fakir, O.; Wang, L. Investigation of the friction coefficient evolution and lubricant breakdown behaviour of AA7075 aluminium alloy forming processes at elevated temperatures. Int. J. Extrem. Manuf. 2021, 3, 025002. [Google Scholar] [CrossRef]
  33. Bellini, C.; Giuliano, G.; Sorrentino, L. Friction influence on the AA6060 aluminium alloy formability. Frattura ed Integrità Strutturale 2019, 49, 791–799. [Google Scholar] [CrossRef]
  34. Zavala, J.M.D.; Martínez-Romero, O.; Elías-Zúñiga, A.; Gutiérrez, H.M.L.; Vega, A.E.-d.l.; Taha-Tijerina, J. Study of Friction and Wear Effects in Aluminum Parts Manufactured via Single Point Incremental Forming Process Using Petroleum and Vegetable Oil-Based Lubricants. Materials 2021, 14, 3973. [Google Scholar] [CrossRef]
  35. Najm, S.M.; Paniti, I.; Trzepieciński, T.; Nama, S.A.; Viharos, Z.J.; Jacso, A. Parametric Effects of Single Point Incremental Forming on Hardness of AA1100 Aluminium Alloy Sheets. Materials 2021, 14, 7263. [Google Scholar] [CrossRef]
  36. Trzepieciński, T.; Najm, S.M.; Oleksik, V.; Vasilca, D.; Paniti, I.; Szpunar, M. Recent Developments and Future Challenges in Incremental Sheet Forming of Aluminium and Aluminium Alloy Sheets. Metals 2022, 12, 124. [Google Scholar] [CrossRef]
  37. Sigvant, M.; Pilthammar, J.; Hol, J.; Wiebenga, J.H.; Chezan, T.; Carleer, B.; van den Boogaard, T. Friction in sheet metal forming: Influence of surface roughness and strain rate on sheet metal forming simulation results. Procedia Manuf. 2019, 29, 512–519. [Google Scholar] [CrossRef]
  38. Shih, H.C.; Wilson, W.R.D. Effects of Contact Pressure and Strain on Friction in Sheet-Metal Forming©. Tribol. Trans. 1999, 42, 144–151. [Google Scholar] [CrossRef]
  39. ISO 6892-1:2009; Metallic Materials—Tensile Testing—Part 1: Method of Test at Room Temperature. International Organization for Standardization: Geneva, Switzerland, 2009.
  40. ter Haar, R. Friction in sheet metal forming, the influence of (local) contact conditions and deformation. Ph.D. Thesis, Universiteit Twente, Enschede, The Netherlands, 17 May 1996. [Google Scholar]
  41. Cillaurren, J.; Galdos, L.; Sanchez, M.; Zabala, A.; de Argandoña, S.; Mendiguren, J. Contact pressure and sliding velocity ranges in sheet metal forming simulations. In Proceedings of the 24th International Conference on Material Forming ESAFORM 2021, Liège, Belgium, 14–16 April 2021. [Google Scholar]
  42. Vollertsen, F.; Hu, Z. Tribological Size Effects in Sheet Metal Forming Measured by a Strip Drawing Test. Ann. CIRP 2006, 55, 291–294. [Google Scholar] [CrossRef]
  43. Kirkhorn, L.; Frogner, K.; Andersson, M.; Ståhl, J.E. Improved tribotesting for sheet metal forming. Procedia CIRP 2012, 3, 507–512. [Google Scholar] [CrossRef] [Green Version]
  44. Recklin, V.; Dietrich, F.; Groche, P. Influence of Test Stand and Contact Size Sensitivity on the Friction Coefficient in Sheet Metal Forming. Lubricants 2018, 6, 41. [Google Scholar] [CrossRef] [Green Version]
  45. Mizuno, T.; Okamoto, M. Effects of Lubricant Viscosity at Pressure and Sliding Velocity on Lubrication Condition in the Compression Friction Test on Sheet Metals. J. Lubr. Technol. 1982, 104, 53–59. [Google Scholar] [CrossRef]
  46. Sedlaček, M.; Gregorčič, P.; Podgornik, B. Use of the Roughness Parameters Ssk and Sku to Control Friction—A Method for Designing Surface Texturing. Tribol. Trans. 2017, 60, 260–266. [Google Scholar] [CrossRef]
  47. Sedlaček, M.; Vilhena, L.M.S.; Podgornik, B.; Vižintin, J. Surface topography modelling for reduced friction. Strojniški Vestnik—J. Mech. Eng. 2011, 57, 674–680. [Google Scholar] [CrossRef] [Green Version]
  48. Sedlaček, M.; Podgornik, B.; Vižintin, J. Planning surface texturing for reduced friction in lubricated sliding using surface roughness parameters skewness and kurtosis. Proc. Inst. Mech. Eng. Part J: J. Eng. Tribol. 2012, 226, 661–667. [Google Scholar] [CrossRef]
  49. Alam, M.; Akram, D.; Sharmin, E.; Zafar, F.; Ahmad, S. Vegetable oil based eco-friendly coating materials: A review article. Arab. J. Chem. 2014, 7, 469–479. [Google Scholar] [CrossRef]
  50. Trzepieciński, T.; Fejkiel, R. On the influence of deformation of deep drawing quality steel sheet on surface topography and friction. Tribol. Int. 2017, 115, 78–88. [Google Scholar] [CrossRef]
  51. Lewis, G.A. Optimization Methods. In Encyclopedia of Pharmaceutical Technology, 2nd ed.; Swarbrick, J., Boylan, J.C., Eds.; Marcel Dekker: New York, NY, USA, 2002; pp. 1922–1937. [Google Scholar]
  52. Singh, S.; Singla, Y.P.; Abora, S. Statistical, diagnostic and response surface analysis of nefopam hydrochloride nanospheres using 35 Box-Behnken design. Int. J. Pharm. Pharmateutical Sci. 2016, 7, 89–101. [Google Scholar]
  53. Semiatin, S.L. Selection and Use of Lubricants in Forming of Sheet Metal. In Metalworking: Sheet Forming; Semiatin, S.L., Ed.; ASM International: Materials Park, OH, USA, 2006; Volume 14B, pp. 248–264. [Google Scholar] [CrossRef]
  54. Bay, N.; Bech, J.I.; Andreasen, J.L.; Shimizu, I. Studies on Micro Plasto Hydrodynamic Lubrication in Metal Forming. In Metal Forming Science and Practice; Elsevier Science: Amsterdam, The Netherlands, 2002; pp. 115–134. [Google Scholar] [CrossRef]
  55. Sedlaček, M.; Podgornik, B.; Vižintin, J. Influence of surface preparation on roughness parameters, friction and wear. Wear 2009, 266, 482–487. [Google Scholar] [CrossRef]
  56. Sedlaček, M.; Podgornik, B.; Vižintin, J. Correlation between Standard Roughness Parameters Skewness and Kurtosis and Tribological Behaviour of Contact Surfaces. Tribol. Int. 2012, 48, 102–112. [Google Scholar] [CrossRef]
  57. Gadelmawla, E.S.; Koura, M.M.; Maksoud, T.M.A.; Elewa, I.M.; Soliman, H.H. Roughness Parameters. J. Mater. Process. Technol. 2002, 123, 133–145. [Google Scholar] [CrossRef]
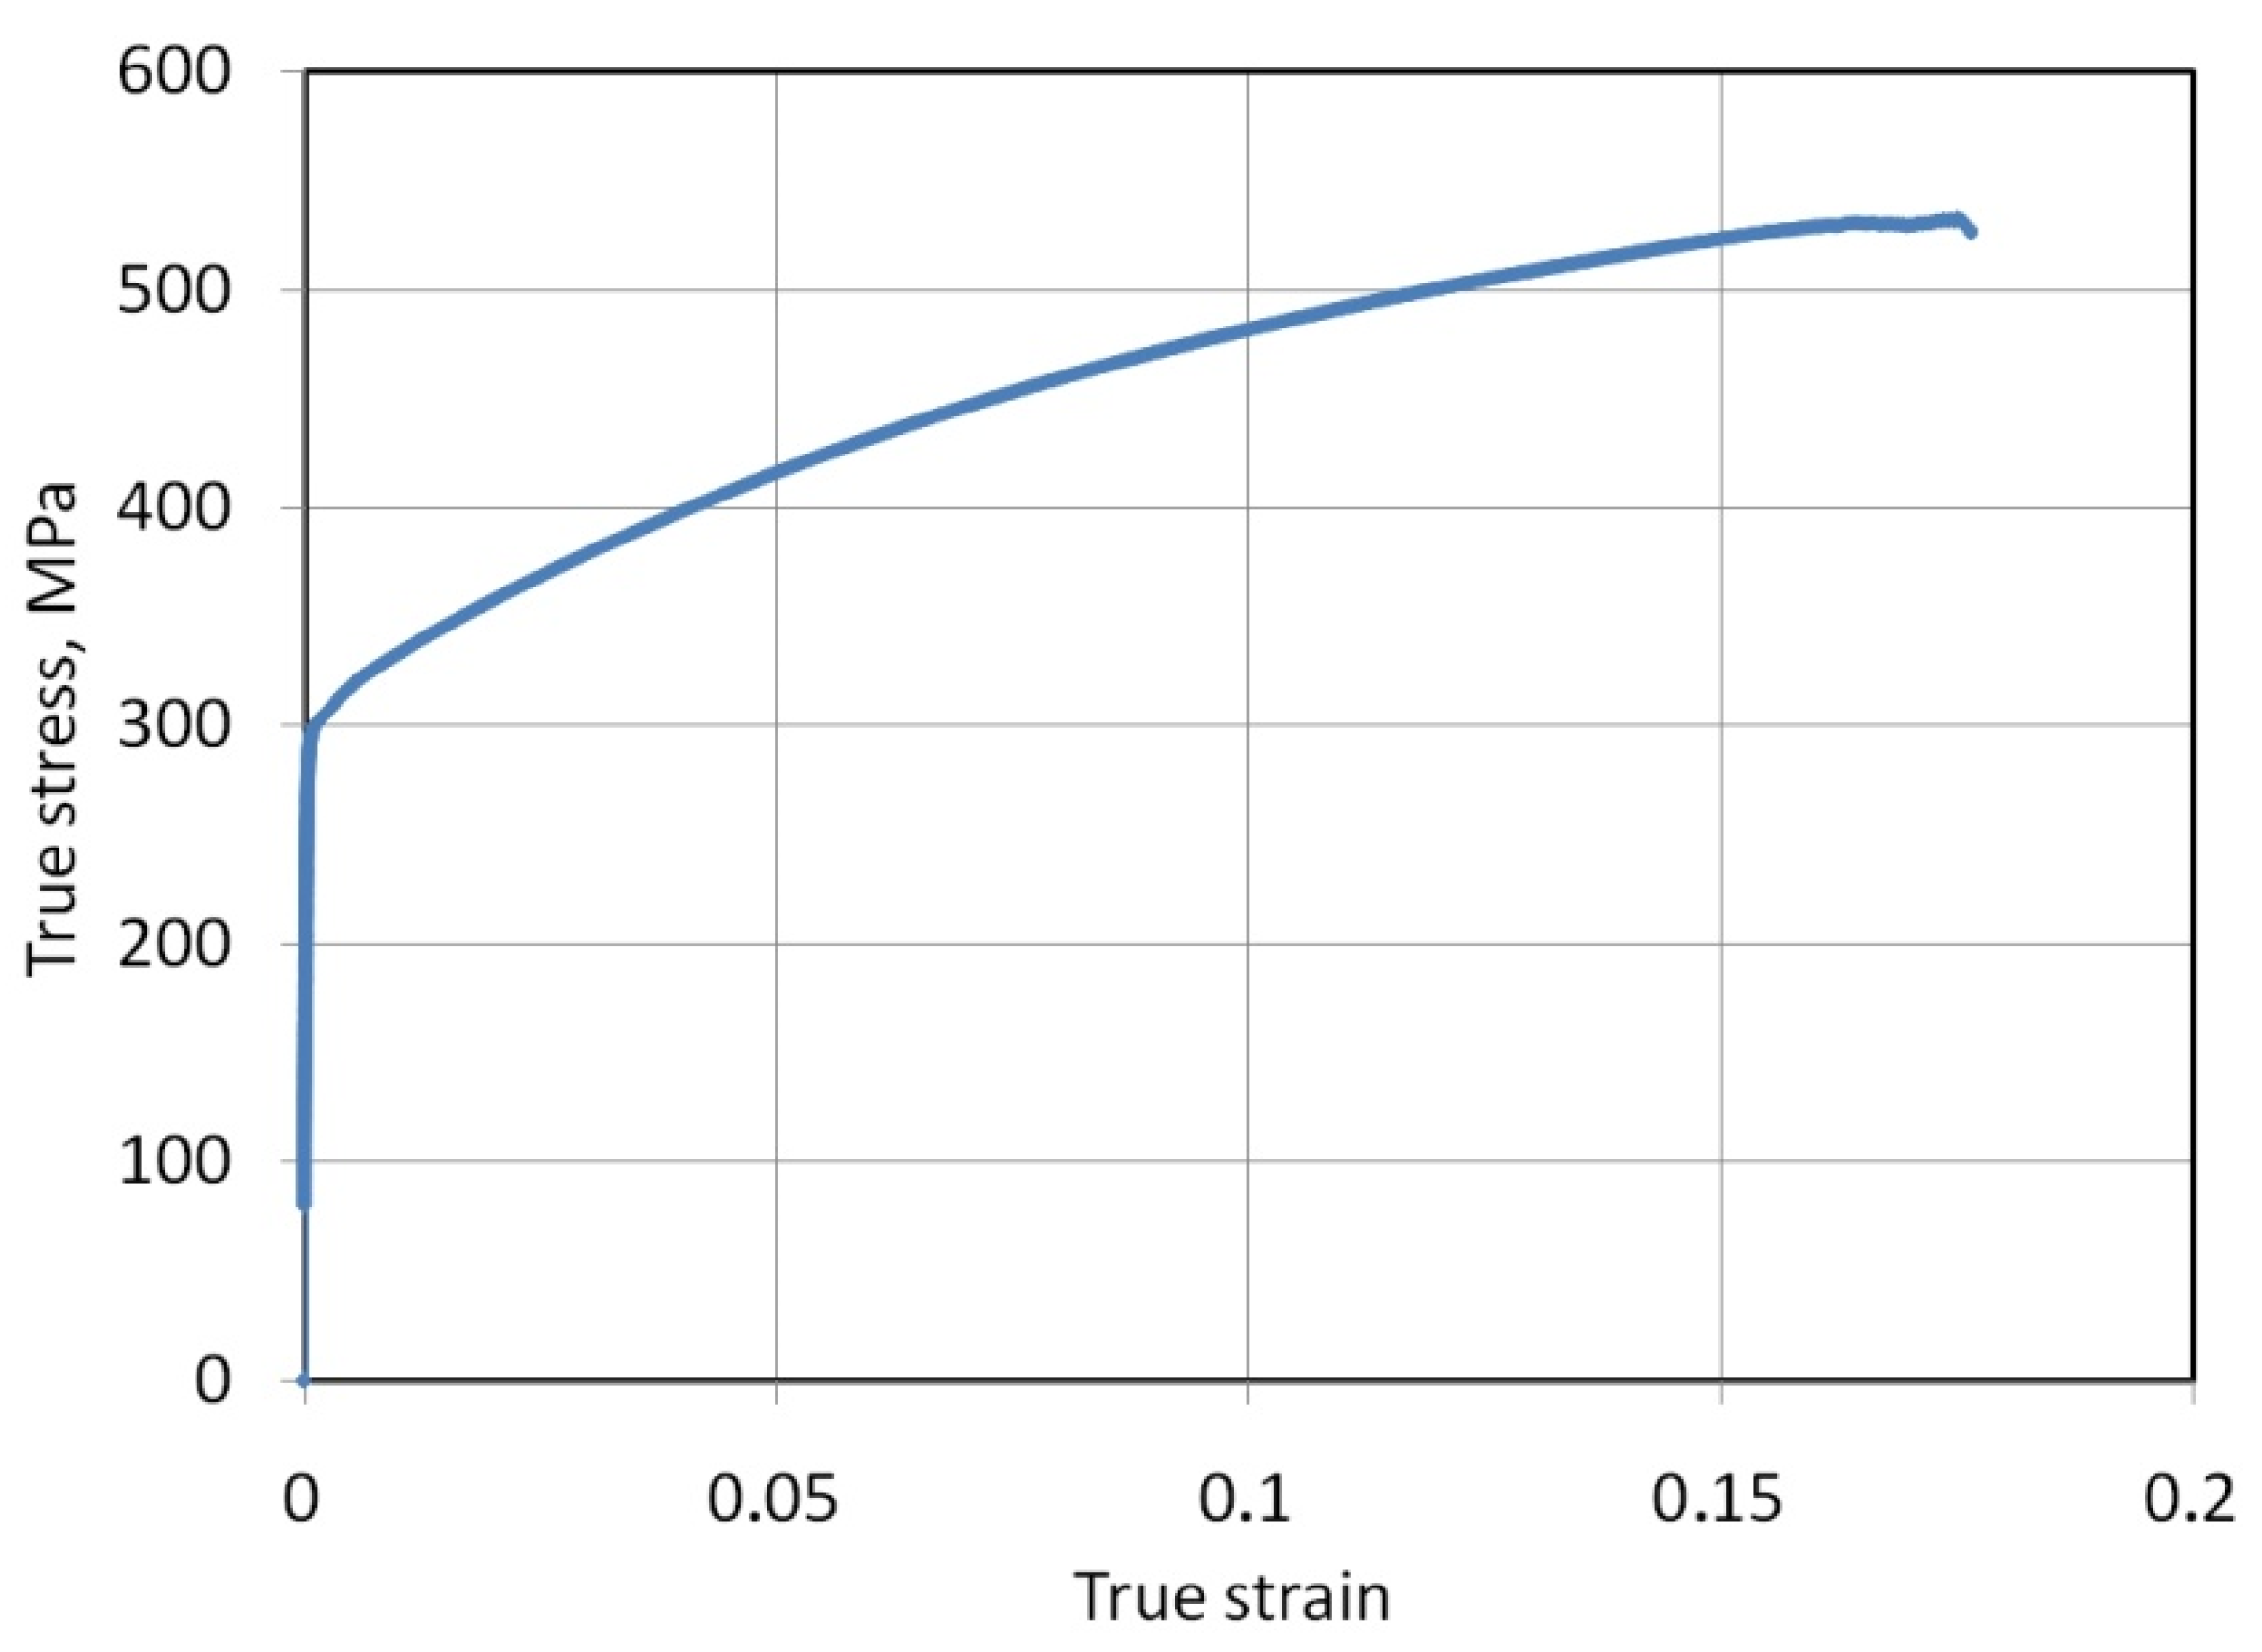
Figure 1. True stress–true strain curves for the EN AW-2024-T3 Alclad sheets.
Lubricants 11 00028 g001
Figure 2. Profile height of the as-received surface of EN AW-2024T3 Alclad sheets.
Lubricants 11 00028 g002
Figure 3. Schematic diagram of the tribological simulator.
Lubricants 11 00028 g003
Figure 4. Photograph and dimensions (in mm) of the test specimen.
Lubricants 11 00028 g004
Figure 5. Surface topography and selected surface roughness parameters of the counter-samples.
Lubricants 11 00028 g005
Figure 6. Effect of mean contact pressure on the COF.
Lubricants 11 00028 g006
Figure 7. (a) Predicted versus actual response for COF and (b) probability plot of externally studentised residuals.
Lubricants 11 00028 g007
Figure 8. DFBETAS with reference to run number for COF.
Lubricants 11 00028 g008
Figure 9. Interaction between lubricant viscosity and mean contact pressure affecting the COF.
Lubricants 11 00028 g009
Figure 10. Effect of mean contact pressure on the effectiveness of lubrication.
Lubricants 11 00028 g010
Figure 11. Effect of mean contact pressure on the change in mean roughness, Ra.
Lubricants 11 00028 g011
Figure 12. Effect of mean contact pressure on the change in skewness, Rsk.
Lubricants 11 00028 g012
Figure 13. (a) Predicted versus actual response for the skewness (Rsk) parameter and (b) normal % probability plot of externally studentised residuals.
Lubricants 11 00028 g013
Figure 14. DFFITS with reference to run number for skewness (Rsk).
Lubricants 11 00028 g014
Figure 15. Interaction between lubricant viscosity and mean contact pressure affecting the skewness (Rsk).
Lubricants 11 00028 g015
Figure 16. Effect of mean contact pressure on the change in kurtosis (Rku).
Lubricants 11 00028 g016
Figure 17. Profile height of the surface after the friction process: lubrication—machine oil LAN46, mean contact pressure, p = 9.5 MPa.
Lubricants 11 00028 g017
Figure 18. (a) Predicted versus actual response for kurtosis (Rku) and (b) normal % probability plot of externally studentised residuals.
Lubricants 11 00028 g018
Figure 19. Interaction between lubricant viscosity and mean contact pressure affecting the kurtosis (Rku).
Lubricants 11 00028 g019
Table 1. Basic mechanical parameters of the EN AW-2024-T3 Alclad sheets.
Sample OrientationE, GPaRp0.2, MPaRm, MPaA, %
73.36302.5450.116.5
Table 2. Basic physical properties of the oils used.
OilKinematic Viscosity η, mm2/sViscosity IndexDensity, kg/m3
LAN4643.994875
LHV2221.9321862.6
DELVAC 134014699897
Table 3. Results of the ANOVA for COF.
SourceSum of SquaresdfMean SquareF-Valuep-ValueMeaning
Model0.029950.006023.15<0.0001significant
A—η0.015410.015459.85<0.0001
B—p0.010210.010239.57<0.0001
AB0.000210.00020.85760.3667
A20.007610.007629.65<0.0001
B23.567 × 10613.567 × 1060.01380.9077
Residual0.0046180.0003
Cor Total0.034523
Table 4. Fit statistics of the regression model for COF.
Std. Dev.MeanC.V. %R2Adjusted R2Predicted R2Adequacy Precision
0.01610.18968.470.86540.82800.743416.8170
Table 5. Results of ANOVA for the Rsk.
SourceSum of SquaresdfMean SquareF-Valuep-ValueMeaning
Model0.464350.09296.410.0014significant
A—η0.133710.13379.220.0071
B—p0.078410.07845.410.0319
AB0.051010.05103.520.0769
A20.175110.175112.080.0027
B20.004810.00480.33230.5714
Residual0.2609180.0145
Cor Total0.725223
Table 6. Fit statistics of the regression model for Rsk.
Std. Dev.MeanC.V. %R2Adjusted R2Predicted R2Adequacy Precision
0.1204−0.651418.480.64030.54040.36659.5759
Table 7. Results of the ANOVA for Rku.
SourceSum of SquaresdfMean SquareF-Valuep-ValueMeaning
Model22.7954.568.650.0003significant
A—η3.6313.636.890.0172
B—p1.8311.833.470.0791
AB0.102310.10230.19420.6647
A218.05118.0534.27<0.0001
B21.7711.773.350.0836
Residual9.48180.5268
Cor Total32.2823
Table 8. Fit statistics of the regression model for Rku.
Std. Dev.MeanC.V. %R2Adjusted R2Predicted R2Adequacy Precision
0.72583.8418.900.70620.62460.439110.282
Disclaimer/Publisher’s Note: The statements, opinions and data contained in all publications are solely those of the individual author(s) and contributor(s) and not of MDPI and/or the editor(s). MDPI and/or the editor(s) disclaim responsibility for any injury to people or property resulting from any ideas, methods, instructions or products referred to in the content.