Article

Numerical Investigation of Bump Foil Configurations Effect on Gas Foil Thrust Bearing Performance Based on a Thermos-Elastic-Hydrodynamic Model

1
School of Energy and Power Engineering, Beihang University, Beijing 100191, China
2
The Key Laboratory of Solar Thermal Energy and Photovoltaic System, IEE-CAS, Beijing 100190, China
3
Ningbo Hudu Energy Technology Co., Ltd., Ningbo 315000, China
4
Zhengzhou Aerotropolis Institute of Artificial Intelligence, Zhengzhou 451162, China
*
Author to whom correspondence should be addressed.
Lubricants 2023, 11(10), 417; https://doi.org/10.3390/lubricants11100417
Submission received: 4 September 2023 / Revised: 19 September 2023 / Accepted: 21 September 2023 / Published: 22 September 2023
(This article belongs to the Special Issue Advances in Bearing Lubrication and Thermodynamics 2023)

Abstract

:
The performance of gas foil thrust bearings is critical to the successful design and operation of the high axial load rotatory machines that employ gas foil bearings. However, our understanding of gas foil thrust bearings remains incomplete. To enhance our understanding and predict the performance of gas foil thrust bearings, we have established a detailed three-dimensional thermo-elastic-hydrodynamic model of a gas foil thrust bearing based on a fluid-thermal-structure interaction approach in this study. To validate the accuracy of our model, a gas foil thrust bearing test rig was developed. Moreover, we present a numerical investigation of the influence of bump foil configurations on gas foil thrust bearing performance. The results show that the gas foil thrust bearing that fixes the bump foil at the trailing edge and splits the bump foil into several strips exhibits a 36.4% increase in load capacity compared to the gas foil thrust bearing that fixes a whole piece of bump foil at the leading edge. Fixing the bump foil at the trailing edge and splitting it into several strips effectively decreases power loss and reduces the risk of bearing thermal failure.

1. Introduction

With the increasing demands of high-speed rotating machinery, the application of conventional oil-lubricated bearings is increasingly limited. In comparison, gas foil bearings (GFBs) utilize ambient air as a lubricant, offering numerous advantages. GFBs require minimal maintenance, can operate at high speeds and temperatures [1], and have been reported to have a DN (shaft diameter in millimeters multiplied by shaft rotational speed in rev/min) limit of about 4.56 × 10⁶ [2,3]. As a result, GFBs have gained significant popularity in recent years and are widely utilized in various high-speed rotating shaft systems, including air cycle machines, turboexpanders, compressors, and small microturbine systems [4,5,6,7]. After decades of development, GFBs have made great progress in design and application. However, the understanding of gas foil thrust bearing (GFTB) supporting axial load remains incomplete, as most of the interest and development has been attracted to gas foil journal bearing (GFJB) supporting radial load and controlling the rotor orbit [8]. Then, the purpose of the current study is to promote the research of GFTB.
Heshmat et al. [9] conducted numerical research on GFTB performance and obtained the optimum geometry through parametric studies of structural variables. However, they simplified the bump structure as a uniform elastic foundation and overlooked the coulomb friction and the effect of the top foil. Iordanoff [10] developed a more comprehensive GFTB model that considered the coulomb friction of the bump structure in order to predict GFTB performance. Experimental research was also conducted on the load capacity of GFTBs. The results indicated that free-fixed-end bumps had a higher stiffness coefficient and the predictions for heavy loads agreed well with experimental data. However, the stiffness distribution between the welded bump and the free bump was simplified as the linear distribution, and the effect of the top foil was still not considered. Heshmat et al. [11] conducted numerical investigations on the load performance of GFTBs by coupling Finite Element and Finite Difference methods. The top foil was regarded as a part of bearing compliance; it was proved that it had an essential effect on the performance of GFTB. However, the complex bump structure was assumed as an independent spring support. Park et al. [12] also coupled Finite Element and Finite Difference methods to predict the static and dynamic performance of tilted GFTB. To improve the accuracy of the bump structure, the interaction between bumps was considered. However, the effect of the top foil was ignored. Gad et al. [13] introduced a more comprehensive structural stiffness model for the foil structure of generation II GFTB. The model considered not only the interaction between bumps, but also the possibility of the rigid bearing surface and the flat segment between bumps. The effect of two different bump strip arrangements on the performance of generation II GFTB was investigated. However, the deflection of the top foil relative to bumps was simplified and the top foil sagging was neglected. Xu et al. [14] focused on the effect of top foil sagging on GFTB performance. The simulation results revealed that large top foil sagging caused high power loss and small minimum film thickness. The thicker top foil was proved to decrease the effect of top foil sagging and achieved better performance of GFTB. However, each bump was simplified, as many springs attached to the top foil computational node and the interaction of bumps was ignored. In order to analyze arbitrarily shaped foils, Xu et al. [15] presented a comprehensive model of GFTBs that considered both bump interaction and top foil sagging. They adopted the assumption of isothermal ideal gas in the compressible Reynolds equation. The numerical results demonstrated that the configuration of the bump foils significantly influenced the load capacity of GFTBs. However, the aforementioned models assumed a constant temperature, resulting in inaccurate predictions of GFTB performance.
To investigate the temperature effect on GFTB performance, various simulated thermal field models were developed. Bruckner [16] presented a simple thermohydrodynamic (THD) model of GFTB to study the thermal behavior. However, the thrust runner and foil structure were lumped together and treated as a single heat transfer mechanism, and the foil structure was considered as a compliant foundation with a linear stiffness distribution. Lee et al. [17] developed a three-dimensional THD model of GFTB with radially arranged bump foils. The temperature distribution of the thrust runner, top foil, bump foils, and other bearing parts was investigated using the heat balance equation with surroundings. However, each individual bump was simplified as a lumped thermal resistance in the temperature field and an independent support spring in the foil structural field. Gad et al. [18], on the other hand, utilized a 2D compressible Reynolds equation that considered the effects of centrifugal forces to model fluid flow. They employed the Couette Approximation to analyze the temperature distribution. The simulation results revealed that the side-leakage heat transfer had relatively poor effects. However, the inlet temperature was assumed to be constant due to the adoption of the Couette Approximation. Xu et al. [19] presented a 3D THD model that considered real gas effects and flow turbulence. They calculated and compared the performance of hydrostatic thrust foil bearings using two different types of lubricants. However, the temperature of each individual half bump arc was assumed to be consistent, as each half bump arc was simplified as a lumped thermal resistance in the temperature field. Lehn et al. [20] derived a comprehensive 3D thermo-elastic-hydrodynamic (TEHD) model for GFTB and a detailed shell model for the foil structure. They also adopted the assumption of a thermal resistance for a half bump arc. An exhaustive thermal analysis was conducted for GFTB and the thrust disk. The results demonstrated that the deformation of the thrust disk was the source of thermal runaway under high load and high-speed conditions. However, these aforementioned models used the 2D Reynolds equation to simulate the flow field and assumed constant fluid properties throughout the film thickness.
Most recently, the application of the fluid-thermal-structure interaction (FTSI) approach in TEHD has significantly improved the accuracy of predicting GFTB performance. This approach involves solving the full Navier–Stokes equations to model fluid flow, considering frictional contact, bump interaction, and top foil sagging in the foil structure model, and solving the 3D energy equation to investigate heat transfer. Liu et al. [21] utilized the FTSI approach to examine the impact of boundary pressure on GFTB performance and elucidate the heat flux transfer path. The same approach was employed to study the mechanism of thermal seizures and failure behavior in GFTB [22], demonstrating that an additional forced cooling flow can effectively prevent thermal failure. However, these studies focused only on the effects of boundary pressure and additional forced cooling flow on fluid-thermal-structure performance. Comprehensive parametric studies on GFTB performance are yet to be completed for obtaining more accurate results.
In this study, we present a comprehensive 3D TEHD model of GFTB based on the FTSI approach to investigate the impact of bump foil configurations on GFTB performance. Variation in fluid properties of gas film, bump interaction and top foil sagging are taken into consideration. The paper is organized as follows. Firstly, a description of the computational domains and boundary conditions used in the model is presented. Secondly, the experimental test and model validation is conducted to ensure its accuracy and reliability. Finally, load capacity and thermal characteristic of GFTBs with four different bump foil configurations are analyzed.

2. Numerical Method and Experimental Validation

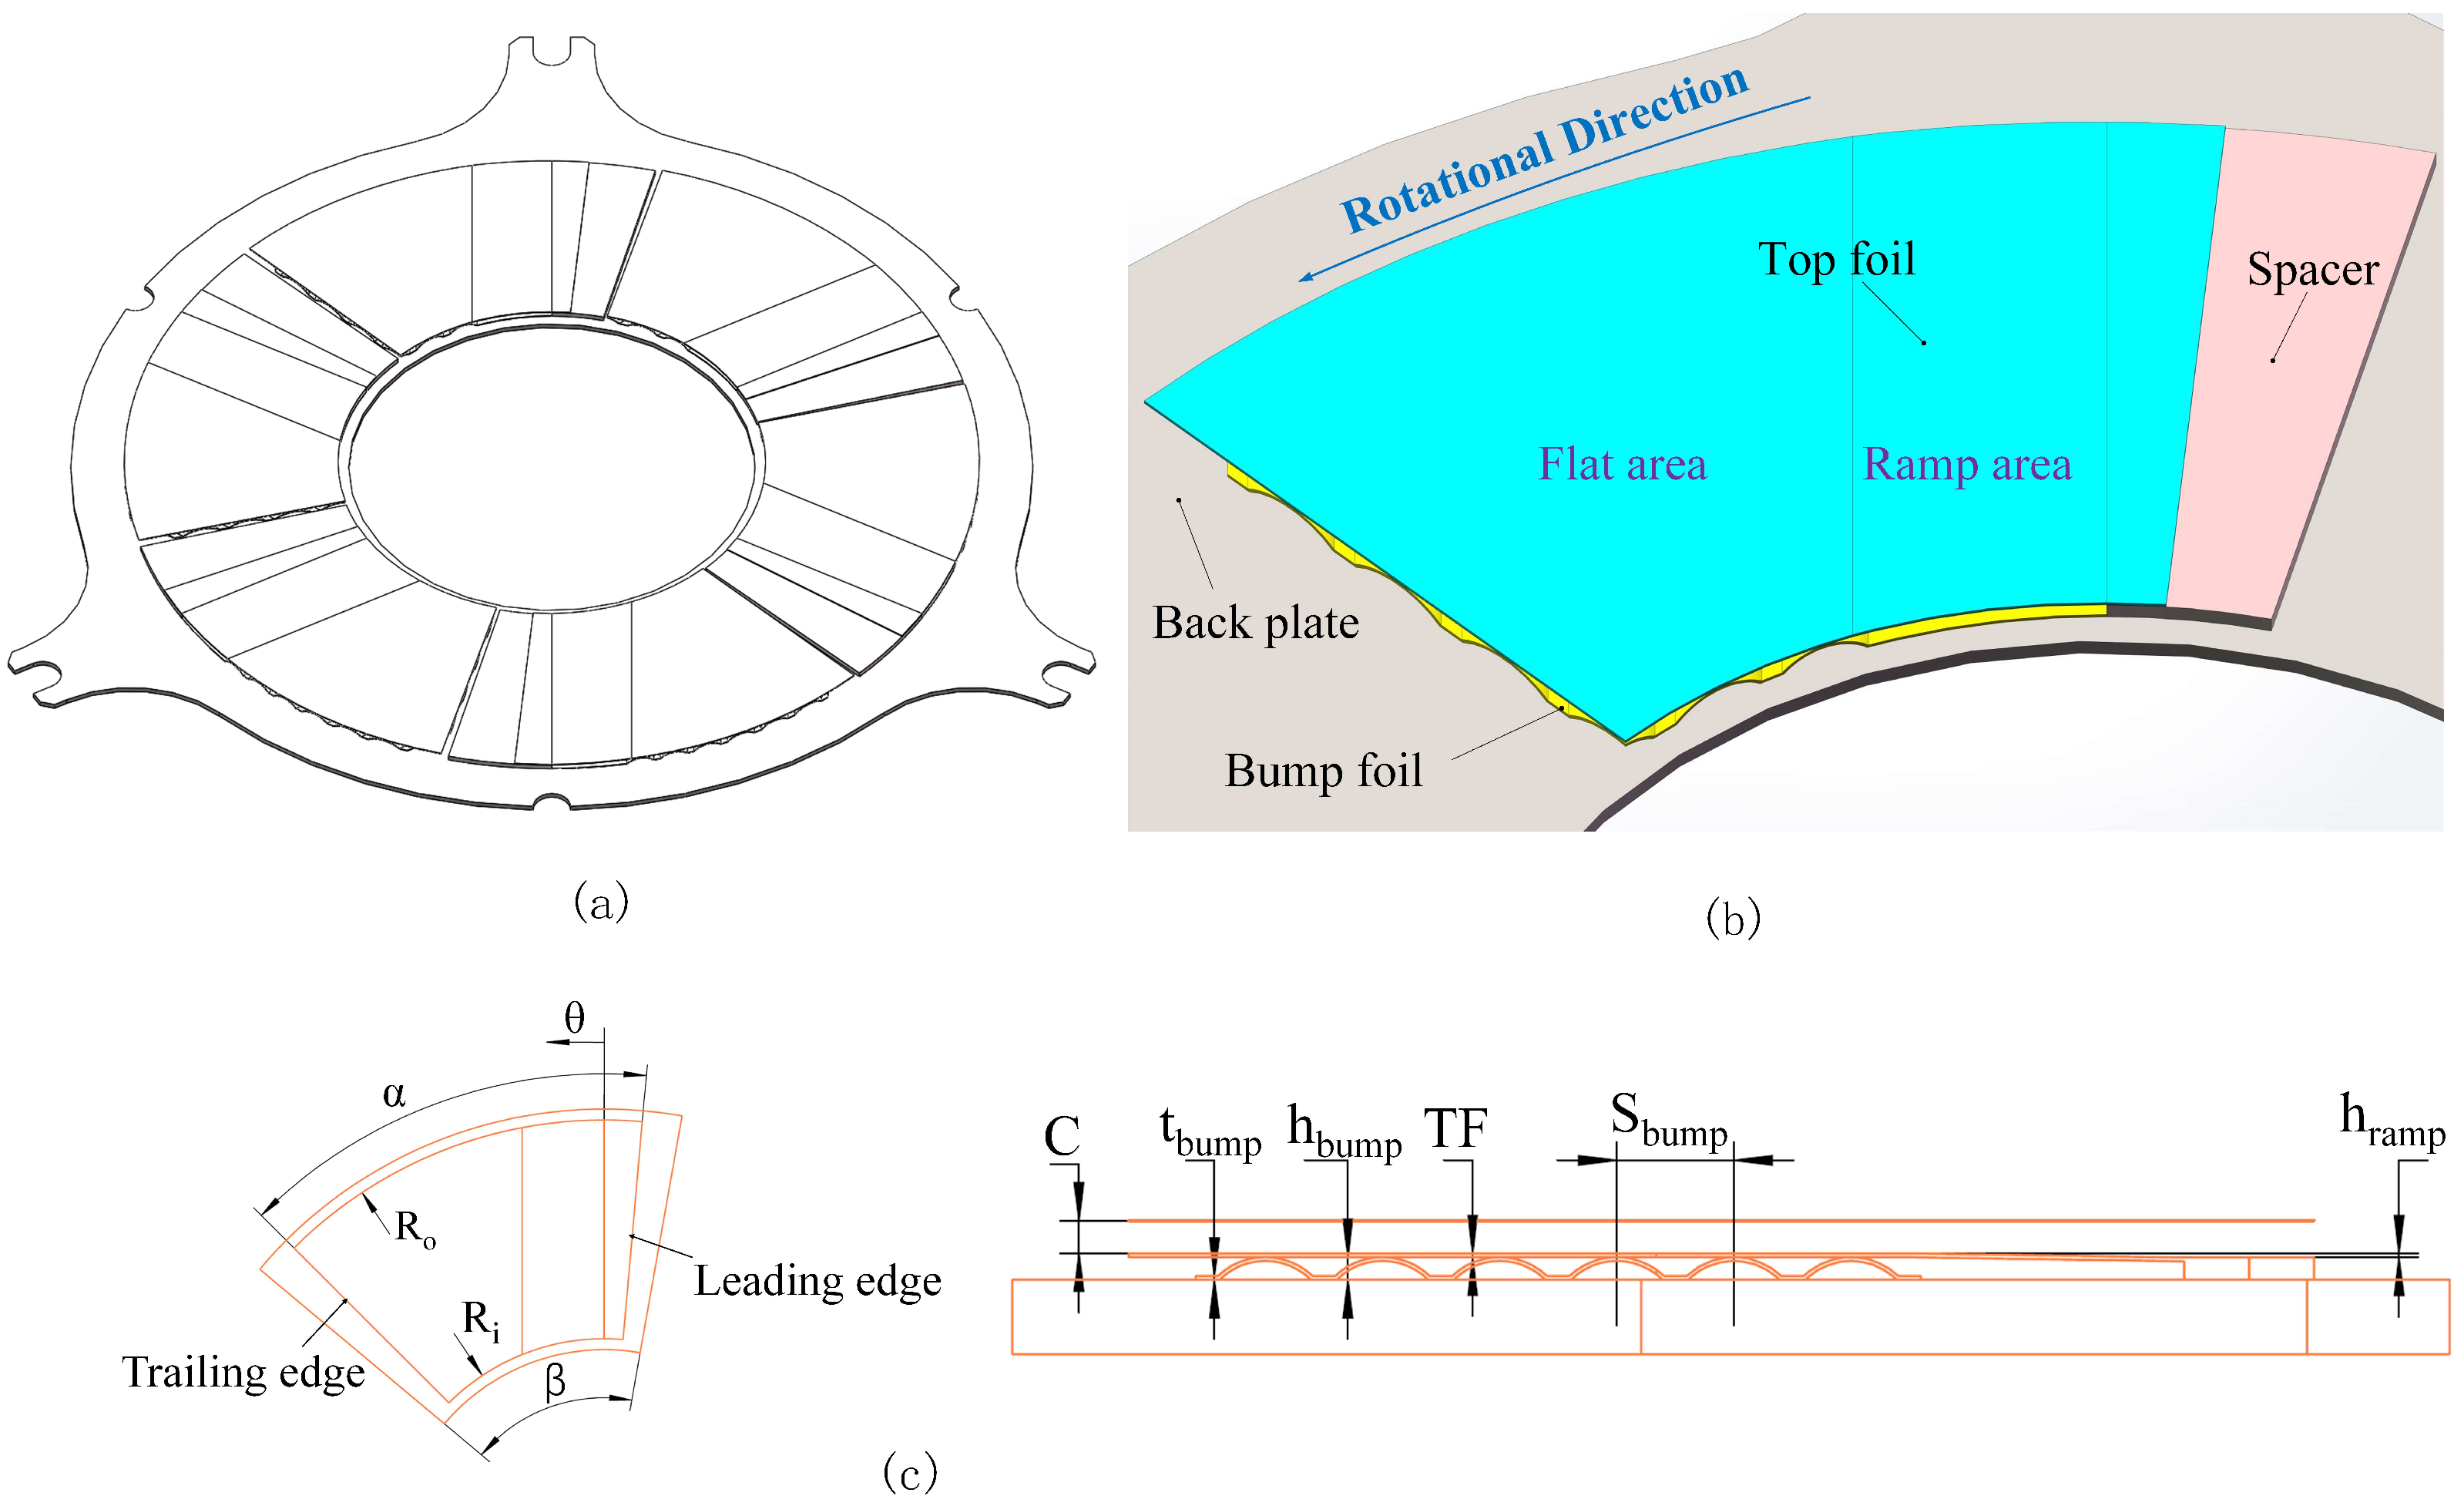
2.1. Description of GFTB and Bump Foil Configurations

The general GFTB structure used in this study is shown in Figure 1a. The bearing consists of six pads, with a pad angle of 60° and a top foil angle of 45°. The remaining space is utilized for welding and accommodating manufacturing errors. The specific structure of GFTB is shown in Figure 1b. Each pad comprises a top foil, a single bump foil and a spacer. The spacer is responsible for controlling the ramp height of the GFTB. The top foil is securely attached to the spacer through spot welding and further connected to the back plate through spot welding as well. The bump foil is also spot-welded to the back plate. The installation position of the bump foil is determined through bearing design, and its geometry is based on the specifications outlined in [23]. The geometric details and material properties of the GFTB are shown in Figure 1c and summarized in Table 1. Due to the deformation of the foil structure, the film thickness varies across the flat surface of the bearing. For the sake of convenience in research, the nominal clearance is used to describe the bearing capacity. The nominal clearance is defined as the distance between the thrust collar surface and the top foil (undeformed).
In order to investigate the impact of bump foil configuration on GFTB performance, four different bump foils are designed and labeled as bearing 1 to 4, as illustrated in Figure 2. All four configurations share the same bump foil shape parameters, as detailed in Table 1. In bearing 1 and 3, the bump foil is fixed on the leading edge of the flat area, while in bearing 2 and 4, it is fixed on the trailing edge. Additionally, bearing 1 and 2 have a single-piece bump foil, whereas in bearing 3 and 4, the bump foil is divided into three independent, same-width strips.

2.2. Computational Mode and Boundary Conditions

In this study, the commercial software ANSYS is utilized for simulation purposes. Figure 3 illustrates the information exchange process between the solvers of the TFSI approach. The calculation procedure is as follows: Firstly, the Computational Fluid Dynamics (CFD) solver calculates the hydrodynamic pressure and temperature data on the coupling surface. These data are then transferred to the structural model. Next, the Finite Element Method (FEM) solver evaluates the node displacement and heat flux of the foil structure. These results are sent back to the fluid model. Within each coupling iteration steps, both the CFD solver and FEM solver undergo multiple sub-iterations to achieve a convergence in their respective domains. Once the convergence requirements are met, the calculation proceeds to the next coupling iteration step. This process continues until the desired results are obtained.
The governing equations are presented as follows. The continuity equation is written as:
ρ t + · ρ U = 0
where the ρ and U are the density and velocity vector, respectively.
The momentum equation is written as:
( ρ U ) t + ρ U · U = P · τ + F e
where P is the pressure, τ is the stress tensor and F e is the external force.
The energy equation in fluid domain is written as:
( ρ c p T ) t + · ρ U c p T = · λ f T + Q e
where c p is the specific heat capacity, T is the absolute temperature, λ f is the fluid thermal conductivity and Q e is the external heat source.
The energy equation in the structure domain is written as:
· λ s T = 0
where λ s is the structure thermal conductivity.
The fluid is treated as the ideal gas, and the physics of hydrodynamic film in the fluid domain is described by the Reynolds-averaged Navier–Stokes equations. Second-order upwind space discretization is employed for the spatial discretization, and second-order backward Euler discretization is applied for the temporal discretization. The k-ω based SST turbulent model is employed and validated to achieve more accurate simulated results [24]. As shown in Figure 4, the boundary condition for the inner and outer diameter surfaces of the fluid domain are set to “opening” to allow the bearing to entrain the ambient gas from the outside. A no-slip and moving wall boundary at a constant angular velocity is applied to the surface of the thrust disk. The thrust disk is treated as a thermal convection boundary, but its thermal convection coefficient is determined using a forced convection model [22]. Additionally, a stationary no-slip wall boundary condition is adopted for the coupling surface. The model incorporates rotational periodicity boundary conditions at both ends of the domain sector to simulate the entire bearing in the fluid domain.
In the structure model, hexahedron solid element 185 is used to accurately represent the GTFB foils, with each foil consisting of two layers of solid elements. To establish the contact model within the foil structure, contact 174 elements and target 170 elements are employed. The augmented Lagrange method is utilized to determine the contact status and frictional forces between the foils and back plate. The contact and friction equations are written as:
F N = F K N · K N · Δ + λ 0
f T = μ f · F N
where F N is the normal contact force, F K N is the normal contact stiffness factor, K N is the normal contact stiffness, Δ is the penetration tolerance, λ 0 is an additional term reducing the sensitivity of the normal contact force to the normal contact stiffness, f T is the tangential friction force and μ f is the friction coefficient.
The normal contact stiffness factor is set to 0.1 for better convergence, as a large deformation effect is active in the simulation. The friction coefficient between the foils and back plate is set to 0.1 according to previous studies [25,26]. Since the simulation considers the contact status and frictional forces, the structure model exhibits highly nonlinear behavior. Therefore, the full Newton–Raphson solution is employed to solve the structure model. As Figure 1b, Figure 2 and Figure 5 showed, the spacer and back plate are treated as fixed rigid bodies, while the fixed edges of the foils are set as fixed boundaries. A natural convection model is used to calculate the thermal convection coefficient of the foil surface. The contact region is set as a thermal contact boundation. The remaining surfaces of the foil structure, the spacer and the back plate are treated as thermal convection boundaries, and a natural convection model is utilized to calculate the thermal convection coefficient. The thrust disk is also treated as a thermal convection boundary, but its thermal convection coefficient is determined using a forced convection model [22]. The ambient gas is the ideal gas of 25 °C and 1 atm. The model also incorporates rotational periodicity boundary conditions at both ends of the domain sector to simulate the entire bearing in sturcture domain. The detailed boundary conditions are listed in Table 2. In additional, the initial temperature of both the fluid domain and structure domain is 25 °C, and the initial gas pressure is 1 atm.
In this paper, the structured meshes are used for all fluid and structure domains. The determination of grid independence is based on the load capacity as the criterion. As Figure 6 showed, the number of meshes is increased until the load capacity converges. For the fluid domain, a mesh number of 1.2 million is selected, while for the structure domain, it ranges from 30,000 to 33,000 depending on the specific bump foil configuration, and Figure 7 illustrates the part of structure mesh for bearing 1. To ensure convergence, the RMS residual value in the fluid domain is set to 1 × 10⁻⁵. Additionally, a coupling data transfer convergence target of 0.01 is set to guarantee accurate calculations within each coupling iteration step. A workstation with 64 cores is used for computations, and each simulation case requires approximately 40 h of computational time.

2.3. Experimental Validation

To validate the efficacy of the computational model, a GFTB test rig was designed and experiments were conducted. As illustrated in Figure 8a, the left side of the rig accommodates the drive unit. The thrust disk is mounted on a high-speed motor, and the speed is adjusted using a frequency converter. On the right side of the test rig, the loading and measurement components are situated. The test GTFB is installed on the bearing housing and connected to the bearing housing shaft. The shaft is supported by two gas hydrostatic bearings with different diameters, which facilitate minimal resistance in shaft movement and rotation. This setup allows for highly accurate drag torque measurements. The drag torque is measured using a force transducer, and a torque measuring rod is installed on the side of the bearing housing to connect with the force transducer. Figure 8b illustrates that the load is adjusted by regulating the pressure in the pressure chamber. The adjustment of the load is expressed by high-pressure air ejected from gas hydrostatic bearing nozzles, which form hydrostaic gas film between the gas hydrostatic bearing surface and the bearing housing shaft surface. Some of the air escapes to the external atmosphere through the bearing clearance, while the rest enters the pressure chamber along the bearing clearance. The pressure chamber is connected to the external atmosphere via a pressure regulator. The piston surface of the bearing housing shaft is designed with two gas hydrostatic bearings of different diameters. Consequently, an increase in pressure within the pressure chamber leads to an increase in the load acting on the piston surface.
Bearing 1 was selected for the model validation, and the actual bearing 1 is depicted in Figure 9. The numerical results of the drag torque, obtained at a rotational speed of 30,000 revolutions per minute (rpm), were compared with the experimental results in Figure 10. The numerical results exhibit a good agreement with the experimental data for thrust loads below 60 N. However, a notable disparity in drag torque suddenly emerges at higher thrust loads, which can be attributed to the rubbing contact between the top foil and the thrust disk during the test [10,27]. The maximum thrust load tested can be considered as 72 N, since the test drag torque increases significantly when the thrust load exceeds this value. Additionally, the maximum-tested thrust load closely approximates the predicted thrust load at the nominal thickness of 5 μm. This observation demonstrates the reasonableness of predicting the maximum load at a minimum film thickness of 5 μm [5,28,29]. Hence, the model is deemed valid for predicting the performance of the GFTB.

3. Results and Discussion

3.1. Load Capacity

Figure 11 illustrates the load capacity of GFTBs at a rotational speed of 30,000 rpm for four different bump foil configurations. It is apparent that the chosen bump foil configurations have a significant impact on the bearing performance. Specifically, when the nominal clearance is below 10μm, bearings with the bump foil fixed at the pad trailing edge (bearing 2 and 4) exhibit a higher load capacity compared to bearing 1 and 3. According to the above section, the minimum nominal clearance of the gas film in this study is set at 5 μm. Table 3 presents the maximum values of bearing capacity loss at the nominal clearance of 5 μm. The results demonstrate a 20.8% increase in the maximum load capacity of bearing 3 compared to bearing 1. Moreover, bearing 2 shows an even more substantial improvement with a 33.5% increase in maximum load capacity. In contrast, when compared with bearing 4, bearing 3 experiences a decrease of 11.4% in the maximum load capacity, whereas the decrease in bearing 2 is minimal at only 2.1%. Thus, it can be concluded that the fixed position of the bump foil significantly influences the load performance of GFTBs. Furthermore, the impact of independent bump foil strips on static performance is closely related to the fixed position of the bump foil. For GTFBs with the bump foil fixed at the leading edge (bearing 1 and 3), the use of independent bump foil strips leads to a substantial improvement in load capacity. However, in the case of the bump foil fixed at the trailing edge (bearing 2 and 4), splitting the bump foil into several strips results in a weaker enhancement of the load capacity.
To further explore the underlying mechanism behind these findings, Figure 12 showcases the pressure distribution on the thrust disk at the minimum nominal clearance for the four bearings. A consistent color scale is used for the pressure distribution across all four configurations, with the maximum pressure value of the gas film serving as the upper limit. It is observed that all four bearings exhibit pressure blocks resembling “tiger stripes”, which are caused by the sagging of the top foil between adjacent bumps. Bearing 1 and bearing 3 display a spiky pressure distribution, while bearing 2 and bearing 4 feature a plateau-like pressure distribution. This leads to a substantially larger high-pressure area in bearing 2 and bearing 4 compared to bearing 1 and bearing 3, resulting in higher load capacity. Regarding the impact of independent bump foil strips, it is notable that the maximum pressure in bearing 1 is significantly smaller than that in bearing 3. On the other hand, the maximum pressure and high-pressure area in bearing 2 exhibit minimal differences compared to bearing 4. This clearly indicates that the effect of independent bump foil strips on bearing capacity is contingent upon the fixed position of the bump foil.
The gas film thickness distribution along the circumferential direction at the minimum nominal clearance is presented in Figure 13. The analyzed section radius within the high-pressure area is 32 mm. Based on extensive literature and practical knowledge, it is widely acknowledged that the bump stiffness at the fixed end is greater than at the free end [10,30]. When the bump foil is fixed at the pad leading edge, as observed in bearing 1 and bearing 3, the thinnest film occurs at the beginning of the flat area. Furthermore, the film thickness of the flat area exhibits an overall increasing trend with the angle. Consequently, the high-pressure region in bearing 1 and 3 is primarily concentrated at the leading portion of the flat area due to the diverging gas film. In contrast, bearing 2 and bearing 4 display a converging gas film towards the trailing edge. This configuration causes the high-pressure area to extend and cover most of the flat area. Therefore, for optimal load capacity and a converging gas film, it is recommended to fix the bump foil at the trailing edge [28,30,31].

3.2. Thermal Characteristic

The power loss resulting from shear stress in the fluid film serves as the heat source in the computational model and significantly impacts the temperature distribution. Figure 14 shows the power loss of GFTBs with four distinct bump foil configurations. As the nominal film thickness decreases, the power loss of all bearings increases, with a more drastic increase when the thickness approaches the minimum film clearance value. This can be attributed to the intensified hydrodynamic effect of the fluid film when the nominal film thickness decreases, leading to an increase in shear stress. The relationship between load capacity and power loss is shown to be linear in Figure 14b. Bearing 1 exhibits the highest slope, while bearing 4 displays the lowest slope. Under the same load capacity, bearing 2 and bearing 4 experience significantly smaller power loss compared to bearing 1 and bearing 3. This indicates that fixing the bump foil at the trailing edge, along with splitting it into multiple strips, can effectively reduce power loss and enhance GFTB efficiency.
Figure 15 showcases the foil temperature distributions of GFTBs featuring four different bump foil configurations at the minimum nominal clearance. In the radial direction, all bearings exhibit a gradient distribution of the temperature. The outer diameter position, characterized by a higher linear speed, experiences significantly higher temperatures compared to the inner diameter position, owing to the positive correlation between shear stress and speed.
In the circumferential direction, all four bearings display “tiger strip” high-temperature blocks, resulting from thermal contact between the top foil and bump foil. The highest temperature regions are located at the outer diameter positions of the trailing edge, consistent with previous research findings [21,32]. Table 4 presents the thermal characteristics of the four bearings. The average temperature of the top foils shows a positive correlation with power loss among all bearings. Bearing 1, with the lowest power loss, exhibits the lowest average temperature of the top foil. However, when considering the maximum temperature of the top foil, there are some differences. Bearing 4, despite not having the lowest power loss, experiences the lowest maximum temperature of the top foil.
To explain this phenomenon, the leakage of the fluid film is analyzed. Figure 16 illustrates that most ambient air enters the fluid film through the inner and outer diameter surfaces in the groove region, with outflow occurring mostly in the ramp area and flat area. As both ends of the fluid domain are set as rotational periodicity boundaries, the inflow and outflow solely take place through the inner and outer diameter surfaces. Thus, the outflow is considered as leakage since it matches the inflow. Comparing bearing 4 to bearing 1 in Table 4, it is observed that bearing 4 exhibits more significant leakage, leading to more heat transfer from the fluid film to the ambient air. As a result, it displays a lower maximum temperature of the top foil. This finding suggests that fixing the bump foil at the trailing edge and splitting it into several strips can reduce the risk of bearing thermal failure.

4. Conclusions

In this study, a comprehensive 3D THED model of GFTB is established based on the FTSI approach to investigate the impact of bump foil configurations on GFTB performance. The model is validated using experimental results, considering factors such as frictional contact, bump interaction, tap foil sagging, and temperature effects. The load capacity and thermal characteristics of GFTBs with four different bump foil configurations are examined, leading to the following main conclusions:
(1)
The 3D THED model of GFTB based on the FTSI approach is valid for the GFTB performance prediction.
(2)
Fixing the bump foil at the trailing edge improves the load capacity.
(3)
The influence of independent bump foil strips on load depends on the position where the bump foil is fixed. When the bump foil is fixed at the trailing edge, splitting it into several strips only slightly enhances the load capacity.
(4)
To reduce power loss and minimize the risk of bearing thermal failure, it is recommended to fix the bump foil at the trailing edge and split it into multiple strips.
This study not only provides design guidance for the present GFTB, but also demonstrates an advanced tool to design and predict the performance of future generations of GFTB.

Author Contributions

Conceptualization, B.H. and A.H.; methodology, B.H.; software, R.D.; validation, B.H. and R.W.; formal analysis, B.H.; investigation, B.H; data curation, B.H.; writing—original draft preparation, B.H.; writing—review and editing, B.H. and Z.W.; resources, Q.N. and Z.L.; visualization, B.H.; supervision, A.H.; funding acquisition, A.H. All authors have read and agreed to the published version of the manuscript.

Funding

This research was funded by the National Science and Technology Major Project of China, grant number J2019-V-0017-0112.

Data Availability Statement

The data presented in this study are available on reasonable request from the corresponding author.

Conflicts of Interest

The authors declare no conflict of interest.

References

  1. Feng, K.; Kaneko, S. Analytical Model of Bump-Type Foil Bearings Using a Link-Spring Structure and a Finite-Element Shell Model. J. Tribol. 2010, 132, 021706. [Google Scholar] [CrossRef]
  2. DellaCorte, C.; Bruckner, R.J. Remaining Technical Challenges and Future Plans for Oil-Free Turbomachinery. J. Eng. Gas Turbines Power 2011, 133, 042502. [Google Scholar] [CrossRef]
  3. Somaya, K.; Yamashita, T.; Yoshimoto, S. Experimental and Numerical Investigation of the High-Speed Instability of Aerodynamic Foil Journal Bearings for Micro Turbomachinery. In Proceedings of the ASME/STLE 2012 International Joint Tribology Conference, Denver, CO, USA, 7–10 October 2012. [Google Scholar]
  4. Agrawal, G.L. Foil Air/Gas Bearing Technology—An Overview. In Proceedings of the ASME 1997 International Gas Turbine and Aeroengine Congress and Exhibition, Orlando, FL, USA, 2–5 June 1997. [Google Scholar]
  5. Kim, T.H.; Lee, Y.-B.; Kim, T.Y.; Jeong, K.H. Rotordynamic Performance of an Oil-Free Turbo Blower Focusing on Load Capacity of Gas Foil Thrust Bearings. J. Eng. Gas Turbines Power 2011, 134, 022501. [Google Scholar] [CrossRef]
  6. Samanta, P.; Murmu, N.C.; Khonsari, M.M. The evolution of foil bearing technology. Tribol. Int. 2019, 135, 305–323. [Google Scholar] [CrossRef]
  7. Walton, J.F., II; Tomaszewski, M.J.; Heshmat, H. The Role of High Performance Foil Bearings in Advanced, Oil-Free, High-Speed Motor Driven Compressors. In Proceedings of the ASME 2003 1st International Conference on Fuel Cell Science, Engineering and Technology, Rochester, NY, USA, 21–23 April 2003. [Google Scholar]
  8. Fu, G.; Untaroiu, A.; Swanson, E. Effect of Foil Geometry on the Static Performance of Thrust Foil Bearings. J. Eng. Gas Turbines Power 2018, 140, 082502. [Google Scholar] [CrossRef]
  9. Heshmat, H.; Walowit, J.A.; Pinkus, O. Analysis of Gas Lubricated Compliant Thrust Bearings. J. Lubr. Technol. 1983, 105, 638–646. [Google Scholar] [CrossRef]
  10. Iordanoff, I. Analysis of an Aerodynamic Compliant Foil Thrust Bearing: Method for a Rapid Design. J. Tribol. 1999, 121, 816–822. [Google Scholar] [CrossRef]
  11. Heshmat, C.A.; Xu, D.S.; Heshmat, H. Analysis of Gas Lubricated Foil Thrust Bearings Using Coupled Finite Element and Finite Difference Methods. J. Tribol. 1999, 122, 199–204. [Google Scholar] [CrossRef]
  12. Park, D.-J.; Kim, C.-H.; Jang, G.-H.; Lee, Y.-B. Theoretical considerations of static and dynamic characteristics of air foil thrust bearing with tilt and slip flow. Tribol. Int. 2008, 41, 282–295. [Google Scholar] [CrossRef]
  13. Gad, A.M.; Kaneko, S. A New Structural Stiffness Model for Bump-Type Foil Bearings: Application to Generation II Gas Lubricated Foil Thrust Bearing. J. Tribol. 2014, 136, 041701. [Google Scholar] [CrossRef]
  14. Xu, F.; Kim, D.; Zamanian Yazdi, B. Theoretical Study of Top Foil Sagging Effect on the Performance of Air Thrust Foil Bearing. In Proceedings of the ASME Turbo Expo 2016: Turbomachinery Technical Conference and Exposition, Seoul, Republic of Korea, 13–17 June 2016. [Google Scholar]
  15. Xu, Z.; Li, C.; Du, J.; Li, J.; Wang, Y. Load-carrying characteristics of bump-type gas foil thrust bearings. Int. J. Mech. Sci. 2023, 244, 108080. [Google Scholar] [CrossRef]
  16. Bruckner, R.J. Simulation and Modeling of the Hydrodynamic, Thermal, and Structural Behavior of Foil Thrust Bearings. Ph.D. Thesis, Case Western Reserve University, Cleveland, OH, USA, 2004. [Google Scholar]
  17. Lee, D.; Kim, D. Three-Dimensional Thermohydrodynamic Analyses of Rayleigh Step Air Foil Thrust Bearing with Radially Arranged Bump Foils. Tribol. Trans. 2011, 54, 432–448. [Google Scholar] [CrossRef]
  18. Gad, A.M.; Kaneko, S. Fluid Flow and Thermal Features of Gas Foil Thrust Bearings at Moderate Operating Temperatures. In Proceedings of the 9th IFToMM International Conference on Rotor Dynamics, Cham, Switzerland, 22–25 September 2015; pp. 1223–1233. [Google Scholar]
  19. Xu, F.; Kim, D. Three-Dimensional Turbulent Thermo-Elastohydrodynamic Analyses of Hybrid Thrust Foil Bearings Using Real Gas Model. In Proceedings of the ASME Turbo Expo 2016: Turbomachinery Technical Conference and Exposition, Seoul, Republic of Korea, 13–17 June 2016. [Google Scholar]
  20. Lehn, A.; Mahner, M.; Schweizer, B. A thermo-elasto-hydrodynamic model for air foil thrust bearings including self-induced convective cooling of the rotor disk and thermal runaway. Tribol. Int. 2018, 119, 281–298. [Google Scholar] [CrossRef]
  21. Liu, X.; Li, C.; Du, J. The Fluid-Structure-Thermal Performance Analysis of Gas Foil Thrust Bearing by Using Computational Fluid Dynamics. Lubricants 2022, 10, 294. [Google Scholar] [CrossRef]
  22. Xiong, C.; Xu, B.; Yu, H.; Huang, Z.; Chen, Z. A thermo-elastic-hydrodynamic model for air foil thrust bearings considering thermal seizure and failure analyses. Tribol. Int. 2023, 183, 108373. [Google Scholar] [CrossRef]
  23. DellaCorte, C.; Radil, K.C.; Bruckner, R.J.; Howard, S.A. Design, Fabrication, and Performance of Open Source Generation I and II Compliant Hydrodynamic Gas Foil Bearings. Tribol. Trans. 2008, 51, 254–264. [Google Scholar] [CrossRef]
  24. Qin, K.; Li, D.; Huang, C.; Luo, K. Comparative analysis of turbulence models for gas bearings flowfield simulations. Fluid Dyn. Res. 2019, 51, 045505. [Google Scholar] [CrossRef]
  25. Hoffmann, R.; Liebich, R. Experimental and numerical analysis of the dynamic behaviour of a foil bearing structure affected by metal shims. Tribol. Int. 2017, 115, 378–388. [Google Scholar] [CrossRef]
  26. Zywica, G.; Baginski, P.; Bogulicz, M.; Martowicz, A.; Roemer, J.; Kantor, S. Numerical identification of the dynamic characteristics of a nonlinear foil bearing structure: Effect of the excitation force amplitude and the assembly preload. J. Sound Vib. 2022, 520, 116663. [Google Scholar] [CrossRef]
  27. San Andrés, L.; Ryu, K.; Diemer, P. Prediction of Gas Thrust Foil Bearing Performance for Oil-Free Automotive Turbochargers. J. Eng. Gas Turbines Power 2014, 137, 032502. [Google Scholar] [CrossRef]
  28. Dykas, B. Factors Influencing the Performance of Foil Gas Thrust Bearings for Oil-Free Turbomachinery Applications. Ph.D. Thesis, Case Western Reserve University, Cleveland, OH, USA, 2006. [Google Scholar]
  29. Conboy, T.M. Real-Gas Effects in Foil Thrust Bearings Operating in the Turbulent Regime. J. Tribol. 2013, 135, 031703. [Google Scholar] [CrossRef]
  30. Gad, A.M.; Kaneko, S. Tailoring of the bearing stiffness to enhance the performance of gas-lubricated bump-type foil thrust bearing. Proc. Inst. Mech. Eng. Part J J. Eng. Tribol. 2016, 230, 541–560. [Google Scholar] [CrossRef]
  31. Dickman, J.R. An investigation of gas foil thrust bearing performance and its influencing factors. Master’s Thesis, Case Western Reserve University, Cleveland, OH, USA, 2010. [Google Scholar]
  32. Rieken, M.; Mahner, M.; Schweizer, B. Thermal Optimization of Air Foil Thrust Bearings Using Different Foil Materials. J. Turbomach. 2020, 142, 101003. [Google Scholar] [CrossRef]
Figure 1. Schematic diagram of GFTB structure. (a) GFTB structure; (b) one GFTB pad; (c) variables describing of one GFTB pad.
Lubricants 11 00417 g001
Figure 2. Four bump foil configurations of GFTB.
Lubricants 11 00417 g002
Figure 3. Computer solution flow of TFSI.
Lubricants 11 00417 g003
Figure 4. Fluid computational domain (the film thickness is stretched 10 times).
Lubricants 11 00417 g004
Figure 5. Structure computational domain of bearing 1.
Lubricants 11 00417 g005
Figure 6. Mesh independence test of bearing 1. (a) Fluid domain. (b) Structure domain.
Lubricants 11 00417 g006
Figure 7. Part of structure mesh for bearing 1.
Lubricants 11 00417 g007
Figure 8. Test system for GFTB. (a) 3D model; (b) load part; (c) the photo of test rig.
Lubricants 11 00417 g008
Figure 9. The photo of test GTFB.
Lubricants 11 00417 g009
Figure 10. Comparison between numerical and experimental results of drag torque with different thrust loads.
Lubricants 11 00417 g010
Figure 11. Load capacity of bearing 1–4 with different nominal film thickness.
Lubricants 11 00417 g011
Figure 12. Pressure distribution at the minimum nominal clearance on the thrust disk of bearing 1–4.
Lubricants 11 00417 g012
Figure 13. Gas film thickness distribution at a radius of 32 mm of bearing 1–4. (a) Bearing 1. (b) Bearing 2. (c) Bearing 3. (d) Bearing 4.
Lubricants 11 00417 g013
Figure 14. Power loss of bearing 1–4. (a) Relation to the nominal film thickness. (b) Relation to the load capacity.
Lubricants 11 00417 g014
Figure 15. Temperature distribution of bearing 1–4.
Lubricants 11 00417 g015
Figure 16. Flow trend of opening boundary.
Lubricants 11 00417 g016
Table 1. Dimensions and material properties of GFTB.
GFTB ParametersValue
GFTB outer radium (mm), Ro40
GFTB inner radium (mm), Ri20
Pad angle (deg), α60
Foil angle (deg), β45
Ramp height (mm), hRamp0.11
Ramp area ratio0.32
Top foil thickness(mm), TF0.10
Bump foil thickness (mm), tBump0.10
Bump foil pitch (mm), SBump3.17
Bump foil height (mm), hBump0.51
Foil Poisson’s ratio, ν0.29
Foil Young’s modulus, E209 GPa
Table 2. Detailed boundary conditions.
Boundary TypePartBoundary Condition
OpeningInner and outer diameter surfaces of the fluid domainAmbient temperature T 0 = 25   ° C , ambient press p 0 = 1   a t m
Moving no-slip wallThrust diskRotational speed v = 30,000   r p m , forced thermal convection coefficient λ f c = 84   W / ( K · m 2 )
Rotational periodicityBoth ends of the fluid and structure domain sector
Fluid–solid interfaceTop foil surface
Top side of back plate
Transfer pressure, displacement, temperature and flux
Solid–solid interfaceTop foil and bump foil
bump foil and back plate
Contact and friction,
solid thermal conductivity coefficient λ s = 16.9   W / ( K · m )
FixedFixed edges of top foil and bump foilFixed, solid thermal conductivity coefficient λ s = 16.9   W / ( K · m )
Free wallUnderside of top foil
bump foil
Unconstrained,
natural thermal convection coefficient λ f n = 12   W / ( K · m 2 ) , ambient temperature T 0 = 25   ° C , ambient press p 0 = 1   a t m
Fixed wallBack plate
Spacer
Fixed, rigid body,
natural thermal convection coefficient λ f n = 12   W / ( K · m 2 ) , ambient temperature T 0 = 25   ° C , ambient press p 0 = 1   a t m
Table 3. Maximum load capacity of bearing 1–4 at the nominal clearance of 5 μm.
Bearing NumberMaximum Load
Capacity (N)
Difference from
Bearing 1
Difference from
Bearing 4
Bearing 170.0 −26.7%
Bearing 293.533.5%−2.1%
Bearing 384.620.8%−11.4%
Bearing 495.536.4%
Table 4. Thermal characteristic at the minimum nominal clearance of bearing 1–4.
Bearing NumberMaximum
Temperature of
Top Foil (°C)
Average
Temperature of Top Foil (°C)
Power Loss (W)Leakage (mg/s)
Bearing 1167.16153.8756.9957.59
Bearing 2185.37168.2660.1559.01
Bearing 3186.42170.3463.3357.69
Bearing 4166.14160.1459.0459.48
Disclaimer/Publisher’s Note: The statements, opinions and data contained in all publications are solely those of the individual author(s) and contributor(s) and not of MDPI and/or the editor(s). MDPI and/or the editor(s) disclaim responsibility for any injury to people or property resulting from any ideas, methods, instructions or products referred to in the content.

