Article

Finite Element Simulation and Fretting Wear Prediction of a Tenon Connection Structure

1
School of Energy and Power Engineering, Dalian University of Technology, Dalian 116024, China
2
School of Control Science and Engineering, Dalian University of Technology, Dalian 116024, China
3
AECC Hunan Power Machinery Research Institute, Zhuzhou 412000, China
*
Author to whom correspondence should be addressed.
Lubricants 2023, 11(10), 421; https://doi.org/10.3390/lubricants11100421
Submission received: 31 July 2023 / Revised: 30 August 2023 / Accepted: 11 September 2023 / Published: 30 September 2023
(This article belongs to the Special Issue Wear Prediction in Aeroengine Rotor System)

Abstract

:
A tenon connection structure is widely used for the blade-disk connection in turbomachinery, and its ability to resist wear influences operation life. The finite element method (FEM) has been extensively applied in predicting fretting wear due to its advantage in solving problems like the non-linearity of boundary conditions. This work proposes a model that combines a modified Archard model with FEM to simulate fretting wear in multiple pairs of contact curved surfaces of the tenon connection structure. The model considers various factors, including the direction of fretting, time, load magnitude, and the application of aerodynamic load. The results indicate that the direction of fretting has a significant effect on the wear of the tenon connection structure. The wear depth of the tenon connection structure caused by axial fretting is nearly twice that of circumferential and radial fretting, and the corresponding wear depth values are 57.22, 30.85, and 24.36 µm in this study, respectively, and the rate of change in wear depth increases over time, while the contact pressure decreases initially and then increases with continuous wear. This study provides valuable insight into the impact of fretting under different working conditions on the wear of turbine tenon connection structures, which is of great significance for their wear-resistant design and life prediction.

1. Introduction

The aero-engine is often referred to as the heart of an aircraft as its performance has a direct and significant impact on the overall performance of the aircraft. Therefore, the pursuit of a higher thrust-to-weight ratio is a fundamental and ongoing objective in aero-engine design. The turbine tenon connection structure is widely used to connect blades and disks, offering advantages such as a heavy load-bearing capacity, small structure volume, easy maintenance, and replacement. Therefore, the tenon connection structure is widely used in the blade disk system of aero-engine compressors and other power machinery. Under high-temperature and high-speed conditions, the service is subjected to centrifugal force, vibration load, and thermal load, leading to frequent faults such as tenon cracks and blade fractures. Fretting wear at the joint of the tenon and the turbine disk is one of the key factors affecting the fatigue life of aero-engine blades.
Fretting is a phenomenon that occurs between various mechanical parts that move or tend to move together tightly, such as rails, brake devices, bolts and nuts, keys and keyways, and so on. Numerous parameters affect fretting, with the main parameters including material properties, surface roughness, surface morphology, lubrication conditions, load form, and load amplitude, among others. Fretting wear is a common form of fretting damage that leads to gradual material removal and continuous changes in the dimensional profile of components. This phenomenon significantly limits the service quality and reliability of structural parts. The impact of fretting wear extends beyond material loss and adversely affects the stability and operational performance of the structure. Fretting wear leads to premature fatigue failure of blade tenon joints and spline drive joints. Statistical analysis reveals that 20% of aero-engine failures are caused by the failure of mortise and tenon joints. In many research studies, there are two regimes between contact surfaces in fretting, i.e., slip and stick regions. In the slip region, a small tangential displacement is generated and if the slip amplitude is high, the potential of crack formation is decreased, but the surface damage increases due to wear. On the other side, if the slip amplitude is relatively low, the crack will probably initiate at the edge of the contact surface due to friction and stress, and the influence of wear will be diminished, which can be regarded as fretting fatigue condition. Fretting fatigue can even reduce the fatigue life of some components by 30% or even 80% [1]. Fretting wear can generate excessive noise and vibrations in structures, as well as reduce machine accuracy. Furthermore, fretting wear intensifies friction and wear of the components, leading to shortened lifespan and increased maintenance costs. Therefore, addressing and preventing fretting wear issues are crucial for structural components that require high reliability and long lifespan. This paper aims to study the wear effect of micro-amplitude vibration on the turbine tenon connection structure under working conditions and to explore wear-resistant designs and life predictions for turbine tenon connection structures.
Since the concept of fretting was proposed, many scholars have carried out a lot of theoretical and experimental studies on fretting problems [2,3]. Fretting wear is mainly investigated through experimental and numerical methods. In the experimental aspect, according to relative motion directions for a ball-on-flat contact, Zhu [4] reviewed four fundamental fretting wear modes including tangential, radial, torsional, and rotational modes. Kirk [5] investigated the impact of displacement amplitude on fretting wear over a range of frequencies by experiments in a cylinder-on-flat configuration. Numerous experimental and industrial experts concluded that fretting loadings could induce cracking or wear, which is associated with the formation of debris. Hurricks [6] classified the fretting wear process into three stages: first, metal adhesion and migration; second, the generation and accumulation of grinding debris; third, stable wear state. Waterhouse also divided the surface damage process in fretting into three basic processes. The fretting maps approach introduced by Vingsbo et al. and Vincent et al. shows that the damage evolution strongly depends on the sliding regimes [7,8]. Depending on the loading conditions, namely combinations of the normal load imposed on the contact bodies and the tangential displacement between them, it could result in a partial slip regime (PSR), mixed slip regime (MFR), and gross slip regime (GSR) [9,10]. Cracking is mainly encountered under partial and mixed fretting regimes, whereas wear is observed for larger amplitudes under gross slip condition. Godet and his co-workers [11,12] developed the theories of third-body tribology and velocity accommodation mechanisms to explain the role of wear debris in specific fretting conditions.
Numerical models are of interest to scientists when it comes to fretting wear as they can reduce the need for costly and time-consuming experimental tests and allow the underlying behavior of the fretting phenomena to be observed [13,14]. The finite element method as one of the numerical models is widely intensively used to predict the fretting wear process as it is suitable to solve problems like the non-linearity of boundary conditions, changes in geometry, and the time integration effect, which all happen in fretting wear simulations. Ramírez et al. [15] established a finite element model combined with the class Archard’s wear law for the prediction of the rate of wear. The accuracy of the modified model was addressed in comparison with experimental results. McColl et al. [16] combined the classical Archard model with FEM to simulate the fretting wear process under cylinder-on-flat. Mesh and increment size optimization was considered to minish the total simulation. Fouvry [17,18] suggested a linear relationship between the dissipated energy and the wear volume and extended the method to the fretting wear with coatings. Shen [19] proposed a continuum damage mechanics (CDM)-based approach to investigate fretting wear and fretting fatigue behavior of Ti-6Al-4V with the consideration of debris layer evolution, In a finite element package to predict the fretting wear profile and fatigue lifetime. Wang [20] used a combination of Multiscale Homogenization and Direct Numerical Simulation (MH-DNS); the damage parameters (DP) were calculated by the critical plane method and the average method to predict the fretting fatigue life more accurately. Kapoor [21,22,23] simulated the asperity of the contact surface and found that the asperities at the contact interface are always in ratcheting. Yue et al. [24] used FEM to discover whether or not there exists a stress singularity at the cylinder on the flat contact according to different variables, such as applied displacement, coefficient of friction (COF), and fretting wear cycles. The simulation in three-dimensional (3D) is more complex than in two-dimensional (2D) due to the increase in the degree of freedom. Besides, it is more time-consuming and more difficult to converge. The literature review indicates that previous studies are mainly carried out under 2D cylinder-on-flat contact configuration, and though 3D contact configuration exists [25], there are few researches on turbine tenon connection structure, which is a complex structure with many pairs of curved surface contacts.
In this study, we developed a three-dimensional (3D) adaptive finite element model of the tenon connection structure linked with the user-defined subroutine UMESHMOTION. This model is used to simulate the fretting wear by using the commercial software ABAQUS 2020. The calculation of wear is based on a modified Archard wear model. We apply fretting with different directions, times, and loads in the finite element simulation. Additionally, we simulate the influence of the aerodynamic load applied onto the tenon connection structure on fretting wear. We investigate the wear evolution and distribution of the tenon connection structure numerically. The influence of fretting on the wear of the turbine tenon connection structure under working conditions is investigated. This investigation is of great significance for the wear resistance design and life prediction of the turbine tenon connection structure.

2. Wear Modeling

2.1. Fretting Wear Model

For the quantitative evaluation of wear, we used the Archard wear model [26] to calculate the wear depth. According to the improved Archard wear model, wear depth can be calculated using the following equation:
V S = K P H
where V is the wear volume (mm3), S is the sliding distance, K is the wear coefficient, P is the normal load, and H is the hardness of the material. For a given point on one of the contacting surfaces, Equation (1) can be expressed as
h S = k 1 p
where h is the wear depth (mm), k1 is the dimensional local wear coefficient, which is defined as the wear rate at per unit local slip to per unit local contact pressure, and p is the contact pressure. The differential formulation of Equation (2) is
d h d S = k 1 p
McColl et al. [16] developed a numerical approach to simulate fretting wear by using Equation (3). For a given contact geometry, the initial distributions of contact pressure and relative slip between the contact surfaces are calculated by the finite element method. The modified Archard model equation is then applied as follows:
Δ h ( x , t ) = k 1 p ( x , t ) δ ( x , t )
where ∆h (x, t), p (x, t), and δ (x, t) are the incremental wear depth, contact pressure, and relative slip at point x and time t, respectively. By using a general statics module, each minimum increment step is simplified into a quasi-static process, with the contact pressure, sliding distance, and wear coefficient being constant within this increment step. The wear process of each increment step is discretized as follows:
Δ h i , j = k i , j p i , j Δ s i , j
h i , j + 1 = h i , j + Δ h i , j
where Δ h i , j , k i , j , p i , j , Δ s i , j , respectively, represent the wear depth, wear coefficient, contact stress, and sliding displacement of the i-th node in the j-th increment step. Due to computational constraints, modeling each cycle explicitly is inefficient. Instead, a cycle jumping technique similar to that described by Ding et al. [27] is employed, where the assumption is made that wear is constant over a small number of cycles. By multiplying the incremental wear by a cycle jumping factor ∆N, one FE cycle simulation is used to model the effect of ∆N actual wear cycles. Substituting into Equation (5), the expression for incremental wear depth can be obtained as follows:
Δ h i , j = N k i , j p i , j Δ s i , j
Integrating Equation (7) yields the final wear depth. Equation (4) becomes:
h ( x , τ ) = N k 1 p ( x , t ) δ ( x , t )
where τ is the time within one cycle corresponding to ∆N wear cycles. The subroutine reads the data and applies the Archard formula to solve the problem at the end of each increment step. There are two important variables used in subroutine UMESHMOTION for the fretting wear analysis, i.e., CSLIP and CPRESS, which represent relative sliding displacement and contact pressure, respectively. Both parameters are used in the Archard’s wear model in Fortran language:
Δ h i , j = N k i , j × C S L I P i , j × C P R E S S i , j
where C S L I P i , j and C P R E S S i , j , respectively, represent the relative slip distance and contact pressure of the i-th node in the j-th increment step. Then, the incremental wear at each node on the contact surfaces is calculated and the geometric model is updated by displacing the nodes along the normal direction of the local surface based on this calculated wear. This completes a loop process that can achieve wear simulation through repetition.

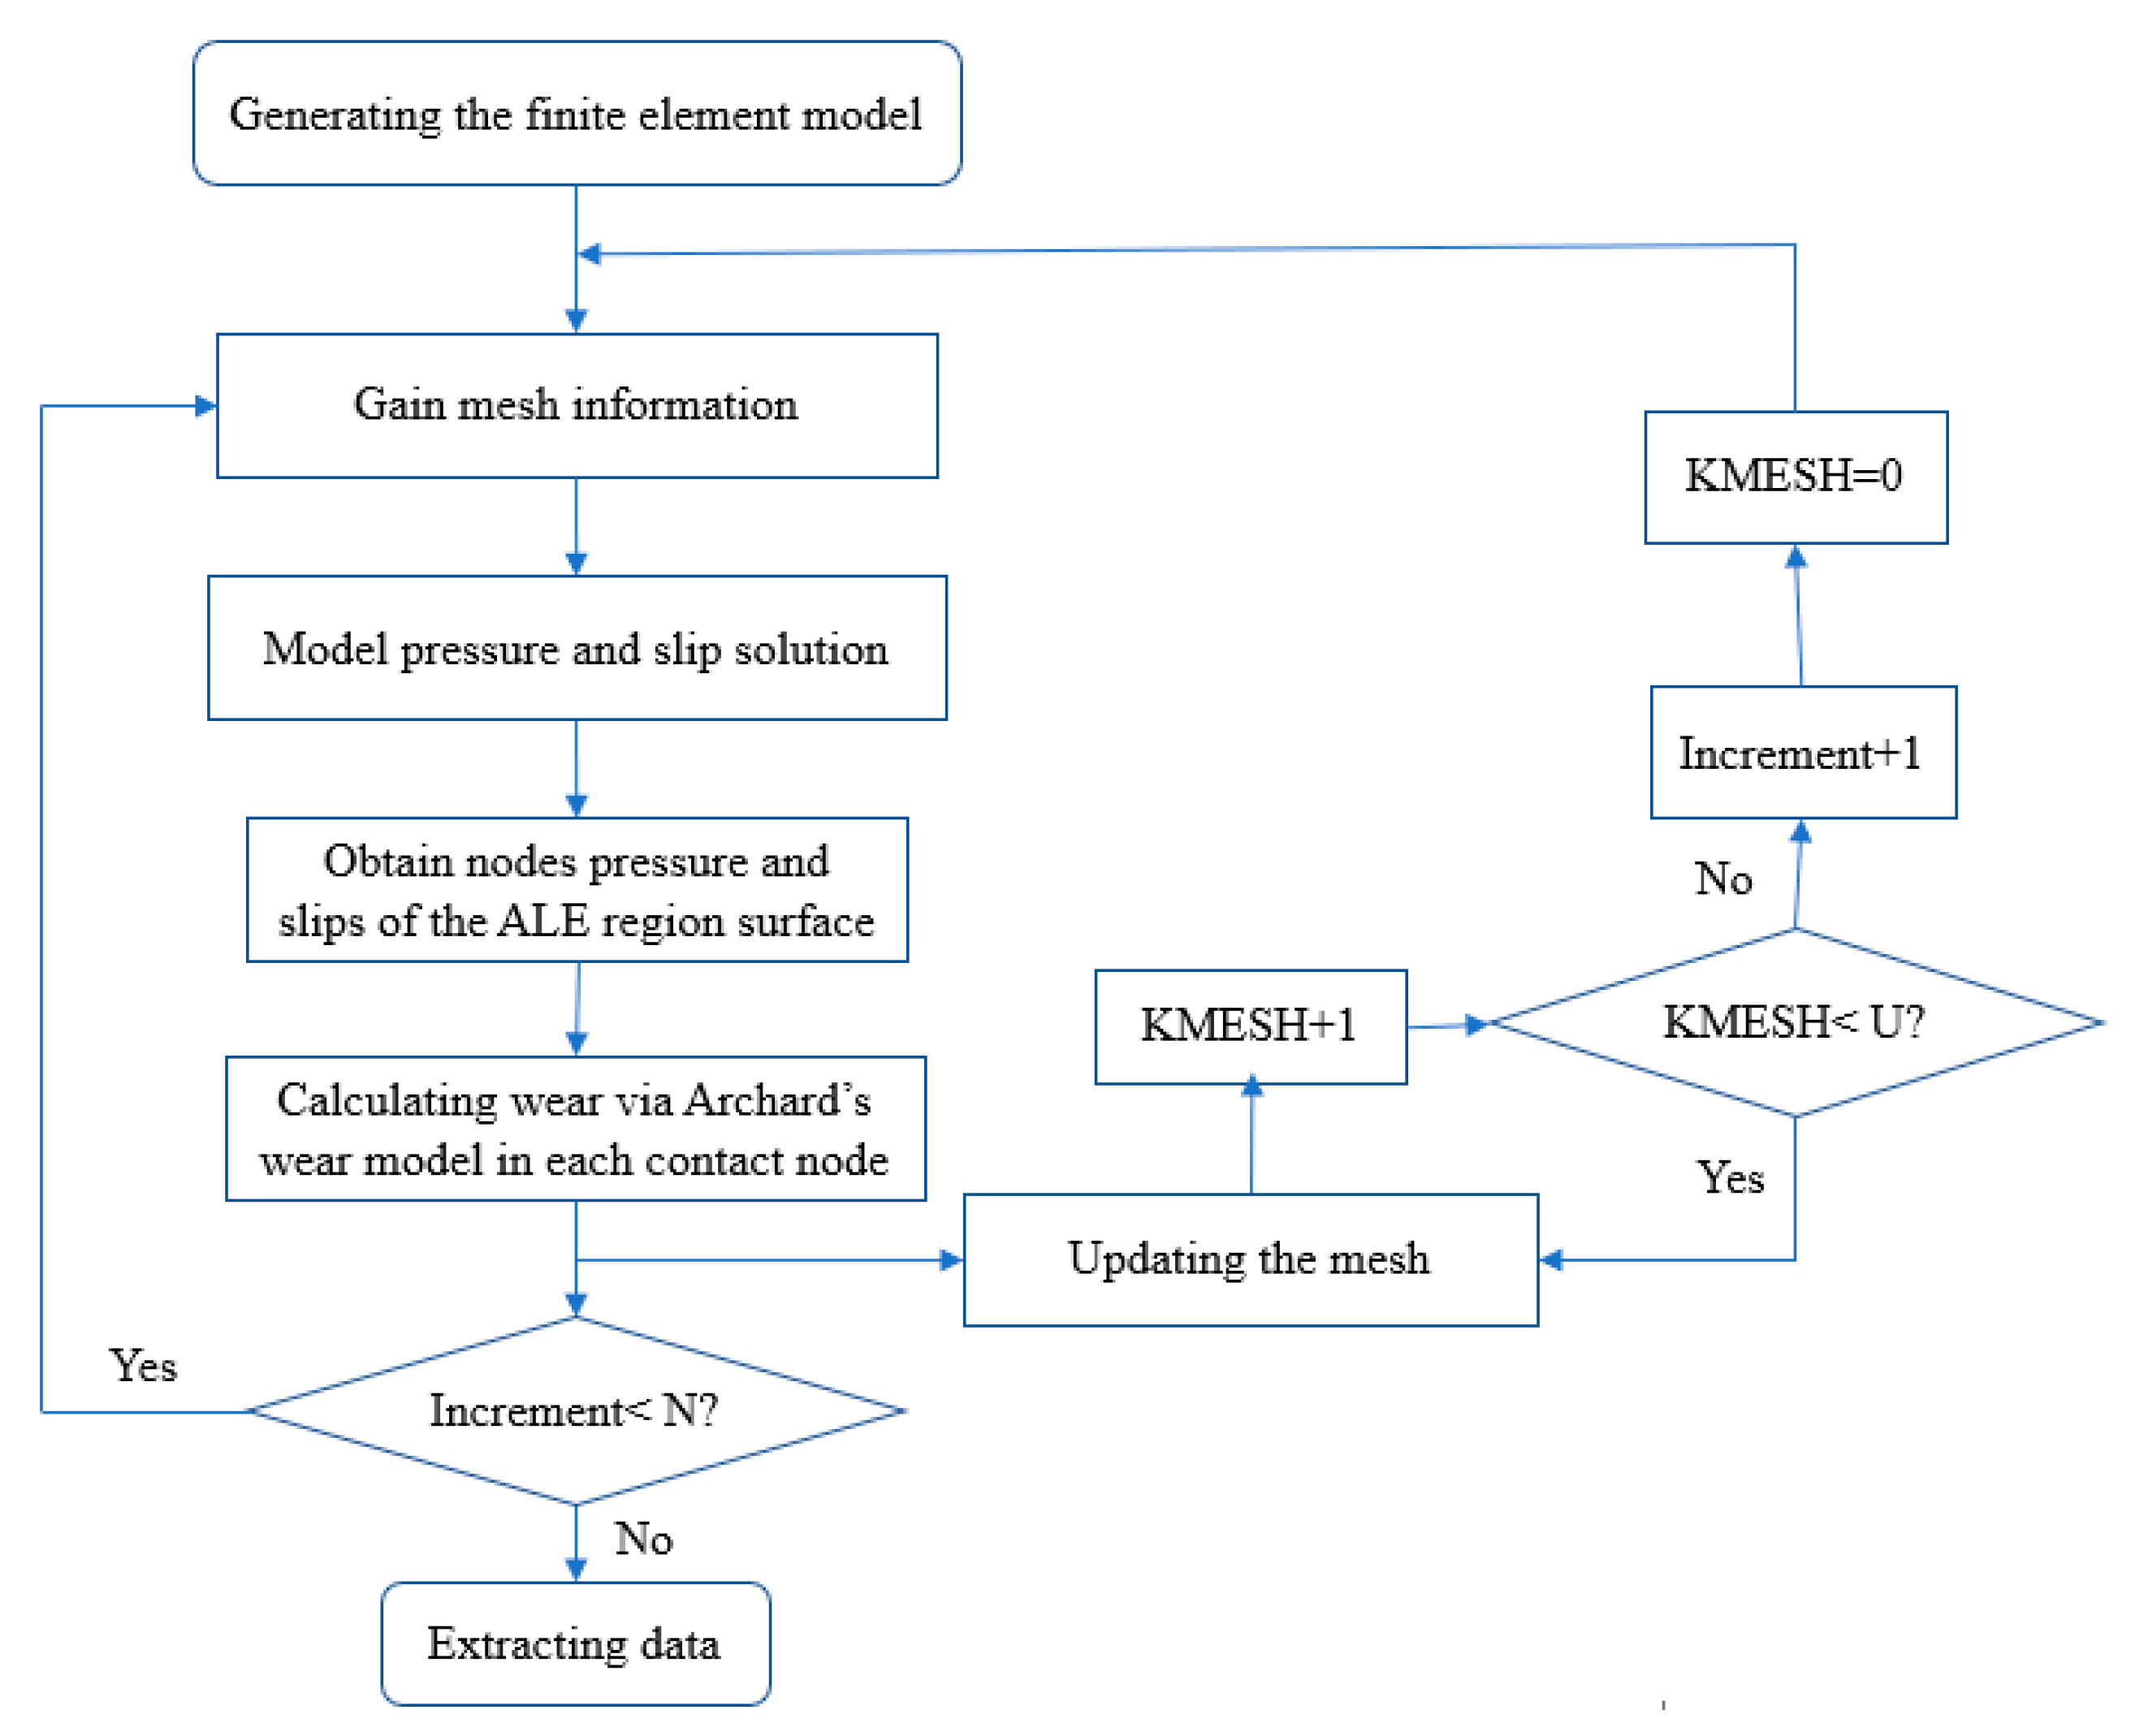
2.2. Wear Finite Element Simulation Method

In this research, the finite element calculation of wear is mainly conducted using ABAQUS. In the analysis process, the manifestation of wear can only be achieved through the displacement of contact nodes. At the same time, to ensure that the displacement of nodes does not lead to the generation of other stresses, an adaptive mesh method, in particular, the Arbitrary Lagrangian–Eulerian (ALE) method, is required. The ALE method combines the features of pure Lagrangian analysis and pure Eulerian analysis. The application of adaptive mesh makes it possible to ensure high-quality mesh strategy in simulation by allowing the mesh to move independently of the model and keep its topology unchanged. After setting ALE mesh in the frictional contact area of the blade-disk connection structure, the subroutine UMESHMOTION is developed to calculate the wear amount and wear direction. In the process of wear calculation, the wear of materials forming friction pairs is continuous; therefore, the given time history needs to be discretized into a series of time incremental steps to simulate the wear of structural pairs of blades and disks. As the innermost nested cycle, its main function is to record the node contact pressure and node coordinates on the surface and calculate the wear depth of each discrete banded region on the worn surface within a simulation cycle time. The specific execution method is as follows: within N simulation cycles, in the sequence of time increments, at the i (i = 1, …, M) time increment step, a finite element analysis of the stress and slip of the material contact surface is carried out to solve the node contact pressure and node coordinates of the wear area. According to the Archard formula, the wear depth of each node on the worn surface is calculated at each time increment step, nodes of contact surfaces are shifted along the wear direction according to the wear depth, and the mesh is redivided to prevent mesh distortion, where KMESH is the number of mesh updates and the set number of mesh division U equals four. After four mesh divisions, the simulation of a fretting wear cycle is completed. The above process is repeated until the increment step is no longer less than N, and then the entire simulation is completed. The total wear depth of each discrete region in a simulation cycle is obtained by summing the wear depths in every increment step. The simulation flow chart of fretting wear is shown in Figure 1:

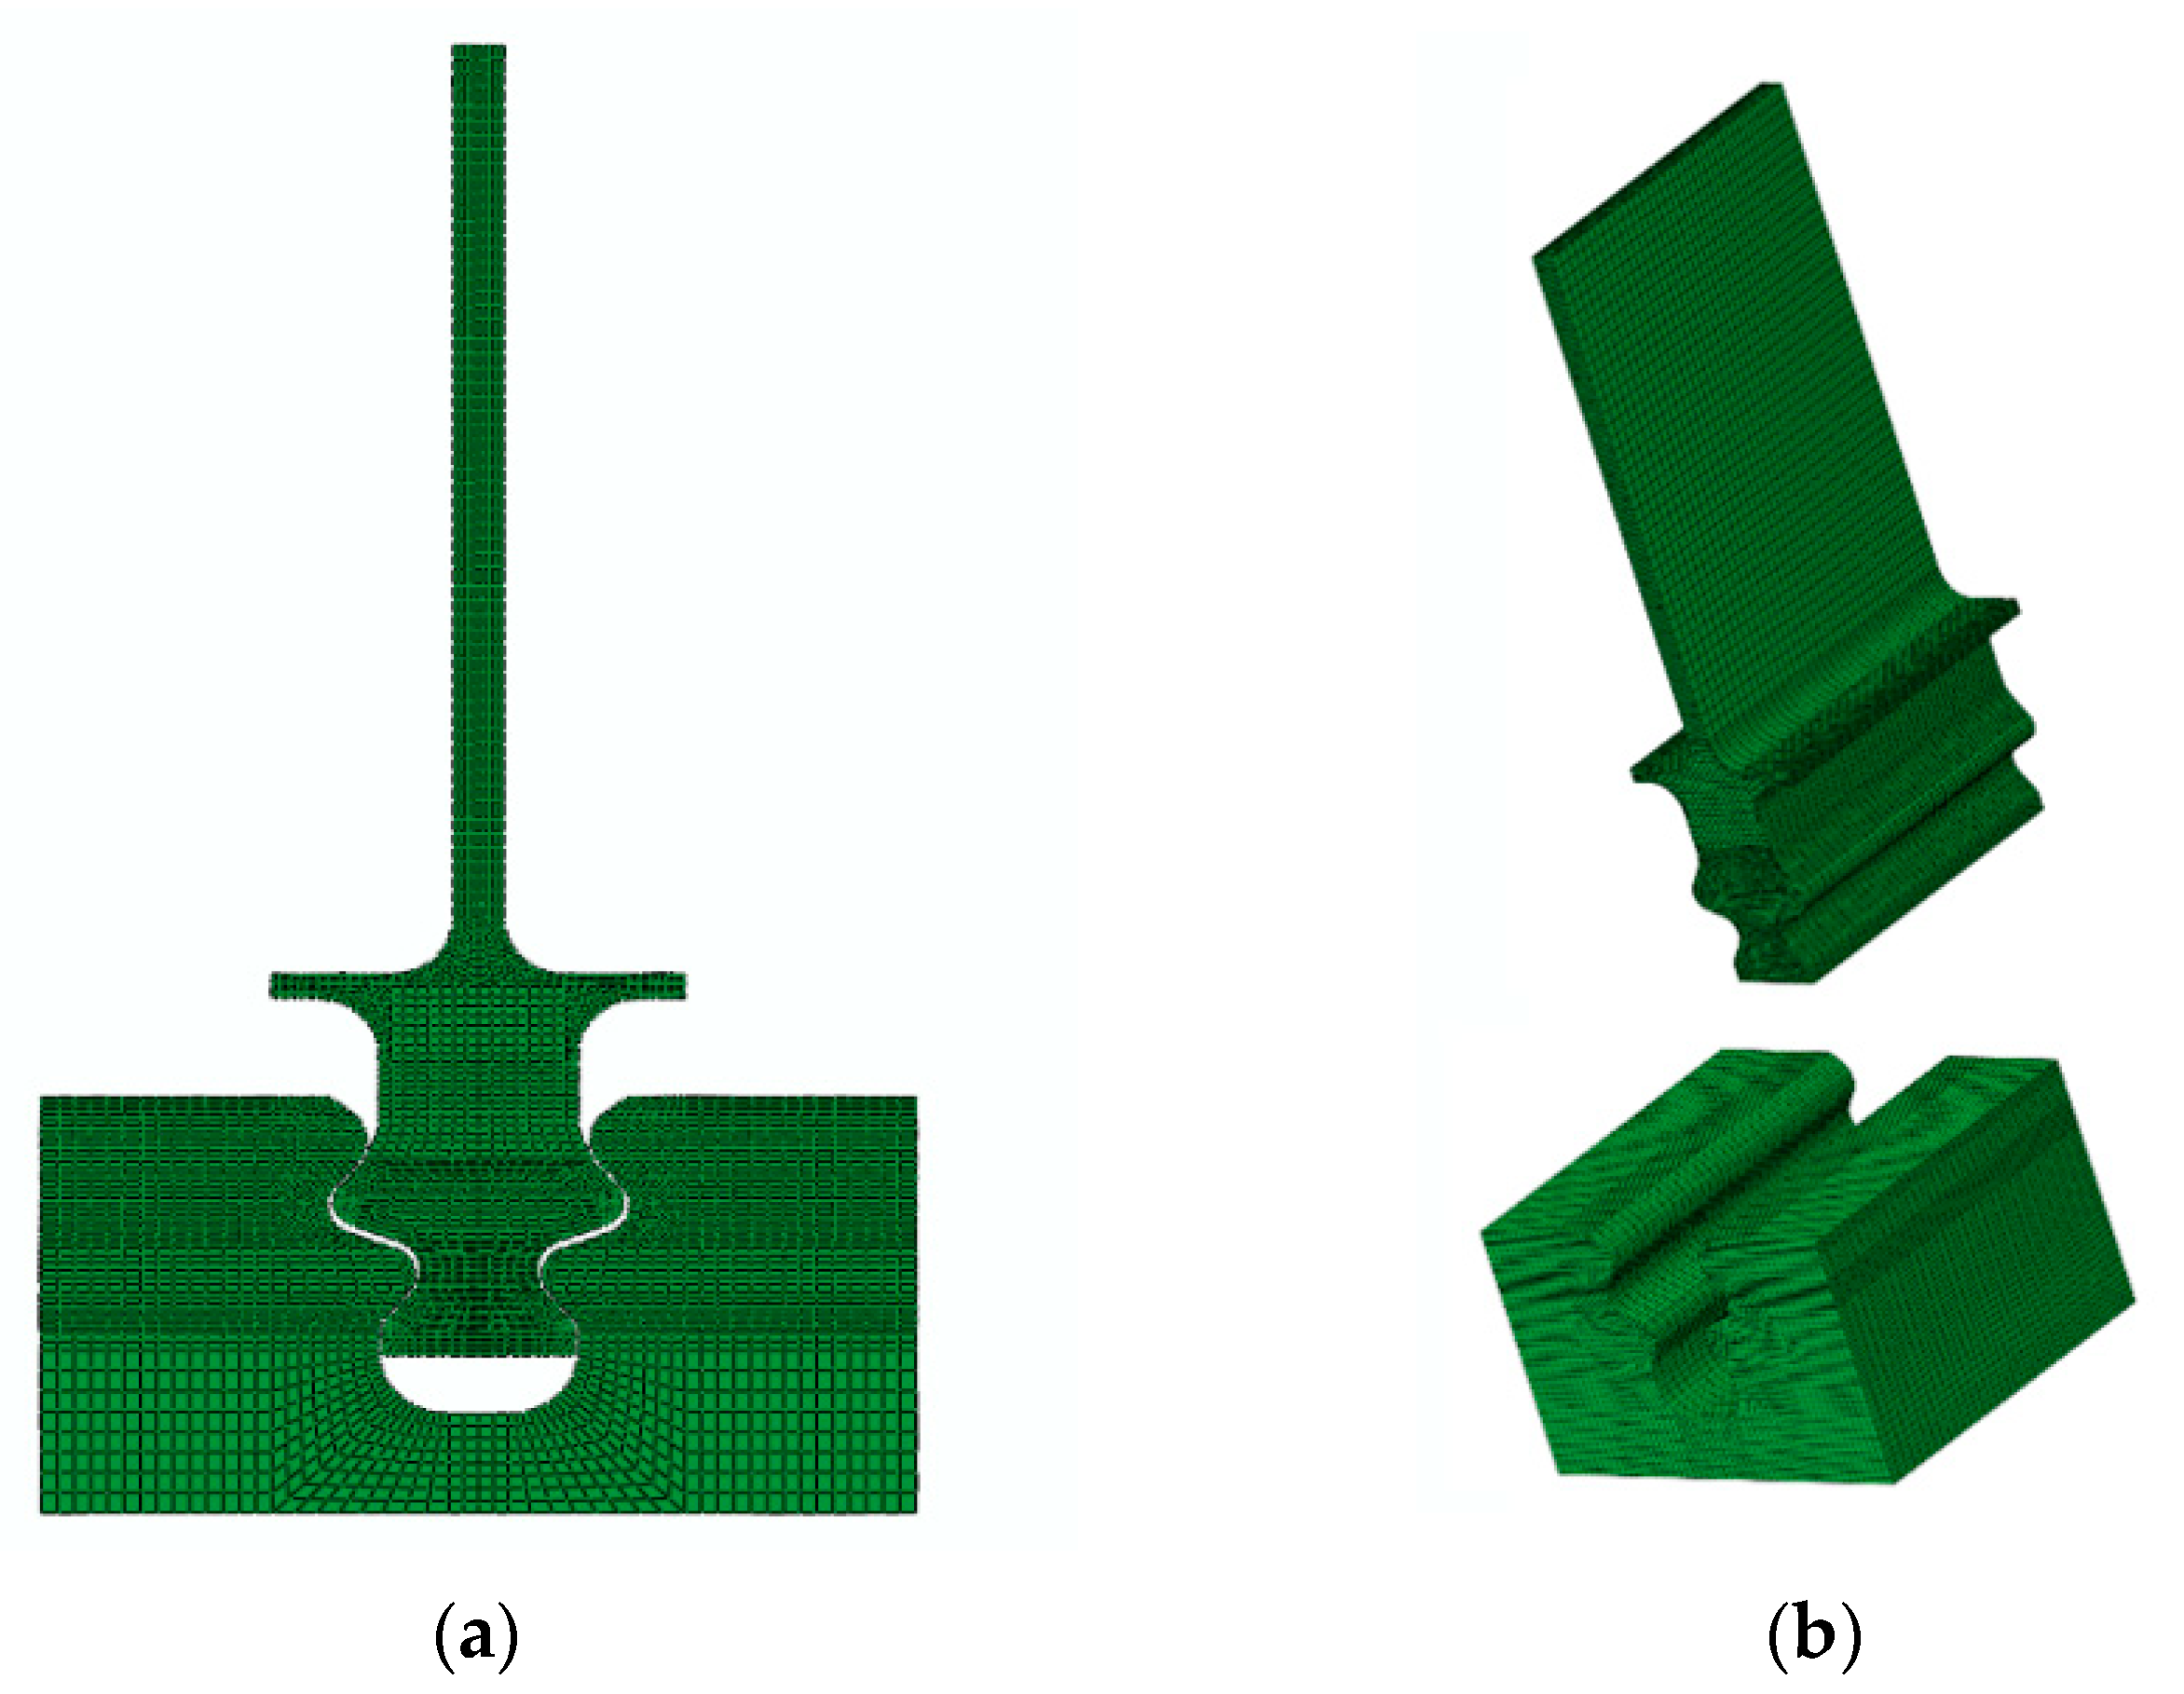
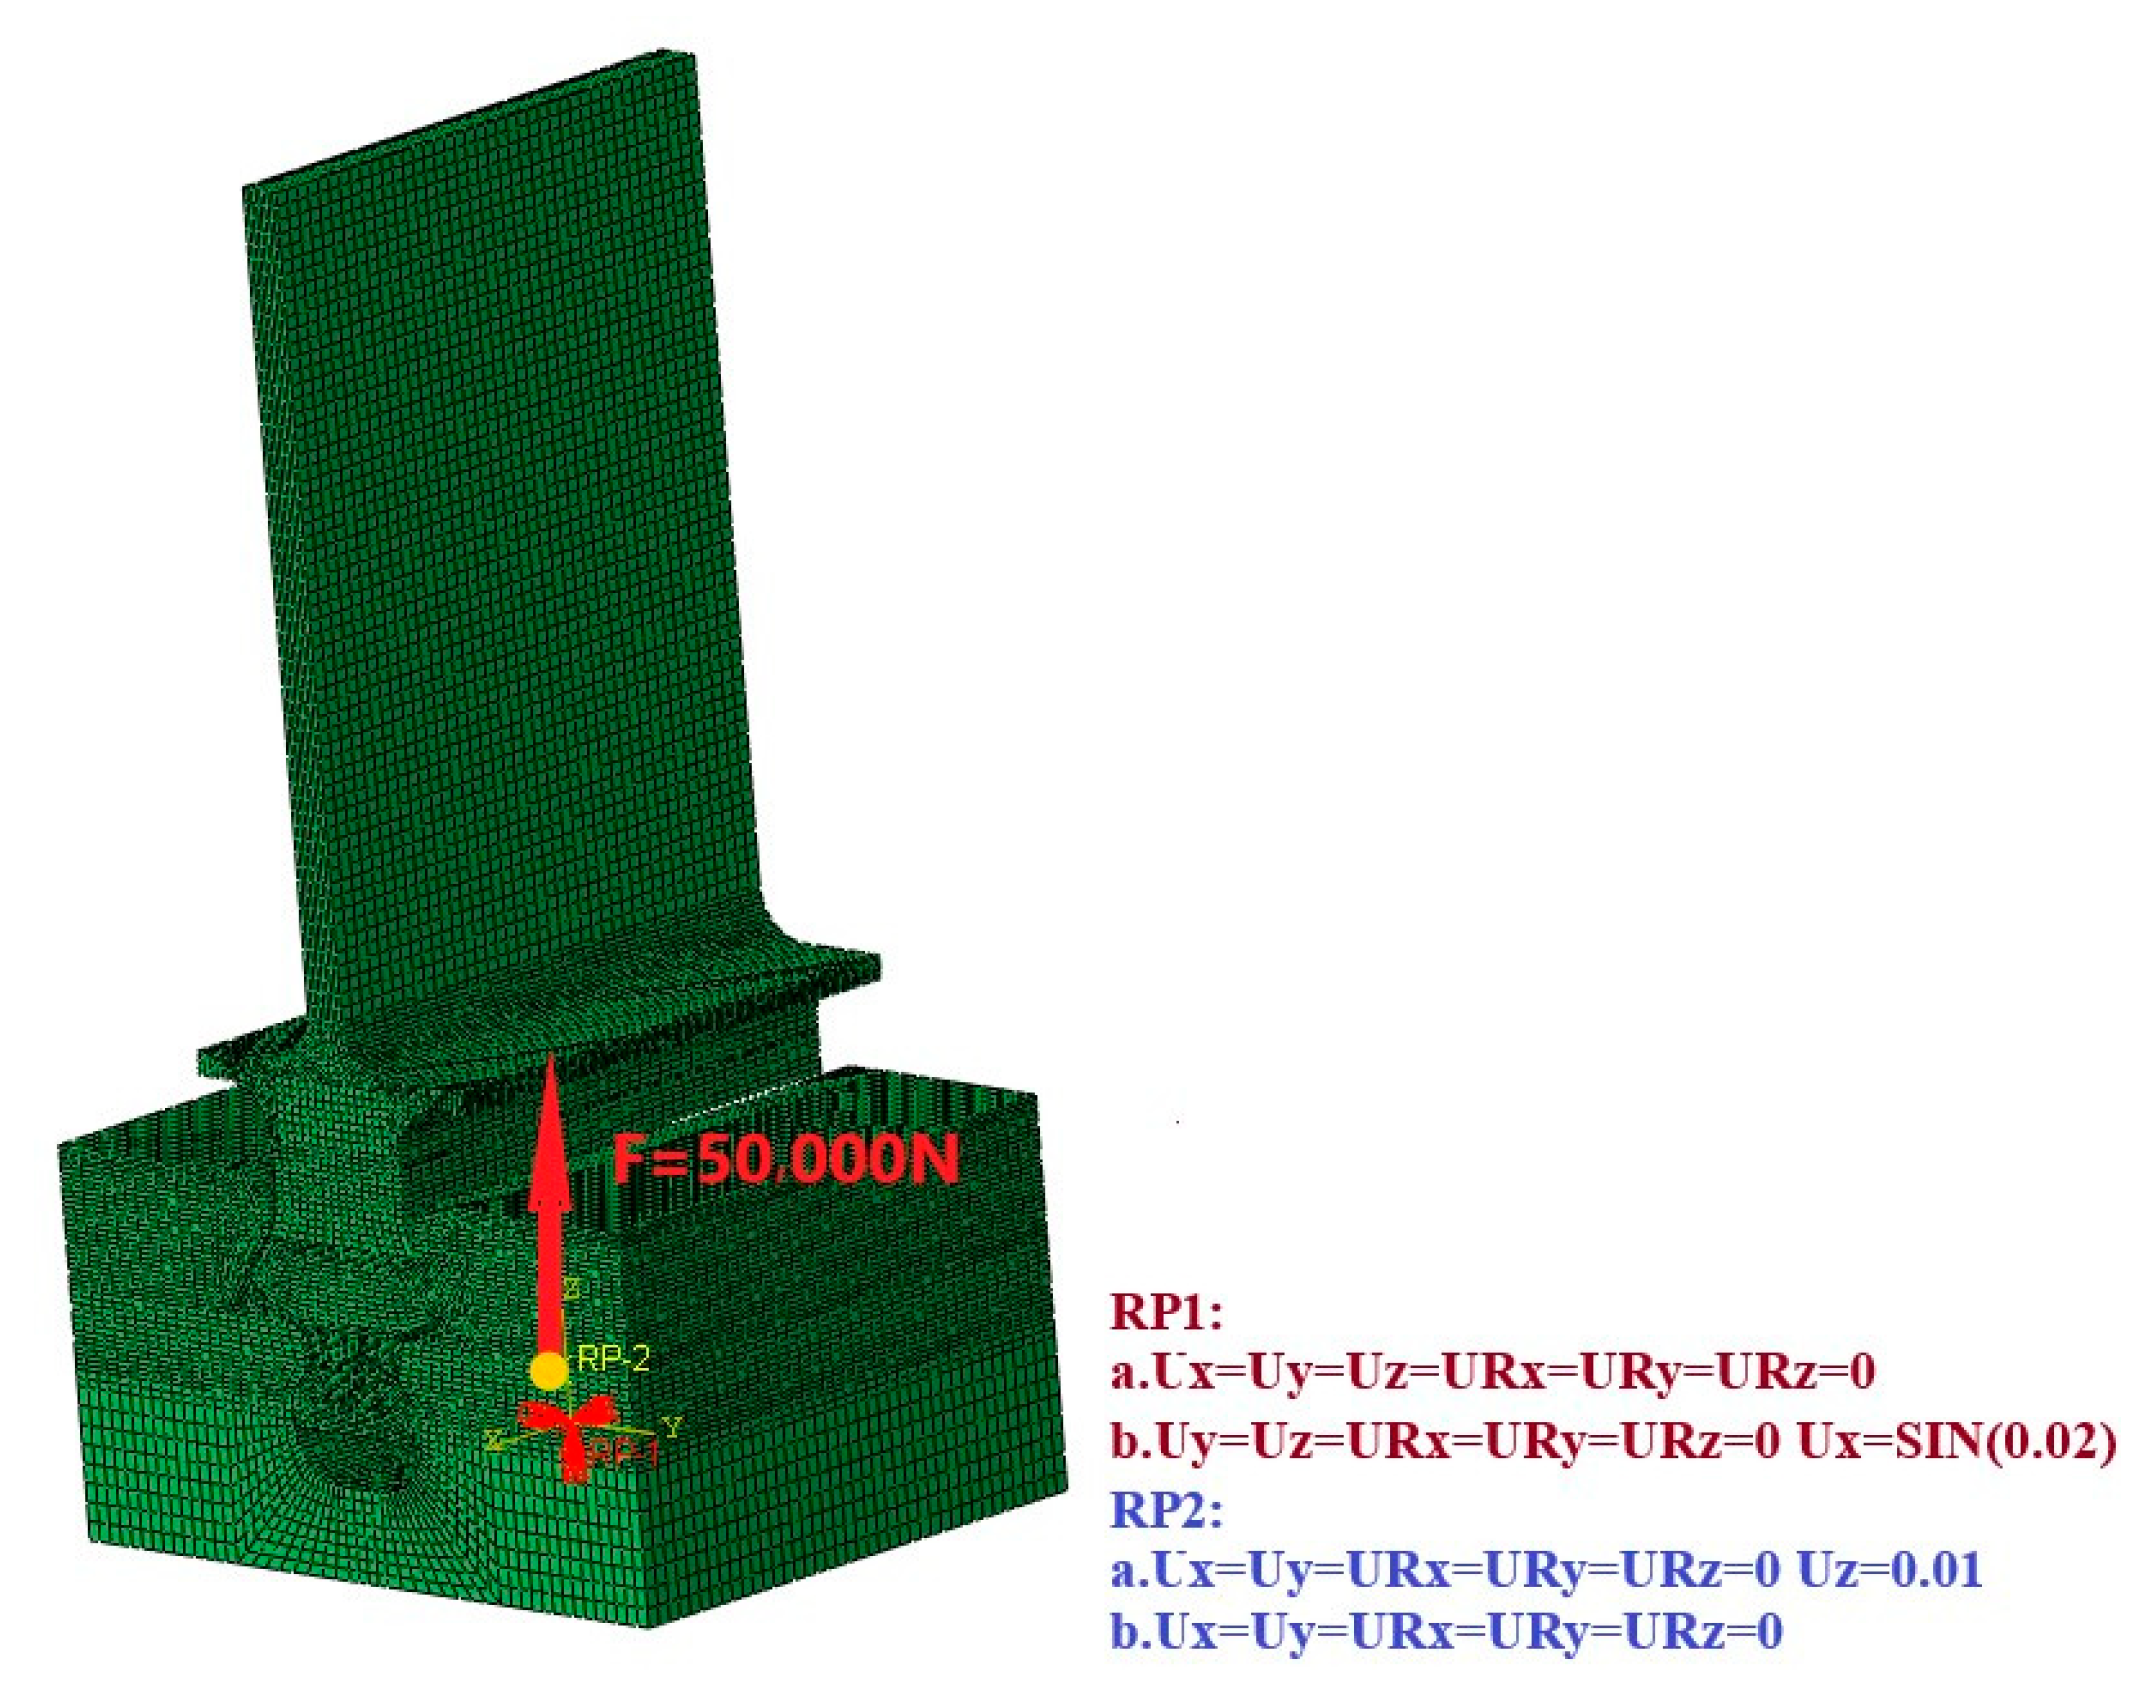
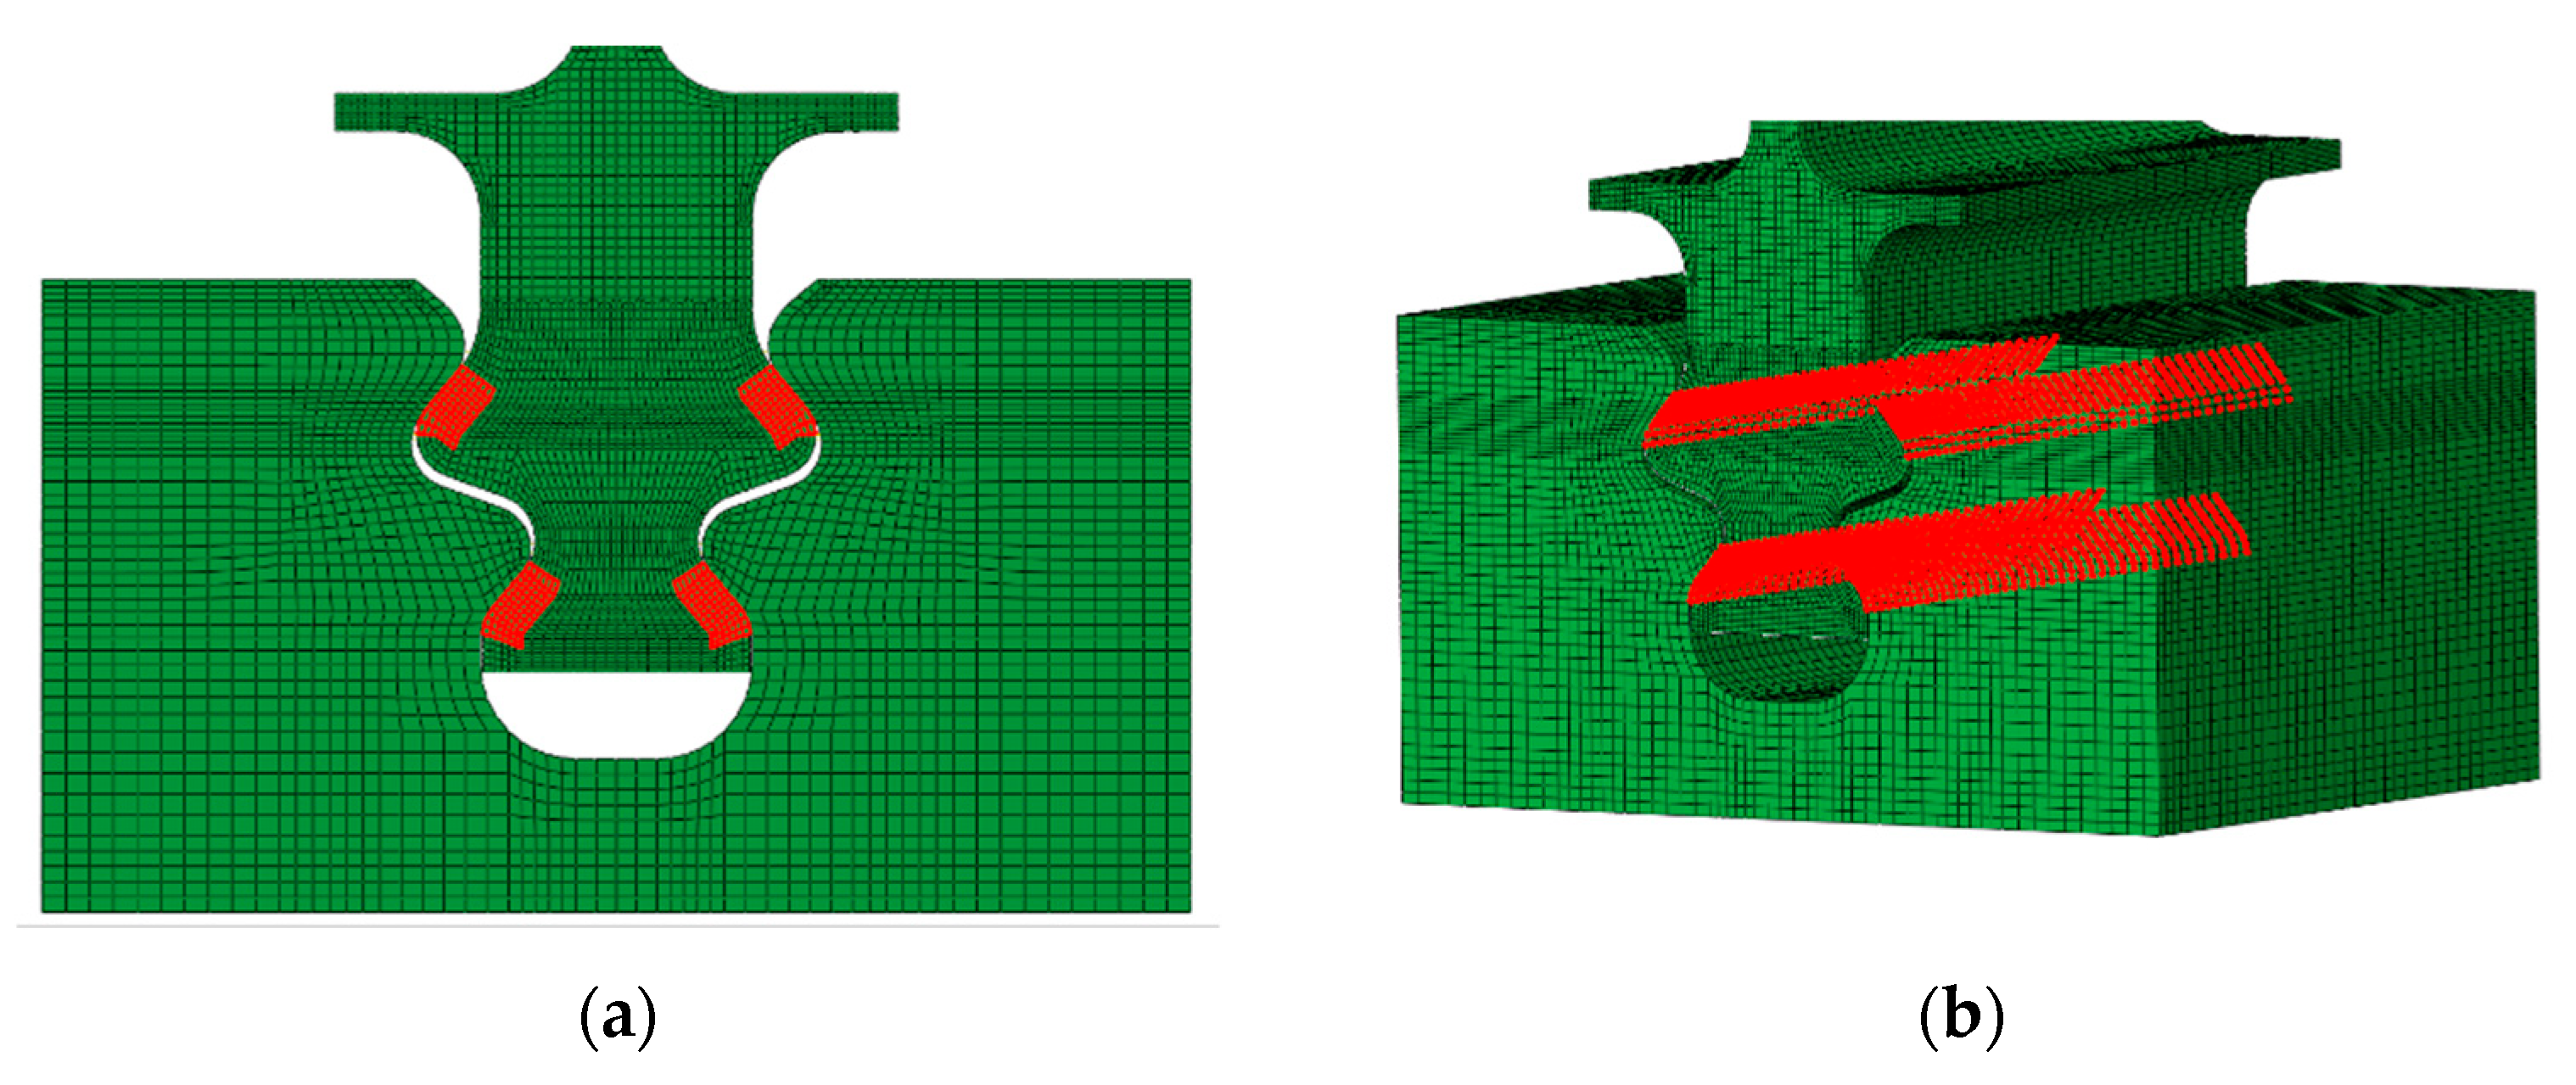
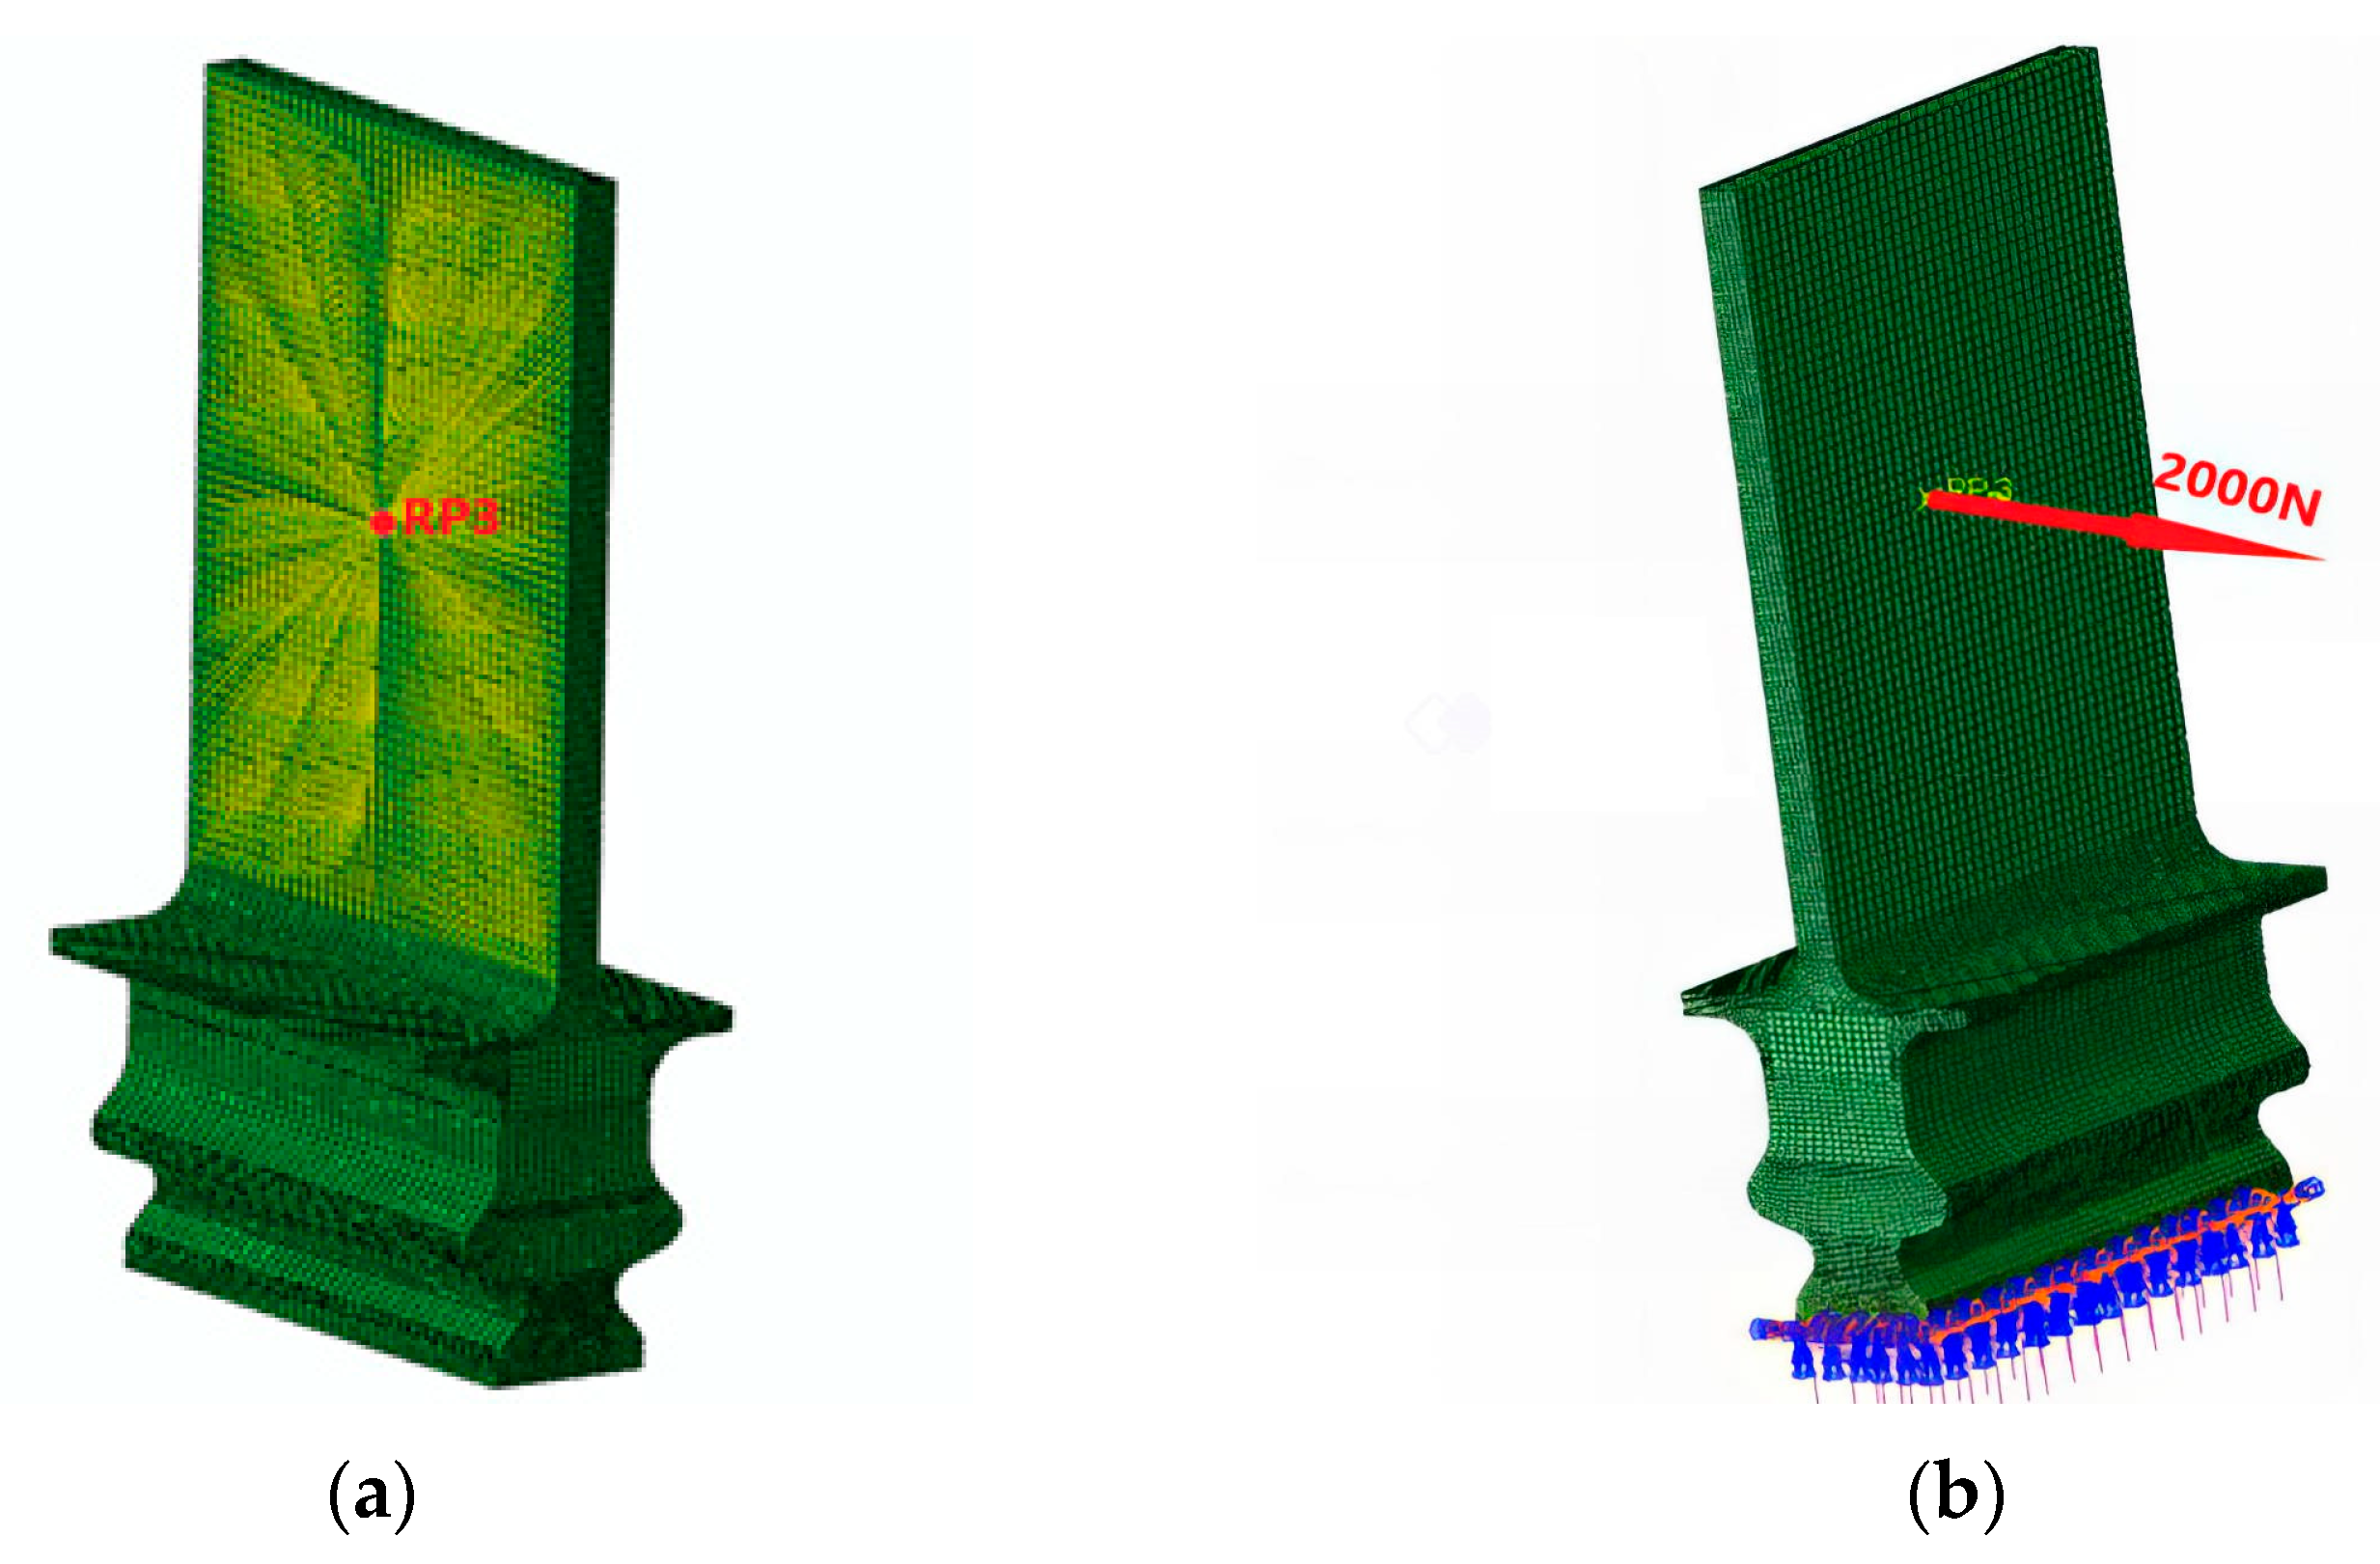
2.3. Finite Element Model

The contact simulation model of a three-dimensional tenon connection structure was established using the finite element software ABAQUS, comprising a tenon blade and a tenon groove. The material properties of each component of the tenon connection structure are shown in Table 1. The tenon of DD6 exhibits a Young’s modulus of 131 GPa and a Poisson’s ratio of 0.344, whereas the tenon groove is composed of GH4720Li with a Young’s modulus of 225 GPa and a Poisson’s ratio of 0.345.
Due to the superior accuracy of hexahedral elements in solving problems and the necessity for ALE elements, a hexahedral mesh was employed to divide all models presented in this paper. In the contact region [27], we utilized an eight-node Hexahedral Element with Reduced Integration (C3D8R) for mesh partitioning. To minimize the influence of the mesh distortion induced by bending loads on analysis accuracy and prevent a mesh self-locking phenomenon, at least 4 layers of elements are needed in the thickness direction. The mesh size in the contact area between the tenon and tenon groove was refined to 0.2 × 0.5 mm. The schematic diagram of the tenon connection structure, including its overall mesh division, is shown in Figure 2.
To facilitate the application of boundary conditions, the underside of the blade is coupled to reference point RP1, while the tenon groove is rigidly coupled to reference point RP2. During the loading stage, a concentrated force is applied on RP1 to simulate the centrifugal load generated during blade rotation, and the tenon groove is fixed by a constraint imposed on RP2. After the load is fully applied, a sinusoidal displacement constraint with an amplitude of 20 µm is imposed on RP2.
R P 1 : L o a d = F N R P 2 :   S x , S y , S z = 0.02   S I N ( 100 π t )   ( m m )
where F is the concentrated force applied to RP1, S x , S y , and S z are displacements in the x or y or z direction applied to RP2, respectively, and t is the simulation time. The boundary conditions of the tenon connection structure are shown in Figure 3.
The fretting wear simulation in this study was conducted using an iterative process that combined the ABAQUS commercial finite element (FE) software with a user-defined subroutine UMESHMOTION written in FORTRAN. The initial parameters required for the simulation can be categorized into two parts: one part pertains to the FE model in ABAQUS, which includes contact geometry, material properties, normal load, displacement amplitude, loading process, and coefficient of friction (COF = 0.56); the other part relates to the wear model implemented in FORTRAN. The Archard wear model was compiled in UMESHMOTION to extract contact pressure and relative slip returning to ABAQUS for further calculation. The movement of the nodes did not induce stress-strain, enabling the execution of wear calculations. To balance the computational efficiency and accuracy, a jump cycle of 3600 was selected. Additionally, Arbitrary Lagrangian–Eulerian (ALE) adaptive meshing was employed to address the significant deformation of cells resulting from node movement, particularly the distortion of the mesh that would otherwise impede calculations. The ALE mesh area is defined as the region with a certain thickness along the normal direction of the contact surface between the tenon and tenon groove, while the ALE node is selected at the contact tooth surface of the tenon, as shown in Figure 4.
In this paper, the simulation used a computer configuration of AMD Ryzen Threadripper 3970 X (CPU), 128 GB RAM, NVIDIA GeForce 2080 RTX graphics card, and Windows 10 operating systems (64-bit). It takes 8 h to calculate the wear simulation of the tenon connection structure under one working condition.

3. Results and Discussion

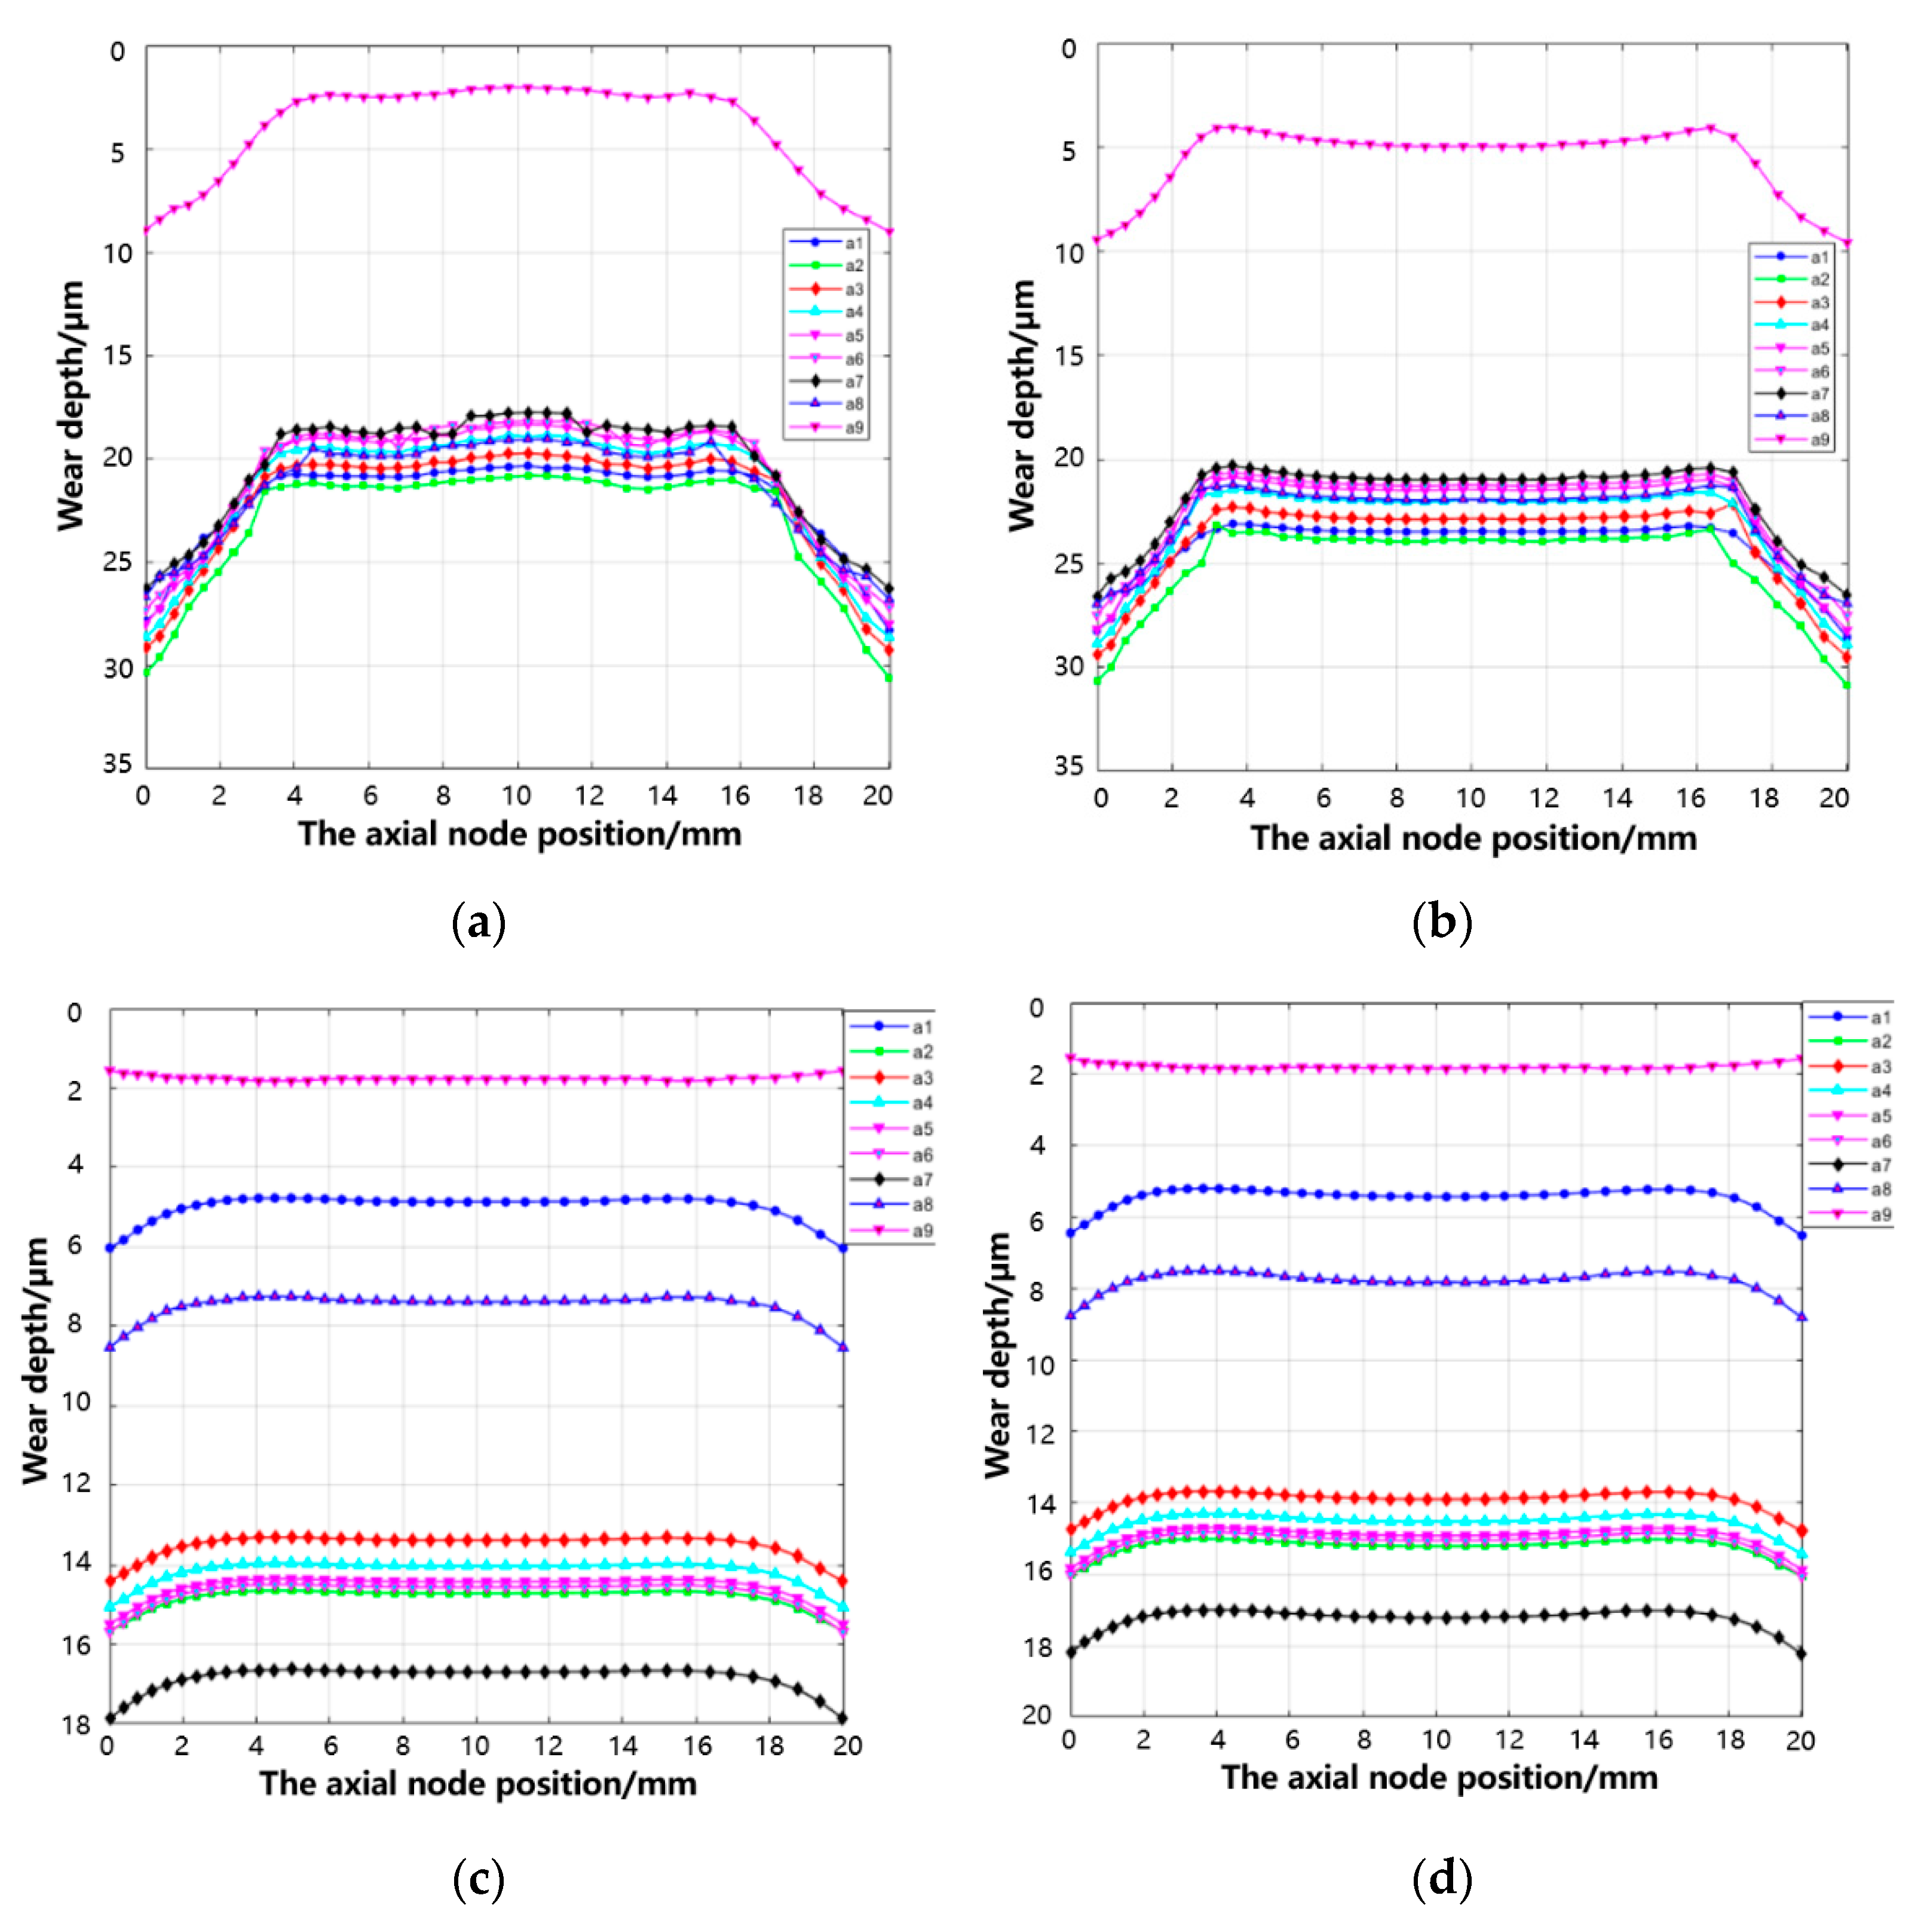
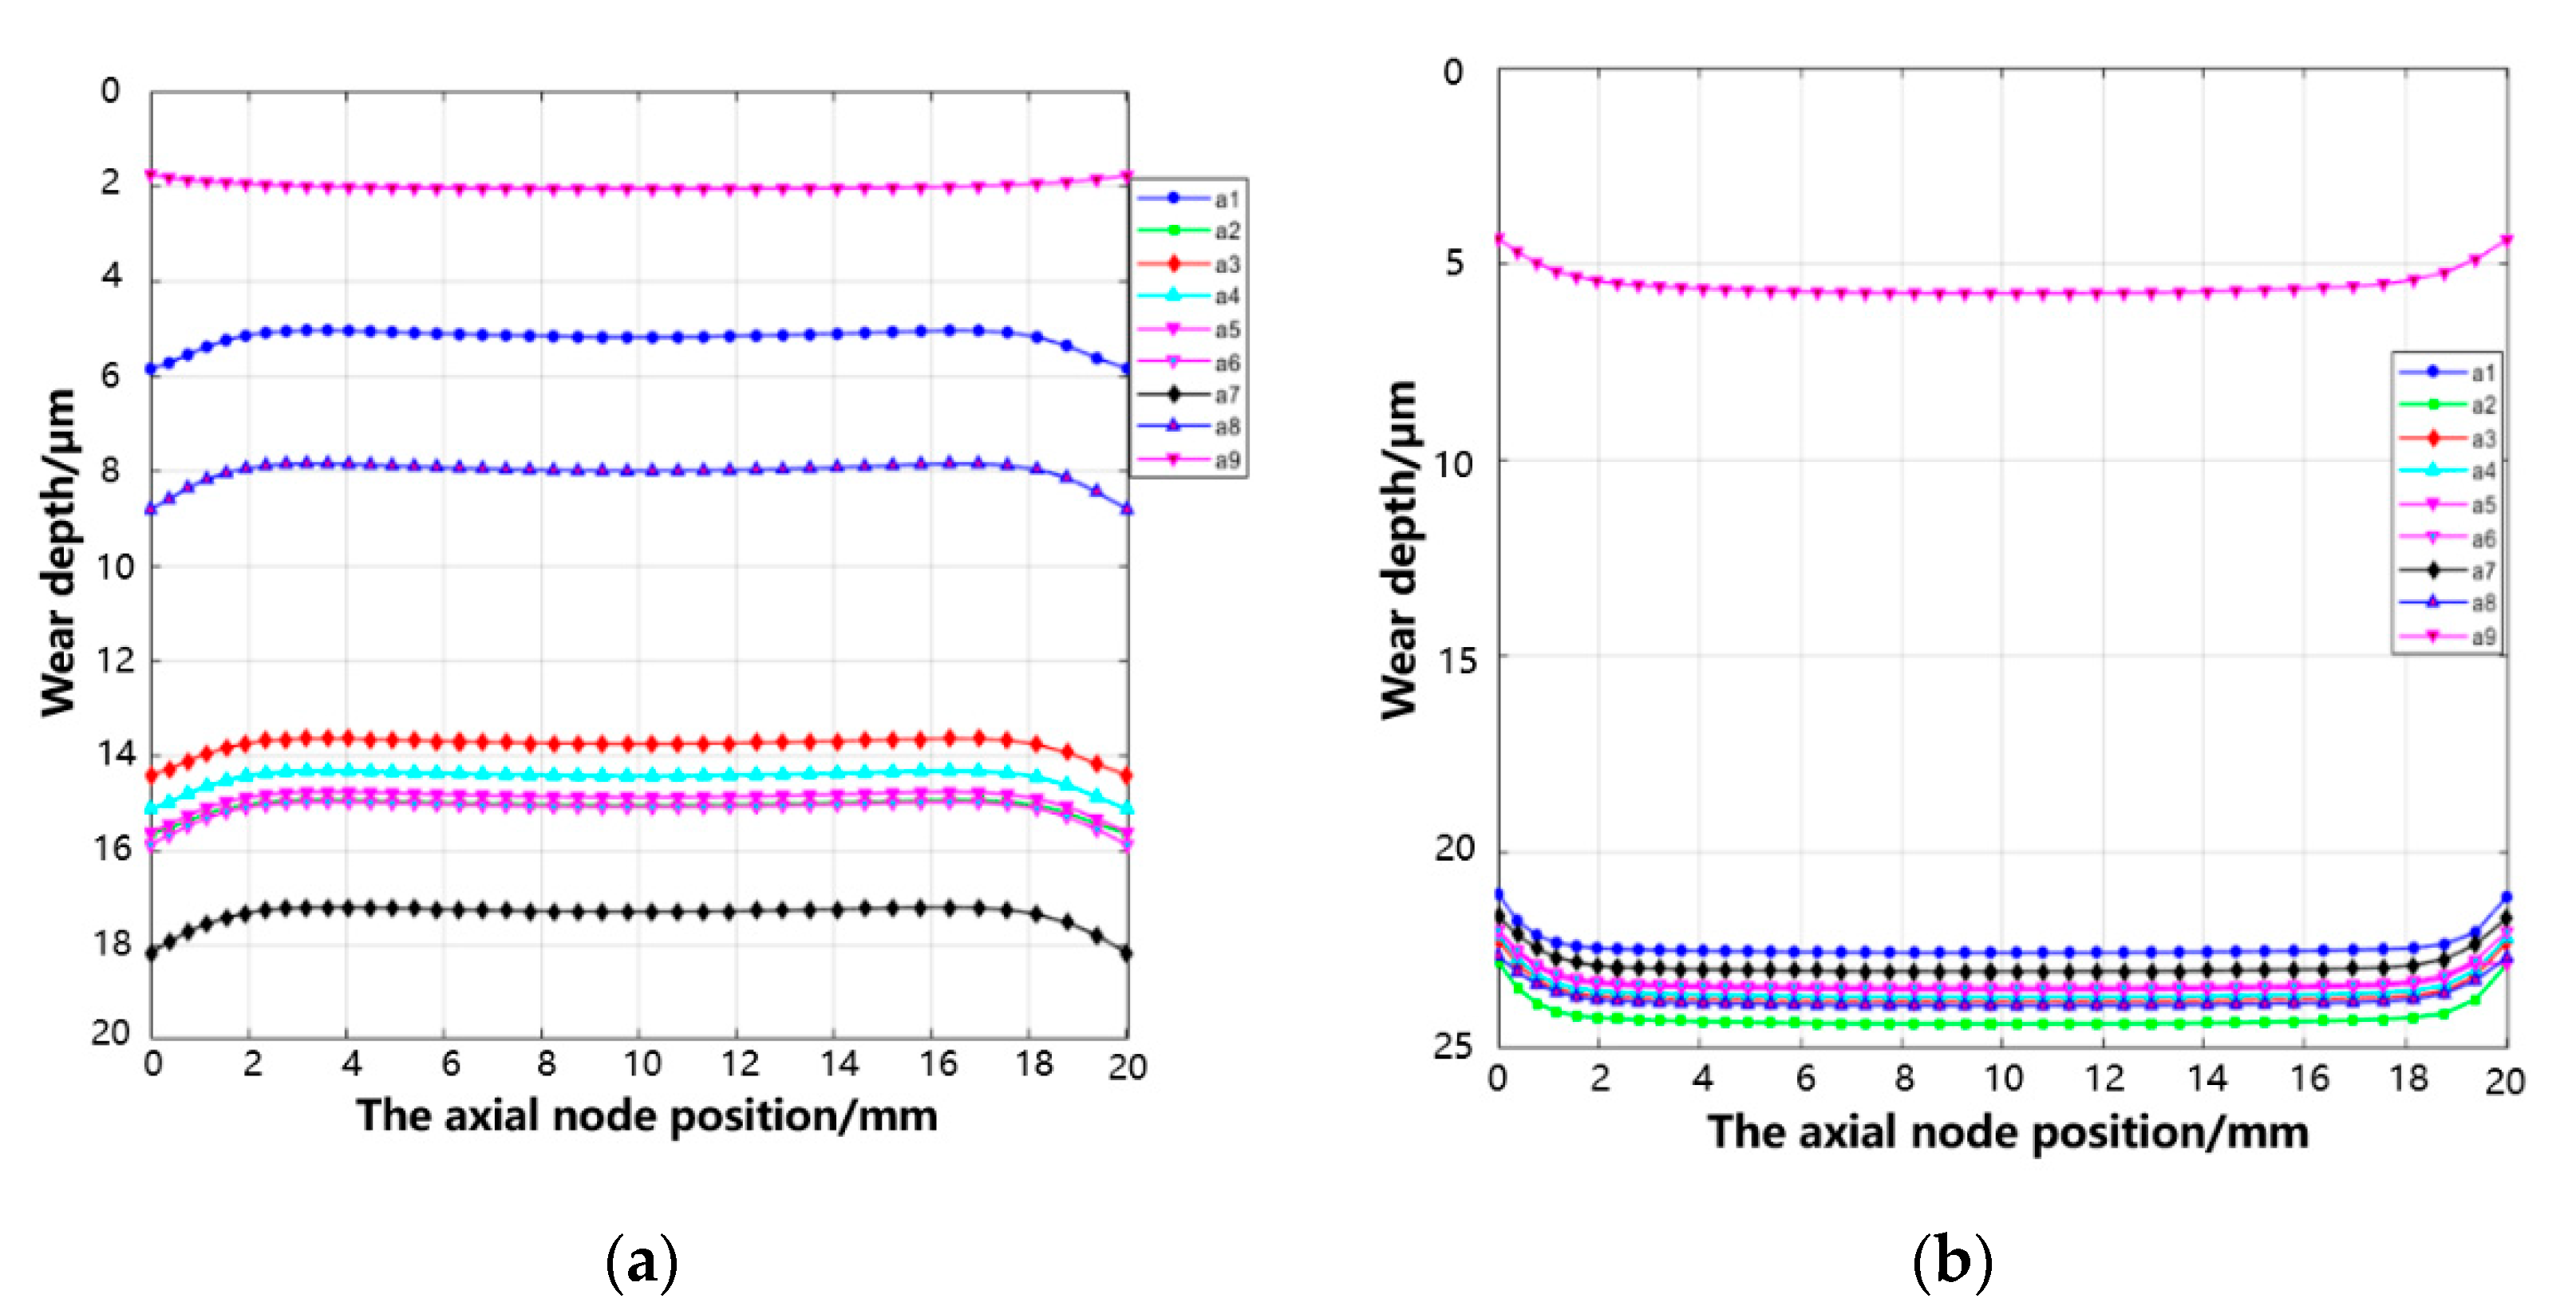
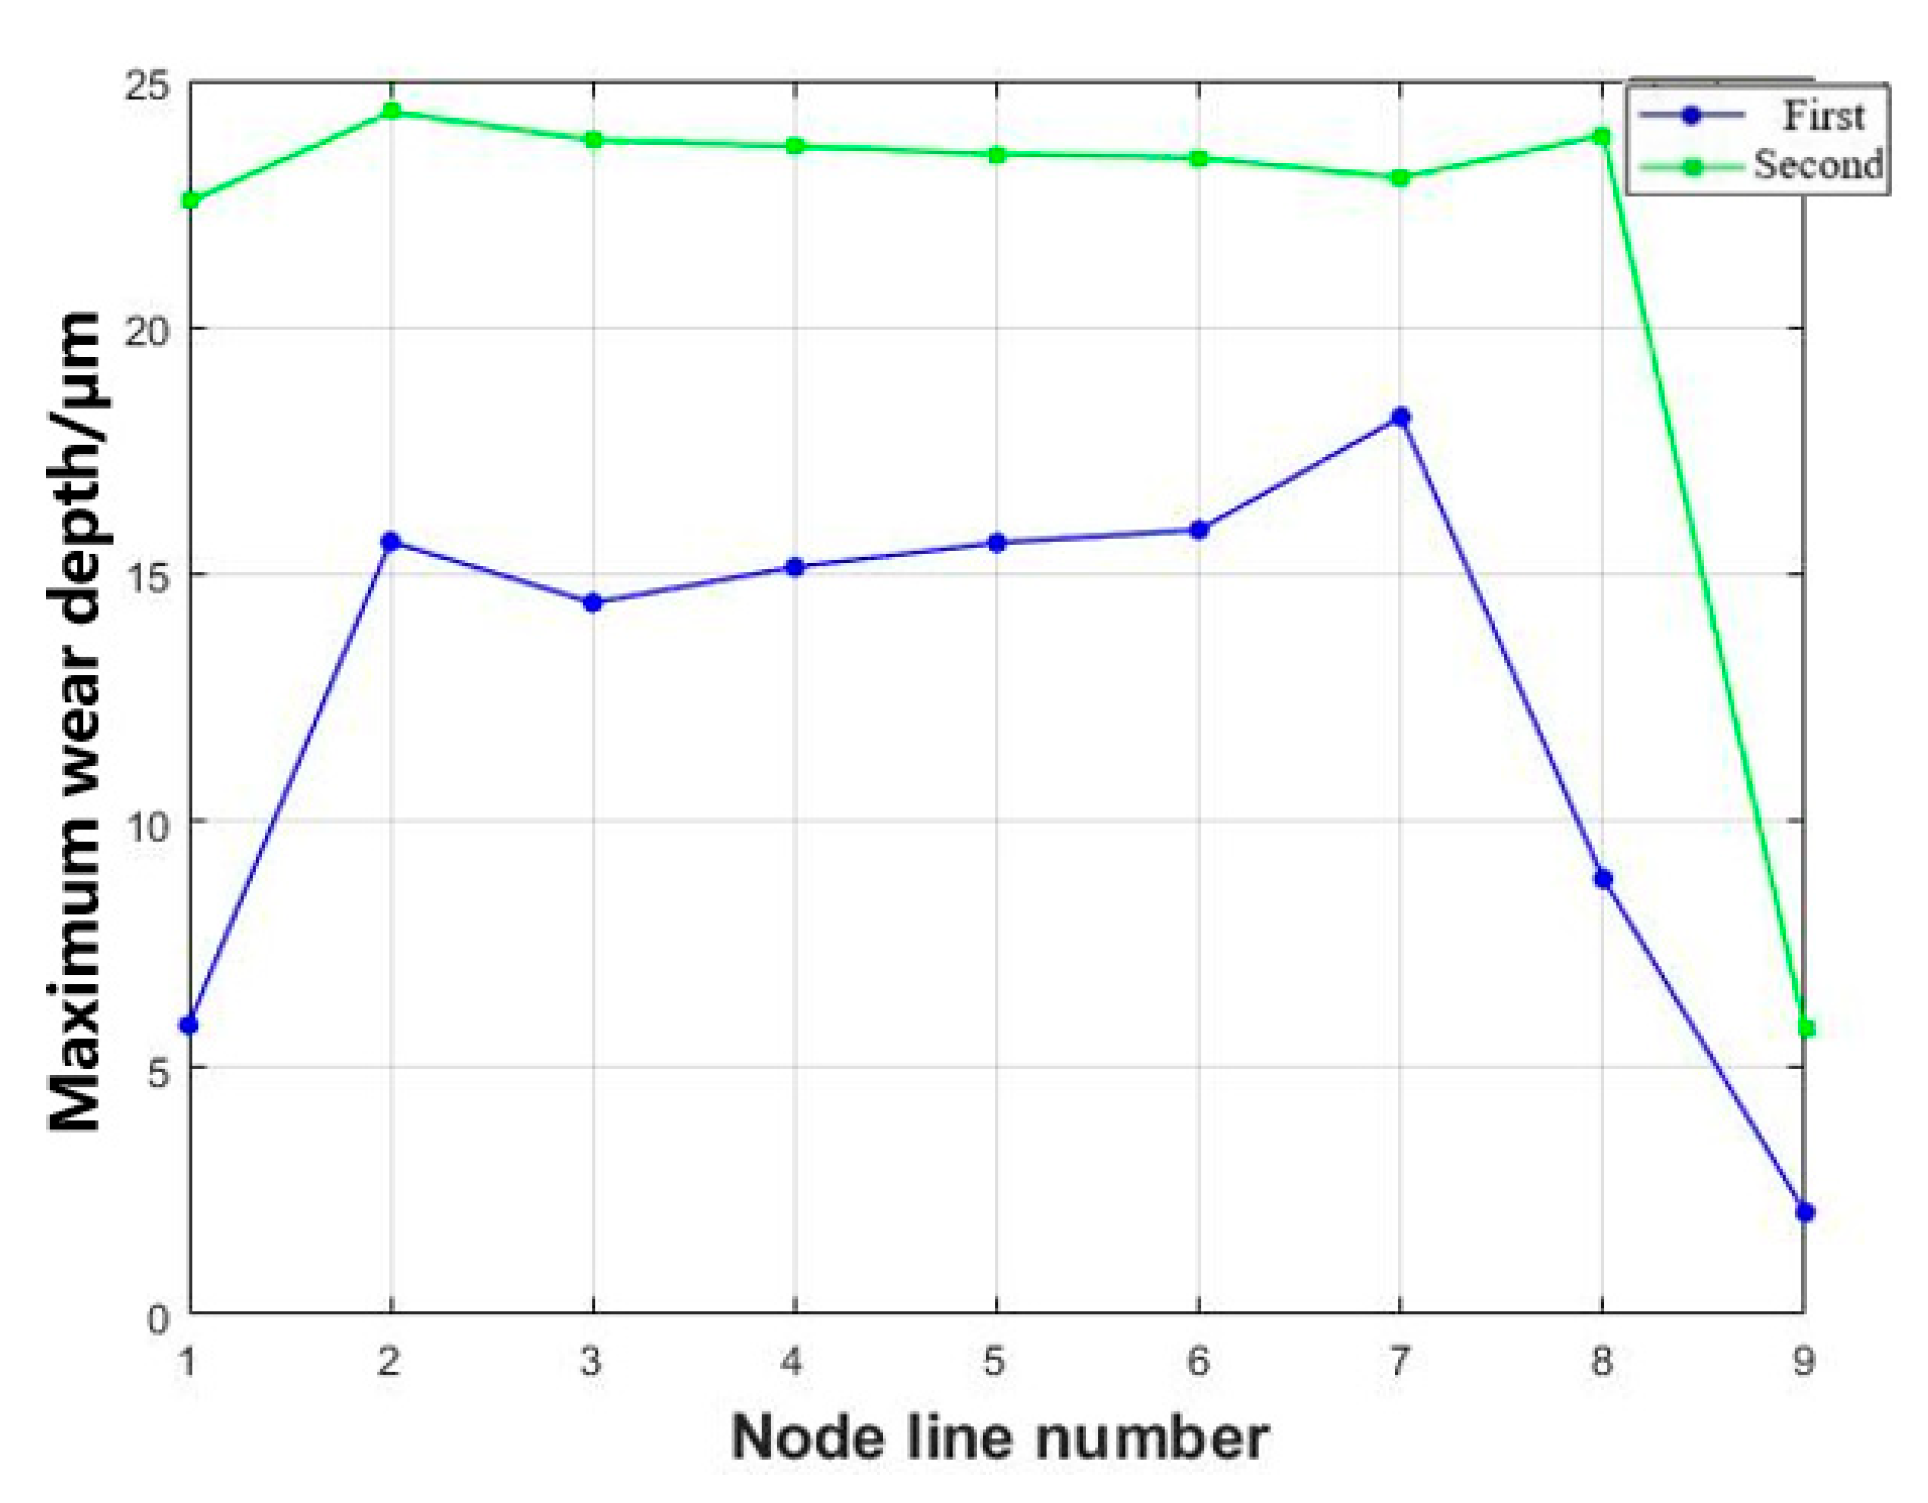
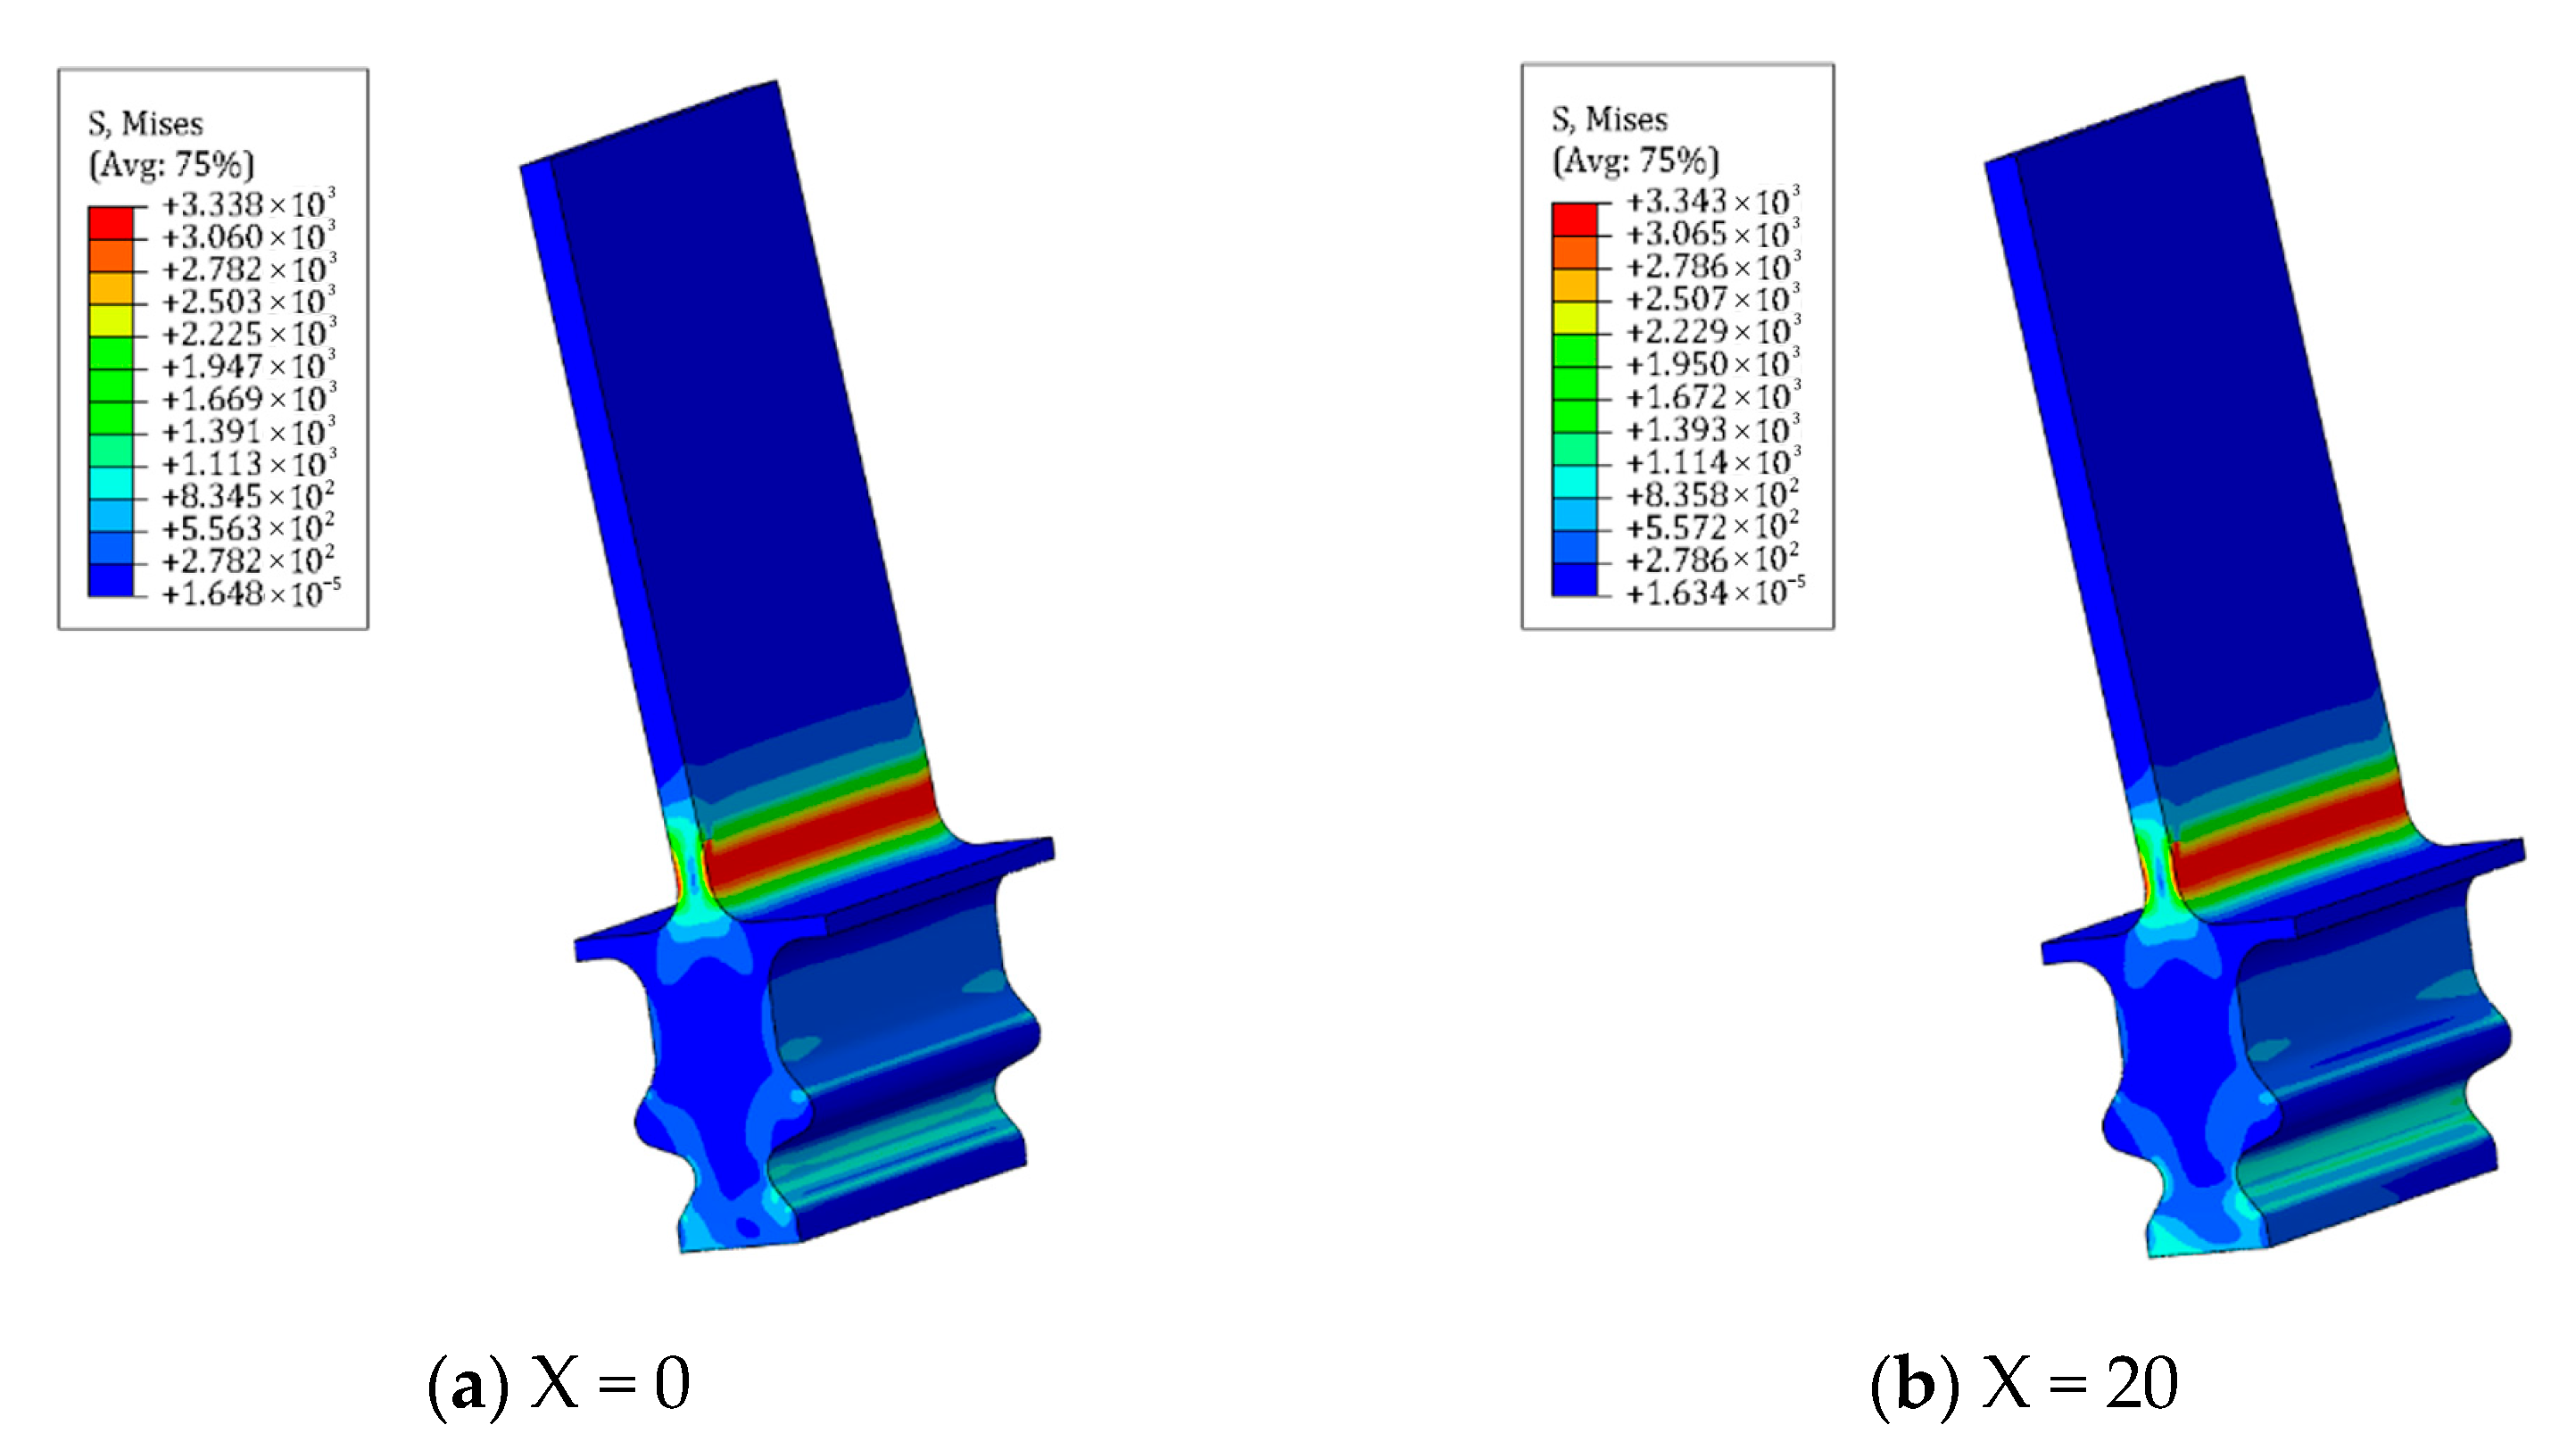
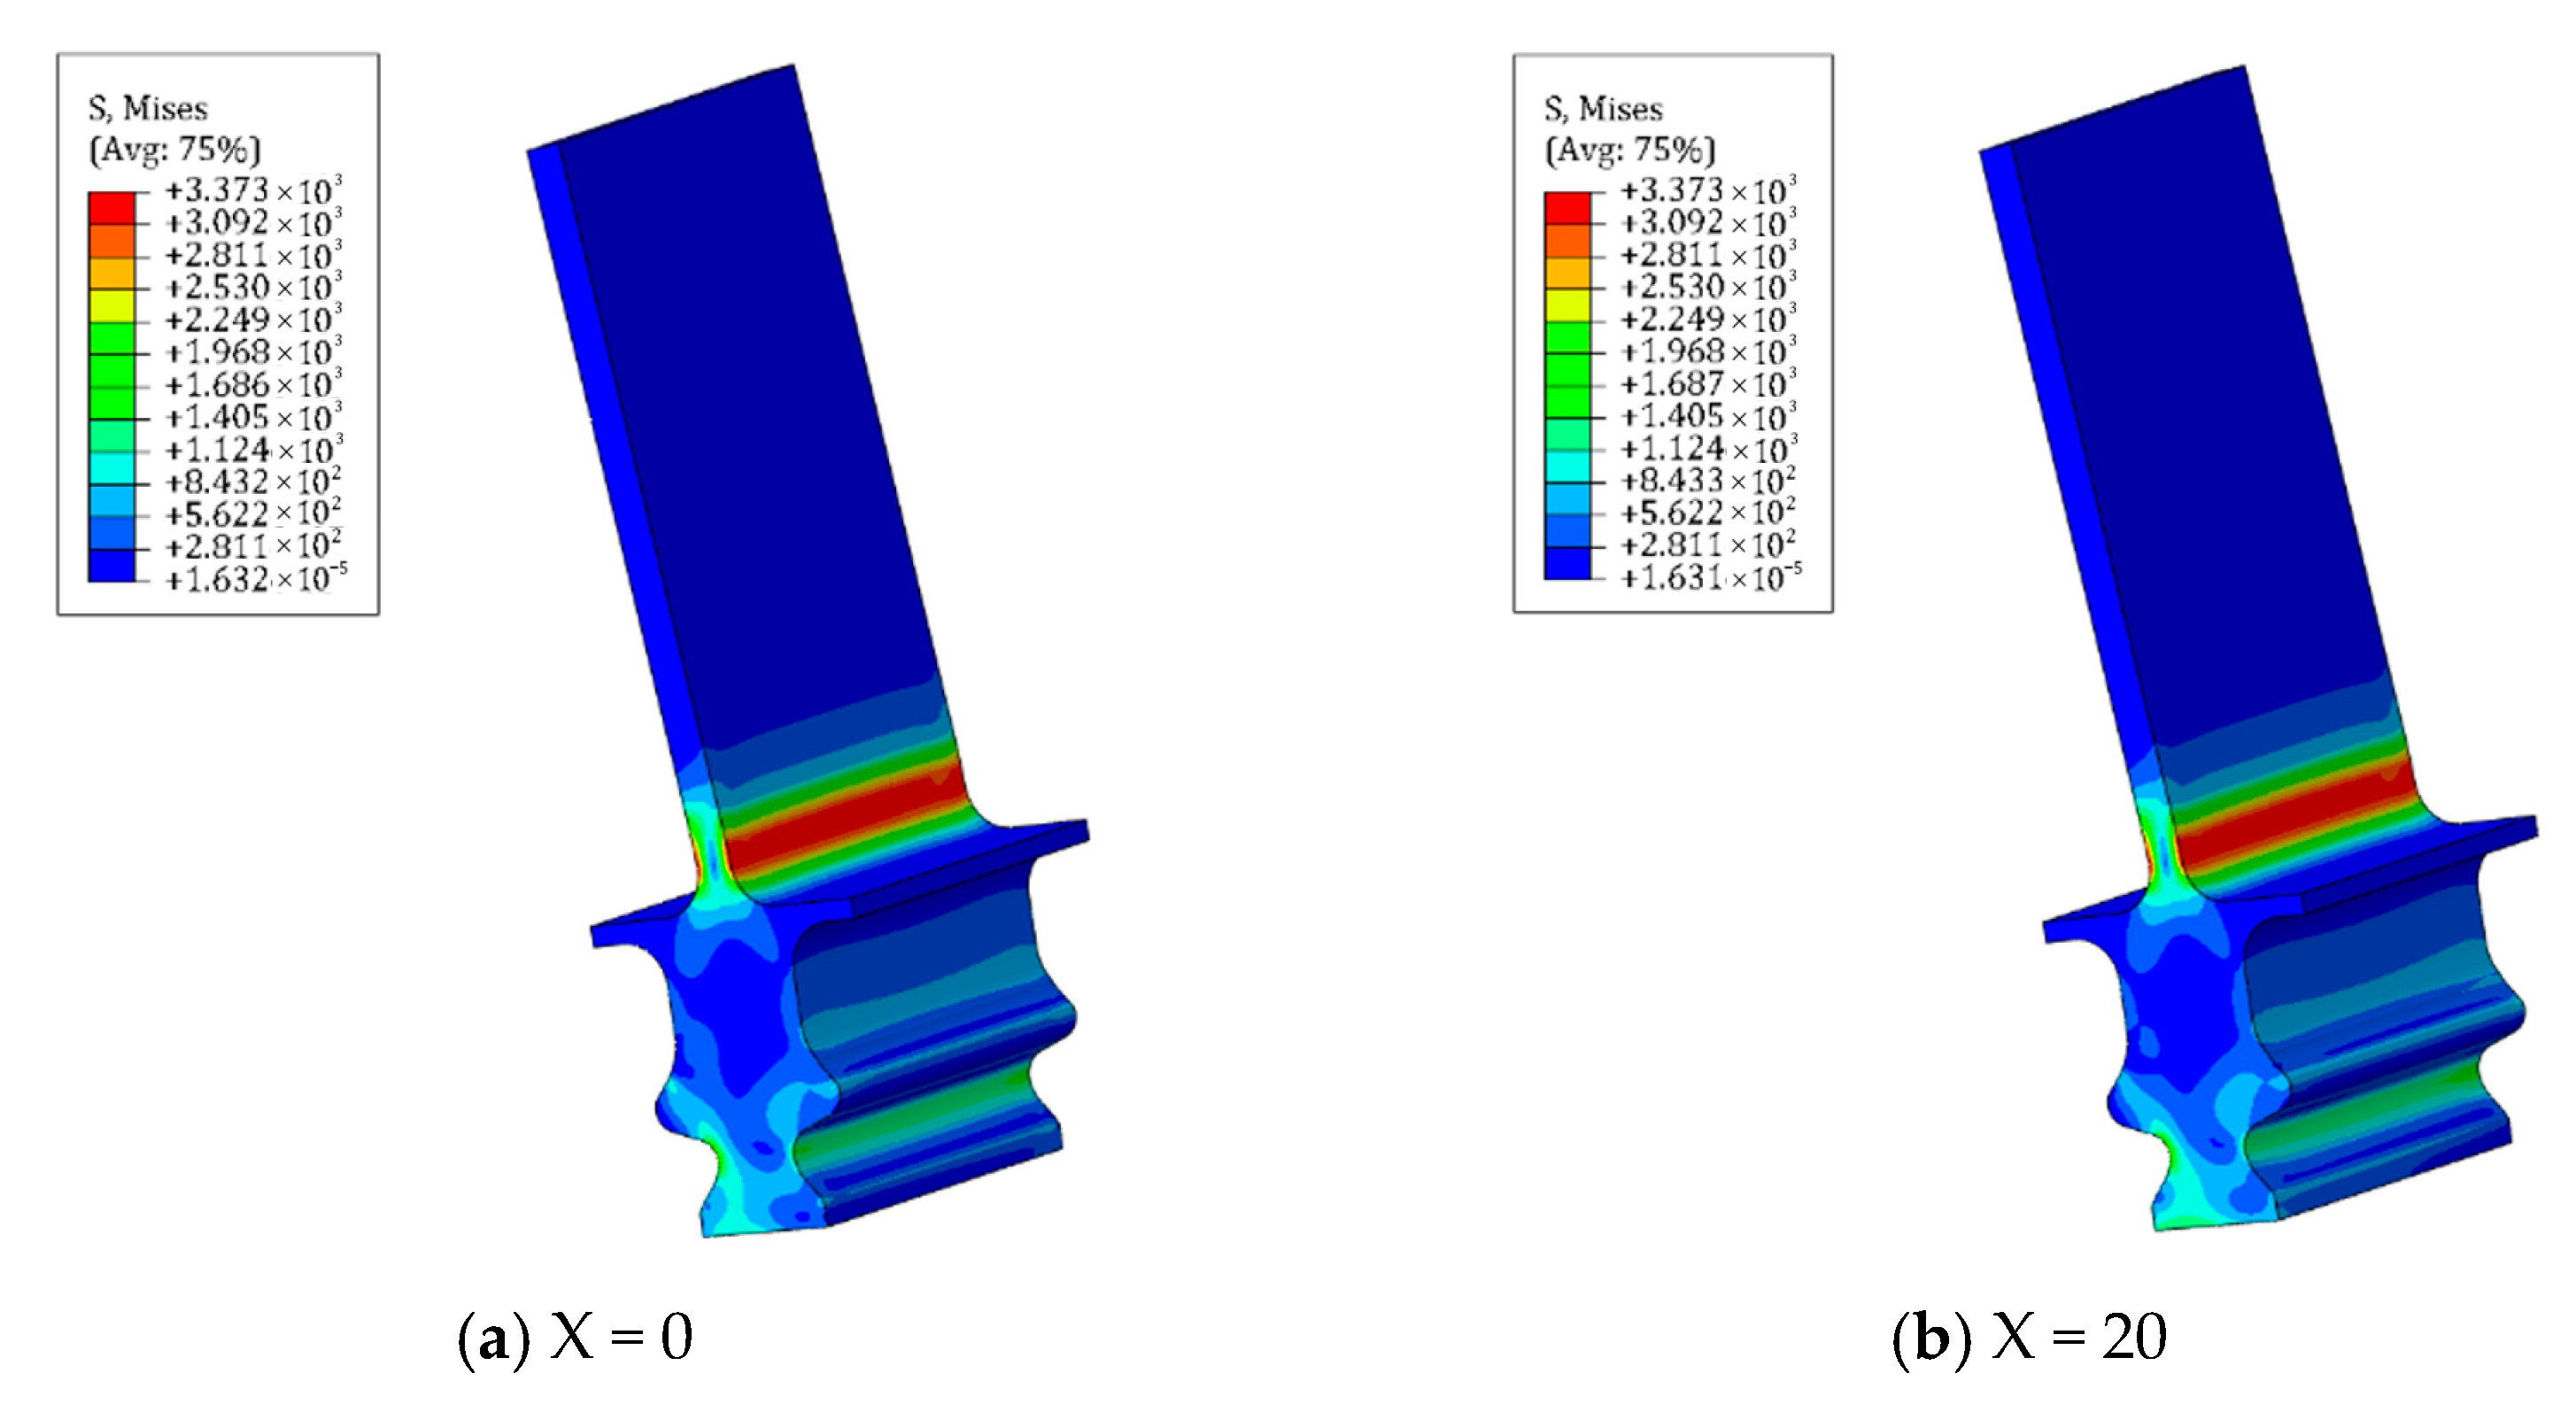
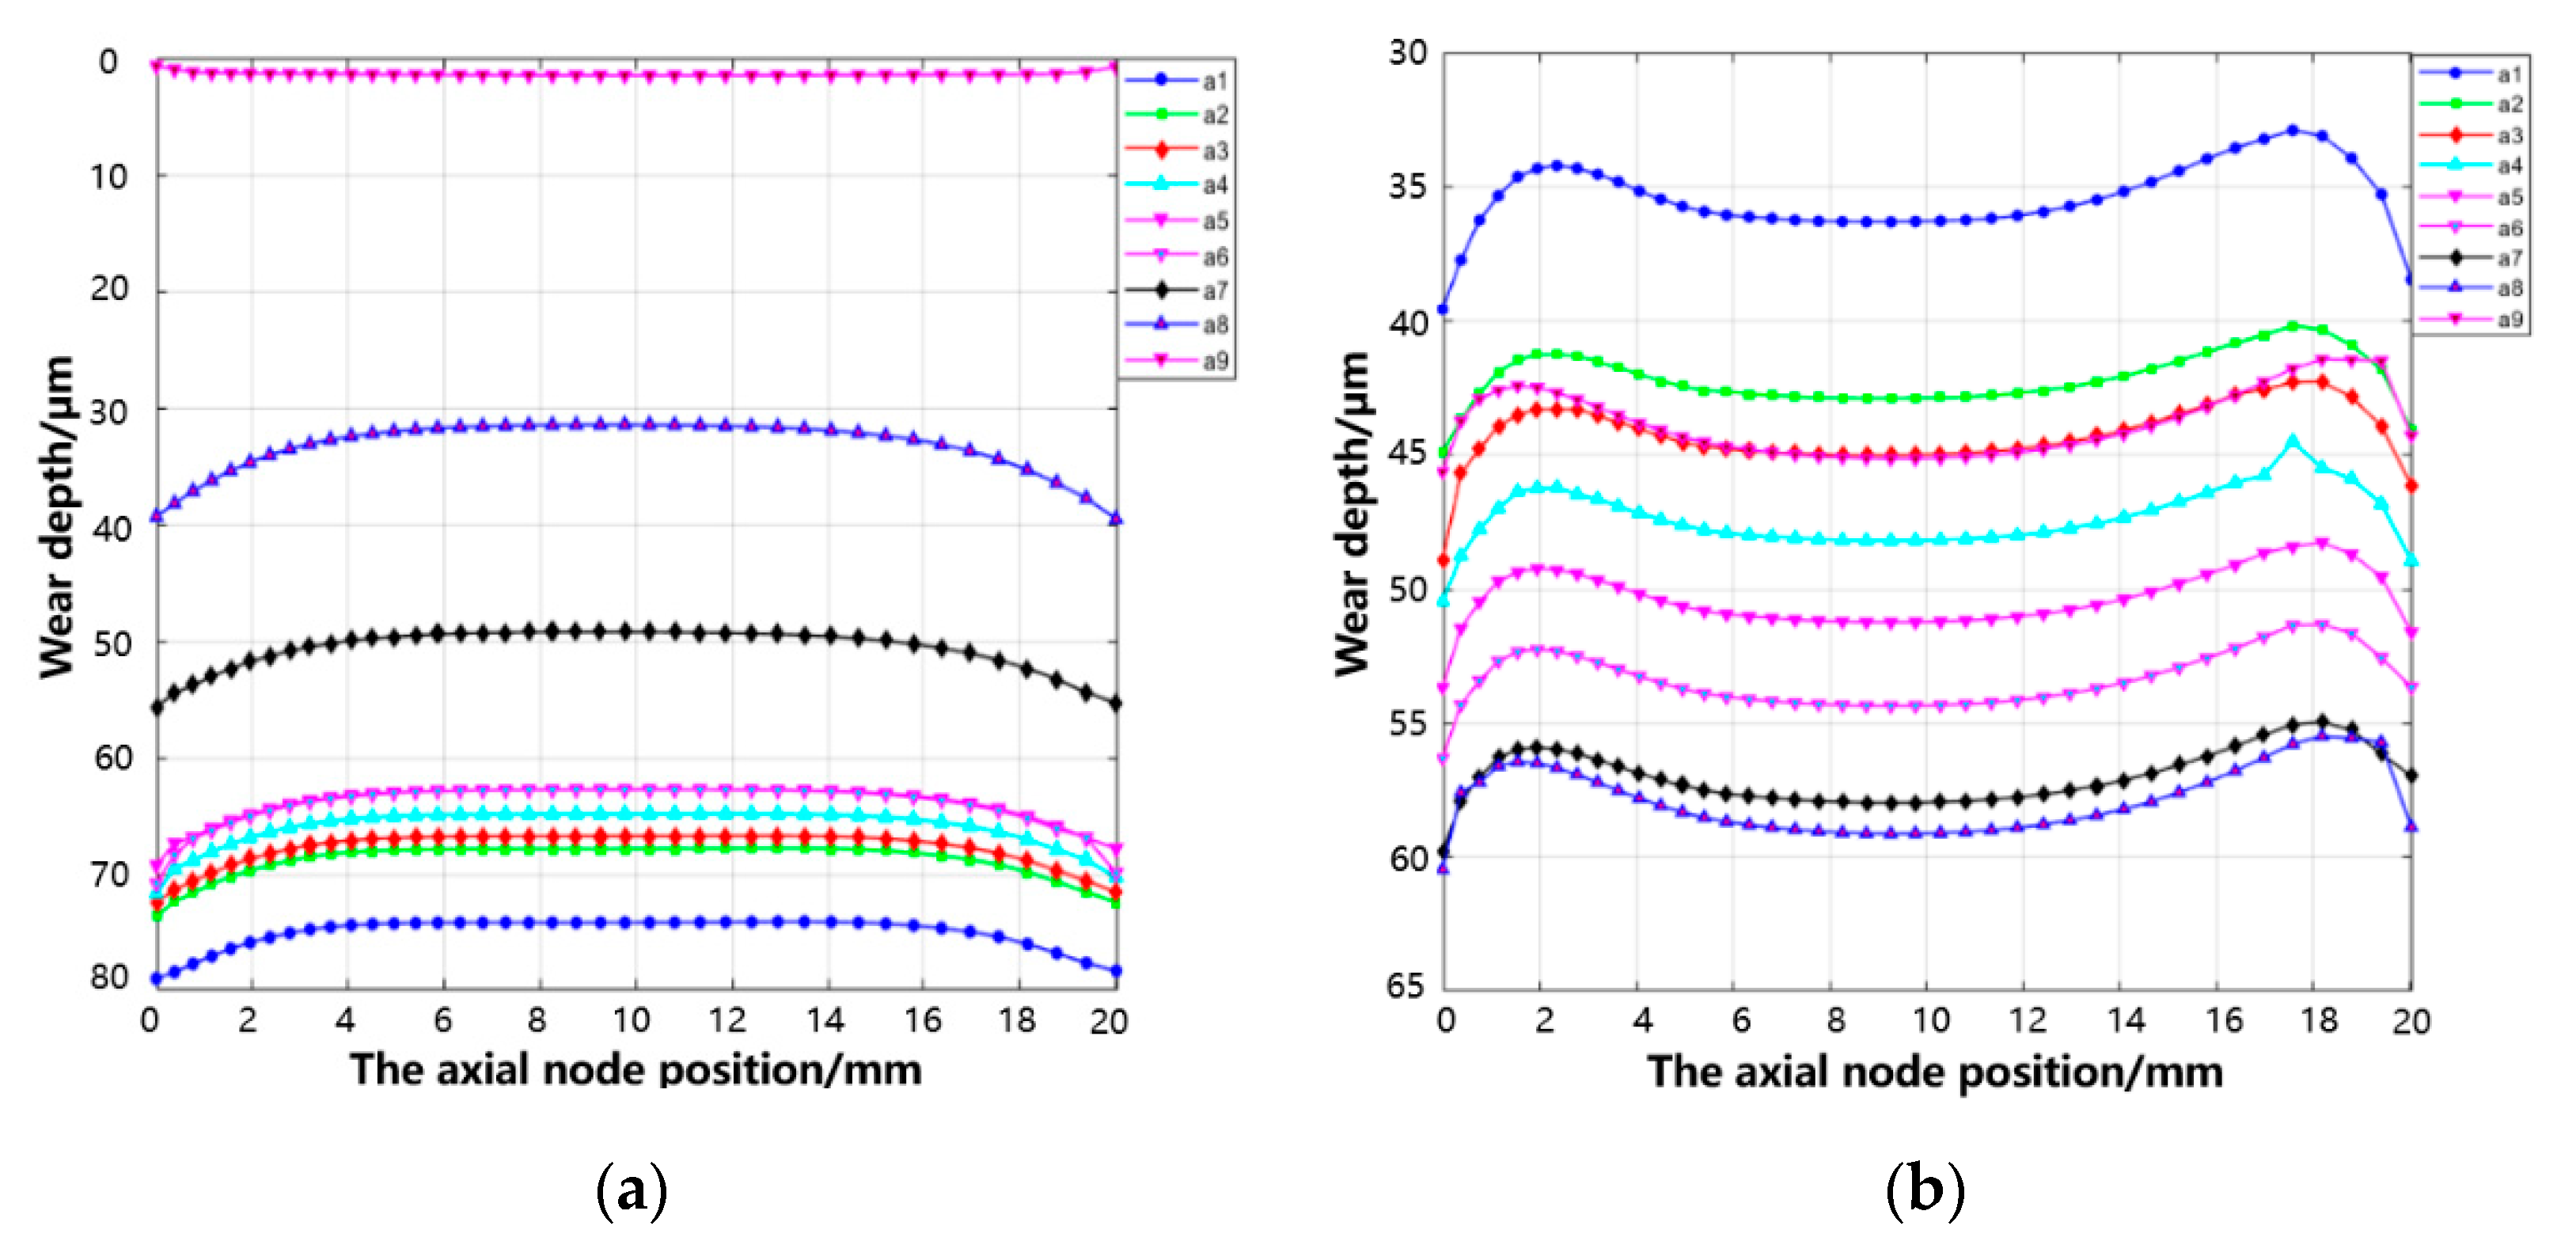
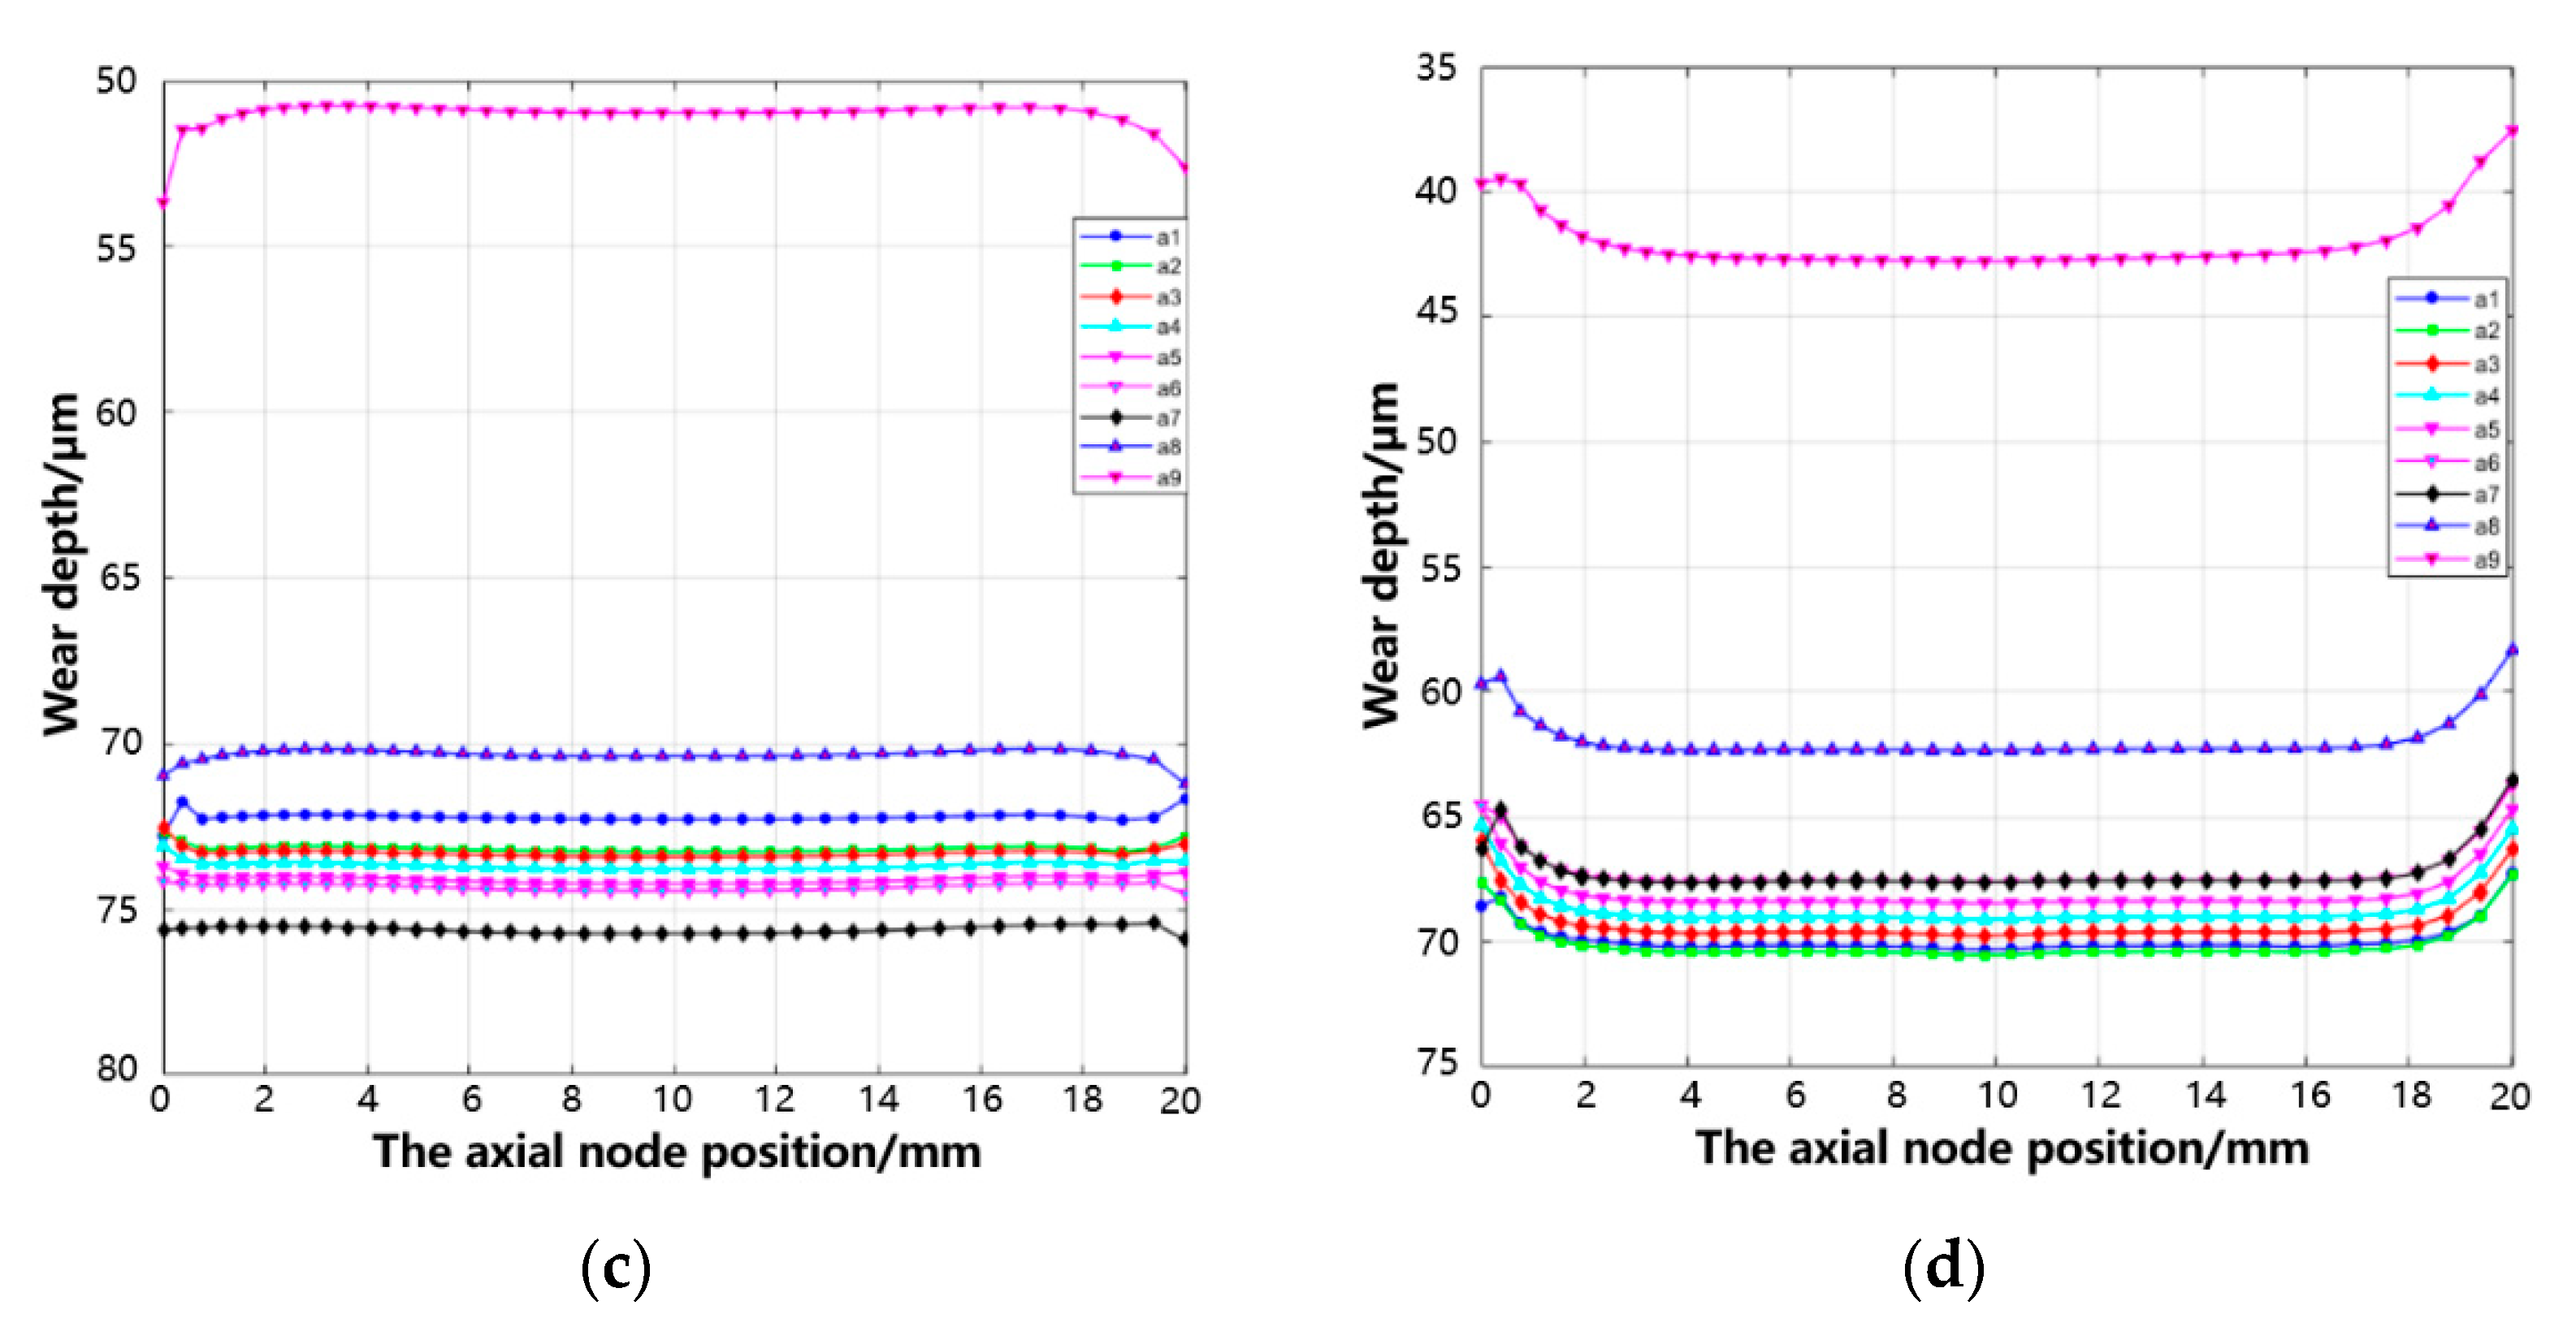
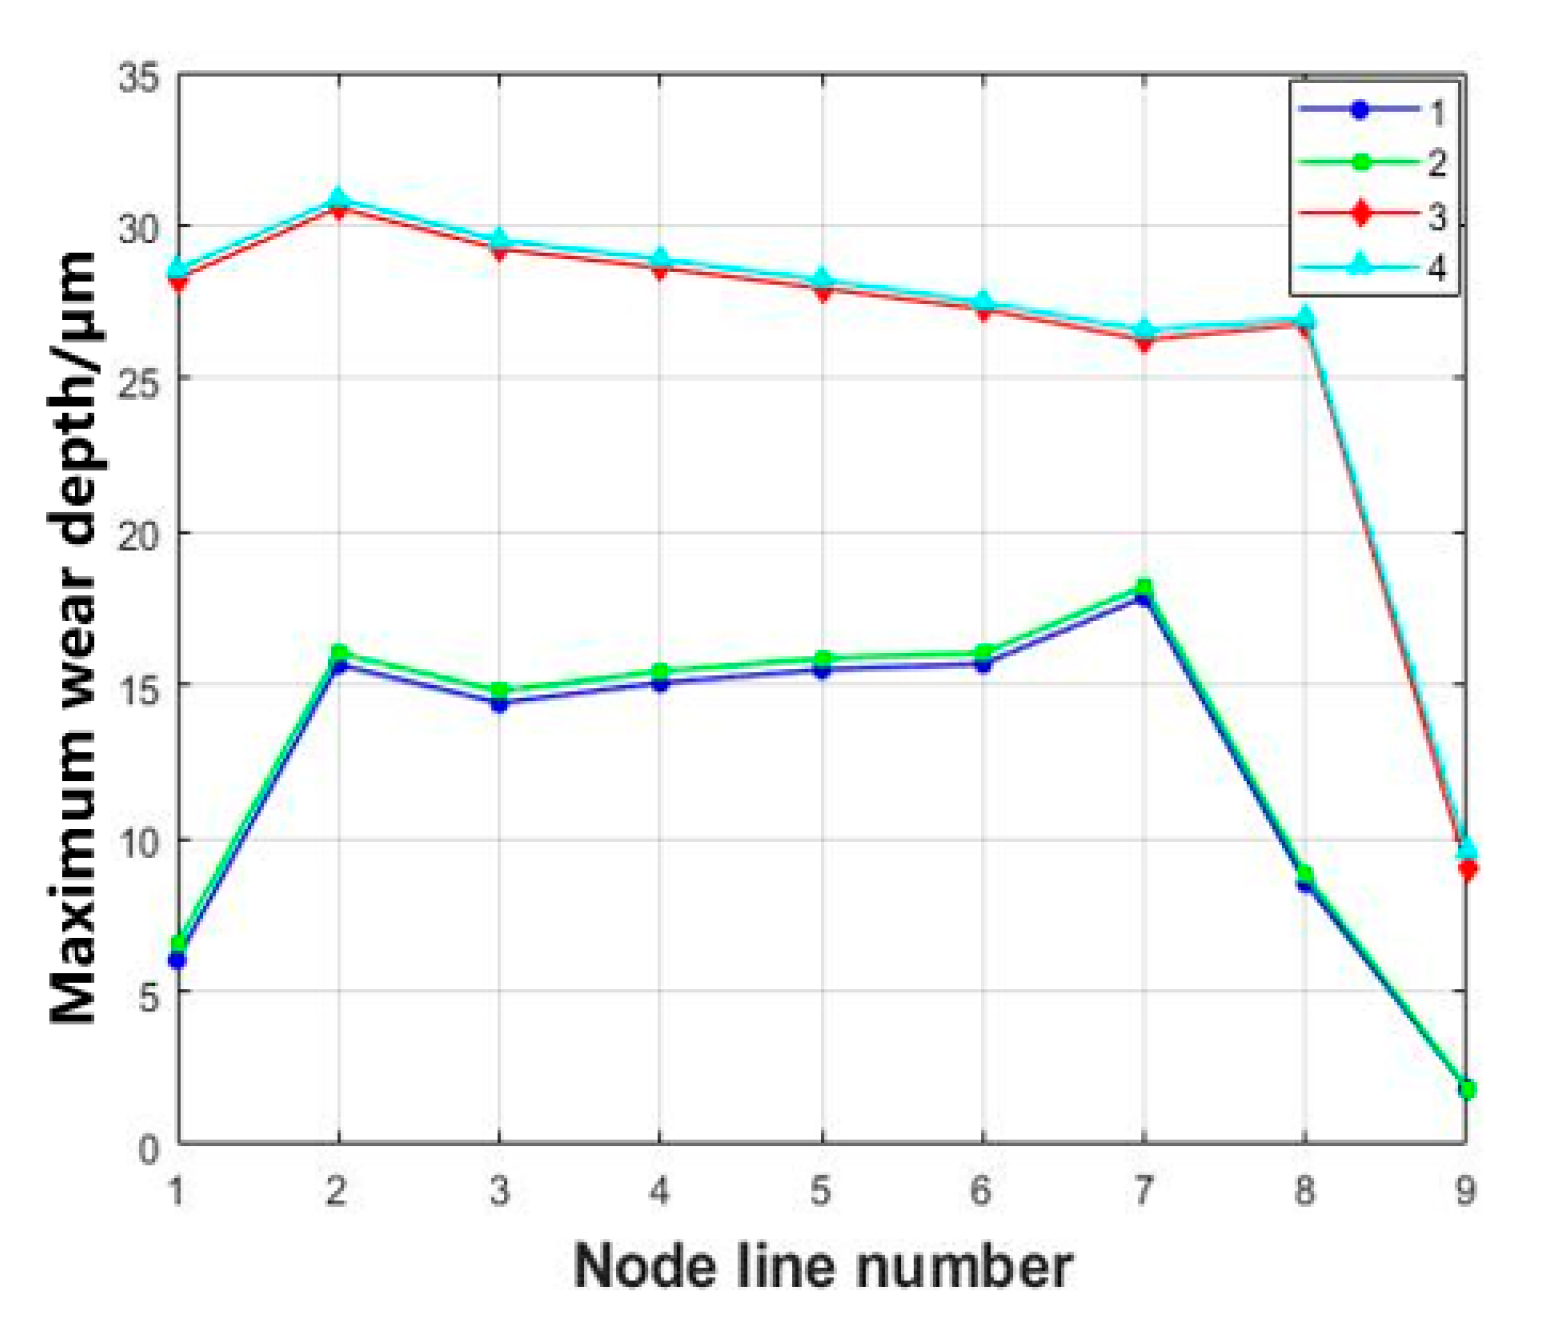
3.1. Effect of Varying Fretting Orientations on Wear Behavior

During the operation of a turbine blade, relative sliding occurs between connecting parts due to vibration and an uneven distribution of aerodynamic loads. This study investigates the impact of different fretting directions on the wear of contact surfaces in tenon connection structures, as shown in Figure 5. For the purpose of clarity, we define X-direction fretting as axial fretting, Y-direction fretting as circumferential fretting, and Z-direction fretting as radial fretting. Additionally, we number the tenon teeth as follows. Teeth 1 and 2 constitute the first pair of tenon teeth while teeth 3 and 4 form the second pair. The path of the nine mesh nodes on the contact surface of tenon teeth are designated a1~a9 from bottom to top.
Due to the symmetrical nature of the tenon connection structure model, a centrifugal force load of 50,000 N is applied to RP1. The Mises stress distribution in the tenon connection structure remains symmetric after loading, as shown in Figure 6. The stress is concentrated at the circular transition position located at the base of the second pair of tenon teeth, with a maximum Mises stress value of 969.8 MPa. Additionally, the Mises stress of the second pair of tenon teeth surfaces exhibits a decreasing trend from the lower side to the upper side before increasing again.
The process of axial fretting encompassed the initial fretting point (X = 0 µm) and the maximum fretting point (X = 20 µm). The Mises stress distribution at both points during the first and last fretting cycles was examined, as shown in Figure 7 and Figure 8. The occurrence of fretting results in a reduction in the contact surface area between the tenon teeth, thereby increasing the stress values. As the number of fretting cycles increases, the stress values of the entire tenon connection structure initially decrease and then increase. Furthermore, there is a transfer of the stress concentration area from the transition edge on the lower side of the second pair of tenon teeth to the upper side of the first pair of teeth (around node path a8 of the first pair of tenon teeth).
When subjected to axial fretting, the wear distribution of the same pair of tenon teeth exhibits consistency. Therefore, we extracted the wear depth of nine node paths on the contact surface of No. 1 and No. 3 tenon teeth with axial distance, as shown in Figure 9. Our analysis reveals that the node path a2 of the first pair of tenon teeth exhibits the maximum wear depth, measuring at 57.22 μm. By processing the result file, the wear volume of the simulated tenon connection structure is 24.89 mm3.
Extract the maximum wear depth of each pair tooth nine node path as shown in Figure 10. The results indicate that the second pair of tenon tooth node path, a2, exhibits the highest wear depth at 56.81 μm. As for the first pair of teeth, the maximum wear depth gradually increases from a1 to a7 before decreasing from a7 to a9, with the peak value occurring on the tenon tooth node path a7 at 47.89 μm. The wear depth of the second pair of tenon teeth gradually increases from a1 to a2, followed by a gradual decrease from a3 to a9, exhibiting similar wear depths on the tooth surface. Axial micro-movement results in maximum wear depth occurring on the lower side of the tenon tooth surface for the second pair of teeth, while for the first pair of teeth, wear depth progressively increases from the lower side upwards on the tenon tooth surface, consistent with observed locations of stress concentration.
A tangential micro-movement wear simulation of 20 μm was conducted by applying a Y-axis displacement constraint on RP2. During the occurrence of tangential micro-movement, one side of the tenon tooth disengages from the tenon groove, resulting in a phenomenon resembling rub-impact. Moreover, the stress level rapidly escalates due to the reduced contact area. This leads to varying wear performance on the tooth surfaces of all four teeth, albeit with minor numerical deviations. We extracted the wear depth of nine node paths on the contact surface of four tenon teeth with axial distance, as shown in Figure 11. The wear volume of the simulated tenon connection structure is 7.55 mm3.
Extract the maximum wear depth of each tenon tooth surface nine node path, as shown in Figure 12. The maximum wear depth is found to occur at tooth 4 node path a2 of the second pair of teeth, with a maximum wear depth of 30.85 μm. As for the first pair of teeth, the wear depth gradually increases from a1 to a2 and from a3 to a7, and then gradually decreases from a7 to a9, with the maximum wear depth occurring at tooth line a7, at 18.23 μm. The wear depth of the second pair of tenon teeth gradually increases from a1 to a2, and then decreases from a3 to a9. After undergoing tangential fretting, the maximum depth of wear is observed on the lower side of this tenon tooth pair.
By applying a Z-axis displacement constraint on RP2, we conducted a radial fretting wear simulation of 20 μm. The resulting wear on the tenon tooth surfaces of the same pair is consistent and we extracted the wear conditions of tooth surfaces 1 and 3 as shown in Figure 13. The wear volume of the simulated tenon connection structure is 8.43 mm3.
Extract the maximum wear depth of each pair tooth nine node path as shown in Figure 14. It is found that the maximum wear depth occurs at the tenon tooth node path a2 of the second pair of tenon teeth, with a maximum wear depth of 24.36 μm. For the first pair of teeth, the wear depth gradually increases from a1 to a2, a3 to a7, and gradually decreases from a7 to a9, with a maximum of 18.18 μm on the node path a7. For the second pair of tenon teeth, the tooth surface wear is uniform and the node path from a1 to a9 generally has a slow decreasing trend.

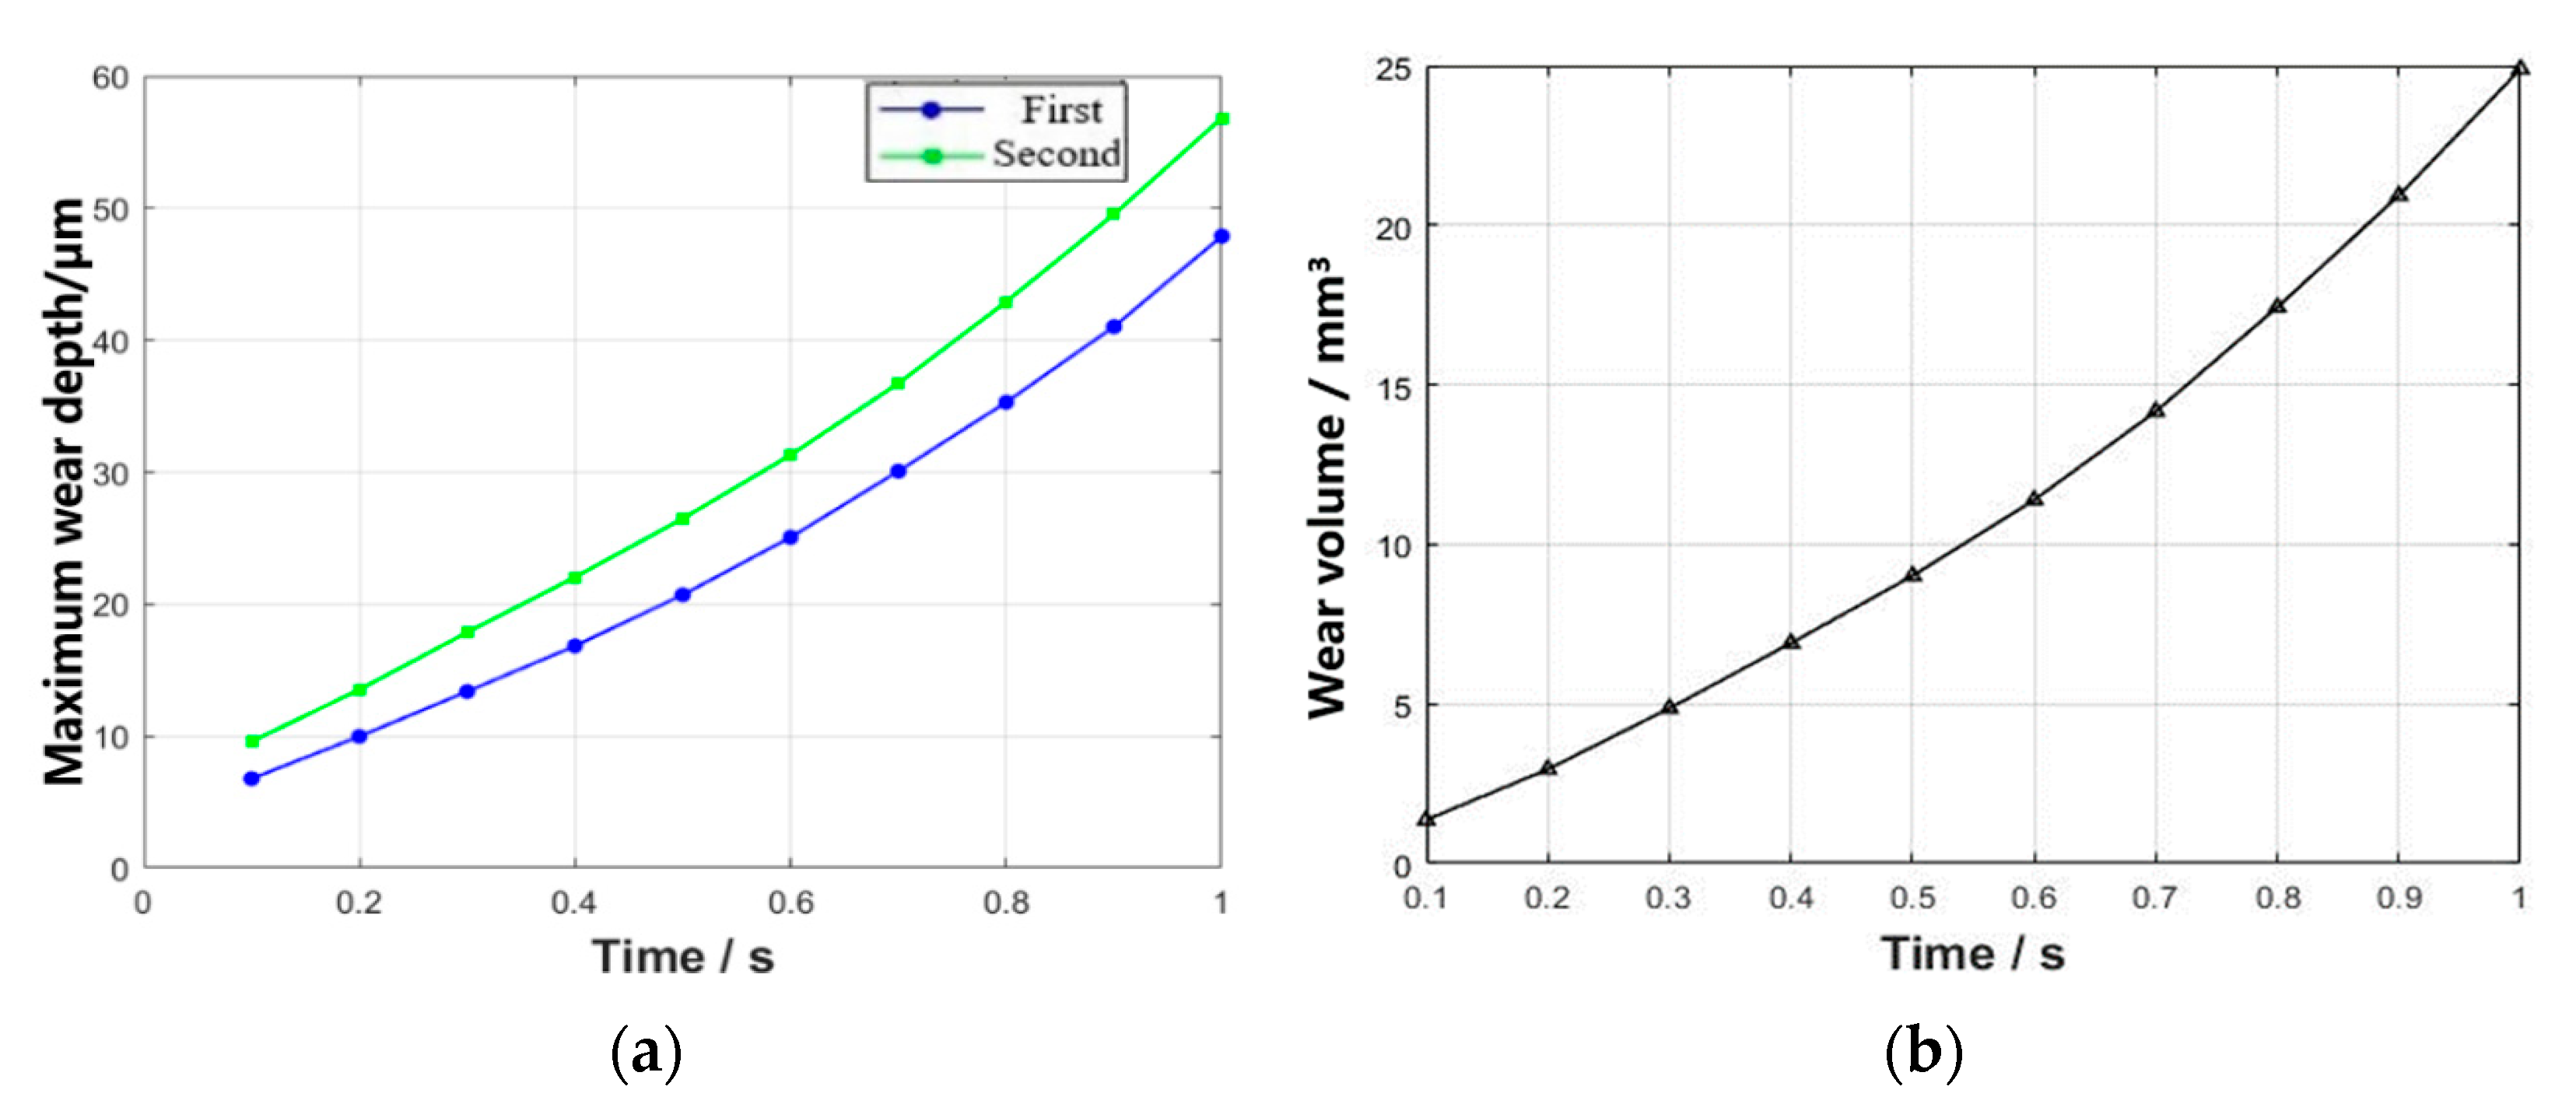
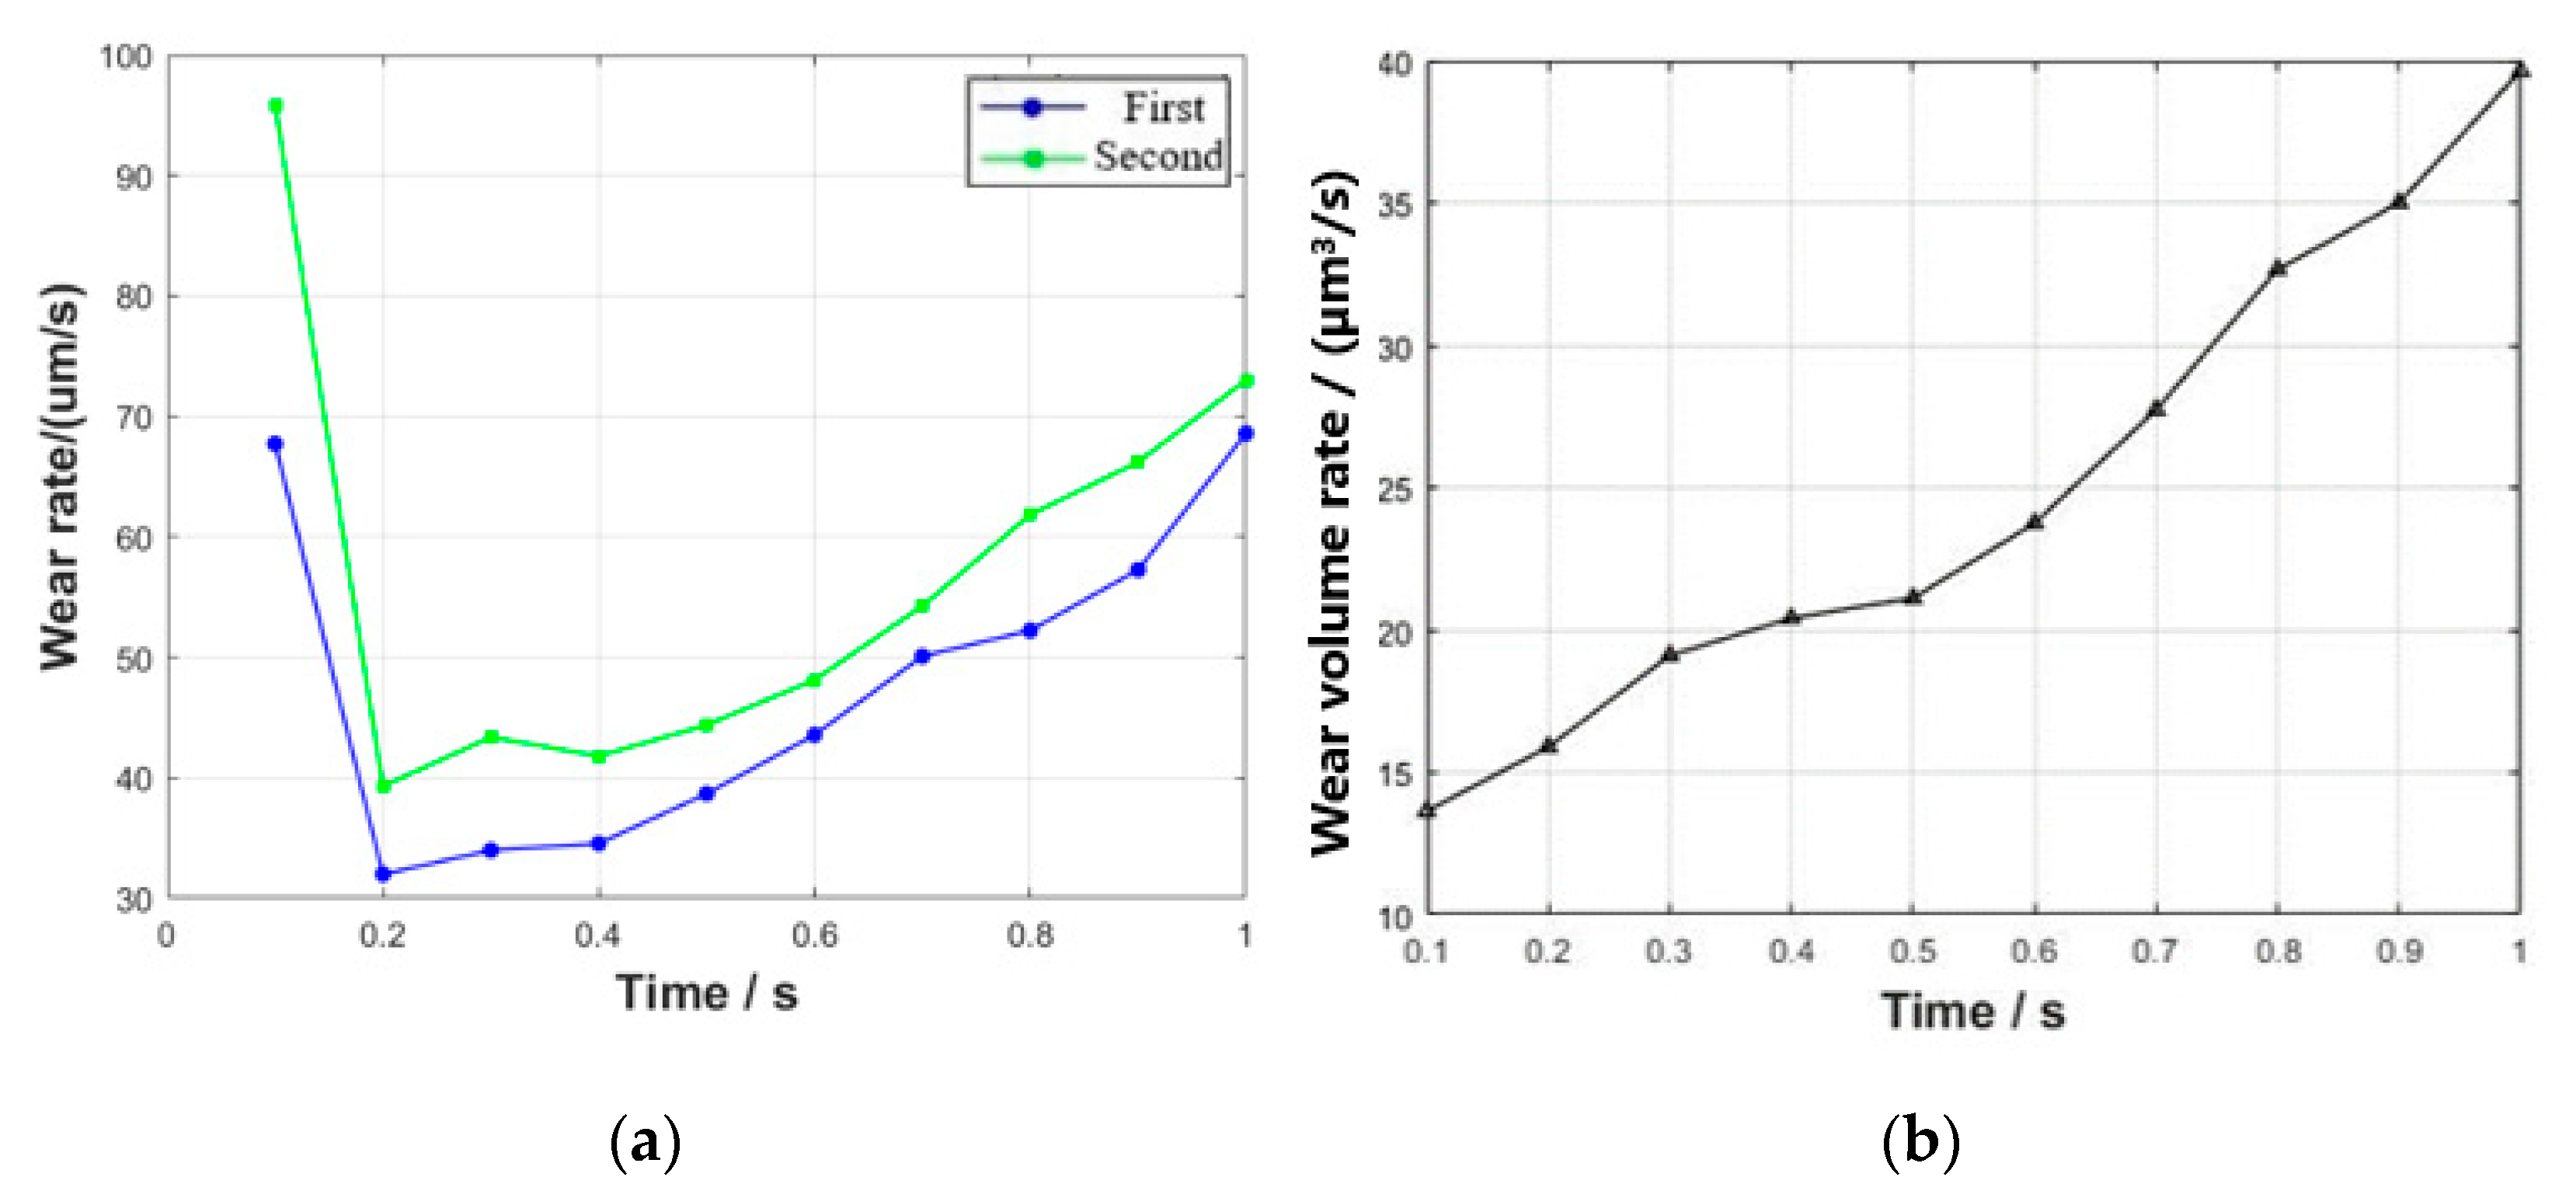
3.2. Effect of Varying Fretting Time on Wear Behavior

A wear simulation study was conducted on the tenon connection structure with a 20 μm axial fretting under a 50,000 N load for varying durations to investigate the impact of wear on the tenon teeth over time. Following completion of the simulation cycles, the maximum Mises stress (S) and contact pressure (CPRESS) on the tooth surface were extracted, as shown in Figure 15. With the passage of time, the tenon tooth surface undergoes continuous wear, resulting in a general decrease and subsequent increase in both the maximum Mises stress and CPRESS. This phenomenon can be attributed to the fact that during the initial stage of simulation as the contact surface wears down, previously uncontacted areas of both tenon and tenon groove come into contact with each other, leading to an increase in overall contact area, which subsequently reduces stress and pressure. However, as wear continues over time and unevenness develops on the tenon tooth surface, stress levels begin to rise again. The geometry of the contact surface of the tenon connection structure is constantly changing with the wear simulation, resulting in the maximum stress value constantly changing and its position not being fixed. When the simulation time is 0~0.8 s, the maximum Mises is at the bottom of the tenon, and when the simulation time is 0.9–1.0 s, the maximum Mises is on the upper side of the contact surface of the first pair of tenon teeth. When the simulation time is 0–0.3 s, the maximum contact stress is on the lower side of the contact surface of the second pair of tenon teeth, and when the simulation time is 0.4–1.0 s, the maximum contact stress is on the contact surface of the first pair of tenon teeth, and the position shifts from the lower side of the contact surface of the first group of tenon teeth to the upper side with the increase in time. Additionally, the axial (CSLIP1) and radial slip (CSLIP2) gradually increase alongside the wear.
The maximum wear depth and wear volume of the first and second pairs of tenon teeth were extracted over time, as shown in Figure 16. With the increase in wear simulation time, there is a gradual increase in both maximum wear depth and wear volume.
In order to conveniently assess the impact of fretting on wear, we quantified the rate of change in both the maximum wear depth and wear volume of the tenon tooth, as shown in Figure 17. It illustrates that during the initial stage of simulation, there is a relatively high rate of change in the maximum wear depth. After that, the rate of change in the maximum wear depth gradually increases with time. This phenomenon can be attributed to the small contact area and stress concentration in the early stages of simulation for the tenon connection structure. Consequently, certain areas experience contact first, leading to rapid changes in wear depth at the node, resembling a running-in period. Overall, the rate of wear volume change is gradually increasing with a growing trend. This can be attributed to the continuous progression of wear, which leads to an increase in contact area and more nodes participating in the process.

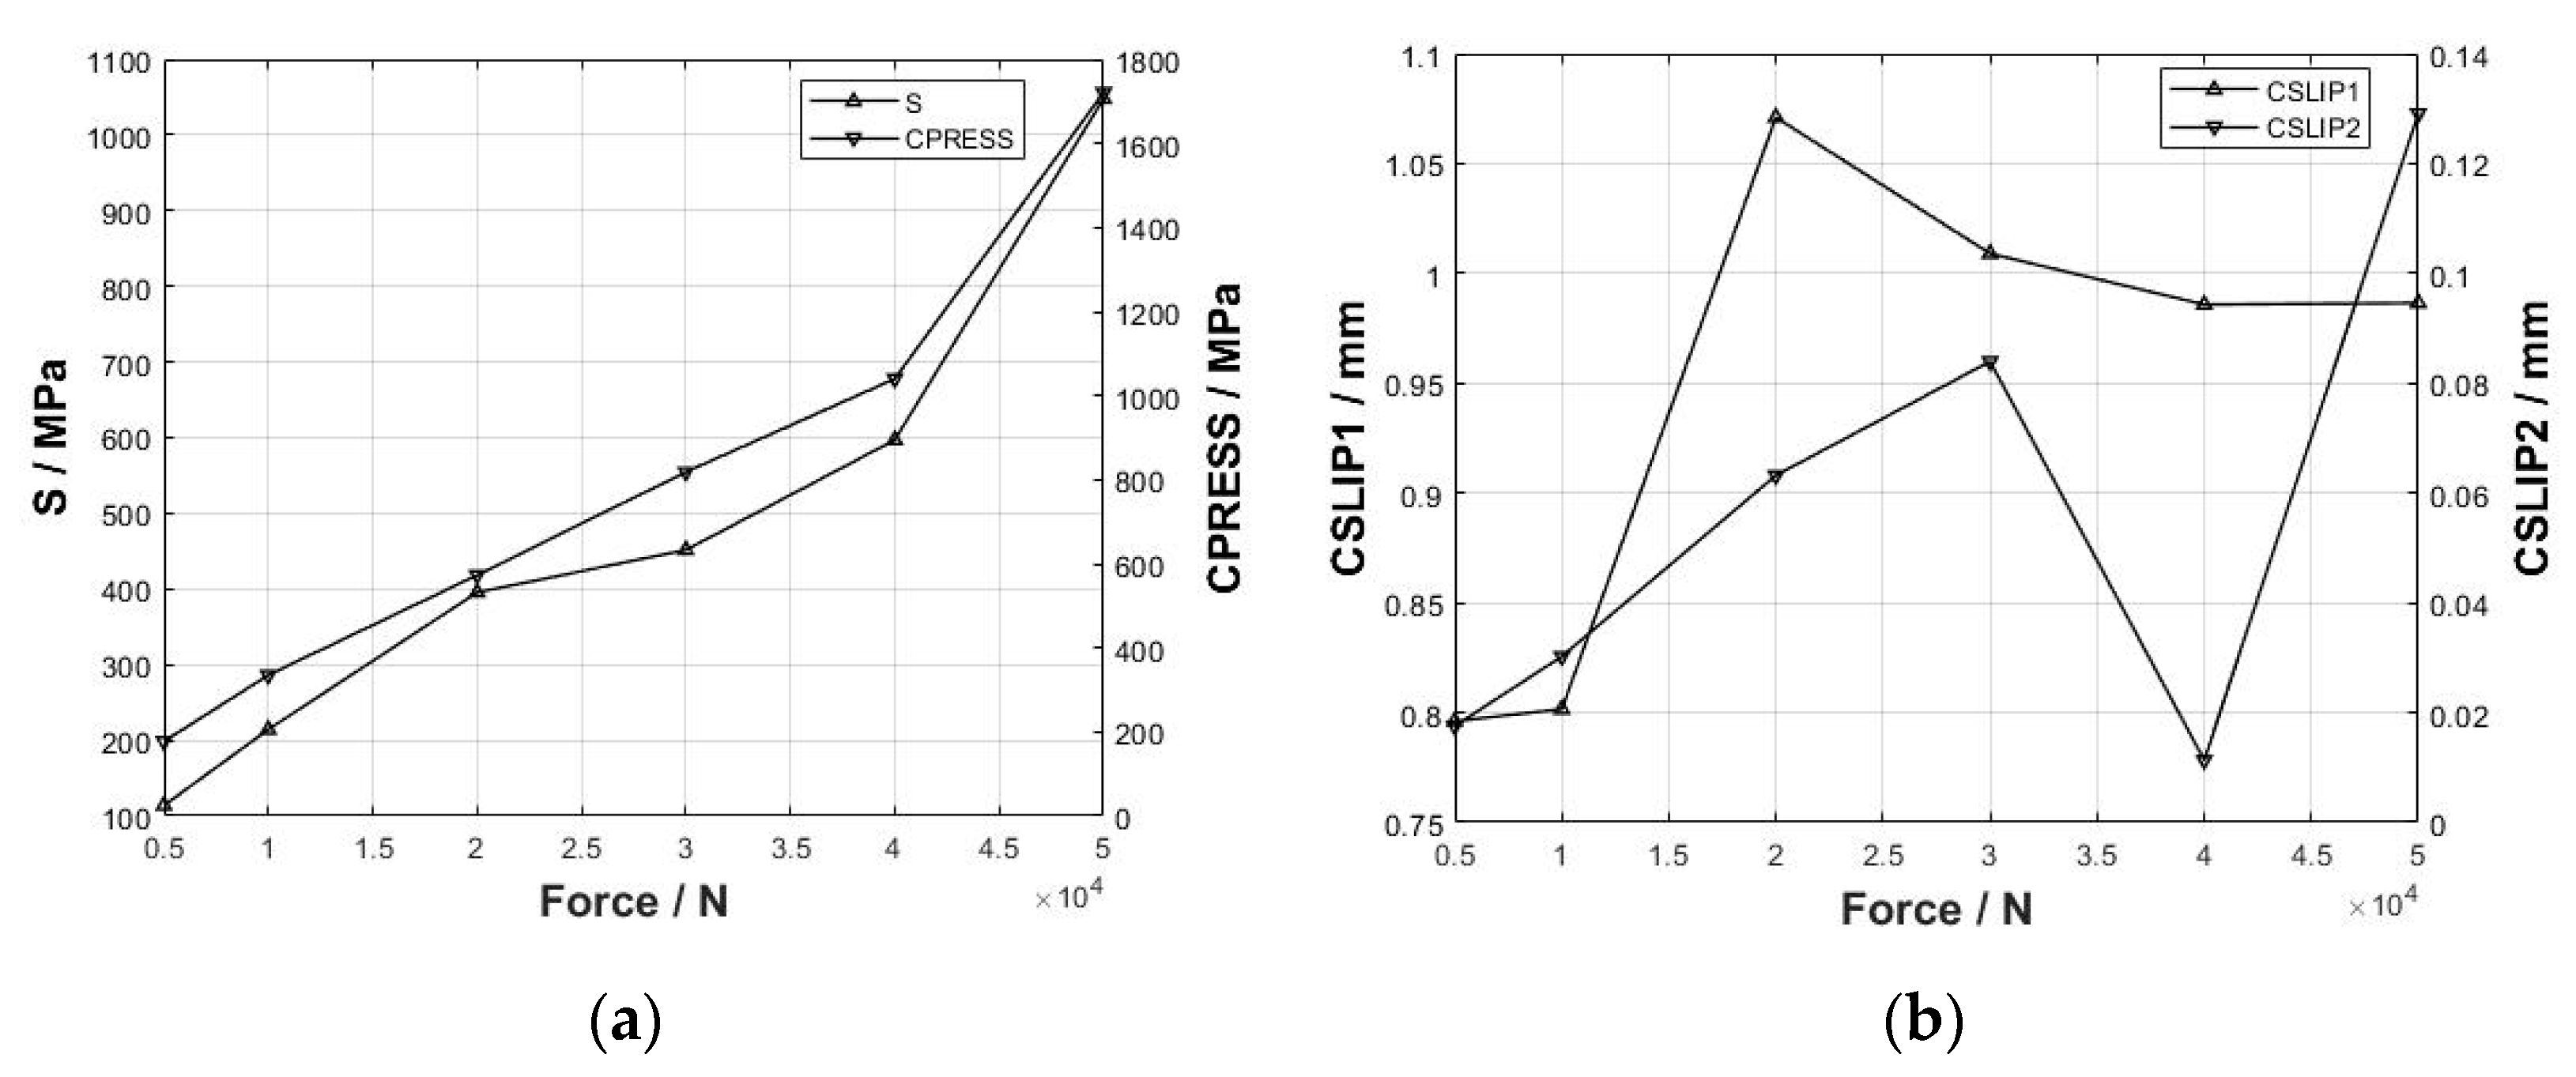
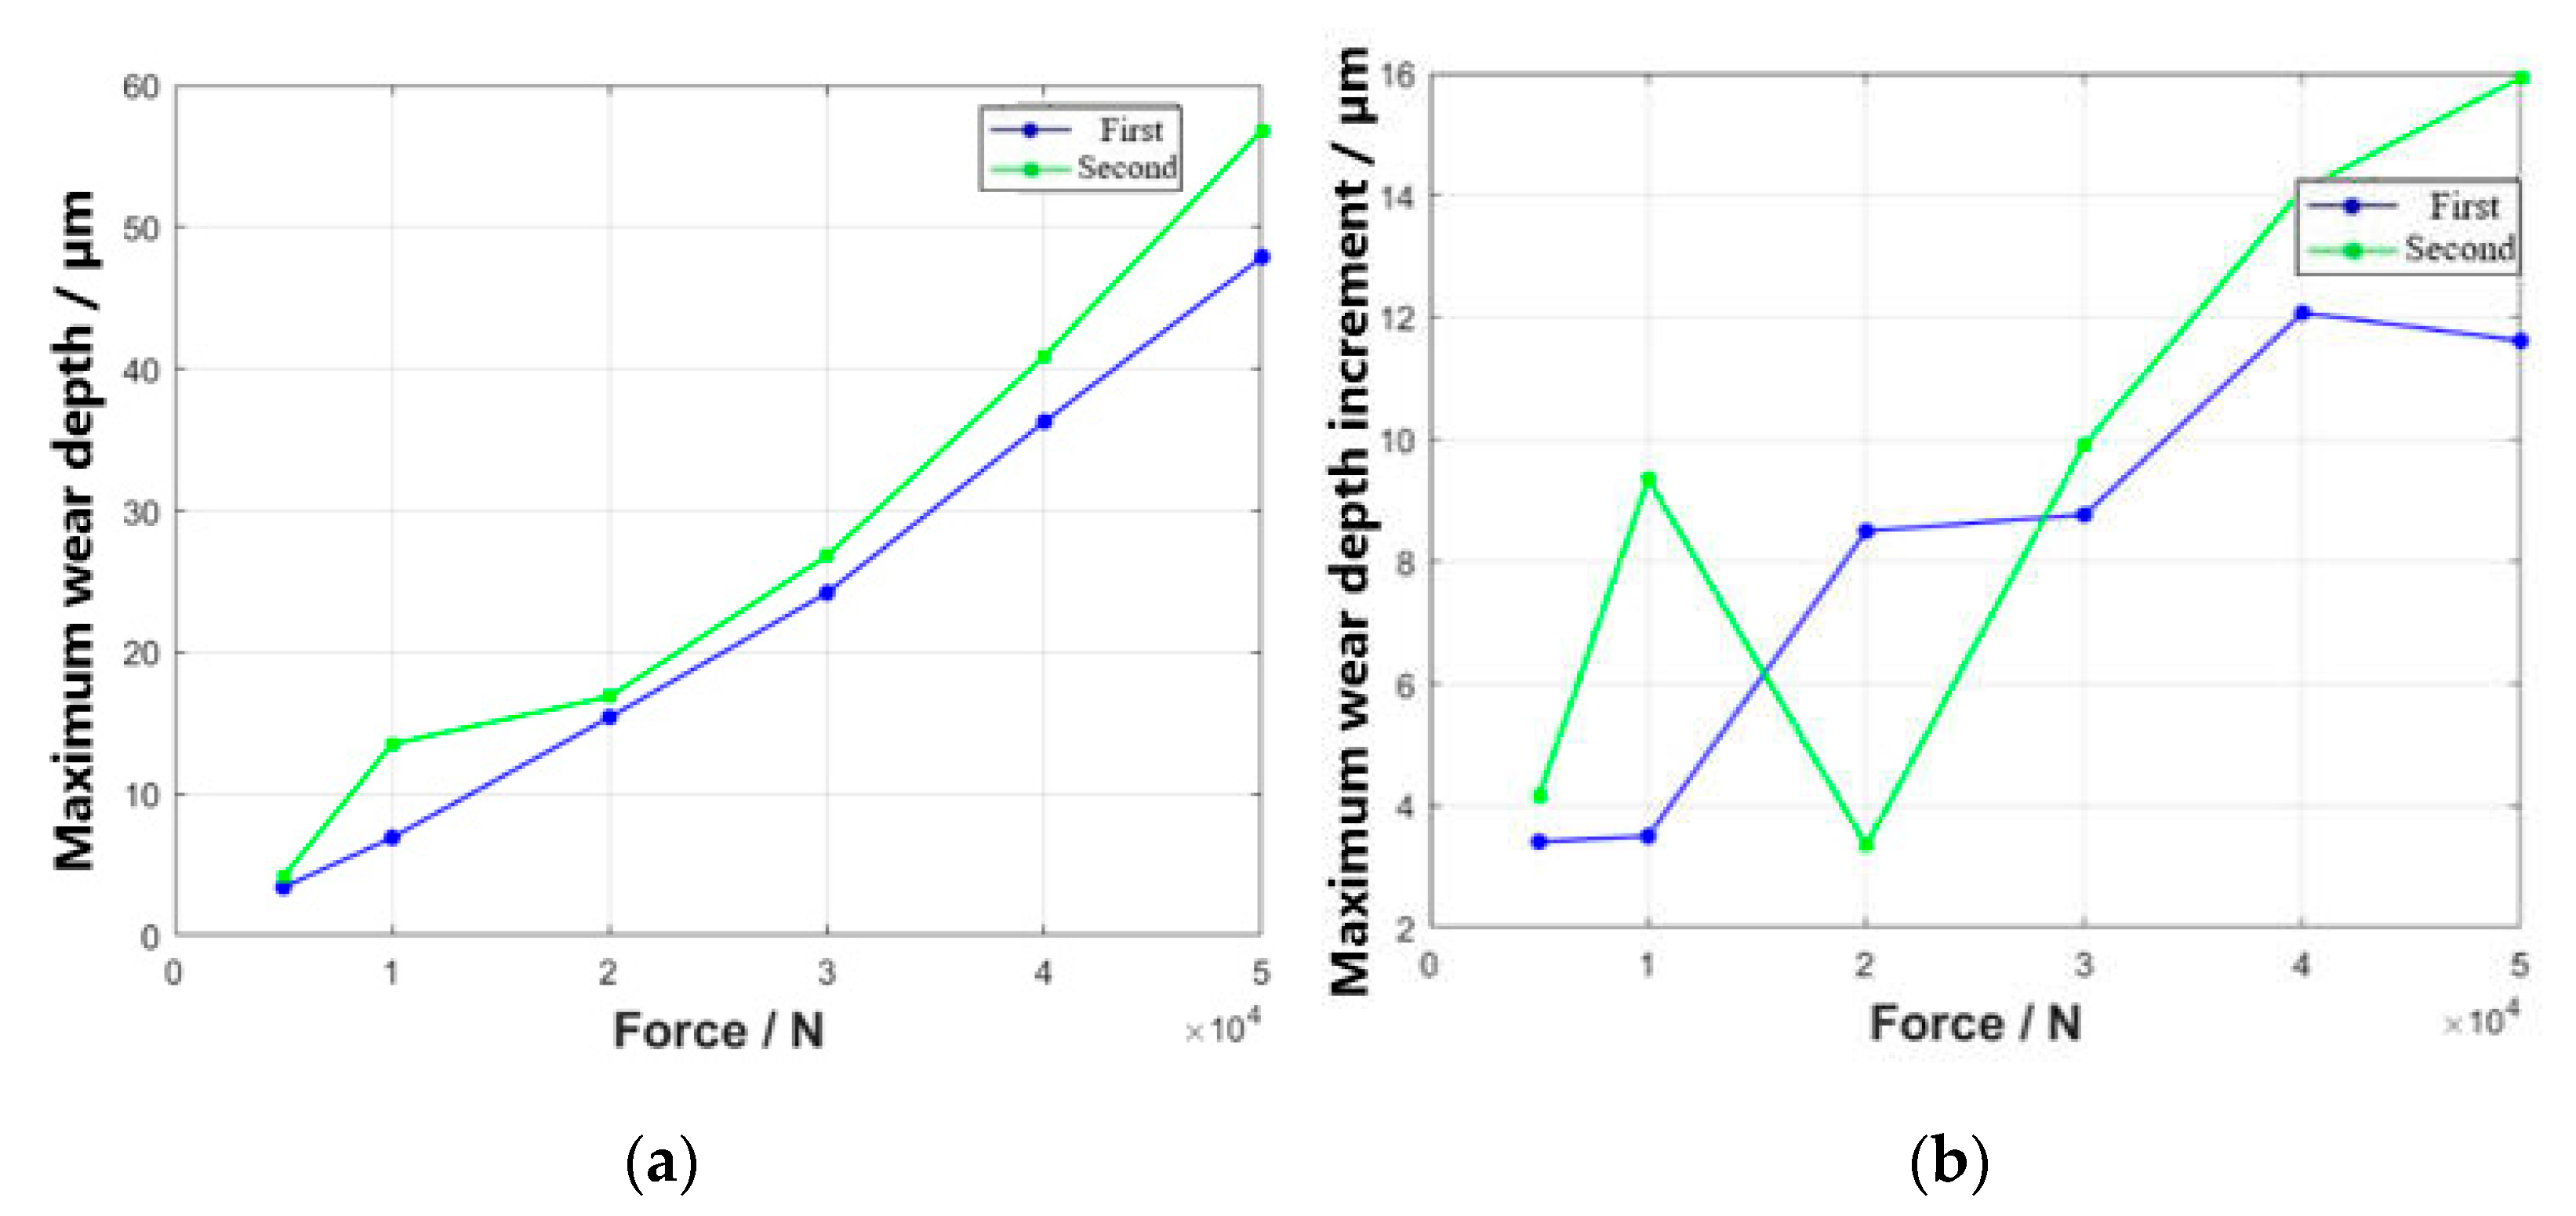
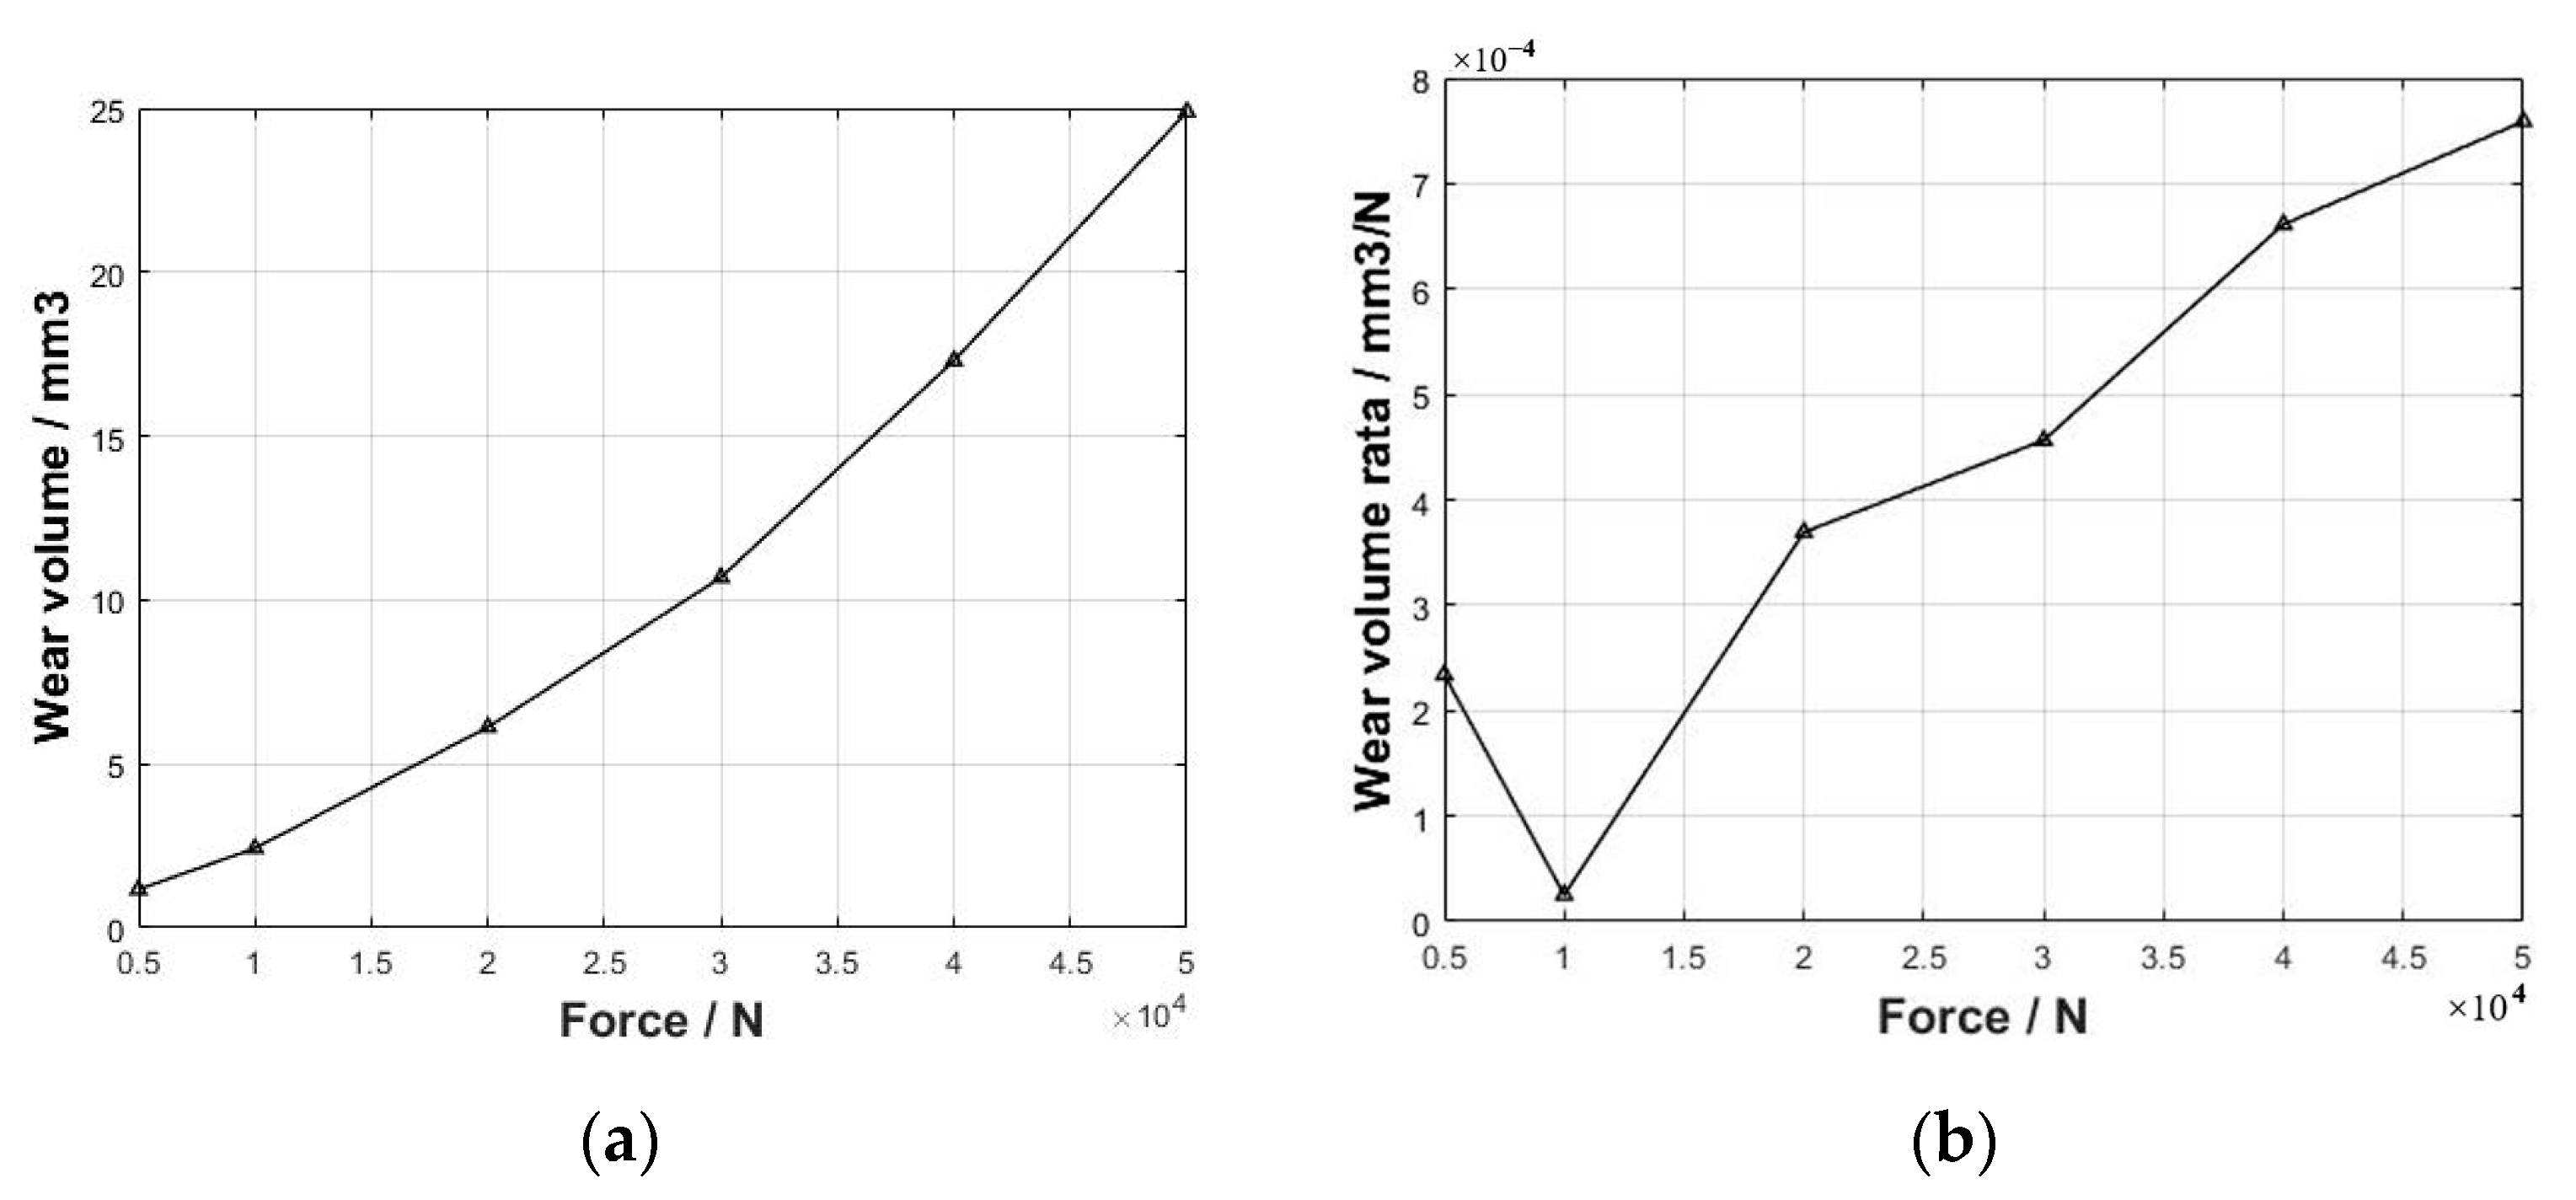
3.3. Effect of Different Loads on Wear Behavior

A wear simulation was conducted on tenon connection structures under varying loads to investigate the wear behavior of the contact surface between the tenon and mortise teeth. Centrifugal loads ranging from 5000 N to 50,000 N were applied to RP1 along with an axial fretting amplitude of 20 μm applied to RP2. Upon the completion of the fretting wear simulation, curves illustrating the maximum Mises stress, contact pressure, and slip in relation to load were extracted, as shown in Figure 18. When the simulation time is 1 s, the load increases gradually within the study range. The maximum Mises stress appears on the first pair of tenon teeth when the load is 5000 N and 50,000 N, and the maximum Mises stress appears on the root of the tenon when the load is 10,000–40,000 N. When the load is 5000–20,000 N, the maximum contact stress appears in the first pair of tenon tooth contact faces. And when the load is 30,000–50,000 N, the maximum contact stress transfers from the lower side of the first pair of tenon teeth to the upper side.
The maximum wear depth of two pairs of tenon teeth with varying loads was extracted and the change curve depicting the maximum wear depth increment compare with the last load is shown in Figure 19. The maximum wear depth of the first and second pairs of tenon teeth gradually increases as the load increases, and the rate of increment in wear depth also generally intensifies. The wear volume of the tenon teeth was statistically analyzed, and the curve of the wear volume and wear volume rate with load are shown in Figure 20.

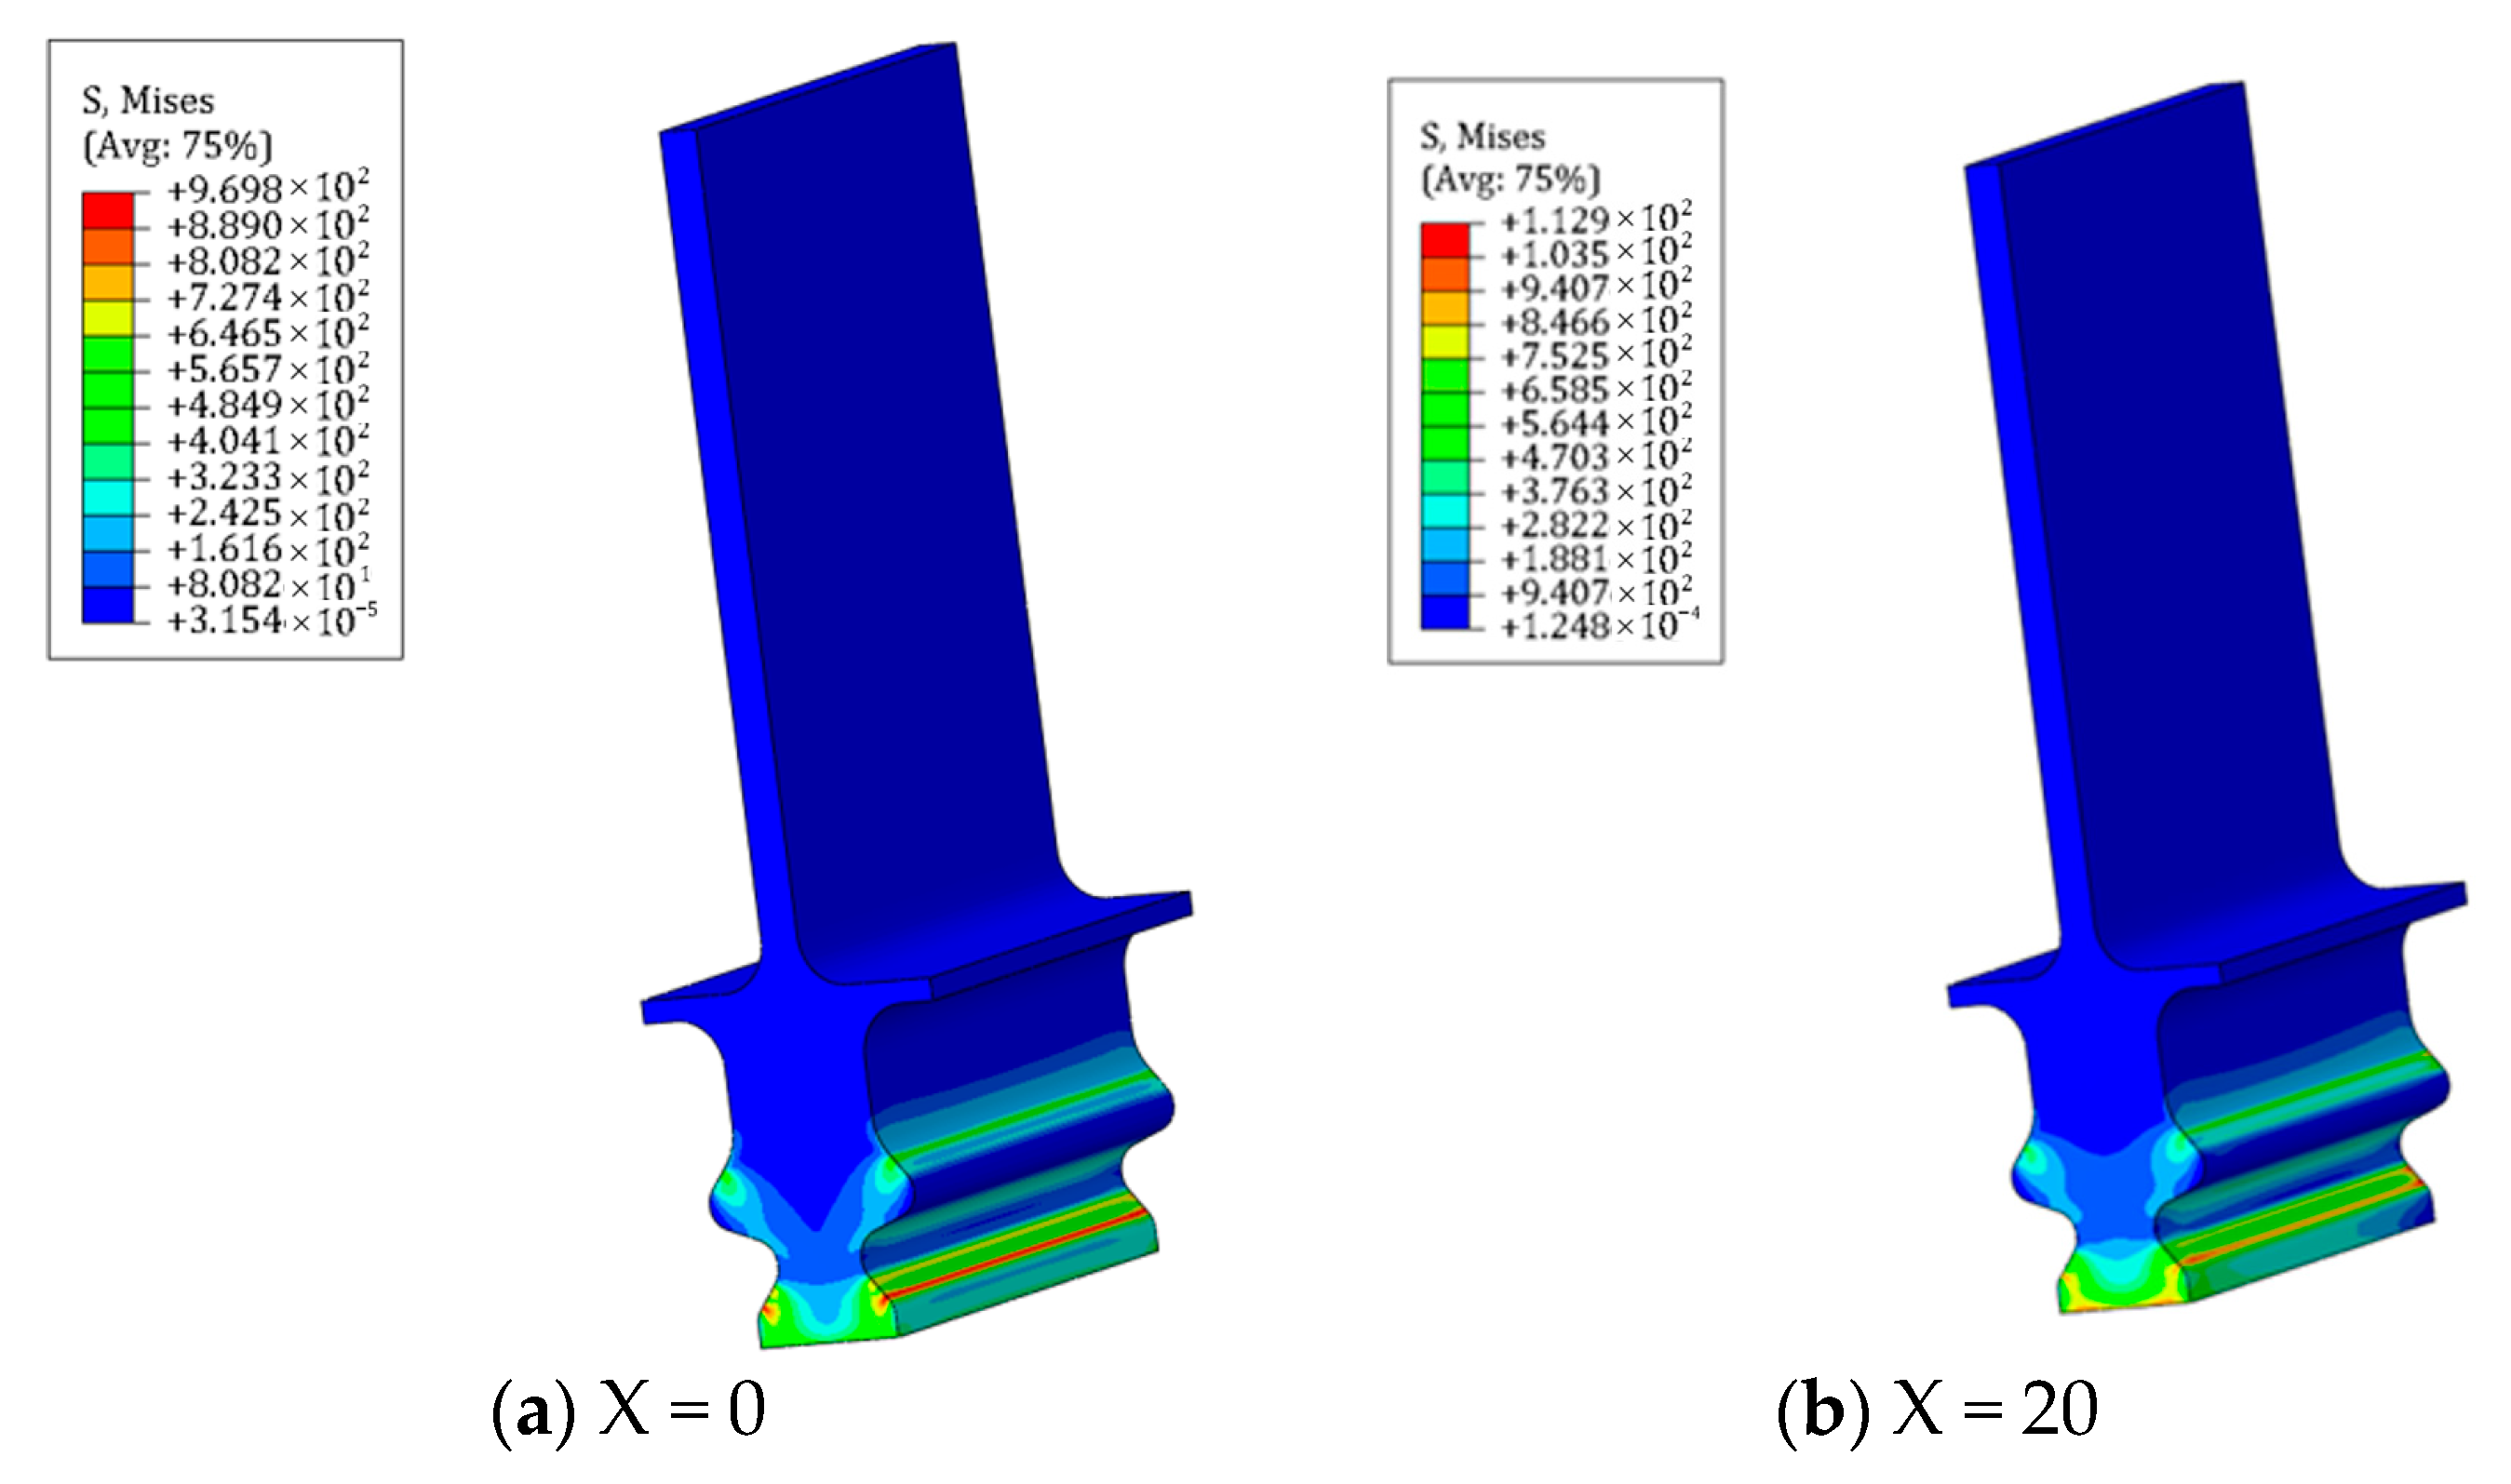
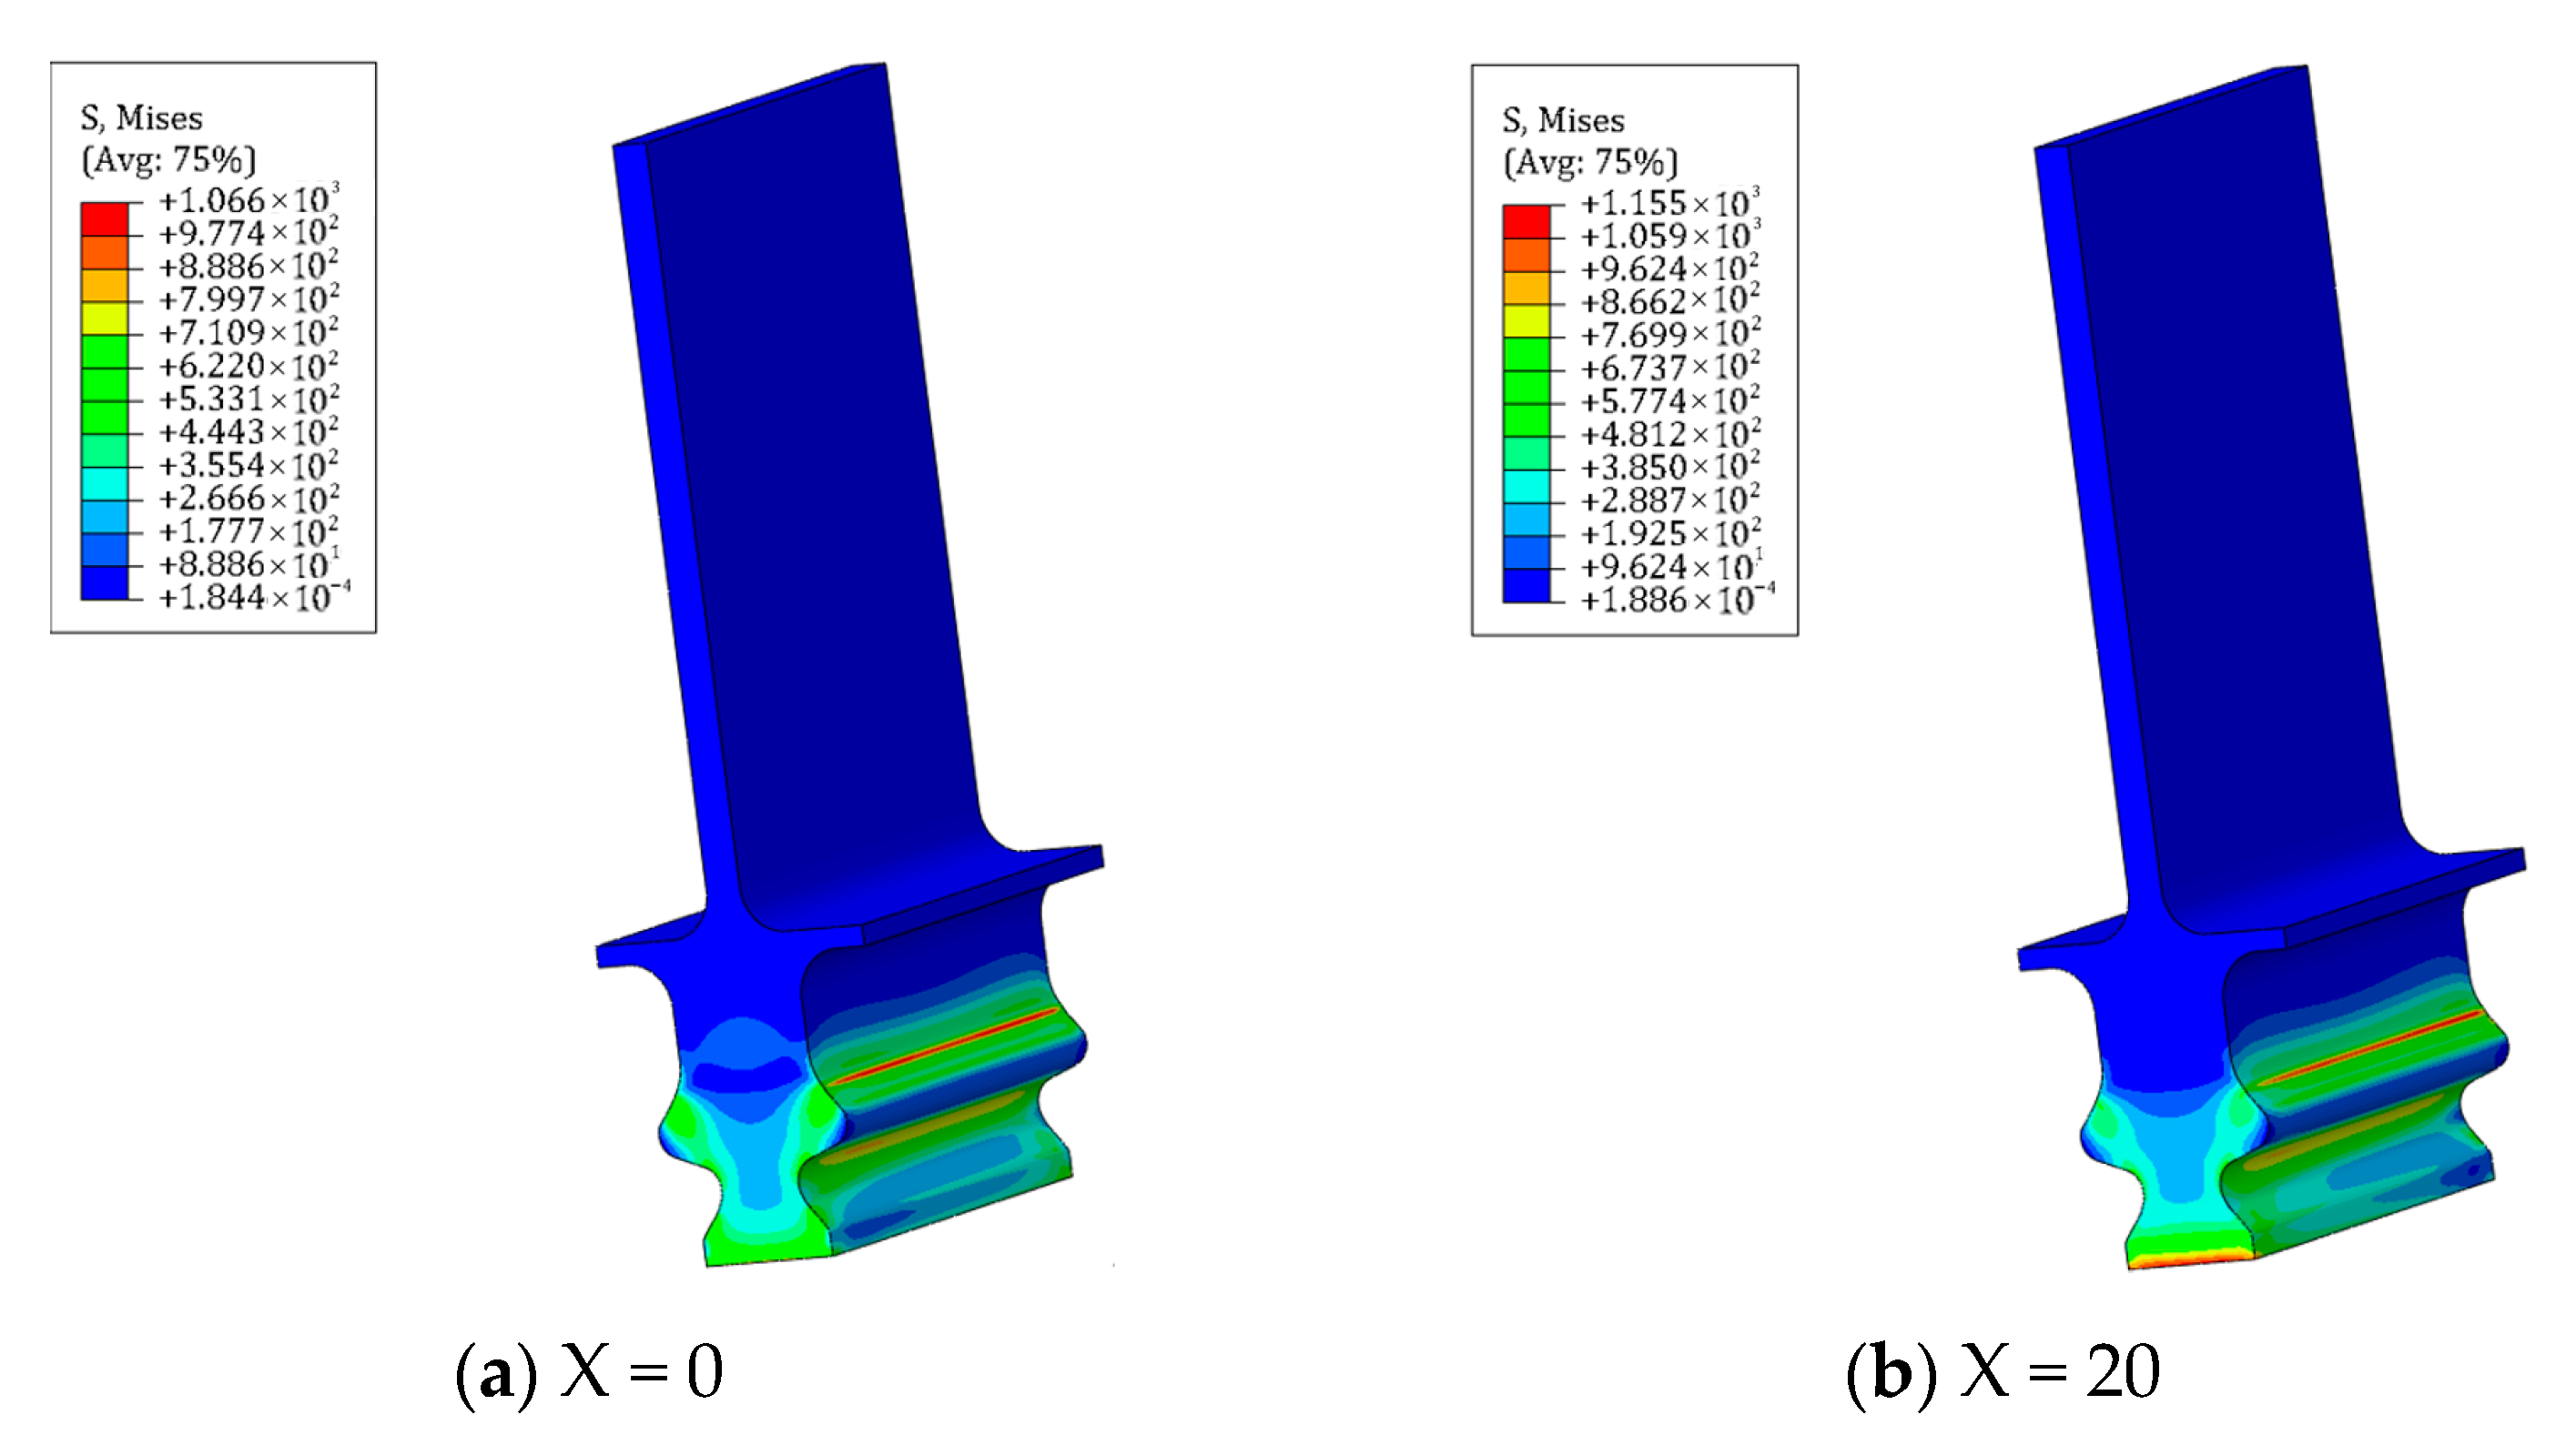
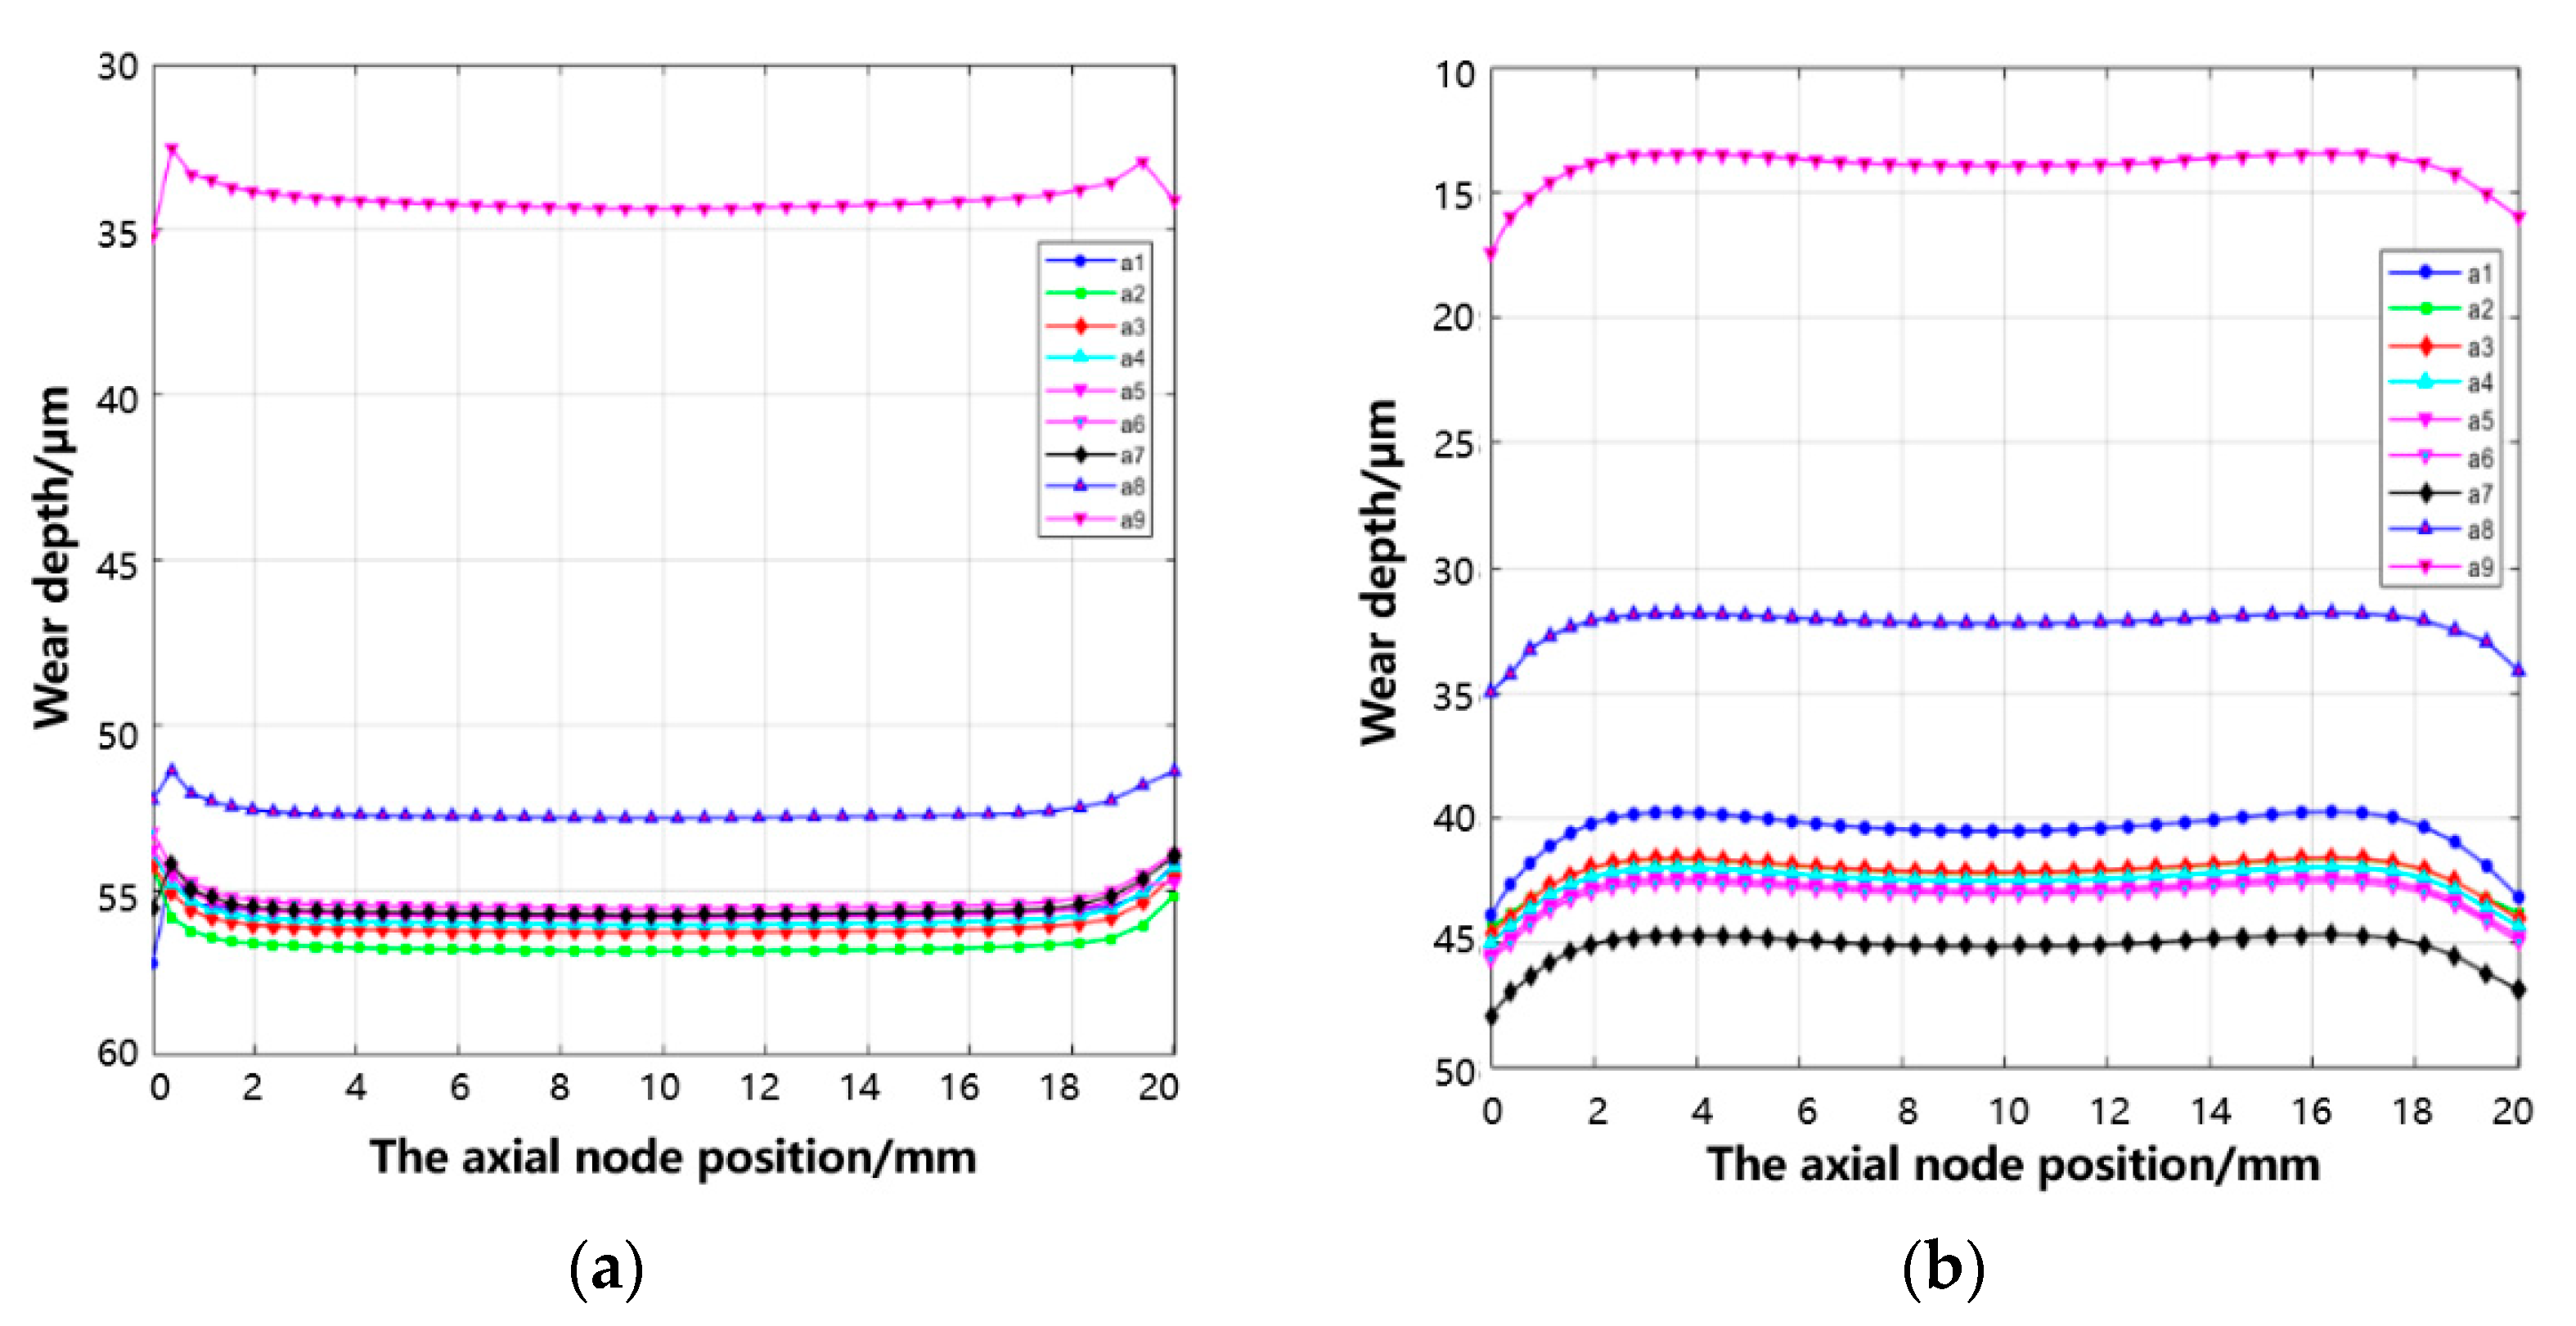
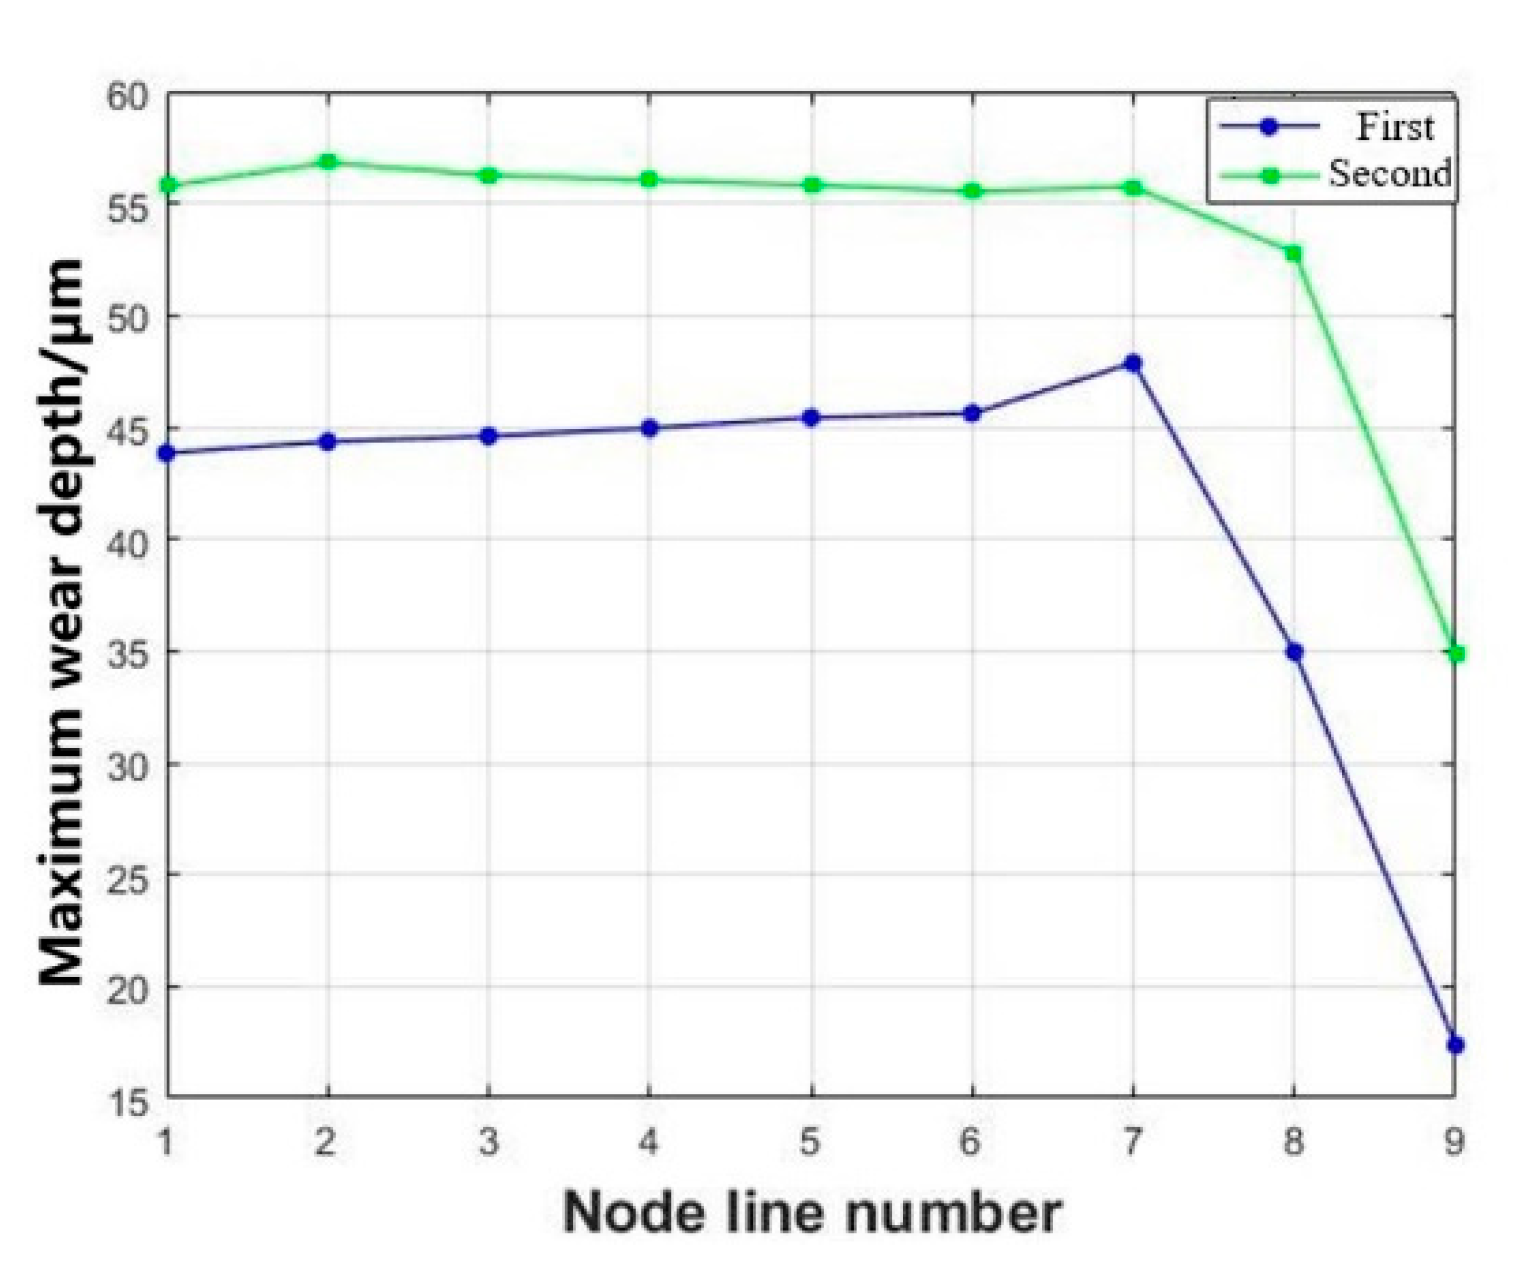
3.4. Fretting Wear under Combined Normal and Aerodynamic Loading

The loads acting on the high-pressure compressor blades of turbine engines are highly intricate. In addition to the centrifugal force induced by high-speed rotation, the blades experience aerodynamic loads resulting from the rapid flow of compressed air and thermal loads arising from temperature gradients caused by transitions between different operational conditions. The boundary conditions of the previous model are slightly adjusted and the actual aerodynamic load on the tenon joint structure is simplified. The constant component of the aerodynamic load is simplified to a uniform pressure on one side of the blade, specifically by establishing the reference point RP3 at the center of one blade side and coupling it with the blade side surface. A constant load with an amplitude of 2000 N was applied at RP3. The uneven distribution of the fluctuating components of the aerodynamic load is transformed into the fretting boundary conditions. The position of the reference point RP3 and the aerodynamic loads’ boundary conditions are shown in Figure 21.
After the addition of aerodynamic load, the maximum Mises stress was observed at the root of the stressed side of the blade. The Mises stress distribution at both points during the first and last fretting cycles was examined, as shown in Figure 22 and Figure 23, respectively. The maximum Mises stress is 3338 MPa for the initial point of the first fretting cycle, and it remains almost unchanged at 3343 MPa after fretting. In the last fretting cycle, the maximum Mises stress does not exhibit significant variation. The stress concentration resulting from blade deflection primarily occurs at the root, exhibiting minimal correlation with wear. The Mises and CPRESS stress distributions exhibit disparities across the four tooth surfaces. With an increasing number of fretting cycles, the maximum CPRESS value initially decreases before subsequently rising again, transitioning from the surface of tenon tooth 3 to the surface of tenon tooth 1, ultimately concentrating on the upper side of the tenon tooth 2.
Extract the wear depth of each tenon tooth nine node path along with axial node position, as shown in Figure 24. For tenon tooth 1, the wear depth gradually decreases from a1 to a9, with no wear observed at a9. The maximum wear depth is found at tooth line a1, measuring 78.97 μm. As for tooth surface 2, the wear depth increases gradually from a1 to a8 and then decreases gradually from a8 to a9. The highest level of wear occurs at tooth line a8, measuring 60.44 μm. The wear depth on tooth surface 3 exhibits a gradual increase from a1 to a7, followed by a gradual decrease from a7 to a9. The maximum wear depth is observed at node path a7, at 75.93 μm. For tooth surface 4, the wear depth shows an increasing trend from a1 to a2 and then decreases gradually from a3 to a9. The highest wear depth occurs at node path a2 with an extent of 70.53 μm. The wear volume of the simulated tenon connection structure is 39.37 mm3.
The maximum wear depth occurs at the lower side of the transition fillet of tooth 1 after considering aerodynamic loads. This is due to the blade being in a skewed state; the tenon teeth are biased towards the aerodynamically loaded side, resulting in higher stress on tooth surfaces 1 and 3. The severity of wear conditions varies among each tooth surface, with surfaces 1 and 3 experiencing more severe wear than surfaces 2 and 4. Figure 25 shows the extracted maximum wear depths for each tenon tooth node path from a1 to a9.
The wear results of tenon teeth under various boundary conditions, as presented in the previous section, are organized and summarized in Table 2.

4. Conclusions

This study applies a modified Archard wear model to investigate the wear patterns of different tooth surfaces in a complex tenon connection structure under various micro-movement directions, loads, time, and added aerodynamic loads through wear simulation. The main conclusions are summarized as follows:
  • The fretting direction exerts significant influence on the wear characteristics of the tenon connection structure. Distinct variations in wear depth and morphology are observed on each tooth surface, depending on different fretting directions. Among these, axial (x-axis) fretting exhibits the most pronounced impact on wear depth, followed by circumferential (y-axis) fretting, while radial (z-axis) fretting demonstrates a comparatively minimal influence.
  • Circumferential fretting results in non-uniform wear depth on the same pair of teeth, leading to phenomena akin to rubbing and impact.
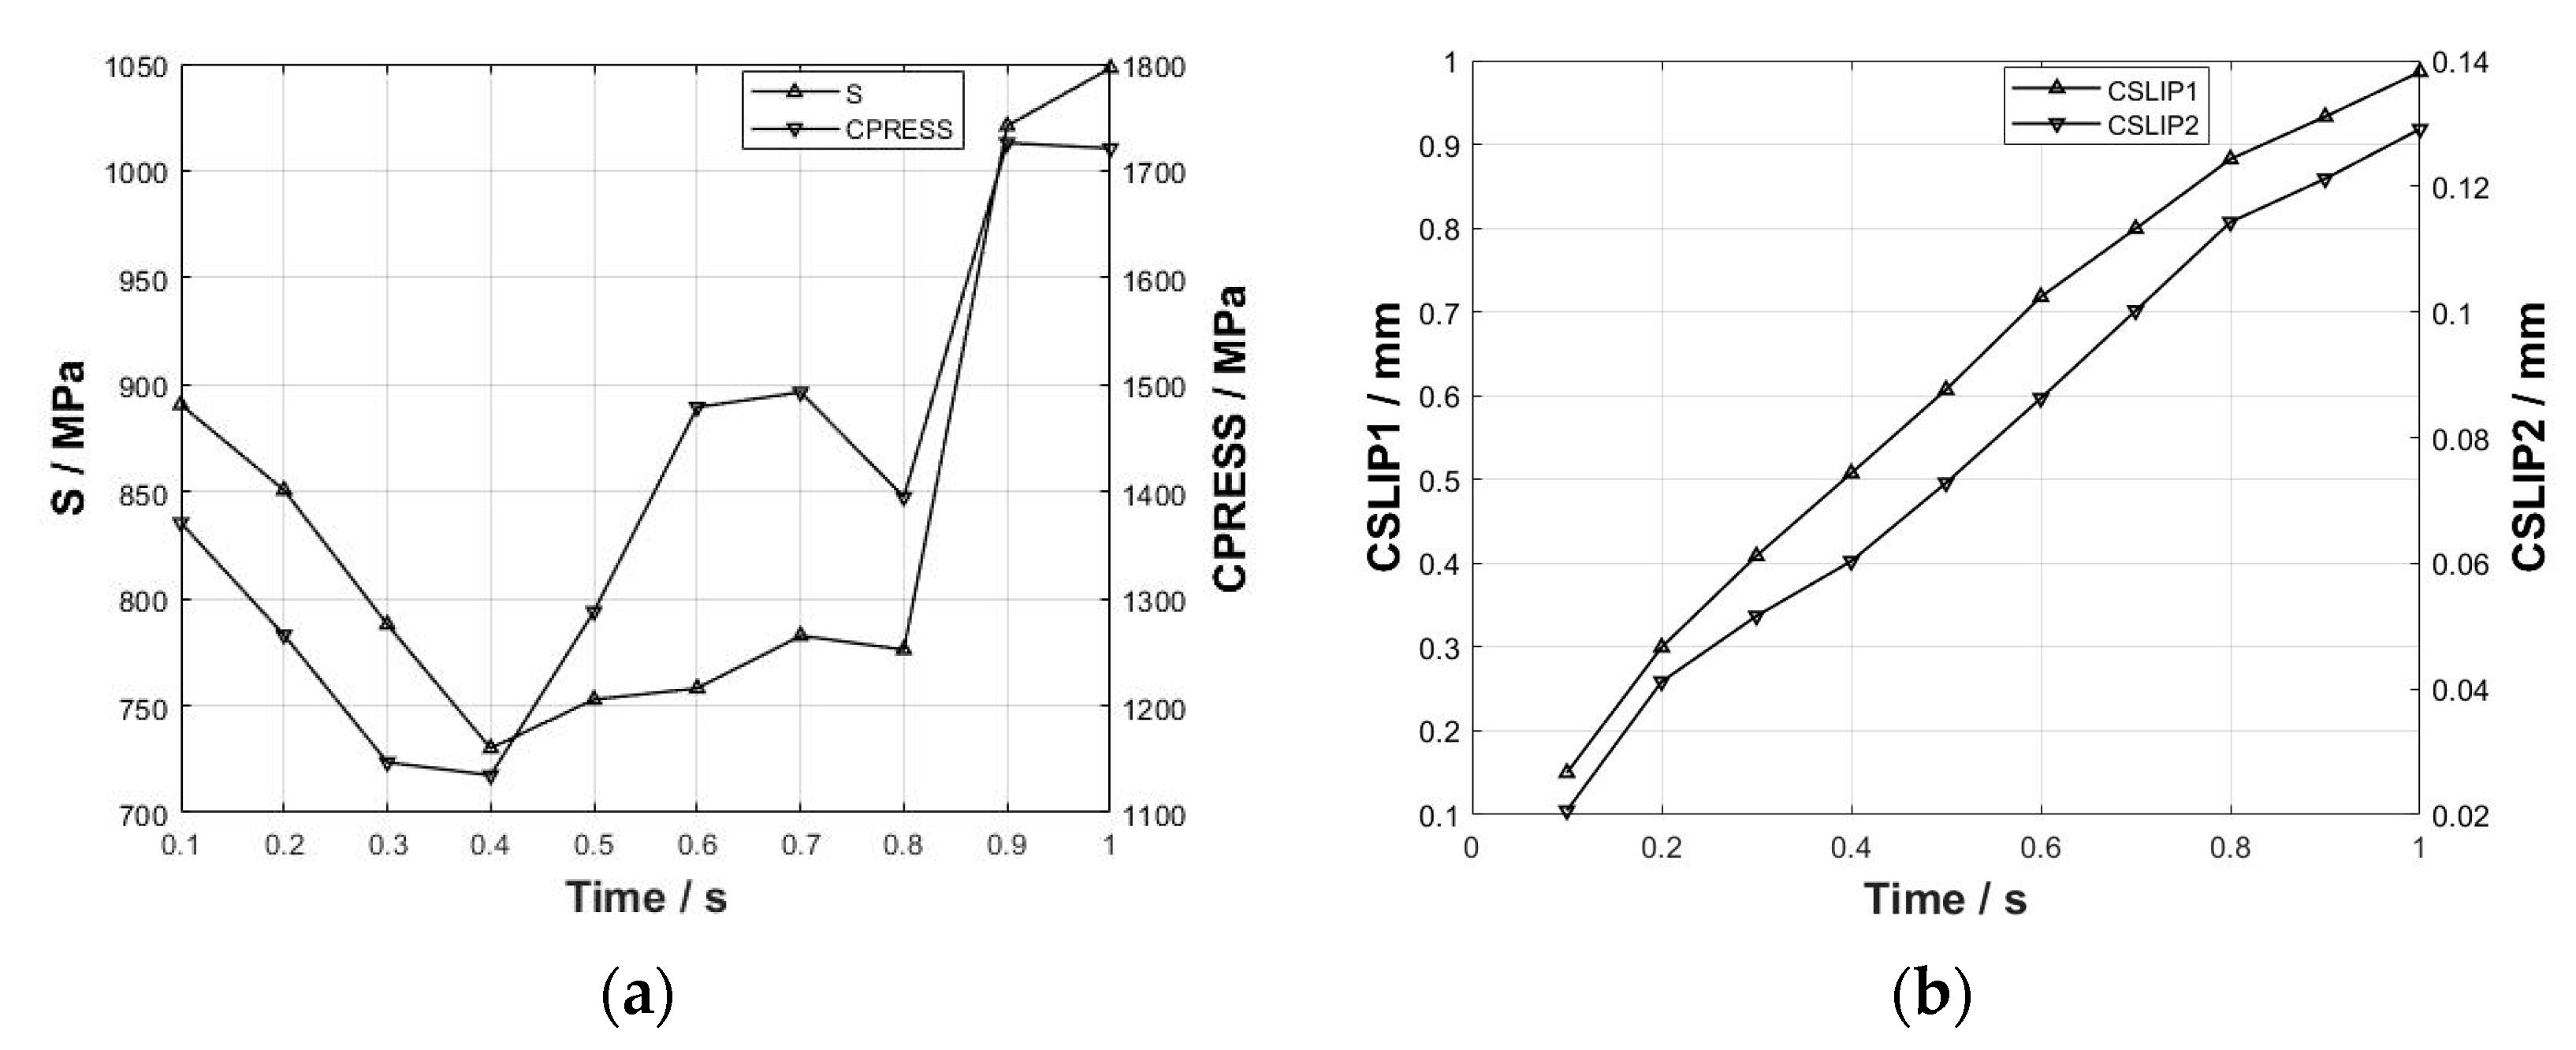
  • As simulation time increases, the maximum wear depth and volume gradually increase, with an accelerating rate of wear depth growth over time. As a result of continuous wear, the contact pressure exhibits an initial decrease followed by a subsequent increase over time.
  • With the increase in applied load, both the maximum wear depth and wear volume exhibit a gradual increment.
  • After incorporating aerodynamic loads, the wear morphology and depth of each tooth surface in the tenon connection structure will undergo alterations, resulting in a more pronounced degree of wear on certain tooth surfaces. Notably, the maximum wear depth is observed at the lower edge of tooth one.
In summary, this study has a certain reference value for a deeper comprehending of the wear mechanism and wear patterns of tenon connection structures.

Author Contributions

Conceptualization, Z.Z.; Methodology, Z.Z., G.Z. and Y.Y.; Software, Z.Z. and G.Z.; Validation, Z.Z., G.Z. and Y.W.; Formal analysis, Y.Y.; Investigation, Z.Z. and Y.Y.; Writing—original draft, Z.Z.; Writing—review & editing, G.Z.; Supervision, G.Z. and Y.Y.; Funding acquisition, H.Z. and Y.W. All authors have read and agreed to the published version of the manuscript.

Funding

The authors gratefully acknowledge financial support from the National Natural Science Foundation of China (Grant No. 12172073 and 12302065) and the National Science and Technology Major Project (Grant No. 779608000000200007).

Data Availability Statement

The data that support the findings of this study are available from the corresponding author, Guang Z, upon reasonable request.

Conflicts of Interest

The authors declare that there are no conflict of interest regarding the publication of this paper.

References

  1. Yang, Q. Investigation of Fretting Fatigue Damage and Shot-Peening Palliative Mechanisms of TC4 Alloy Dovetail Joints. Ph.D. Thesis, Dalian University of Technology, Dalian, China, 2019. [Google Scholar]
  2. Waterhouse, R.B. Fretting Fatigue; Applied Science Publishers: London, UK, 1981. [Google Scholar]
  3. Hoeppner, D. Mechanisms of fretting-fatigue and their impact on test methods development. ASTM STP 1992, 1159, 23–32. [Google Scholar] [CrossRef]
  4. Zhu, M.; Zhou, Z. On the mechanisms of various fretting wear modes. Tribol. Int. 2011, 44, 1378–1388. [Google Scholar] [CrossRef]
  5. Kirk, A.; Sun, W.; Bennett, C.; Shipway, P. Interaction of displacement amplitude and frequency effects in fretting wear of a high strength steel: Impact on debris bed formation and subsurface damage. Wear 2021, 482–483, 203981. [Google Scholar] [CrossRef]
  6. Hurricks, L.P. The mechanism of fretting wear—A review. Wear 1990, 136, 389–409. [Google Scholar]
  7. Vingsbo, O.; Soderberg, S. On fretting maps. Wear 1988, 126, 131–147. [Google Scholar] [CrossRef]
  8. Vincent, L.; Berthier, Y.; Godet, M. Testing methods in fretting fatigue: A critical appraisal. ASTM STP 1992, 1159, 33–48. [Google Scholar] [CrossRef]
  9. Zhang, Z.; Wang, D.; Guo, Y. Fretting friction and wear behaviors of spiral wound gasket (SWG) sealing surface. Tribol. Int. 2019, 133, 236–245. [Google Scholar] [CrossRef]
  10. Tang, P.; Mi, X.; Zhang, J.; Xiong, F.-R.; Zheng, B.; Shao, X.-J.; Peng, J.-F.; Zhu, M.-H. Evolution of wear damage in 690 alloy tube mated with 405 stainless steel plate due to fretting conditions. Tribol. Int. 2021, 163, 107177. [Google Scholar] [CrossRef]
  11. Godet, M. The third-body approach: A mechanical view of wear. Wear 1984, 100, 437–452. [Google Scholar] [CrossRef]
  12. Berthier, Y.; Vincent, L.; Godet, M. Velocity accommodation in fretting. Wear 1988, 125, 25–38. [Google Scholar] [CrossRef]
  13. Fouvry, S.; Kapsa, P.; Vincent, L. Quantification of fretting damage. Wear 1996, 200, 186–205. [Google Scholar] [CrossRef]
  14. Arnaud, P.; Baydoun, S.; Fouvry, S. Modeling adhesive and abrasive wear phenomena in fretting interfaces: A multiphysics approach coupling friction energy, third body and contact oxygenation concepts. Tribol. Int. 2021, 161, 107077. [Google Scholar] [CrossRef]
  15. Ramírez, T.D.l.M.; Cruz, I.H.; Ruiz, M.A.D.; Perrusquia, N.L.; Bustos, D.G.; Martínez, M.F. Numerical model of ultra-high molecular weight polyethylene abrasive wear tests. Model. Numer. Simul. Mater. Sci. 2020, 10, 101001. [Google Scholar] [CrossRef]
  16. McColl, I.R.; Ding, J.; Leen, S.B. Finite element simulation and experimental validation of fretting wear. Wear 2004, 256, 1114–1127. [Google Scholar] [CrossRef]
  17. Fouvry, S.; Kapsa, P.; Vincent, L. An elastic–plastic shakedown analysis of fretting wear. Wear 2001, 247, 41–54. [Google Scholar] [CrossRef]
  18. Fouvry, S.; Liskiewicz, T.; Kapsa, P.; Hannel, S.; Sauger, E. An energy description of wear mechanisms and its applications to oscillating sliding contacts. Wear 2003, 255, 287–298. [Google Scholar] [CrossRef]
  19. Shen, F.; Ke, L.-L.; Zhou, K. A debris layer evolution-based model for predicting both fretting wear and fretting fatigue lifetime. Int. J. Fatigue 2021, 142, 105928. [Google Scholar] [CrossRef]
  20. Wang, C.; Li, C.; Ling, Y.; Wahab, M.A. Investigation on fretting fatigue crack initiation in heterogenous materials using a hybrid of multiscale homogenization and direct numerical simulation. Tribol. Int. 2022, 169, 107470. [Google Scholar] [CrossRef]
  21. Kapoor, A. Re-evaluation of the life of ductile metals by cyclic plastic strain. Fatigue Fract. Eng. Mater. Struct. 1994, 17, 201–219. [Google Scholar] [CrossRef]
  22. Kapoor, A.; Franklin, F. Tribological layers and the wear of ductile materials. Wear 2000, 245, 204–215. [Google Scholar] [CrossRef]
  23. Kapoor, A. Wear by plastic ratchetting. Wear 1997, 212, 119–130. [Google Scholar] [CrossRef]
  24. Yue, T.; Wahab, M.A. Finite element analysis of stress singularity in partial slip and gross sliding regimes in fretting wear. Wear 2014, 321, 53–63. [Google Scholar] [CrossRef]
  25. Ahmadi, A.; Sadeghi, F. A three-dimensional finite element damage mechanics model to simulate fretting wear of hertzian line and circular contacts in partial slip regime. J. Tribol. 2022, 144, 4051814. [Google Scholar] [CrossRef]
  26. Archard, J.F. Contact and Rubbing of Flat Surfaces. J. Appl. Phys. 1953, 24, 981–988. [Google Scholar] [CrossRef]
  27. Ding, J.; Leen, S.B.; McColl, I.R. The effect of slip regime on fretting wear-induced stress evolution. Int. J. Fatigue 2004, 26, 521–531. [Google Scholar] [CrossRef]
Figure 1. Flow chart for simulating fretting wear.
Lubricants 11 00421 g001
Figure 2. Schematic diagram of the mesh division of the tenon connection structure and components: (a) tenon connection structure, (b) tenon and tenon groove.
Lubricants 11 00421 g002
Figure 3. Boundary conditions of the tenon connection structure.
Lubricants 11 00421 g003
Figure 4. Selection of (a) ALE meshes and (b) ALE nodes.
Lubricants 11 00421 g004
Figure 5. Definition of the (a) direction of the fretting, (b) the number of the tenon teeth, and (c) the node path of the tooth surface.
Lubricants 11 00421 g005
Figure 6. Mises stress distribution of the tenon connection structure after loading.
Lubricants 11 00421 g006
Figure 7. Mises stress distribution of the tenon connection structure at (a) initial (X = 0) and (b) maximum (X = 20) point of fretting in the first fretting cycle.
Lubricants 11 00421 g007
Figure 8. Mises stress distribution of the tenon connection structure at (a) initial (X = 0) and (b) maximum (X = 20) point of fretting in the last fretting cycle.
Lubricants 11 00421 g008
Figure 9. Wear depth of nine node paths on the contact surface of tenon teeth with axial node position: (a) first pair tenon tooth and (b) second pair tenon tooth.
Lubricants 11 00421 g009
Figure 10. Maximum wear depth of each pair of tooth nine node paths.
Lubricants 11 00421 g010
Figure 11. Wear depth along with axial for each node path of tooth surface: (a) tooth 1, (b) tooth 2, (c) tooth 3, and (d) tooth 4.
Lubricants 11 00421 g011
Figure 12. Maximum wear depth of each tenon tooth surface nine node path.
Lubricants 11 00421 g012
Figure 13. Wear depth of nine node paths on the contact surface of tenon teeth with axial node position: (a) tooth 1 and (b) tooth 3.
Lubricants 11 00421 g013
Figure 14. Maximum wear depth of each pair of tooth nine node paths.
Lubricants 11 00421 g014
Figure 15. The evolution of maximum stress and slip values on the tenon tooth surface over time: (a) curve of the maximum stress with time and (b) curve of the maximum slip with time.
Lubricants 11 00421 g015
Figure 16. The evolution of maximum wear depth and wear volume of the tenon tooth with time: (a) curve of the maximum wear depth with time and (b) curve of the wear volume with time.
Lubricants 11 00421 g016
Figure 17. Rate of change in maximum wear depth and wear volume: (a) rate of change in maximum wear depth and (b) rate of change in wear volume.
Lubricants 11 00421 g017
Figure 18. The evolution of maximum stress and slip values on the tenon tooth surface over load: (a) curve of the maximum stress with load and (b) curve of the maximum slip with load.
Lubricants 11 00421 g018
Figure 19. Curve of maximum wear depth and increment with load: (a) curve of maximum wear depth with load and (b) curve of wear depth increment with load.
Lubricants 11 00421 g019
Figure 20. Curve of wear volume and wear volume rate with load: (a) curve of wear volume with load and (b) curve of wear volume rate with load.
Lubricants 11 00421 g020
Figure 21. Position of the reference point (RP3) and the aerodynamic loads’ boundary conditions: (a) position of the reference point and (b) boundary conditions of the aerodynamic loads.
Lubricants 11 00421 g021
Figure 22. Mises stress distribution of the tenon connection structure at (a) initial (X = 0) and (b) maximum (X = 20) of fretting in the first fretting cycle.
Lubricants 11 00421 g022
Figure 23. Mises stress distribution of the tenon connection structure at (a) initial (X = 0) and (b) maximum (X = 20) of fretting in the last fretting cycle.
Lubricants 11 00421 g023
Figure 24. Wear depth along with axial for each node path of tooth surface: (a) tooth 1, (b) tooth 2, (c) tooth 3, and (d) tooth 4.
Lubricants 11 00421 g024aLubricants 11 00421 g024b
Figure 25. Maximum wear depth of each tenon tooth nine node path.
Lubricants 11 00421 g025
Table 1. Material parameters of the turbine tenon connection structure.
MaterialDD6 (Blade) GH4720Li (Bladed Disk)
Density (kg/m3)87808140
Young’s modulus (GPa)131225
Poisson’s ratio0.3440.345
Table 2. Wear results of tenon teeth under different boundary conditions.
Centrifugal Load/NAerodynamic Load/NFretting DirectionMaximum Wear Depth of First Pair Tooth/µmMaximum Wear Depth of Second Pair Tooth/µmWear Volume/mm3
50,0000X57.2247.8924.89
50,0000Y30.8518.237.55
50,0000Z24.3618.188.43
50,0002000X75.93 (Tooth 1)/
70.53 (Tooth 2)
78.97 (Tooth 3)/
60.44 (Tooth 4)
39.37
Disclaimer/Publisher’s Note: The statements, opinions and data contained in all publications are solely those of the individual author(s) and contributor(s) and not of MDPI and/or the editor(s). MDPI and/or the editor(s) disclaim responsibility for any injury to people or property resulting from any ideas, methods, instructions or products referred to in the content.

