3.1. Structure and Morphology
Figure 1a,b present the TEM morphology of fabricated MoS
2 nanosheets, from which the ultrathin structure of MoS
2 nanosheets are observed. Meanwhile, the lateral size of the fabricated MoS
2 is around 30 nm. The FTIR spectrum of the prepared MoS
2 is illustrated in
Figure 1c, in which the peaks at 2917, 2846, 1652, 1403 and 718 cm
−1 could be assigned to the bands belonging to oleylamine [
16]. In addition, the peak at 470 cm
−1 can be assigned to the Mo-S bond [
22,
23]. This illustrates that the surfaces of synthesized MoS
2 nanosheets are attached by oleylamine molecules.
Figure 1d is the Raman spectrum of the fabricated MoS
2, in which the peaks at 381.5 and 405.3 cm
−1 belong to the E
12g and A
1g modes of MoS
2, respectively [
24,
25].
Figure 1e–h shows the XPS analysis results of the prepared MoS
2. As seen from
Figure 1e, five elements of C, O, N, Mo, S are discovered, in which C and N are derived from oleylamine molecules, and O elements are attributed to pollutants adsorbed on the surface of MoS
2. The two peaks in the Mo 3d spectrum at 227.52 and 230.68 eV could be distributed to Mo 3d
5/2 and Mo 3d
3/2 of Mo
4+ (
Figure 1f). The S 2p spectrum has two peaks at 160.28 and 161.42 eV, which can point to S 2p
3/2 and S 2p
1/2 of S
2− (
Figure 1g). Meanwhile, the peak positions of Mo
4+ and S
2− are very close to those reported values for MoS
2 [
26,
27]. In addition, the peak located at the position of 398.83 eV in the N 1s XPS spectrum can be attributed to N 1s (
Figure 1h), which again confirms the decoration of oleylamine on the surfaces of MoS
2.
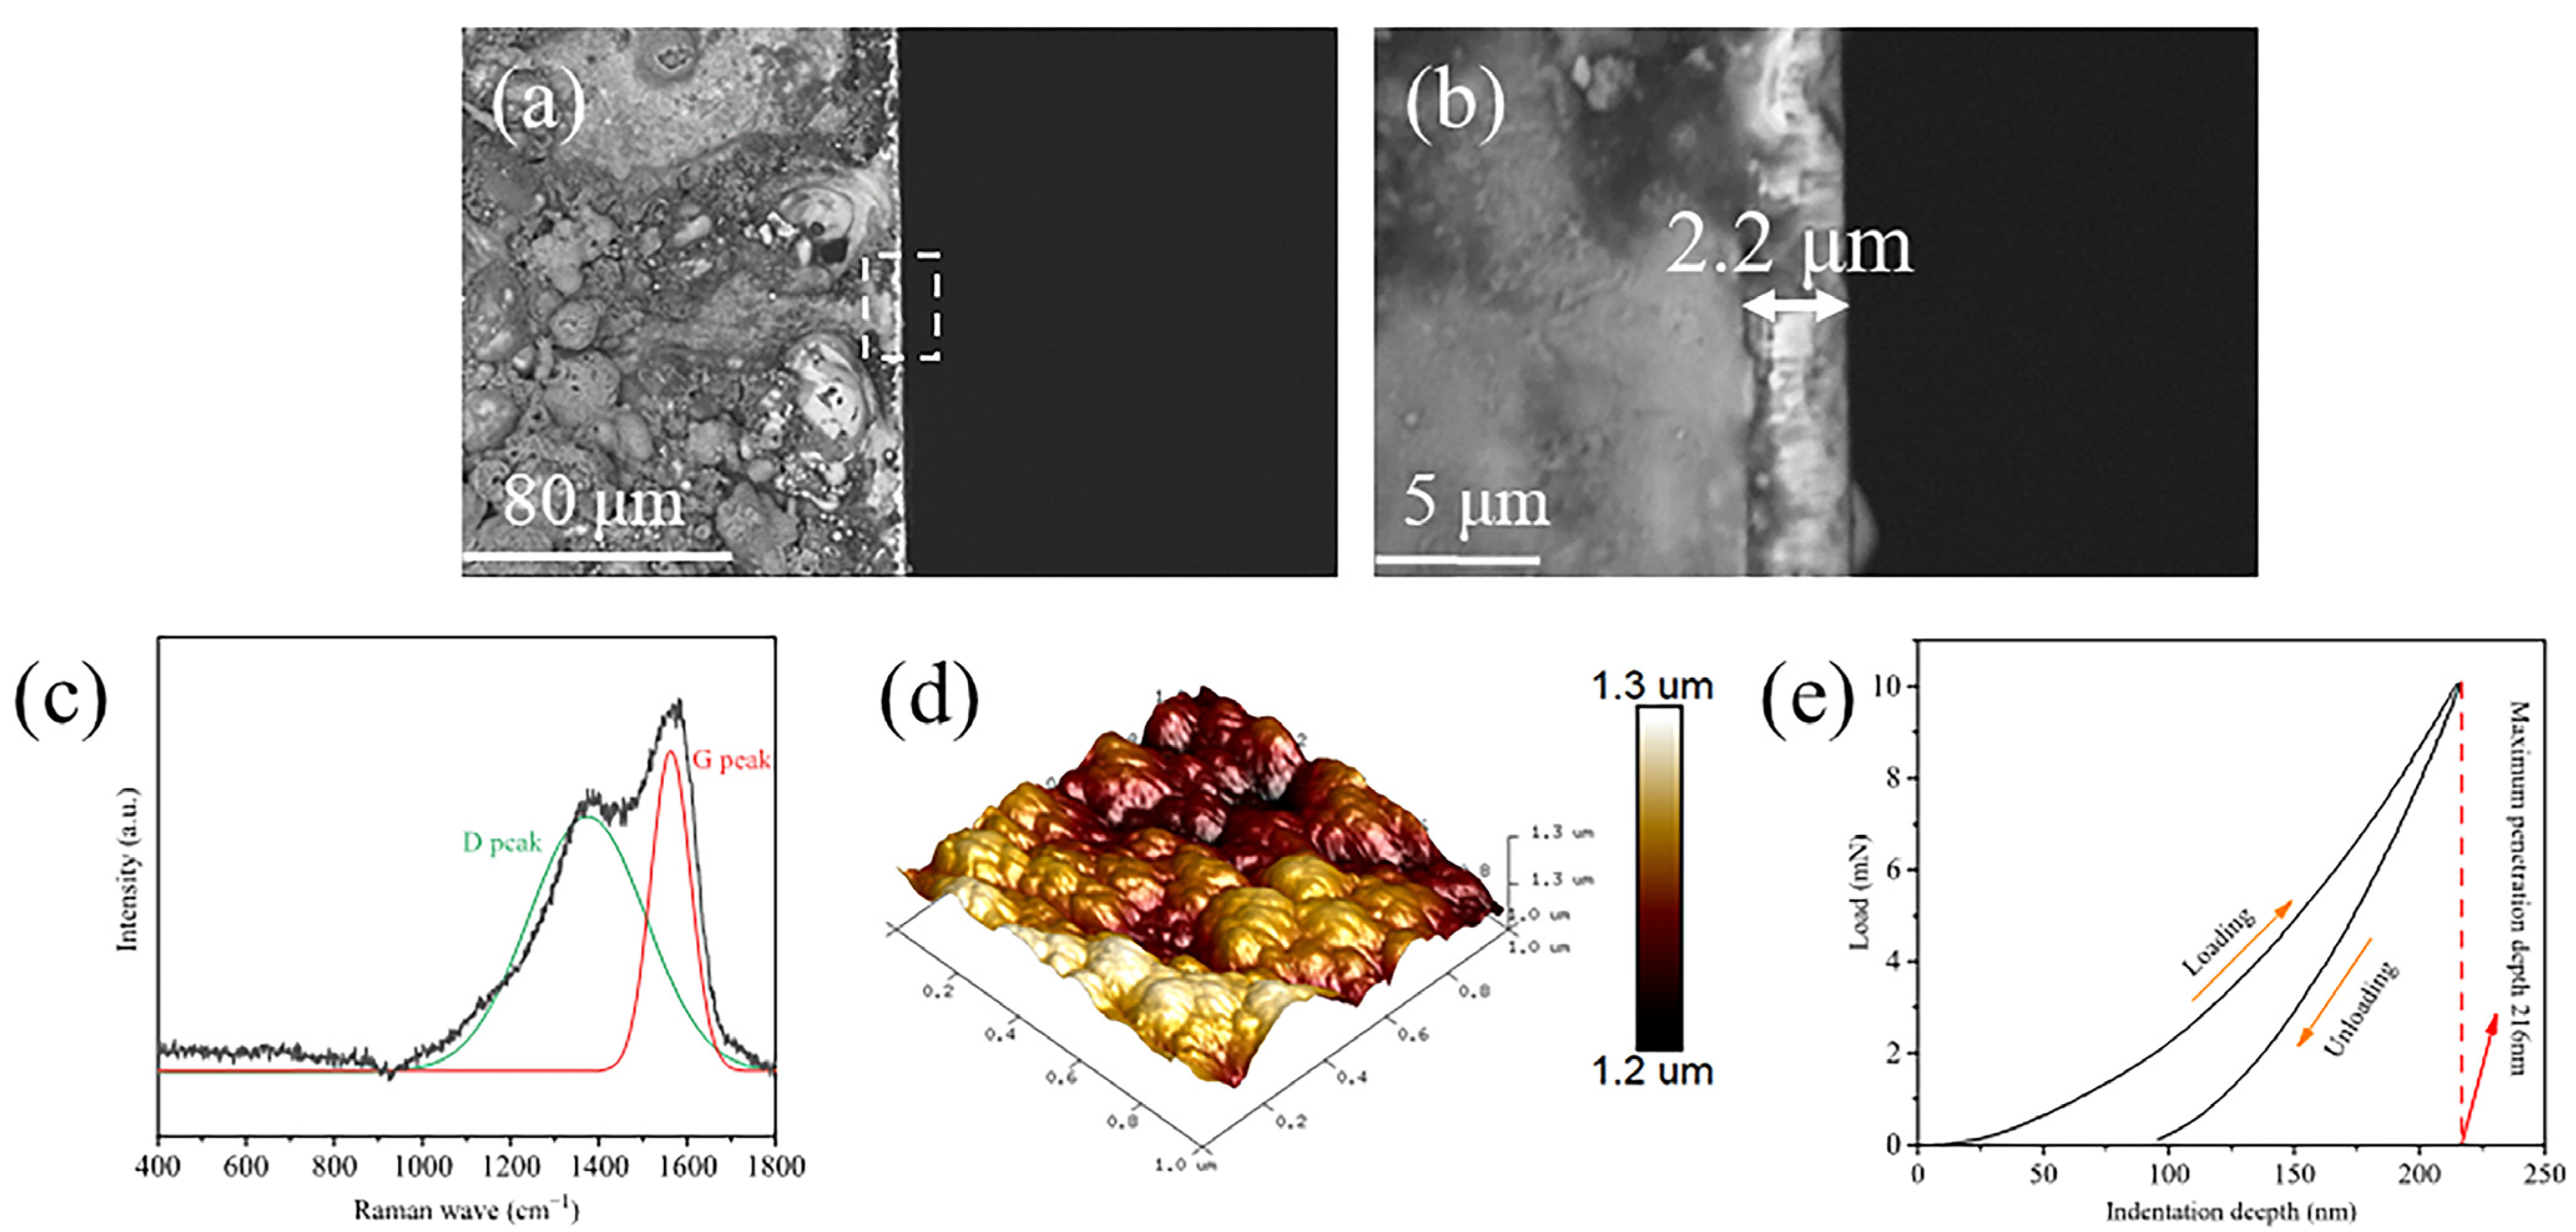
The cross-section of the W-DLC film on the steel disc is shown in
Figure 2a,b. Obviously, the substrate surface is covered by a continuous layer of thin film. The thickness of the film is controlled at about 2.2 μm (
Figure 2b). The Raman spectrum of the deposited W-DLC film is shown in
Figure 2c. Two strong peaks corresponding to the typical Raman peaks of DLC films are observed at 1360 cm
−1 (D band) and 1560 cm
−1 (G band).
Figure 2d exhibits the AFM topography of the W-DLC coating. No sharp rough peaks are observed, and the surface roughness of the W-DLC film is approximately 8.15 nm.
Figure 2e shows the nanoindentation curve of the W-DLC coating. Its hardness and elastic modulus were gauged at 12.48 GPa and 125.8 GPa, respectively. As shown in
Figure 2e, when the test load is 10 mN, the maximum indentation depth is 216 nm, which is close to 10% of the W-DLC coating thickness (2.2 μm), and hence, the influence of the steel matrix on the mechanical characters of W-DLC coating is avoided.
Furthermore, the chemical component of the W-DLC coating was tested through XPS.
Figure 3a shows the full XPS spectrum, in which the C, O and W elements are detected, with the corresponding atomic percentage present in
Table 1. It shows that the W-DLC film is composed of 84.34 at% of C, 15.56 at% of O and 0.1 at% of W, respectively. The O element may have been introduced during the preparation of the film, or it is possible that the W-DLC film is placed in the air before the experiment. The XPS spectra of C 1s and W 4f are revealed in
Figure 3b,c. The C 1s spectrum can be decomposed into five peaks, namely, WC (283.31 eV), W
2C (283.81 eV), sp
2-C (284.6 eV), sp
3-C (285.41 eV) and C-O (286.57eV) [
28,
29] (
Figure 3b). The W 4f spectrum is shown in
Figure 3c, and two states of W-C (at 33.61 and 35.69 eV) and W-O (at 34.64 and 37.15 eV) are found. As stated above, the oxygen element exists in the W-DLC coating as contaminants arising from external factors, and therefore, the W-O bond is observed.
3.2. Tribological Property
Before friction tests, the dispersible stability of the lubricating oils additivated with MoS
2 nanosheets was examined by the precipitation observation method. The prepared MoS
2 were blended with the PAO oil at contents within a range of 1–5 wt%.
Figure 4a shows the photographs of the oil samples after sitting for 3 h. Obviously, the appearance of the MoS
2-containing oils stays black after standing 3 h. Furthermore, no significant precipitation is found at the sample bottoms (
Figure 4b). This illustrates the good dispersion stability of synthesized MoS
2 nanosheets in the oils during the tribological tests.
Figure 5 presents the tribological properties of steel/W-DLC and W-DLC/W-DLC tribopairs lubricated by the oils with different concentrations of fabricated MoS
2 (at the load of 20 N). As
Figure 5a illustrated, the friction coefficient (COF) first increases and then decreases with increasing MoS
2 content in oils. A minimum COF value of 0.079 is obtained when the oil additivated with 4 wt% MoS
2. At most, the COFs are reduced by 12.79% (steel/W-DLC contact) and 14.78% (W-DLC/W-DLC contact) in comparison with that lubricated by pure PAO oil. A promotion of the MoS
2 content from 4 wt% to 5 wt% could lead to an increase in the COF. This is attributed to the unavoidable agglomeration and accumulation at a high concentration of MoS
2 nanosheets, resulting in a damage of lubricant film.
Figure 5b exhibits the worn scar diameters (WSDs) on the upper tribopairs with the changes of the MoS
2 nanoparticles’ concentration. Obviously, the WSDs tend to be parabolic with the MoS
2 additives’ concentration increasing, irrespective of pairs of friction materials. This could be explained by the fact that the oils with a low content of MoS
2 nanosheets could not offer a sufficient supply of lubricant additives in the late-stage of the friction tests. On the contrary, the irreversible agglomeration and abrasive effects rising from the agglomeration of MoS
2 nanosheets at a high concentration greatly reduce the valid volume of lubrication constituents. For the steel/W-DLC couples, the WSDs are reduced by 3.08% and 0.84% after adding 3 wt% and 4 wt% into PAO oil, respectively, if compared to the pure PAO 6 oil. After adding 4 wt% MoS
2 nanosheets to PAO oil, the WSDs for the W-DLC/W-DLC tribopairs is reduced by 22.37%. As
Figure 5 shows, the PAO oil with 4 wt% MoS
2 nanosheets exhibits a relatively better friction reduction and wear resistance properties, irrespective of tribopairs. Therefore, the MoS
2 nanosheets concentration in PAO 6 oil is fixed at 4 wt% for subsequent tribological tests.
Figure 6 illustrates the influence of loads on the lubrication property of the steel/W-DLC and W-DLC/W-DLC contacts under different lubrication conditions. The experimental loads were set to 5N, 10 N, 20 N and 30 N, respectively. As
Figure 6a shows, there is not significant change in the COF as the function of the load. However, the MoS
2 additivated oil exhibits a relatively smaller COF than that of the pure PAO oil. In the steel/W-DLC couple, the average COF is calculated to be decreased by 10.83% after adding fabricated MoS
2 into the PAO oil. With regard to the W-DLC/W-DLC couple, the introduction of MoS
2 nanosheets into the PAO oil reduces the average COF by 15.44% compared to the pure PAO oil.
Figure 6b illustrates the maximum wear scar depth of the lower W-DLC discs with the changes of applied load. Obviously, the maximum wear scar depth increases gradually with the applied load, and there is a reduction in the maximum wear depth after adding fabricated MoS
2 into PAO oil. Moreover, it is clear from
Figure 6b that the worn scar depth in the W-DLC/W-DLC couple is much shallower than that in the steel/W-DLC couple, irrespective of lubricating oils. For example, when tested with pure PAO oil, the average wear scar depth in the steel/W-DLC couple is 84.38% higher than that of W-DLC/W-DLC couple. As the MoS
2-containing oils used for lubrication, the average wear scar depth is about 15.61% lower for the steel/W-DLC contact and this for the W-DLC/W-DLC contact is about 41.09%, compared with that lubricated by pure PAO oil. From
Figure 6, it is evident that the lubricating effect of the MoS
2 in the W-DLC/W-DLC couple is more benefitting in comparison with the steel/W-DLC couple.
The worn scars of the rubbed W-DLC film were analyzed using the white light interferometer, which also allows for the wear volume of scars to be measured.
Figure 7 shows a comparison between wear scars generated from the steel/W-DLC and W-DLC/W-DLC tribopairs. As expected, the wear volume of scratches deepens with increased applied load. As
Figure 7a
1–a
4 show, deep furrows are found on the worn surface generated from the steel/W-DLC contact lubricated by base PAO oil. For the W-DLC/W-DLC lubricated by PAO oil, the wear scar is relatively flat, and very slight scratches occur on the rubbing surfaces (
Figure 7b
1–b
4). As the MoS
2-added oil used for lubrication, the wear scars in the steel/W-DLC couple turn much shallower in contrast to that lubricated by base PAO oil, and corresponding wear volumes are reduced significantly (
Figure 7c
1–c
4). This result confirms the contribution of fabricated MoS
2 into improving the wear resistance property of PAO oil. However, no scratches are visible on the friction surface derived from W-DLC/W-DLC contact with an expectation at a high load of 30 N (
Figure 7d
1–d
4).
3.3. Wear Surface Analysis
The topographies of the above wear surfaces were investigated using SEM, with the results present in
Figure 8. For the steel/W-DLC tribopairs, a lot of deep grooves are observed on the wear surface lubrication with pure PAO oil (
Figure 8a
1–a
4), consistent with their 3D images, shown in
Figure 7a
1–a
4. SEM images of worn surfaces for the W-DLC/W-DLC couple lubricated with pure PAO oil show relatively smooth wear surfaces only with some slight friction marks (
Figure 8b
1–b
4). In the cases of the MoS
2-containing oil for lubrication, the wear damage in the steel/W-DLC contact is significantly alleviated compared to that tested with pure PAO oil (
Figure 8c
1–c
4). At the load of 5 and 10 N, the wear surfaces are covered a layer of tribofilm (
Figure 8c
1,c
2). However, at a higher load of 20 N, it is found that a certain quantity of W-DLC coating is peeled off and delaminated from the steel substrate, as evident in
Figure 8c
3. When the imposed load increases to 30 N, the sign of grooves and plastic deformations are visible on the worn surface (
Figure 8c
4). As for the W-DLC/W-DLC tribopairs, the worn regions tested with prepared MoS
2 nanosheets exhibit quite smooth characteristics at 5 and 10 N, with the presence of a small amount of pits (
Figure 8d
1,d
2). Comparatively, in the tests at 20 N and 30 N, the wear surfaces show quite smooth appearances without any evidence no sign of scratches (
Figure 8d
3,d
4).
To analyze the elemental distribution of the worn marks on the W-DLC film coated discs tested in the presence of MoS
2 additives, EDS mapping was performed in the worn surfaces (
Figure 8c
3,d
3), with the results shown in
Figure 9. In both cases, the Mo and S elements appear on the worn scars. Prior to SEM analysis, the surfaces were ultrasonically cleaned with acetone, which guarantees that physically absorbed MoS
2 into rubbing surfaces can be removed. The remain of elements of Mo and S on worn surface, in spite of the ultrasonic cleaning, suggests a tribochemical reaction between the MoS
2 nanosheets and the W-DLC coating. Moreover, the worn scar derived from the W-DCL/W-DLC couple has more transferred Mo and S elements, indicates clearly the formation of a strong protective layer of MoS
2-based tribofilm.
In order to further confirm whether the occurrence of interaction between the MoS
2 and the W-DLC coating, the worn scars on lower W-DLC specimens (
Figure 8c
2,d
2) were examined by XPS analysis (
Figure 10).
Table 2 illustrates the quantification of XPS collected from the worn surface. The elements of C, W, O, Fe and Mo and S are discovered. The C, W and O elements could originate from the expected composition of their deposited coating. The minor Fe element could be derived from the steel substrate. Regardless of the type of tribopairs, Mo and S elements are found in the worn scars, which could be derived from the MoS
2 additives. In addition, a large concentration of O element, about 17–20 at%, is detected at the surfaces of W-DLC film, indicating that the W-DLC film was oxidized in the tribotest.
The XPS spectra of W 4f, C1s, Mo 3d and S 2p were collected from two mentioned tribopairs (
Figure 9a,b) and are displayed in
Figure 11. As
Figure 11 shows, the Mo 3d, C 1s, W 4f and S 2p XPS spectra for the two tribopairs tested with MoS
2 nano-additives are similar. The C1s spectrum can be assigned into WC
2, WC, sp
2-C, sp
3-C and C-O bonding states, respectively (
Figure 11a
1,b
1). The W 4f spectrum exhibits six peaks, which correspond to three tungsten-bonding states, i.e., W-C, WS
2 and WO
3, respectively (
Figure 11a
2,b
2). In contrast to the as-received W-DLC coating (
Figure 3c), the W present in the rubbed W-DLC coating is transferred from WO
2 into the oxidized form of WO
3. The Mo 3d
5/2 spectrum consists of the major peak belonging to MoS
2 and the minor peak arising from Mo-O (
Figure 11a
3,b
3). As to the S 2p
3/2, it consists of the S-W bond and MoS
2 (
Figure 11a
4,b
4). The discovery of the S-W species in the
Figure 11a
4,b
4 indicates that the MoS
2 adhered onto the W-DLC coating via the bonding of W-S. Presumably, the generation of a tribofilm based on MoS
2 nanosheets is responsible for the worn resistance effect.
Furthermore, the wear marks on the W-DLC-coated discs (
Figure 9a,b) were analyzed using Raman spectroscopy. As
Figure 12 shows, the Raman spectra of the rubbed W-DLC coatings show a peak around 1360 cm
−1, corresponding to the D band and a peak around 1560 cm
−1 attributed to the G band. However, the two rubbed surfaces exhibit a significant difference in the aspect of the peak ratio (I
D/I
G) of the D and G bands. It is well known that the peak ratio (I
D/I
G) value indicates the extent of graphitization of DLC coatings [
30,
31]. Moreover, the higher extent of graphitization is generally confirmed from the increase in the peak ratio (I
D/I
G) of the D and G bonds. Through curve fitting, the rubbed W-DLC coating generated from the steel/W-DLC contact present an I
D/I
G value of about 6.6, and this for the W-DLC/W-DLC contact is 0.82. Obviously, the peak ratio (I
D/I
G) in the rubbed W-DLC coating from the steel/W-DLC couple is significantly higher than that for the W-DLC/W-DLC couple. This suggests that higher extent of graphitization occurred at the rubbed W-DLC surface generated from the steel/W-DLC couple as compared to the W-DLC/W-DLC couple. It is speculated that the microhardness of the W-DLC coating decrease arising from the increased extent of graphitization under applied loads, and therefore, induced the increase of wear rates of the W-DLC coating.
Figure 13 illustrates the SEM images of the wear ball region derived from the steel/W-DLC and W-DLC/W-DLC tribopairs experimented with MoS
2 (at 20 N). It is obvious that compared to steel/W-DLC contact, the WSD of W-DLC/W-DLC is significantly reduced. For the steel/W-DLC contact (
Figure 13a), there are a few debris particles scattered at the edge of the wear mark. Meanwhile, the Mo and S elements are mainly discovered at the margin, which may result from the broken MoS
2 nanosheets or their hard oxides. C and W elements are also observed on the worn ball surface. This can be interpreted as the W-DLC film being transferred to the ball when the naked ball slides on the W-DLC coated surface. With regard to the W-DLC/W-DLC couple (
Figure 13b), some particle-like debris observed on the wear mark. Elements including C, W, O, Fe, Mo and S exist on the worn surface. In addition, there is an obvious distribution of Mo and S elements detected, indicating a continuous MoS
2-based tribofilm on the worn surface.
3.4. Discussion
In this paper, the tribological behaviors of steel/W-DLC and W-DLC/W-DLC contacts were tested in the presence of base PAO 6 oil and ultrathin MoS
2-containing oil. As seen from
Figure 6 and
Figure 7, the friction is generally lower when two contact regions were coated with W-DLC than when only one counter-body was coated, which is observed in pure PAO oil and MoS
2-additivated PAO oil.
As well known, the lubrication region of a ball–disc point contact pair can be determined by the film thickness ratio
λ illustrated in Equation (1), which depends not only on the oil film ply, but also on the roughness of the frictional surfaces [
32]:
where
Ra1 and
Ra2 are the roughness of the two frictional surfaces, respectively, and
h is the oil film thickness. When
λ ≤ 1, two frictional surfaces are lubricated at the boundary status; when 1 <
λ ≤ 3, the mixed lubrication state occurred on two frictional pairs; when
λ > 3, two frictional surfaces are absolutely separated with a lubricating film and stay in the fluid lubricant state.
The relevant oil film thickness (
hc) in the central area can be calculated according to the Hamrock–Dowson formula [
32]:
where
hc is the oil film plying in the central area,
α is the viscosity coefficient of the oil (3.5 × 10
−8 m
2/N),
E’ is the equivalent elasticity modulus (172.28 Gpa),
U is the entrainment speed (0.02 m/s),
η0 is the viscosity of the oil,
R′ is the equivalent radius,
W is the applied load, and
k is the ovality (1.03). According to the Equations (1)–(4), the results are present in
Table 3, in which the
λ value exhibits a value lower than 1, indicating that a boundary lubrication regime occurs during the friction process.
It is highly appreciated that an effective tribofilm exercise important influences on the friction behavior of oils in the boundary lubricating regime. Generally, it has been documented that the doping metal elements in DLC coating could provide reactive sites for the coating–lubricant interactions of forming a tribofilm [
33]. Such behavior has been observed for the W-DLC coating in our paper, as confirmed by the XPS results shown in
Figure 11. However, the friction could also induce the graphitization of W-DLC film, which resulted in local lamination of W-DLC films [
34]. It is shown in
Figure 13 that in contrast to the steel/W-DLC couple, the graphitization extent of W-DLC film in the self-mated W-DLC/W-DLC couple was significantly decreased. Two possible friction mechanisms are schematically presented in
Figure 14. For the steel/W-DLC contact (
Figure 14a), the pressure and temperature in the contact provoked the tribochemical reaction between MoS
2 and the bare steel ball or the disc coated with W-DLC film forming a tribofilm separating two reciprocating surfaces. However, the W-DLC film was largely graphitized and oxidized under the friction conditions, resulting in the drop of its microhardness, and thus causing local delamination of W-DLC films. In addition, the carbon atoms in the DLC coating could be diffused into the ferrous surface because of the thermo-chemical interaction between the DLC coating and steel surface, which accelerated W-DLC coatings’ wear [
35]. Thus, the shift of W-DLC stuff from the lower W-DLC coated disc into the upper steel ball was observed in
Figure 12a. In addition, the MoS
2 nanosheets adhere onto the bare steel surface, and later, those nanoparticles slid against the W-DLC film, which could accelerate the wear of coated surface. As to the self-mated W-DLC/W-DLC couple, as shown in
Figure 14b, a rather thick layers of tribofilm adheres to the DLC-coated surface through the tribochemical reaction between MoS
2 and the W element doped in W-DLC, which has been demonstrated by an SEM observation in
Figure 10. Furthermore, the tribofilm is formed at both counterparts, and they may keep the contacting asperities separated. In this case, the extent of graphitization of W-DLC film was alleviated because of the lubrication and protection from the MoS
2-based tribofilm on two friction surfaces, and a better lubrication effect was obtained.


