1. Introduction
1.1. A Few Aspects
The discipline of how power converts in a system of mating components with relative motion is the central topic of tribology. In a general view, at least two solid components are moved relatively against each other under force (the power input) and in the presence of a lubricant as a soft material in a randomly defined environment (see
Figure 1).
Tribology appears as a scattered cross-discipline, merging physical sciences and chemistry while adapting to self-generated theories. However, a concise definition is hard to state, and it is commonly established (see, for example, [
1,
2,
3,
4,
5] and many more). The friction and lubrication of solids (solid-state bodies) were studied previously by Bowden and Tabor [
6]. Lubrication as a soft matter medium, separating the solid-state bodies, has been extensively studied within EHL (elastohydrodynamic lubrication) (see, for example, [
7,
8,
9,
10,
11,
12,
13] and many more). Basically, EHL is the topic of how a lubricant, as a body of soft matter, enters and passes a converging gap between two solid bodies. It undertakes the effort to define the role of the hydrostatic pressure that lifts off the moving solid parts. This effect reduces the direct touch of the solid bodies might lead to the consequence of wear. Hence, EHL is related to the Reynolds theory of fluid transportation in pipes (see, for example, [
14,
15,
16] and many more). Similar to modern drive train technology (e.g., automotive), lubrication films narrow down in order to reduce the friction caused by splash losses, and thin films in the region of sub-microns and nanoscales appear. Thin film lubrication (TFL) became a field of intense research (see, for example, [
17,
18,
19,
20] and more). While within EHL and TFL, a lubricant is treated as a continuum, the continuous reduction in the tribofilm into a molecular dimension (a few nanometers) means that their chemical properties, e.g., electron transfer and photon emission processes, emerge. These processes are the domain of Tribocatalysis (TC) (see, for example, [
21] and more). Chemical processes related to catalysis are discussed as significant in understanding the role of functional additives in TFL and boundary lubrication. Plenty of studies have been carried out in order to investigate how the chemical structure is related to the function and the life of a drive train component (see, for example, [
22] and more). Irregularities by the appearance of unexpectedly high wear and other effects caused by the use of additives that should prevent wear are reported (see, for example, [
23,
24] and more). Materials exposed to wear, where the solid bodies are touching each other, act under transient and non-equilibrium conditions (see, for example, [
25,
26,
27] and more), emitting and exchanging photons, electrons, charged and non-charged particles (see, for example, [
28,
29,
30] and more), denoted commonly as fracto-emission (FE). Lowering the film thickness in tribological contact brings both solid-state and lubricants under perpetual stress, causing the excitation of the molecular and solid-state structure. As the input frequency of stress is high compared to the relaxation and repairs the capability of the partner, electron and photon exchange processes appear, but also chemical reactions. The engineering of the transition from TFL to TC and FE is hard to parametrise by the components tested due to the many apparent scales (from a few nanometers to meters). Both engineering molecular processes and trans-scale modeling have given the motivation to undertake multi-scale modeling (see, for example, [
17,
31,
32,
33] and more).
1.2. White Etching Cracks (WEC) and Lubricants
WEC came into the interest of industry and research within more than a decade [
34]. The failure has been attributed to material degradation processes (see, for example, [
35,
36] and more) in relation to lubricants and parametrised conditions (see, for example, [
37,
38] and more). Even though some patterns with respect to the compositions of lubricants are reported (see, for example, [
39,
40] and more), a clear pattern in relation to the structure of any chemical and stoichiometry is missing.
1.3. A Distinct Perspective
The continuous reduction in the tribogap (schematical sketch, see
Figure 2) puts the lubricant constituents under stress. A (see
Figure 2) reflects the situation where the thermal motion and mutual electronic excitation by neighbouring molecules are in balance with relaxation to the ground state. This basically reflects EHL and viscous flow. As their collision rates increase and the space becomes narrower, the molecules react with density and increase in symmetry, and their narrowing could lead to a superstructure (see
Figure 2B). This self-organised structure acts as a new species, different in physics (e.g., A), solubility, viscosity, friction, and functional release. Narrowing the tribogap further (see
Figure 2C) finally causes the disruption of the molecular system as the collision rates and the mutual touchdown do not allow structural relaxation.
We argue that the capability of a lubricant to undergo the transition from A → B → C is a key parameter in lubrication.
2. Materials and Methods
With reference to the basic investigations, as described in the previous section, we tried to set up an empirical-based concept on how the molecular transition from EHL toward TFL and TC could be described. As lubricants in the life cycle are a) constituted of many components and b) exposed to complex loading, we took the concept presented earlier [
41,
42,
43]. Basically, the mutual interaction therein is described as a matter of a non-dimensional factor
Di,j, which arises from the chemical potential of a pair i,j of constituents.
Di,j could be interpreted as a lubricant stress factor caused by impact stress from the tribological gap (see
Figure 2). This concept neglects the equilibrium that each molecular system tries to reach under stress but describes instead the proximity or distance to the equilibrium. Ideally, the equilibrium is reached if
Di,j = 1 is the chemical potential of a set of equal components i,j, which, per definition, means
Di,j = 1. As an activity parameter, we took, according to [
41,
42,
43], the dipolemoment divided by the sum of all dipolemoments as well as the induced dipolemonent divided by the sum of all induced dipolemoments as non-dimensional parameters to calculate the stress response factor, Dij, between the components i and j. If
Di,j < 1, it stays within {0,1} and denotes it’s probability to be present in the system. If, in contrast,
Di,j > 1, we define the appearance of clusters by dividing
Di,j by a number n (n ∈ Z), so that
Di,j comes back into {0,1}. The number n is interpreted as degeneration, as the factor leading to clusters within the system of constituents. Notably,
Di,j and the clusters appear simply as transient probabilities independent of how far they are from a thermodynamic equilibrium. Within a real lubricant, all combinations i,j have to be calculated by means of increasing activity. This leads to a matrix of cluster and non-cluster presence for each activity level on all possible combinations i,j related to the given activity. As all combinations are allowed per activity, the individual percentages of the dipole (cluster/non-cluster) and inducible dipoles (polarisabiliy) (cluster/non-cluster) are calculated. The dipole moments and polarisabilites are calculated using the semiempirical PM3 method (Hyperchen 8.0™). The chemical structures are derived either by brand name or by retro-analysing the lubricant with infrared and XRF analyses. All calculations described here are automised using the system software tool Solu42
TM 1.1.
3. Experimental Section
In order to evaluate the system, an FE8 test rig (according) to the DIN 51819 standard was used (see
Figure 3 and
Figure 4 (taken from [
39]).
A set of test lubricants divided into Extreme Pressure (EP) and Anti-Wear (AW) candidates given by the chemical structure of the additives was used (see [
43]) and
Appendix A. All permutations for any component pair i,j as a function of a virtual activity were calculated using Software Package Solu42
TM. For the driving factor for the interaction of the components, their activity coefficient taking the relative dipolemoment was finally given by the dipolemoment of an individual divided by the sum of all components used. The same investigation was used to calculate the relative polarisabilities (the induced dipole moment). The dipolemoments and polarisabilities of all components are retrieved via a calculation using the semiempirical parametrised method 3 (PM3) with Hyperchem(8.0)™. As explicitly explained in [
43], the factor
Di,j is obtained as follows:
(ai): Dipole activity for the relative dipolemoments and polarisability activity for the relative polarisability. The term Di,j is calculated using means in relation to increasing tribological activity (aj), which is basically the activity with respect to the surface (S) and the “inner” structure of the fluid (L).
If Di,j > 1, it is interpreted as a cluster (CL). Calculating all combinations, it comes down to the following predictors:
CL_Di_Add_S: Dipolar cluster formation of the additive at the surface
CL_Po_Add_S: Polarisability cluster formation of the additive at the surface
Di_Add_S: Dipolar formation of the additive at the surface
Po_Add_S: Polarisability formation of the additive at the surface
CL_Di_Add_L: Dipolar cluster formation of the additive within the liquid (L)
CL_Po_Add_L: Polarisability cluster formation of the additive within the liquid (L)
Di_Add_S_L: Dipolar formation of the additive within the liquid (L)
Po_Add_S_L: Polarisability formation of the additive within the liquid (L)
CL_Di_L_S: Dipolar cluster formation of the liquid at surface S
CL_Po_L_S: Polarisability cluster formation of the liquid at surface S
If more than one Baseoil component is present, e.g., Li,j, the combinations are extended for each i,j.
CL_Di_Add_Li,j: Dipolar cluster formation of the additive within the liquid Li,j
CL_Po_Add_Li,j: Polarisability cluster formation of the additive within the liquid Li,j
Di_Add_S Li,j: Dipolar formation of the additive within the liquid Li,j
Po_Add_S_ Li,j: Polarisability formation of the additive within the liquid Li,j
CL_Di_Li,j: Dipolar cluster formation of the additive within the liquid Li,j
CL_Po_Li,j: Polarisability Cluster formation of the Additive within the liquid Li,j
Di_Li,j_S: Dipolar formation of the liquid Li,j at surface S
Po_Li,j_S: Polarisability formation of the liquid Li,j at surface S
CL_Di_Li,j_S: Dipolar cluster formation of the liquid Li,j at surface S
CL_Po_Li,j_S: Polarisability cluster formation of the liquid Li,j at surface S
4. Results
The results of the component testing versus the variants in lubricants and their chemical predictors are exemplified in
Table 1 for activity parameter 1, which represents the lowest activity. For the computation of the entirety of the chemical predictors, we used Hyperchem 8.0™ as a base in order to calculate the dipolemoment and the polarisability of each component. The computation of the chemical predictors as a function of imposed surface activity was carried out by the software package Solu42
TM. The results were split into non-clusters and clusters (CL) for the various combinations given by the base oil and the additives. For computation, an increase in surface activity was used (for details, please contact the authors). In order to obtain the main predictors explaining the individual wear of the test rig components, e.g., cage, rollers, and washers, but also the average wear and the wear of single components, a variety of statistical methods were used.
The boxplot is a standardised graphical representation that effectively illustrates the distribution of data by utilising its five-number summary, which includes the minimum value, the first quartile (Q1), the median, the third quartile (Q3), and the maximum value. Boxplots provide valuable insights into the presence of outliers and their corresponding values, as well as the symmetry of data, the degree of data clustering, and the skewness of data [
44]. We calculated the average wear for each lubricant to better represent its corresponding wear.
Figure 5 illustrates that the average wear of AW has outliers (2 dots in red rectangle shape). After removing these outliers, a clearer representation of the distribution of the average wear for both EP and AW is shown in
Figure 6. The spread of average wear for EP is noticeably wider than AW. Despite their medians being closely matched, EP displays a right-skewed distribution, while AW leans toward a left-skewed pattern.
4.1. Comparison of Wear Characteristics between EP and AW Lubricants
From
Figure 7, overall, the median lines on the box plots suggest that EP lubricants tend to have higher wear attributes than AW across all four wear types. For the roller and cage types, AW data cluster tightly around the median and show much lower wear compared to EP. By contrast, for the housing and motorside types, the wear data for AW are more spread out, with the medians slightly different from EP.
4.1.1. EP Lubricant Wear Profile
Under EP lubrication, the wear values associated with the rollers, housing, and motorside mostly fall within the 1 to 200 range, while the wear cage displays range from 10 to approximately 500. This range has enhanced data dispersion that is considerably higher than other wear types within the EP category (
Figure 8).
4.1.2. AW Lubricant Wear Profile
The wear characteristics of rollers, housing, and the motorside in AW lubricants typically fall between 0 and about 150. On the other hand, the wear cage varies from 30 to 350; however, this variation is not as pronounced as with EP lubricants. Notably, the wear roller in AW exhibits lower wear than the other types, as 50% of the data fall between 0 to approximately 70. The chemical codes AW6a and AW10a stand out as outliers since they fall beyond the average range indicated by the box plot’s whiskers, which is another important point to make (
Figure 9)
. 4.2. Correlation between Average Wear and Chemical Predictors of EP and AW Lubricants
We used correlation analysis in our study to evaluate the linear relationships between chemical predictors and average wear. The correlation coefficients (r) were calculated to provide an indication of the strength and direction of these interactions. An r value near 1 or −1 indicates a strong positive or negative connection, respectively, whereas values closer to 0 imply a weaker link. Positive correlation indicates that one variable increases as the other increases, and negative correlation means that, as one variable increases, the other decreases.
A significance level (α) of 0.05 was used to examine the statistical significance of the observed connections. This criterion indicates that there is a 5% chance we could reject the null hypothesis of no correlation when it is true (Type I error). In this analysis, correlations with p-values less than 0.05 were considered statistically significant, implying strong evidence against the null hypothesis.
To emphasis the most significant connections discovered in our data, we selected highlighted correlations that exceeded a magnitude of 0.6, representing a moderately strong correlation.
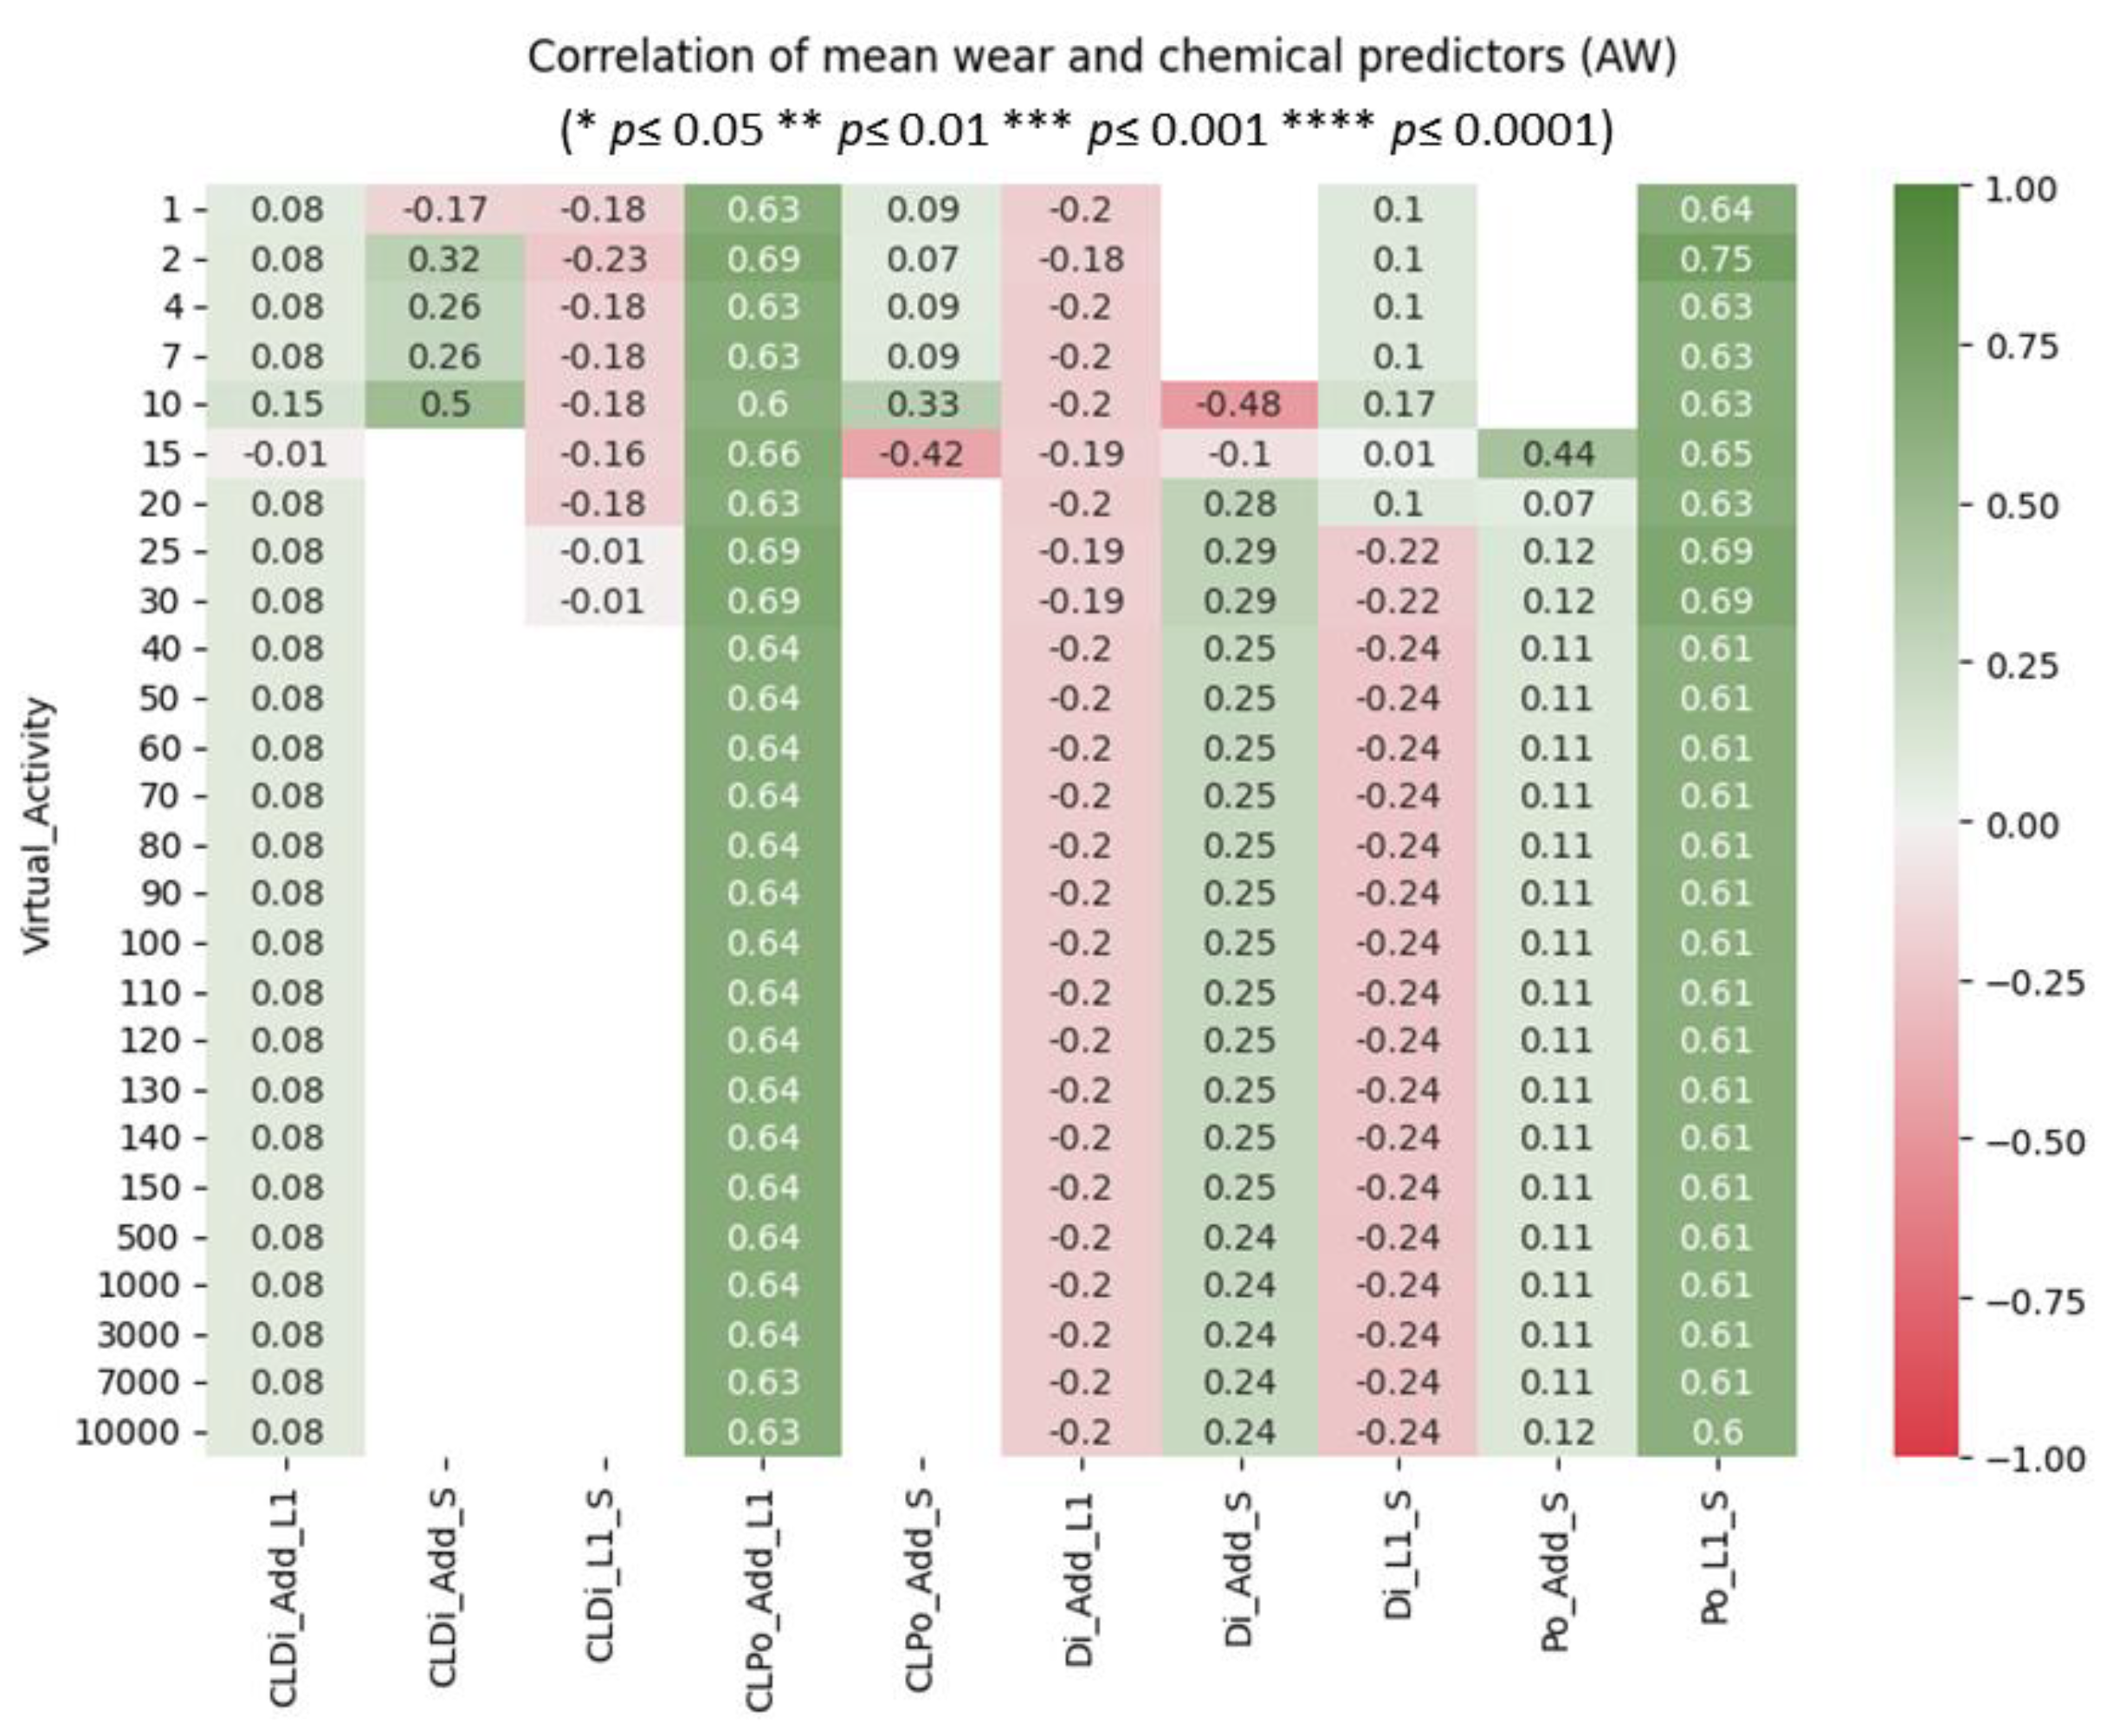
For activities ranging from 1 to 10, both CLPo_Add_L1 and Po_L1_S in AW indicate a positive and moderately strong correlation with average wear. Meanwhile, other chemical predictors display only weak correlations. However, they are not statistically significant (
p-value < 0.05) (
Figure 10). While the correlation coefficient indicates a relationship, the absence of statistical significance shows that conclusions should be drawn with caution. This means that while the correlation value suggests a relationship, the results are not strong enough (at the 5% significance level) to conclude that it is not simply caused by random variability in the data. AW’s limited dataset size may have contributed to the high
p-value.
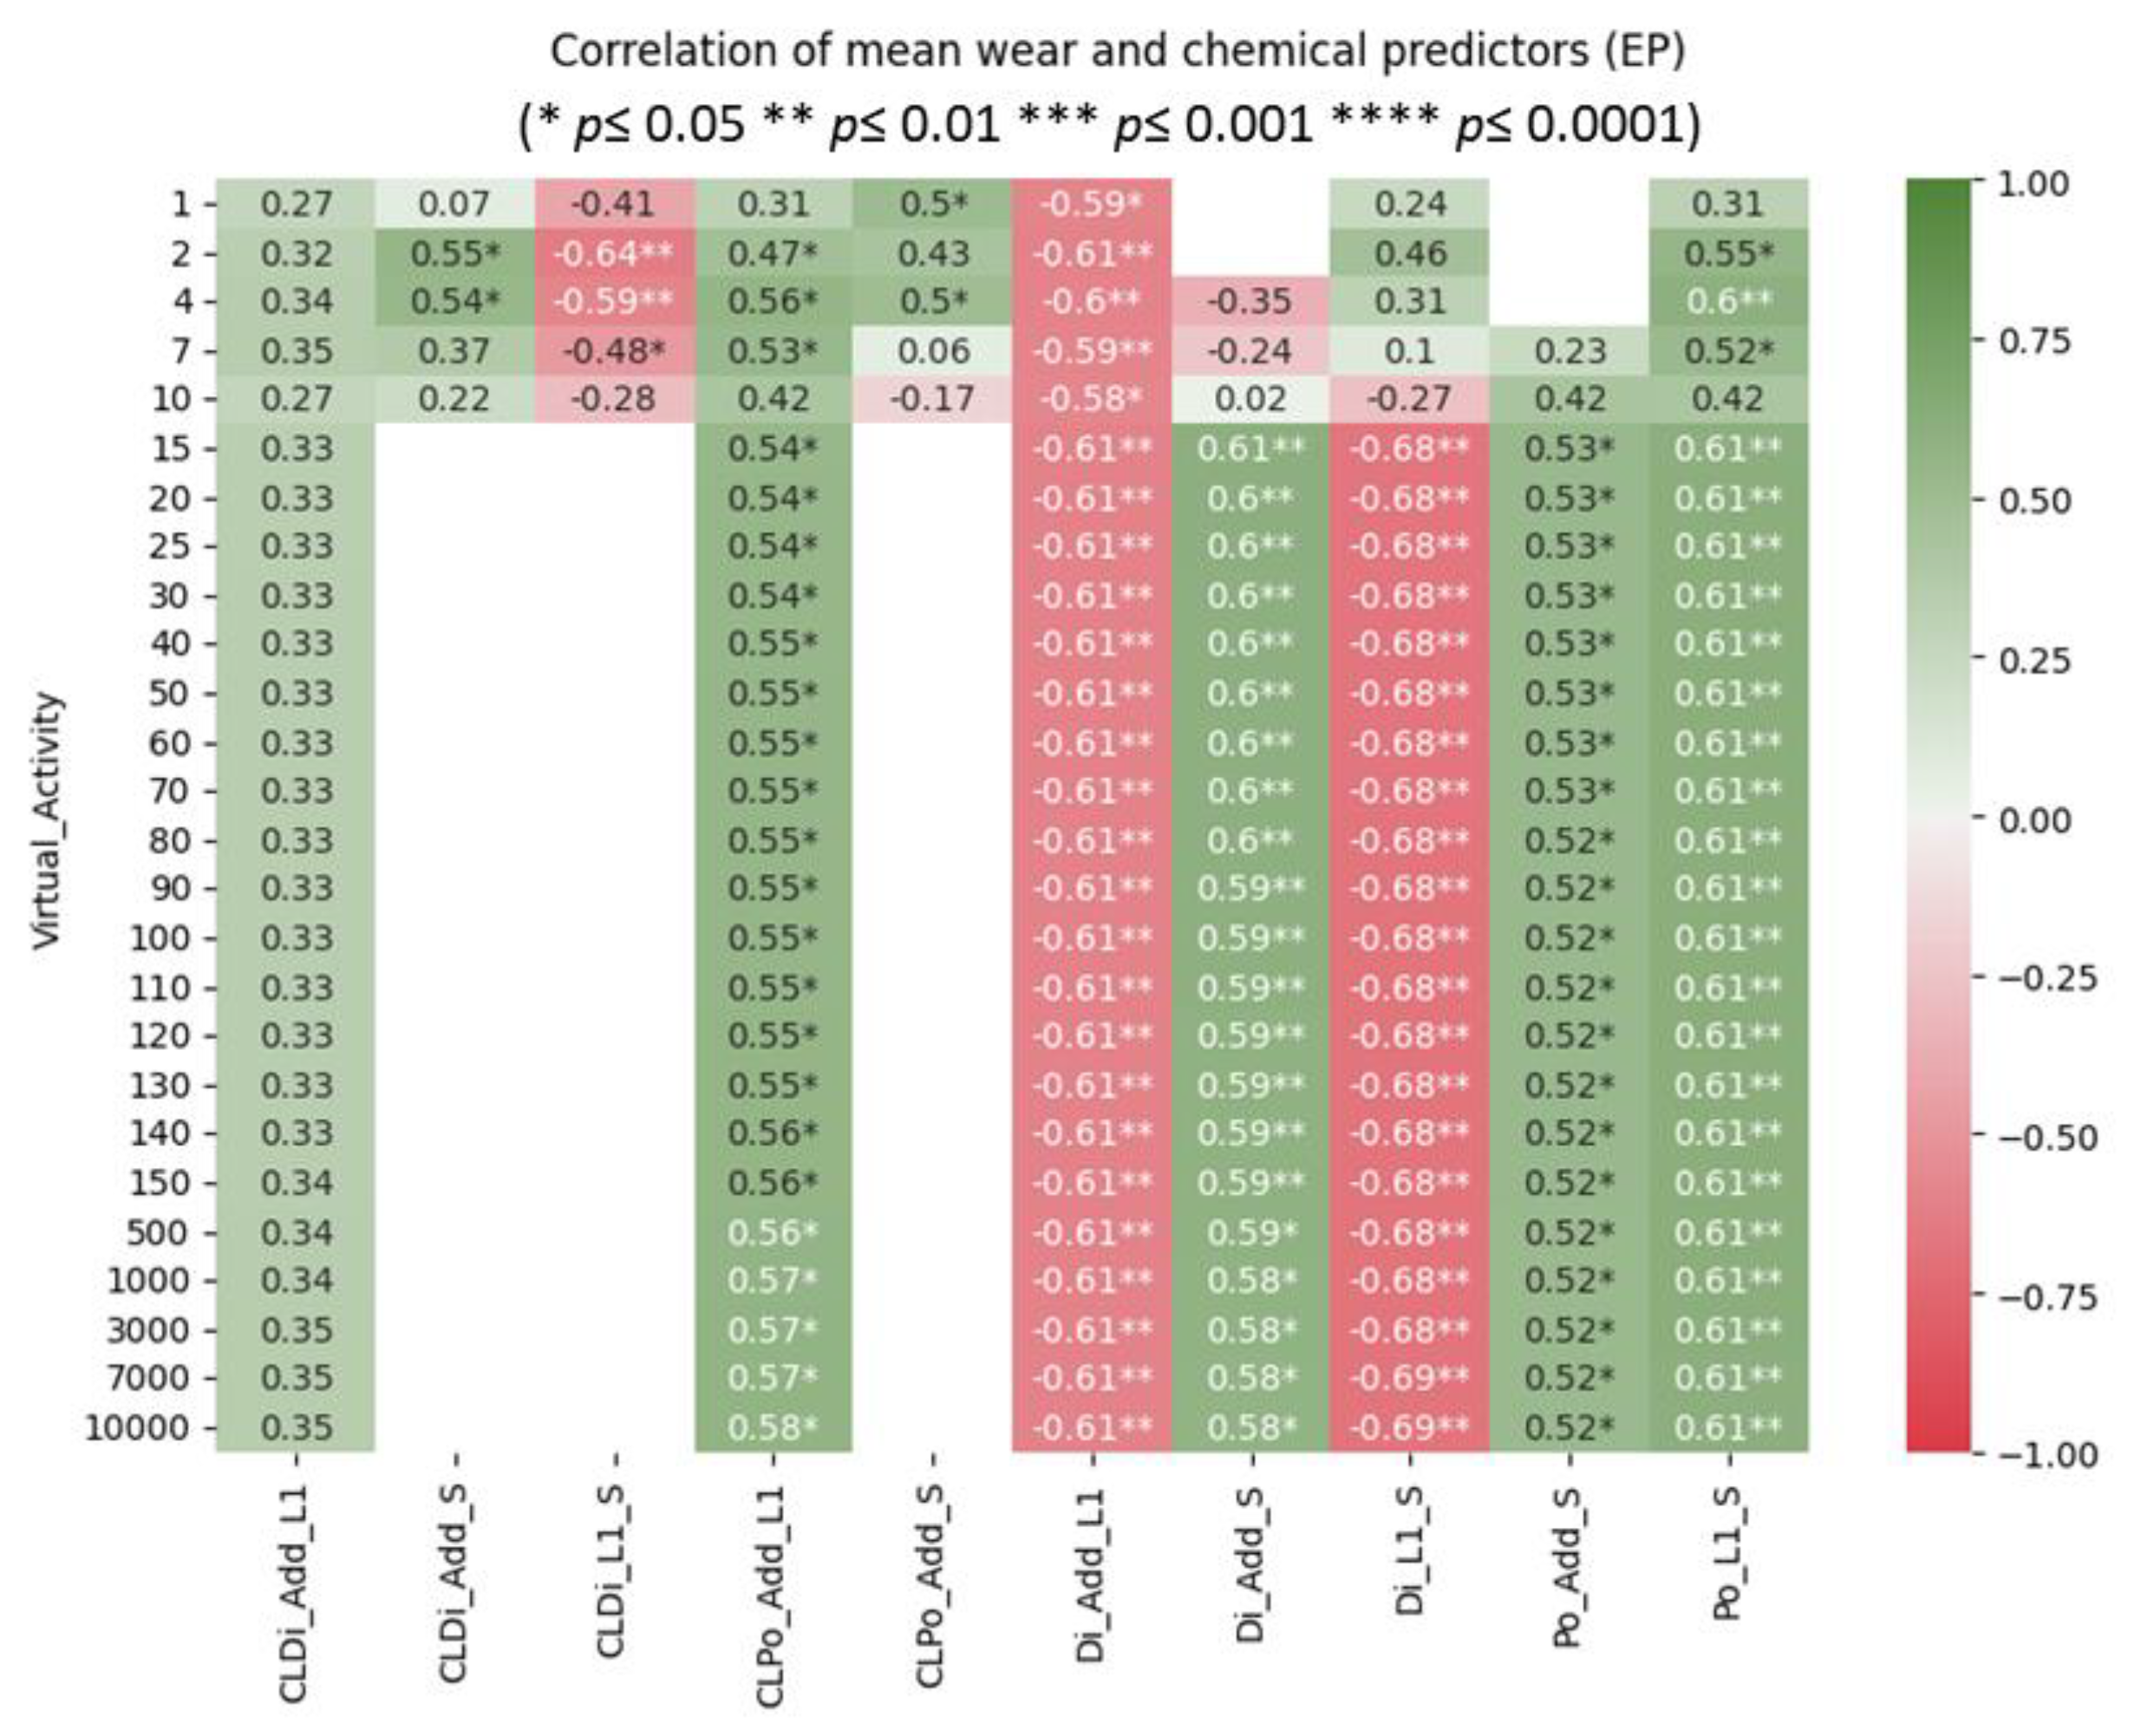
In the EP group, activity 4 is the only activity where Po_L1_S exhibits a positive and moderately strong relationship. Activity 2 shows that CLDi_L1_S and Di_Add_L1 have a negative, moderately strong correlation with average wear. A positive, moderately strong correlation is evident between average wear and both Di_Add_S (for activities 15–80) and Po_L1_S1 (for activities 4 and 15–10,000). Conversely, both Di_Add_L1 and Di_L1_S show a negative, moderately strong correlation between the average wear in activities 2, 4, and 15–10,000 and 15–10,000, respectively. Importantly, all these observed correlations are statistically significant (
Figure 11).
A positive relationship with average wear suggests that as the values of these chemical predictors increase, the average wear also tends to increase. On the other hand, a negative relationship with average wear suggests that, as these chemical predictors increase, the average wear tends to decrease.
Furthermore, the intermediate strength of these correlations shows that these relationships are notable but not exactly linear.
Finally, the fact that these correlations are statistically significant suggests that the observed relationships are not the result of random chance. The data show sufficient evidence against the null hypothesis.
4.3. Relationship of Average Wear and Mean of Cluster and Non-Cluster Chemical Predictors of EP and AW Lubricants:
In the EP category in
Figure 12, we computed the average for the attributes of both cluster and non-cluster chemical predictors for each chemical code. When plotted against their average wear, the following distinct patterns emerged:
The cluster and non-cluster groups scatter in contrasting directions, almost as if they mirror each other.
There is a dramatic shift in patterns from activity 1 to activity 15. Beyond that, from activity 20 to 10,000, the changes are subtle.
In activity 1, the non-cluster group stays on the left side of the graph. As activities progress, it moves gradually to the right. Conversely, the cluster group follows mirrored behaviour, initially starting on the right and moving leftward. The side switch can be observed from activity 7.
Low-wear and high-wear groups can be observed in both cluster and non-cluster groups where data points above the 100 mean wear are considered high wear and below this is low wear.
In the AW category in
Figure 13, we applied the same method as in EP and obtained the same pattern. However, there were some differences in AW.
There is a dramatic shift in patterns in activities 1, 10 and 15.
The side switch starts in activity 10, which is one activity after EP.
4.4. Relationship of Average Wear and Chemical Predictors of EP and AW Lubricants:
In
Figure 14, Di_Add_L1 exclusively resides in the low-wear zone and exhibits a negative correlation with average wear. By contrast, other chemical predictors are present in both the high- and low-wear zones. Notably, ‘CLDi_Add_S’ is observed in activities 1, 2, 4, and 7, while both ‘CLPo_Add_S’ and ‘CLDi_L1_S’ appear in activities 1, 2, 4, 7, and 10.
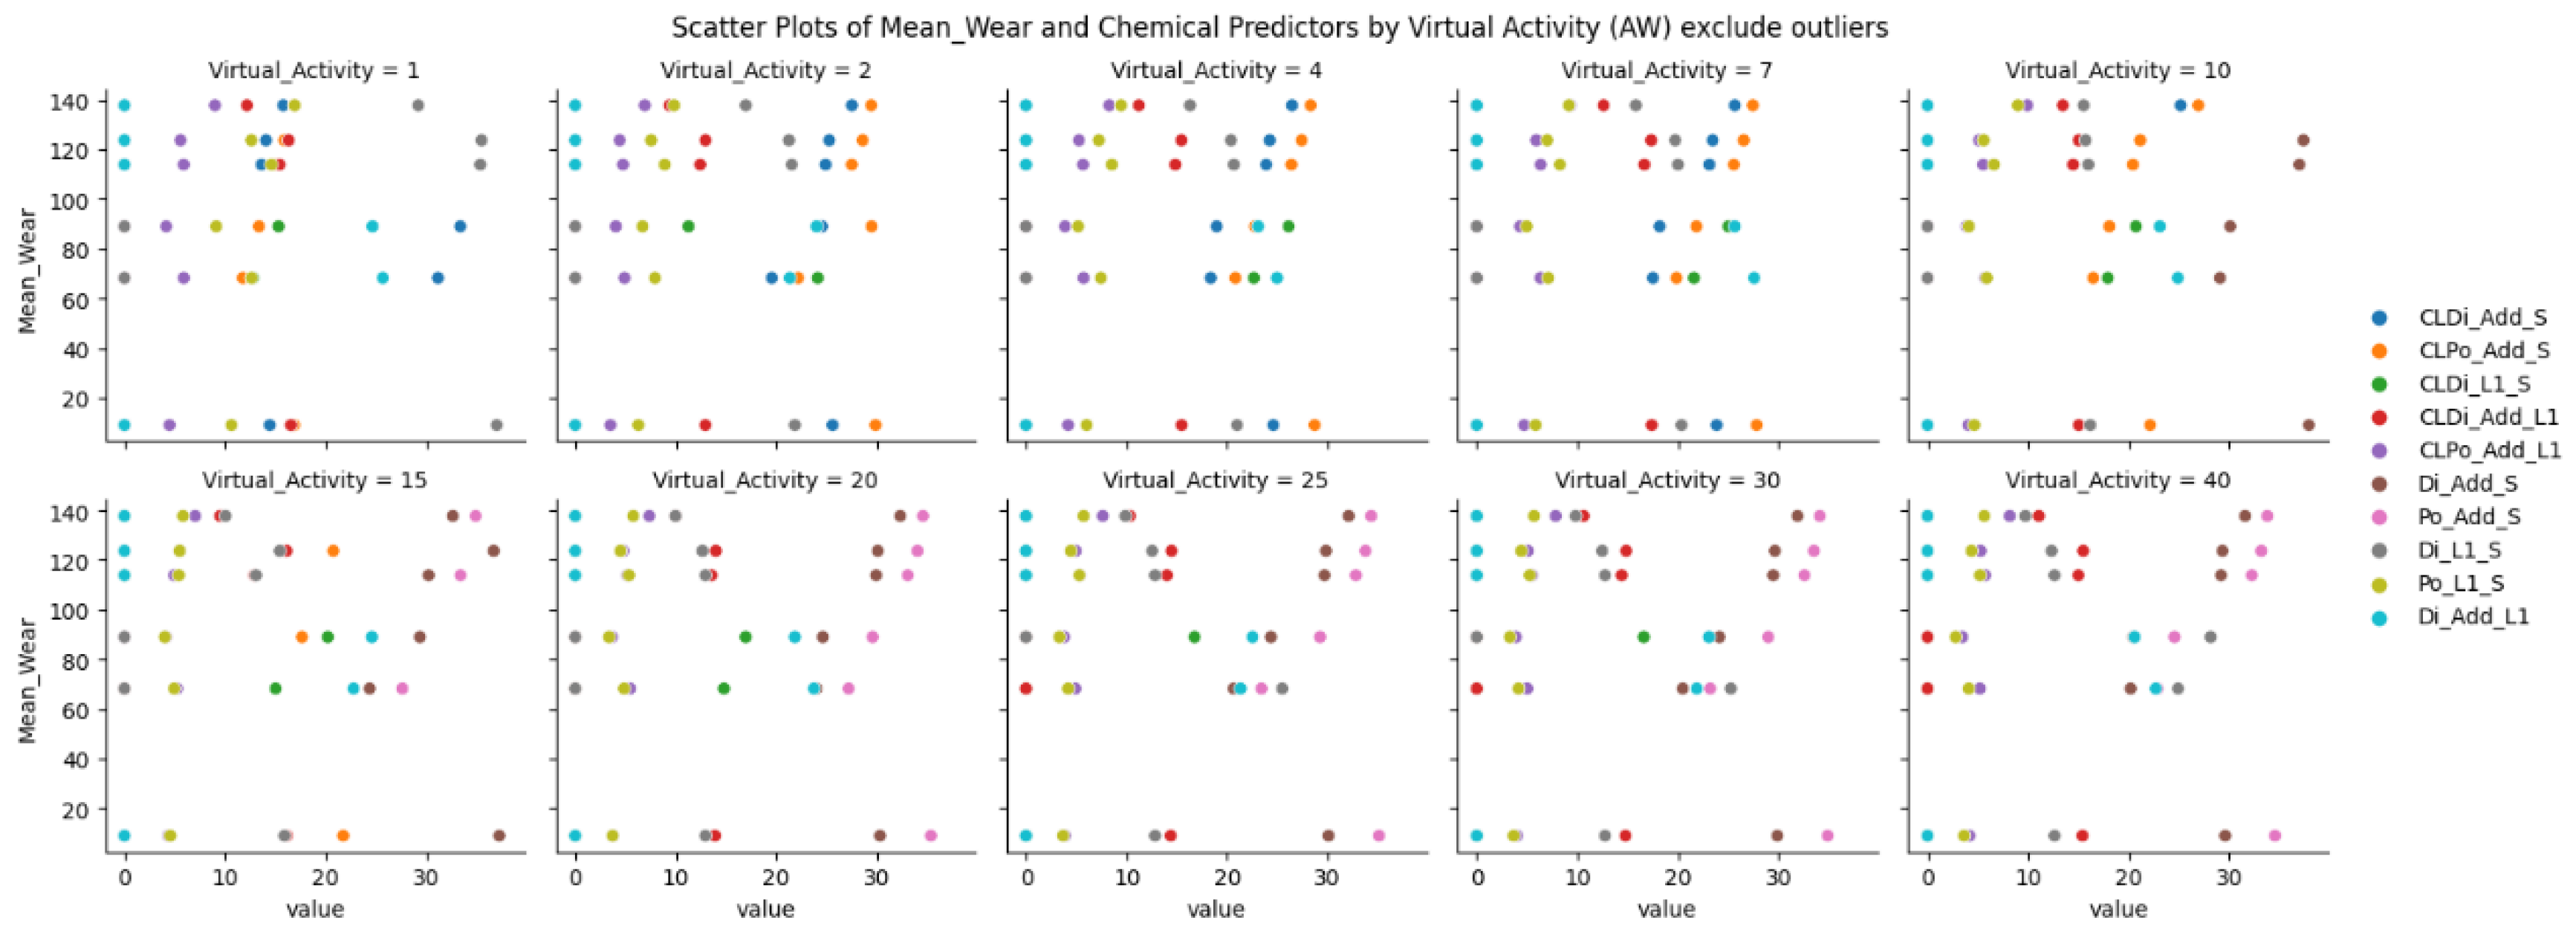
For AW (
Figure 15), Di_Add_L1 had a similar trend to EP, which exclusively resides in the low-wear zone with a negative relationship with the average wear except in activities 2,15,25, and 30, which show a positive relationship. Additionally, CLDi_Add_L1 only appears in the high-wear and AW group.
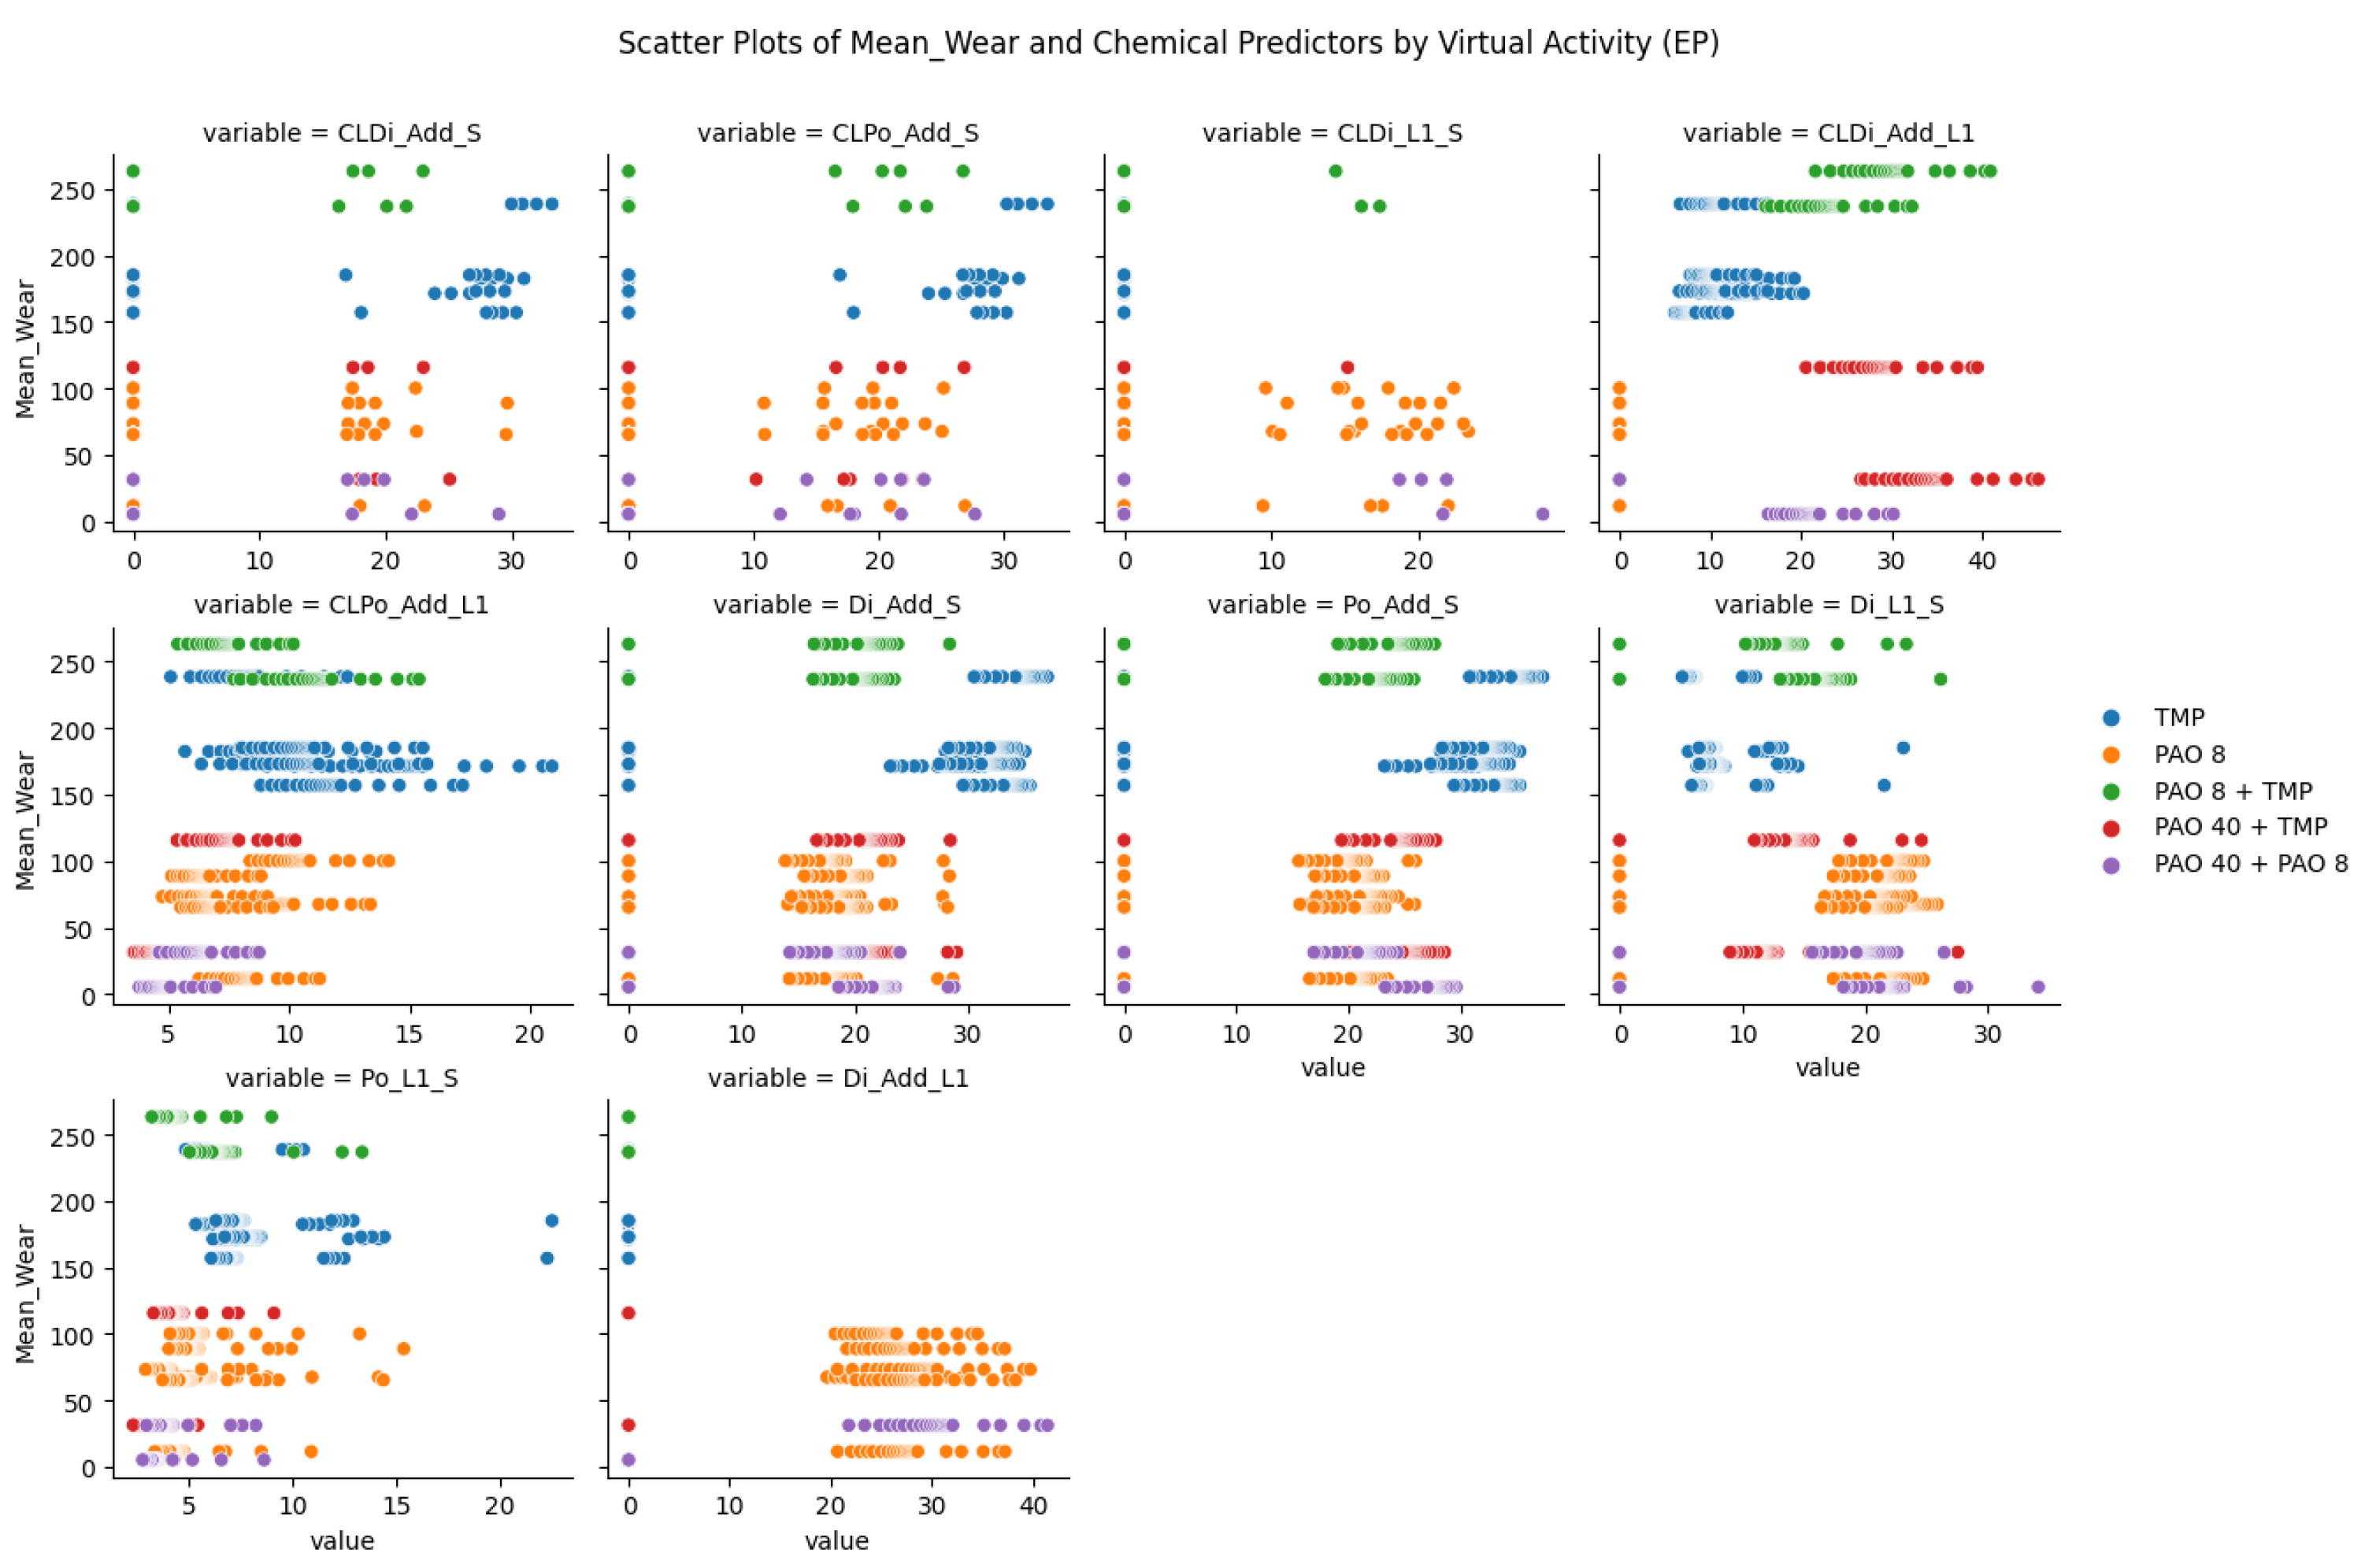
The differences in oil codes between the low- and high-wear groups are explained in
Figure 16. The blue and green oil codes, which stand for Trimethylolepropaneoctoate (TMP) and PAO8 + TMP, respectively, are most frequently found in the high-wear category. The presence of the orange, purple, and red oil codes, which stand for PAO8, PAO40 + PAO8, and PAO40 + TMP, respectively, distinguished the low-wear group by contrast. Notably, CLDi_L1_S is primarily found in the low-wear zone, while Di_Add_L1 is only present there. Nevertheless, both wear zones are covered by chemical predictors, such as CLDi_Add_S, CLPo_Add_S, CLDi_Add_L1, CLPo_Add_L1, Di_Add_S, Po_Add_S, Di_L1_S, and Po_L1_S.
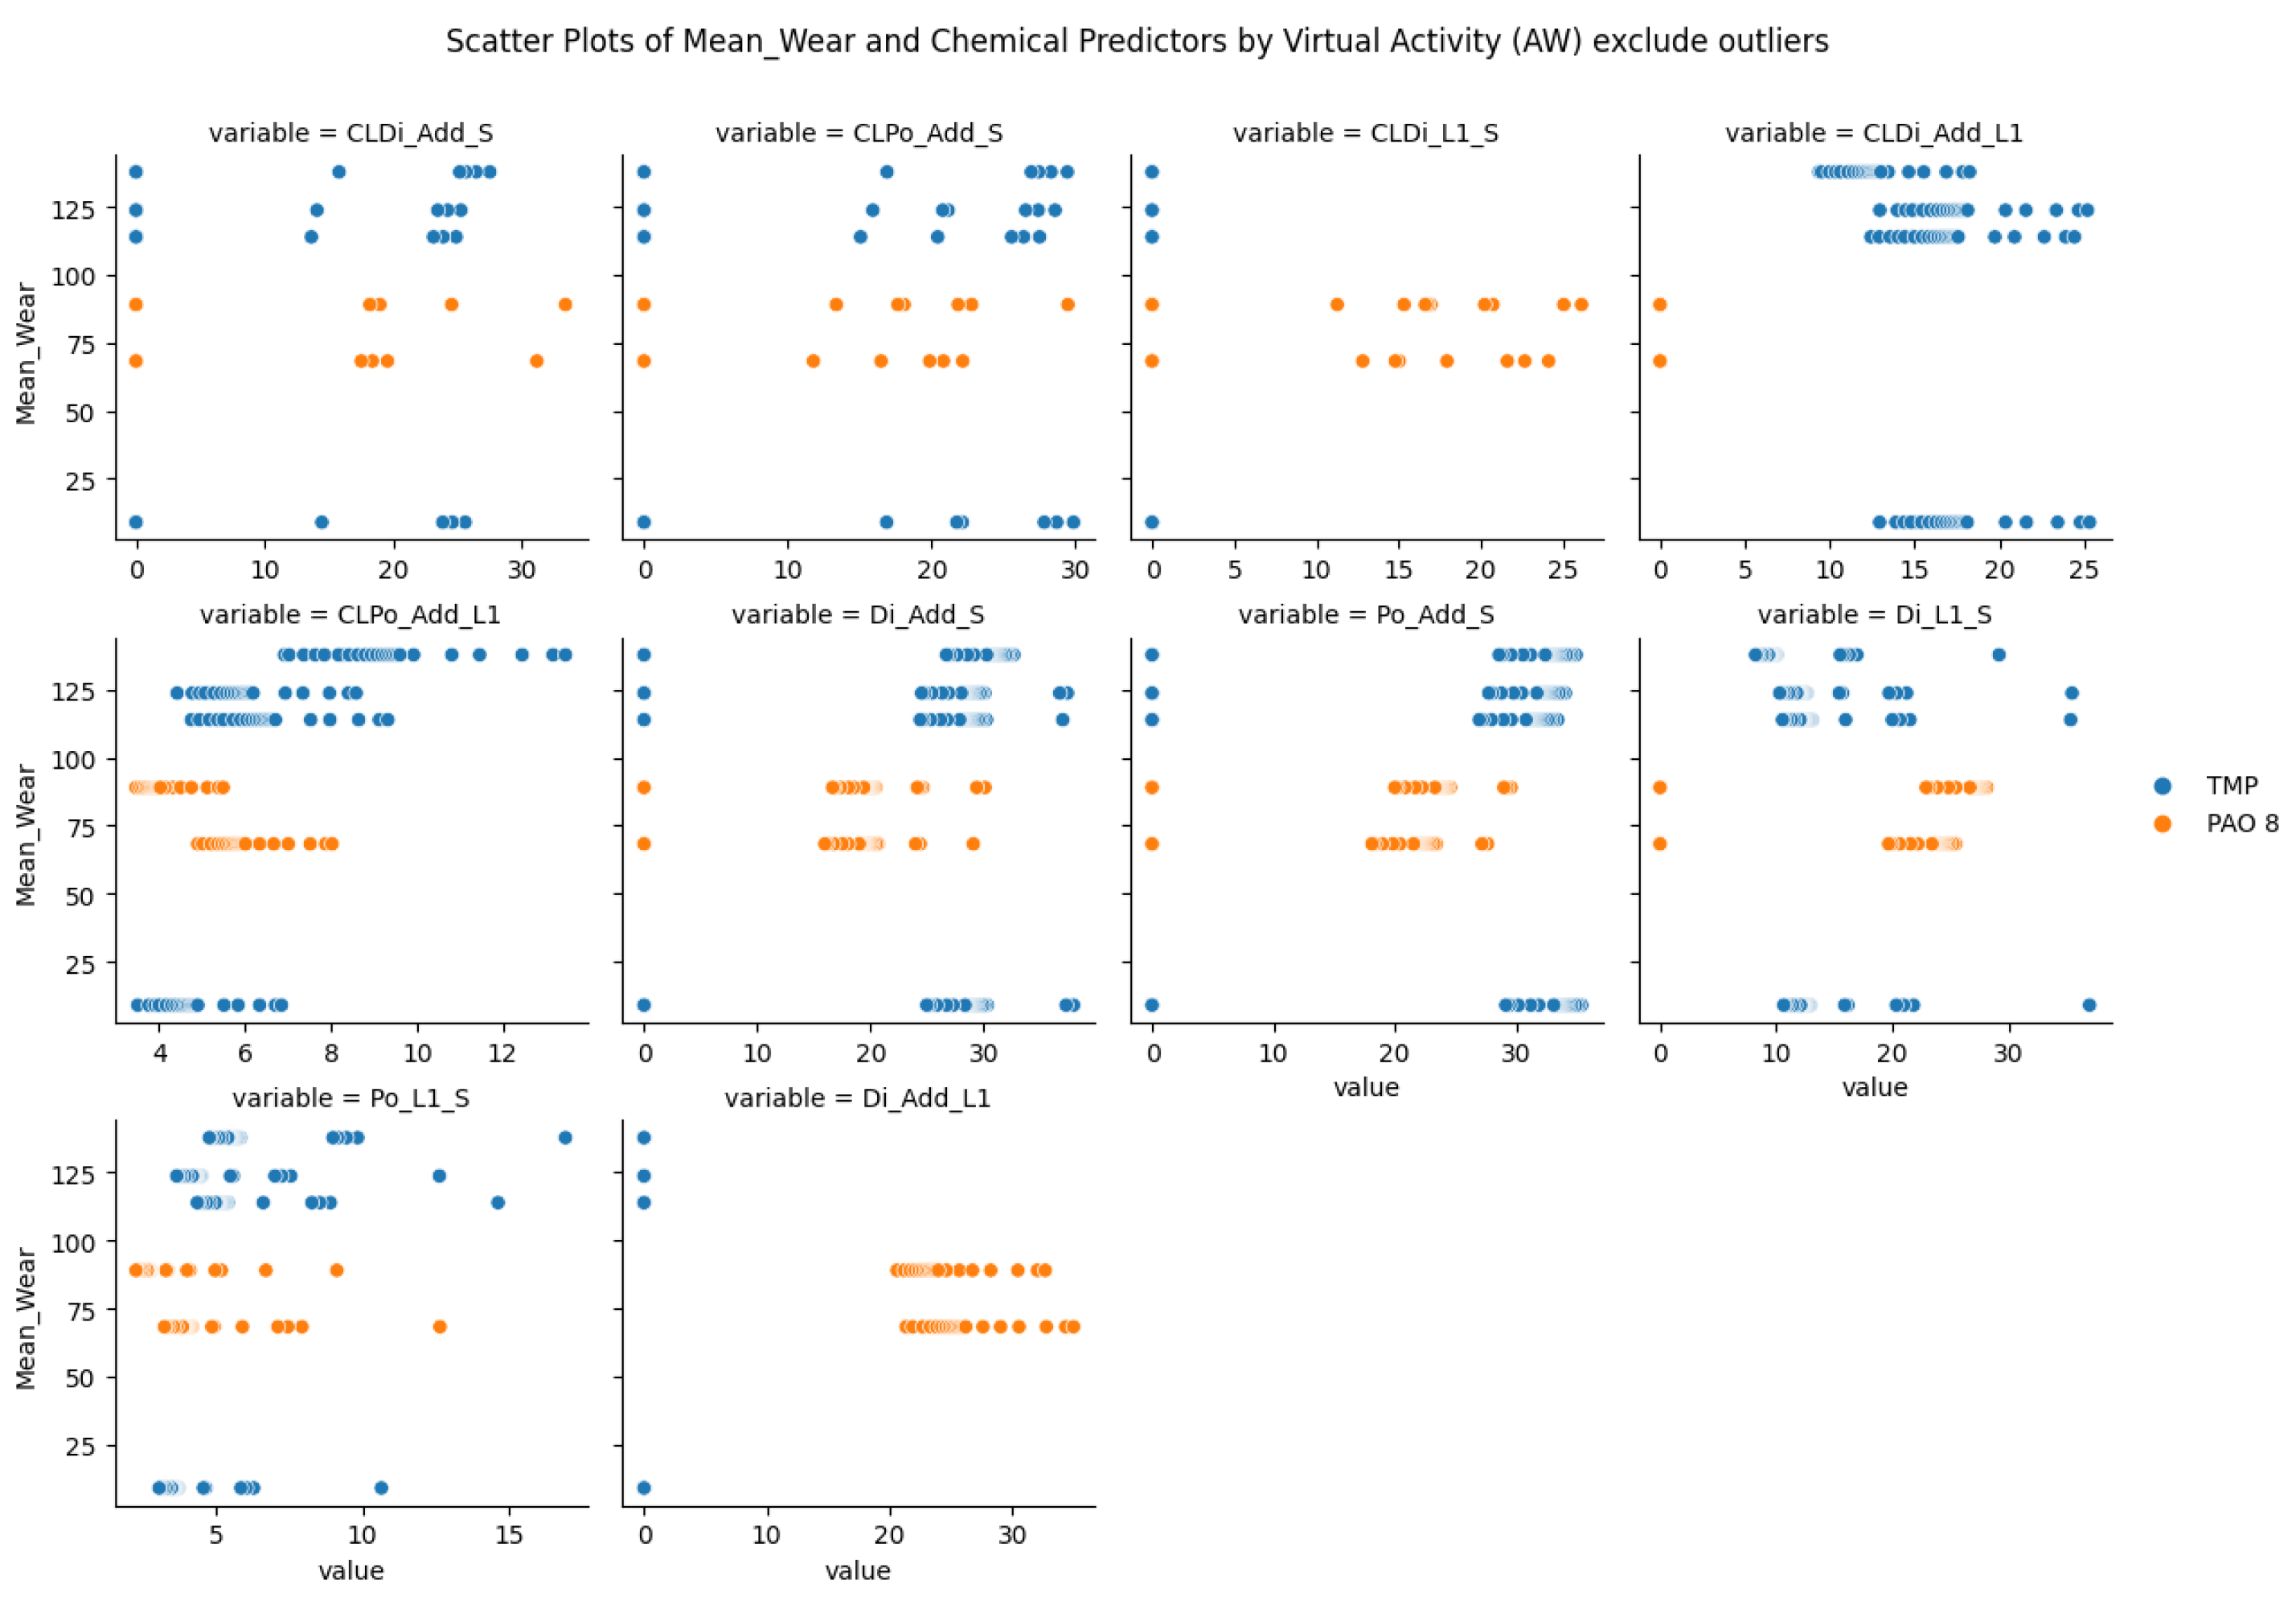
Figure 17 shows that for AW, TMP and PAO 8 are the only two oil codes in AW. In particular, the connection between Di_Add_L1 and CLDi_L1_S is constant and is only observed in the low-wear category. This suggests that increasing the predictor has no effect on the average wear; instead, it stays the same.
4.5. Relationship of Average Wear and Chemical Predictors of AW Lubricants with outliers:
On the other hand, if outliers are taken into account,
Figure 18 shows that Di_Add_L1 and CLDi_L1_S appear in the high-wear range with the outliers, although they still show the same consistent association.
The correlation coefficient for the AW group, as shown in
Figure 19, highlights a difference when outliers are taken into account: the correlations between average wear and chemical predictors for AW and EP shift in the reverse directions, but AW still shows no statistically significant result.
4.6. Logistics Regression to Observe Relationship of Wear Category and Chemical Predictors
As we classified the wear into low and high categories, we utilised g logistic regression to determine how chemical predictors influence these distinct wear levels. Notably, the logistic regression analysis is exclusively applied to the EP group, as AW did not yield statistically significant results.
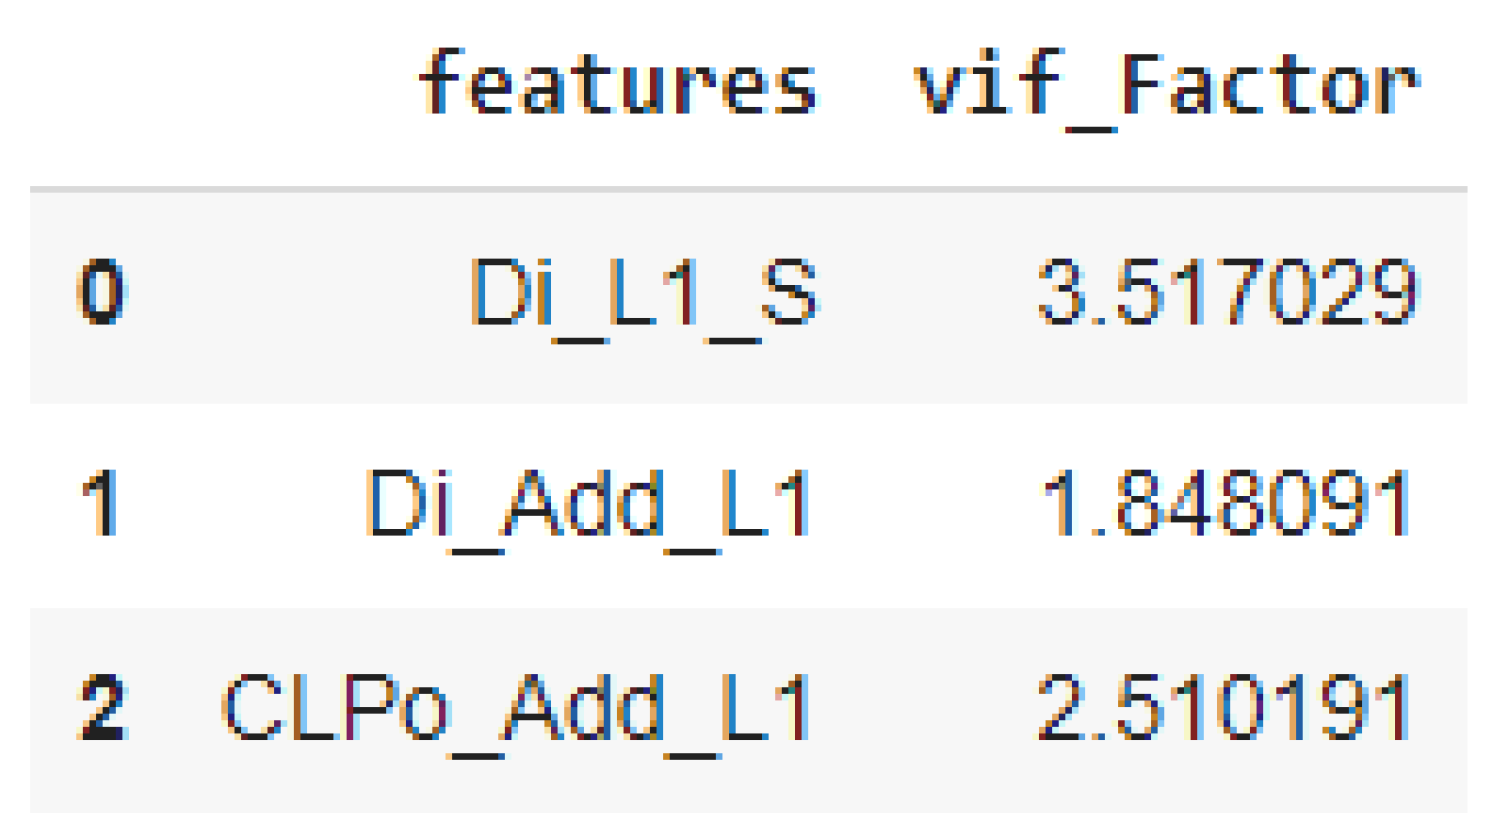
To address issues with multicollinearity, we chose to include only three predictors (CLPo_Add_L1, Di_L1_S, and Di_Add_L1) in our model. These three predictors were chosen due to their low variance inflation factors (VIFs) (
Figure 20), which indicates insignificant collinearity issues. In addition, their correlation coefficients with the wear category are the highest compared to those of the other variables (
Figure 21).
This logistic regression model shows that “CLPo_Add_L1” and “Di_Add_L1” have statistically significant positive and negative influences, respectively, on the probability of being in the high wear category, while “Di_L1_S” has a statistically significant negative influence (
Figure 22).
For each unit increase in “CLPo_Add_L1,” log-odds of being in the high wear category increased by 1.9086 units (p < 0.001). An increase in one unit in “Di_L1_S” was associated with a decrease of approximately 0.0725 units in log-odds of the high wear category (p < 0.05). Conversely, for every unit increase in “Di_Add_L1,” log-odds of being in the high wear category decreased by approximately 0.3294 units (p < 0.001).
These findings illuminate the relationships between these chemical predictors and wear patterns. The statistically significant coefficients indicate that “CLPo_Add_L1” positively influences high wear, whereas “Di_L1_S” and “Di_Add_L1” negatively influence high wear in EP lubricants. “CLPo_Add_L1” had a statistically significant positive coefficient, showing that higher quantities of this chemical predictor are related to an increased chance of high wear in EP lubricants. By contrast, the predictors “Di_L1_S” and “Di_Add_L1” had statistically significant negative coefficients, indicating that higher quantities of these chemical predictors are associated with a reduced likelihood of high wear.
In conclusion, our logistic regression analysis reveals the significant influence of these chemical predictors on wear categories, casting light on the factors that contribute to wear patterns in our study.
4.7. Other Significant Findings
The AW group, without outliers, only shows a significant correlation in the wear roller. CLPo_Add_L1 shows a strong positive relationship with the wear roller for all activities. By contrast, ‘Po_L1_S’ demonstrates this strength of association only in activities 1–15, whereas ‘CLDi_Add_S’ demonstrates a similar strength of association only in activity 10 (
Figure 23).
Given the high correlation observed with CLPo_Add_L1, implying a strong linear relationship, we proceeded to conduct a linear regression analysis with this predictor (see
Figure 24). Additionally, we included Po_L1_S as it contributed to an improved R-squared value. The results of this regression analysis yielded an adjusted R-squared of 0.67. This figure indicates that the selected independent variables in the model, such as “CLPo_Add_L1” and “Po_L1_S,” explain approximately 66% of the variation in the dependent variable, “Wear_Roller.” Notably, some prospective predictors were excluded from the model on purpose. Their lack of statistically significant relationships with the dependent variable and their inability to enhance the adjusted R-squared value led to this conclusion.
Interpreting the coefficients, for every one unit of change in CLPo_Add_L1, there was an estimated change of 17.0164 units in the wear roller. Similarly, a one-unit change in Po_L1_S corresponded to an estimated change of 4.33 units in the wear roller. These findings illuminate the impact of both CLPo_Add_L1 and Po_L1_S on the wear roller in the AW group.
5. Conclusions
Commonly accepted hypotheses in tribology state that, in the case of boundary lubrication, functional additives prevent direct metal–metal contact in the contact zone of the machinery element. Traditionally, boundary lubrication is associated with the relation of the film height in the contact toward the height of the asperities. The film height is calculated traditionally using the theory of elastohydrodynamics (EHL), stating that the viscosity (e.g., film thickness) locally present in the contact zone is the prime predictor defining a boundary situation. Classical EHL states that viscosity, as the relevant predictor, transforms using the local energy impact in the contact zone given by temperature, temperature flashes, and shear impact, both leading to a decay in the viscosity. By contrast, the pressure assumed to be locally present in the contact zone compresses the lubricant, which is associated with an increase in viscosity in the lubricant by means of a viscosity-pressure coefficient. A lot of computational effort is carried out in order to obtain an insight into these processes and the structure–property relationship given by the chemical structure of the lubricant and their ingredients. However, up until now, no specific rules have been seen regarding how wear processes are assumed to prevent, but in some cases, are also found to promote and are predictable. The transit of EHL toward thin film lubrication (TFL) and tribocatalysis (TC) is accompanied by various physical transitions within the lubricant, notified as their “inner” structure herein. The exposure to the impact of tribological stress causes the lubricant to transform its spatial solute structure before it starts to react chemically. These structural changes are described within this paper by calculating the chemical potential, differentiated in the dipolar and induced dipolar (polarisability) activity appearing at the surface (S) and in the solvent (L). Solutes in solvents and at surfaces may create clusters under stress in order to dissipate it. This study permuted all different structural rearrangements of the lubricants in relation to imposed external activity. This activity could arise from temperature, pressure, and surfaces becoming active due to the tribological impact. The study here applies the assumption comprising the formation of “inner” structures, clusters (CL), and non-clusters to a variety of lubricants with well-known chemical structures and their ability to prevent or induce wear using the bearing test rig FE8 (DIN 51819). The lubricants were divided into two different base oils (Poly-a-Olefine (PAO) and an Ester (Trimethylpropane Octoate (TMP) and were placed under different extreme pressure (EP) and anti-wear (AW) additives. The wear within this test is scattered over the single constituents, e.g., cage, rollers, and washer. For all the different lubricants, the “inner” structure was calculated as dipolar and induced dipolar activity and their likelihood to form clusters at the surface and within the base oil. A detailed statistical investigation, searching for relations of the “inner” structure with individuals, but also the average wear led to the following results:
The base oil, rather than the additives, significantly guides the appearance of high or low wear.
The lubricant predictors change abruptly due to the increase in the surface activity. This leads to the conclusion that determining the activity of a lubricant during any test requires a careful definition of how the load capacity of the component is related to the load capacity of the lubricant. This is to say, the result of any load-related tribological test may abruptly change under different test conditions.
The encapsulation of induced dipole moments (clustered polarisability) and additives in a solvent are relevant as clusters promote significant wear. We are interpreting this result by the fact that a wear process is highly transient by exchanging electrons, charged and uncharged particles. These transient exchange processes are scavenged if the lubricant uptakes them via charge dissipation due to its polarisation ability. If the “inner” structure of the lubricant clusters the polarisability within the solvent, this functionality is blocked, and the wear process is not dissipated in the lubricant.
The presence of outliers in the AW dataset, combined with its small size, suggests the unfavourable effect on statistical metrics in smaller datasets, thus misleading the interpretation of the results. The situation emphasises the importance of dataset size and quality in tribological research. It raises the delicate problem of how to approach outliers, particularly in smaller datasets, where their influence can be clearer. The topic for discussion is whether outliers should be thoroughly accounted for in order to maintain the dataset’s accuracy or whether they should be set aside because they may represent unique but real-world conditions. This opens the door to a broader discussion about improving data-gathering procedures in tribology. Future research could focus on increasing the AW dataset to either confirm or refine the current study’s conclusions while carefully examining the influence of outliers in the analysis.
6. Summary
The transition from EHL toward TFL and TC requires a detailed understanding of how lubricants uptake the exposition to contact stress. Apart from viscosity-related parameters, the “inner” structure of a lubricant comes into the picture. Despite the huge variety of chemicals, the simple calculation of the dipolar and induced dipolar structure leads to powerful (e.g., robust) predictors for wear under thin film lubrication (TFL) conditions. Despite the fact that the chemical structures had to be assumed due to their technical grade, the prediction is seemingly very robust if the extreme pressure additives are taken. This insight is even more important as new lubricants with respect to the prediction of wear have to be found for E-mobility and ecology purposes.


