Communication

Traction Properties of Aerospace Lubricant under Low-Temperature Micro-Oil Droplet Supply Conditions

1
Department of Mechanical Engineering, Tsinghua University, Beijing 100084, China
2
Luoyang Bearing Research Institute Co., Ltd., Luoyang 471039, China
3
School of Mechatronic Engineering, Henan University of Science and Technology, Luoyang 471003, China
*
Author to whom correspondence should be addressed.
Lubricants 2023, 11(12), 528; https://doi.org/10.3390/lubricants11120528
Submission received: 3 September 2023 / Revised: 20 November 2023 / Accepted: 29 November 2023 / Published: 13 December 2023

Abstract

:
Aerospace bearings need to withstand the low-temperature environment of space, which will cause changes in the internal lubrication state of the bearings. This article aims to assess the traction properties of aerospace lubricants under low-temperature micro-oil droplet (hereinafter referred to as ‘micro-oil’) supply conditions, and provide a lubrication theoretical basis for studying the motion characteristics of aerospace bearings in a low-temperature environment. An experimental study on the low-temperature micro-oil traction properties of high-speed bearing lubricants was conducted on a specially designed aerospace bearing lubricant traction characteristic tester. A modified Herschel–Bulkley model (modified H–B model) was presented based on test data analysis, and the fitting results were compared with the Tevaarwerk–Johnson model (T–J model). The findings demonstrated that the traction coefficient of this lubricant decreased at a higher load and entrainment velocity, and decreased with a decreasing inlet oil temperature from 0 °C to −50 °C. The modified H–B model accurately fitted the test data and was suitable for the engineering traction coefficient calculation of lubricants and high viscosities at low temperatures. This paper can provide fundamental information for analyzing aerospace bearing friction torque variation.

1. Introduction

Bearing lubrication failure is a leading cause of the poor performance of aeronautical motion mechanisms [1]. Astronautical bearings typically operate in environments where different temperatures affect the rheological characteristics of the lubricants, causing sudden variations in the tribological behavior. Therefore, examining the tribological lubricant properties is crucial to effectively regulate the friction torque in aeronautical bearings [2].
Recent studies have investigated various lubricants via traction tests and relevant rheological models [3,4]. Su [5] tested complex grease on a self-made test bed by simulating in medium- and low-speed and heavy- and light-load conditions. Zhang [6] carried out friction torque test for bearings under a liquid nitrogen environment, studied the dynamic friction torque of solid lubricated bearings under low speed conditions, and discussed and analyzed the main factors causing the increase in bearing friction torque, combined with theoretical calculation. Gentle [7,8] took into account the skidding state of high-speed ball bearings under oil immersion and spent oil lubrication, and the test results showed that an appropriate degree of spent oil could improve the overall skidding degree of bearings, possibly because of the reduction in lubricating oil drag resistance. Liu [9] assessed the influence of low temperatures on oil sample viscosity and lubricant performance. Wang and Cheng [10,11,12] tested 4129 lubricants at high temperatures and 4116 at high and low temperatures to examine the factors impacting their traction properties. Zhang [13] obtained and comparatively analyzed the viscosity-temperature curves of the different oils and their viscosity–temperature characteristics. Based on the experimental data, the viscosity–temperature models of the lubricating oils are determined. Li [14] examined the impact of micro-oil lubrication on the lubrication state of the two pairs of porous PI disk–ball–pins utilized to model cage rolling element–groove friction in bearings. In order to make precision instrument bearings operate in a wide ambient temperature range of −70 °C~+70 °C to maintain low friction torque and have better sensitivity, Shen [15] developed a new high-quality lubricating oil with good high- and low-temperature performance, and analyzed the influence of different materials on the physical and chemical properties of the lubricating oil, lubrication performance tests, and the high- and low-temperature start-up performance. Shen [16] established a finite element simulation model of the gas–liquid two-phase flow between the rings of the angular contact ball bearings, and elaborated the atomization mechanism of the lubricating oil in the bearing chamber by stratifying the balls. Liang [17] constructed a bearing model to investigate the lubricant film distribution and the impact of the cage shape and surface properties on the lubrication. Gao [18] proposed a thermal fluid–structure coupling dynamic model for the slippage between the ball bearing and raceway and the resulting problems. The thermal deformation of the bearing components, the temperature rise caused by slippage, the lubricating oil mixing model in the oil supply area, the hydrodynamic pressure model between the cage and the guide ring, as well as the collision force and tangential friction acting on the ball and the cage, are introduced into the model. The influence of static and dynamic parameters such as the slippage degree of the cage and ball, temperature rise distribution of the shaft–bearing–bearing assembly, and thermoelastic deformation are also considered. Zhang [19] constructed a lubrication model and friction torque model for expressing the start-up process of the cryogenic rolling bearing, and the fluid film pressure distribution and the minimum film thickness for the different rolling elements are obtained under the specific operating conditions. The start-up friction torque of a specific cryogenic rolling bearing under different loads and speeds is calculated. Qian [20] studied the ball–disk contact to examine the flow properties of a polyolefin lubricant in micro-oil supply conditions. The lubricant was supplied to the friction pairs as micro-droplets in oil–air lubrication conditions. Karthikeyan [21] focused on numerical calculations of the grease film thickness and the pressure distribution of thermoelastohydrodynamics based on the Herschel–Bulkley model. Several studies [22,23] used micro-droplet diffusion experiments to establish micro-droplet-fed elastomeric lubrication models and assess the impact of the operational conditions. In the late operation phase, aerospace high-speed bearings typically work in micro-oil or even oil starvation lubrication conditions, causing extreme temperature differences, with the lowest even reaching −100 °C. Although several studies focus on tractional lubricant properties at high and ambient temperatures, minimal research is available involving the tribological features at low temperatures.
Therefore, a specially designed tester assesses the low-temperature micro-oil traction properties of a high-speed aerospace bearing lubricant. The results can provide fundamental information for analyzing aerospace bearing friction torque variation.

2. Experimental Details

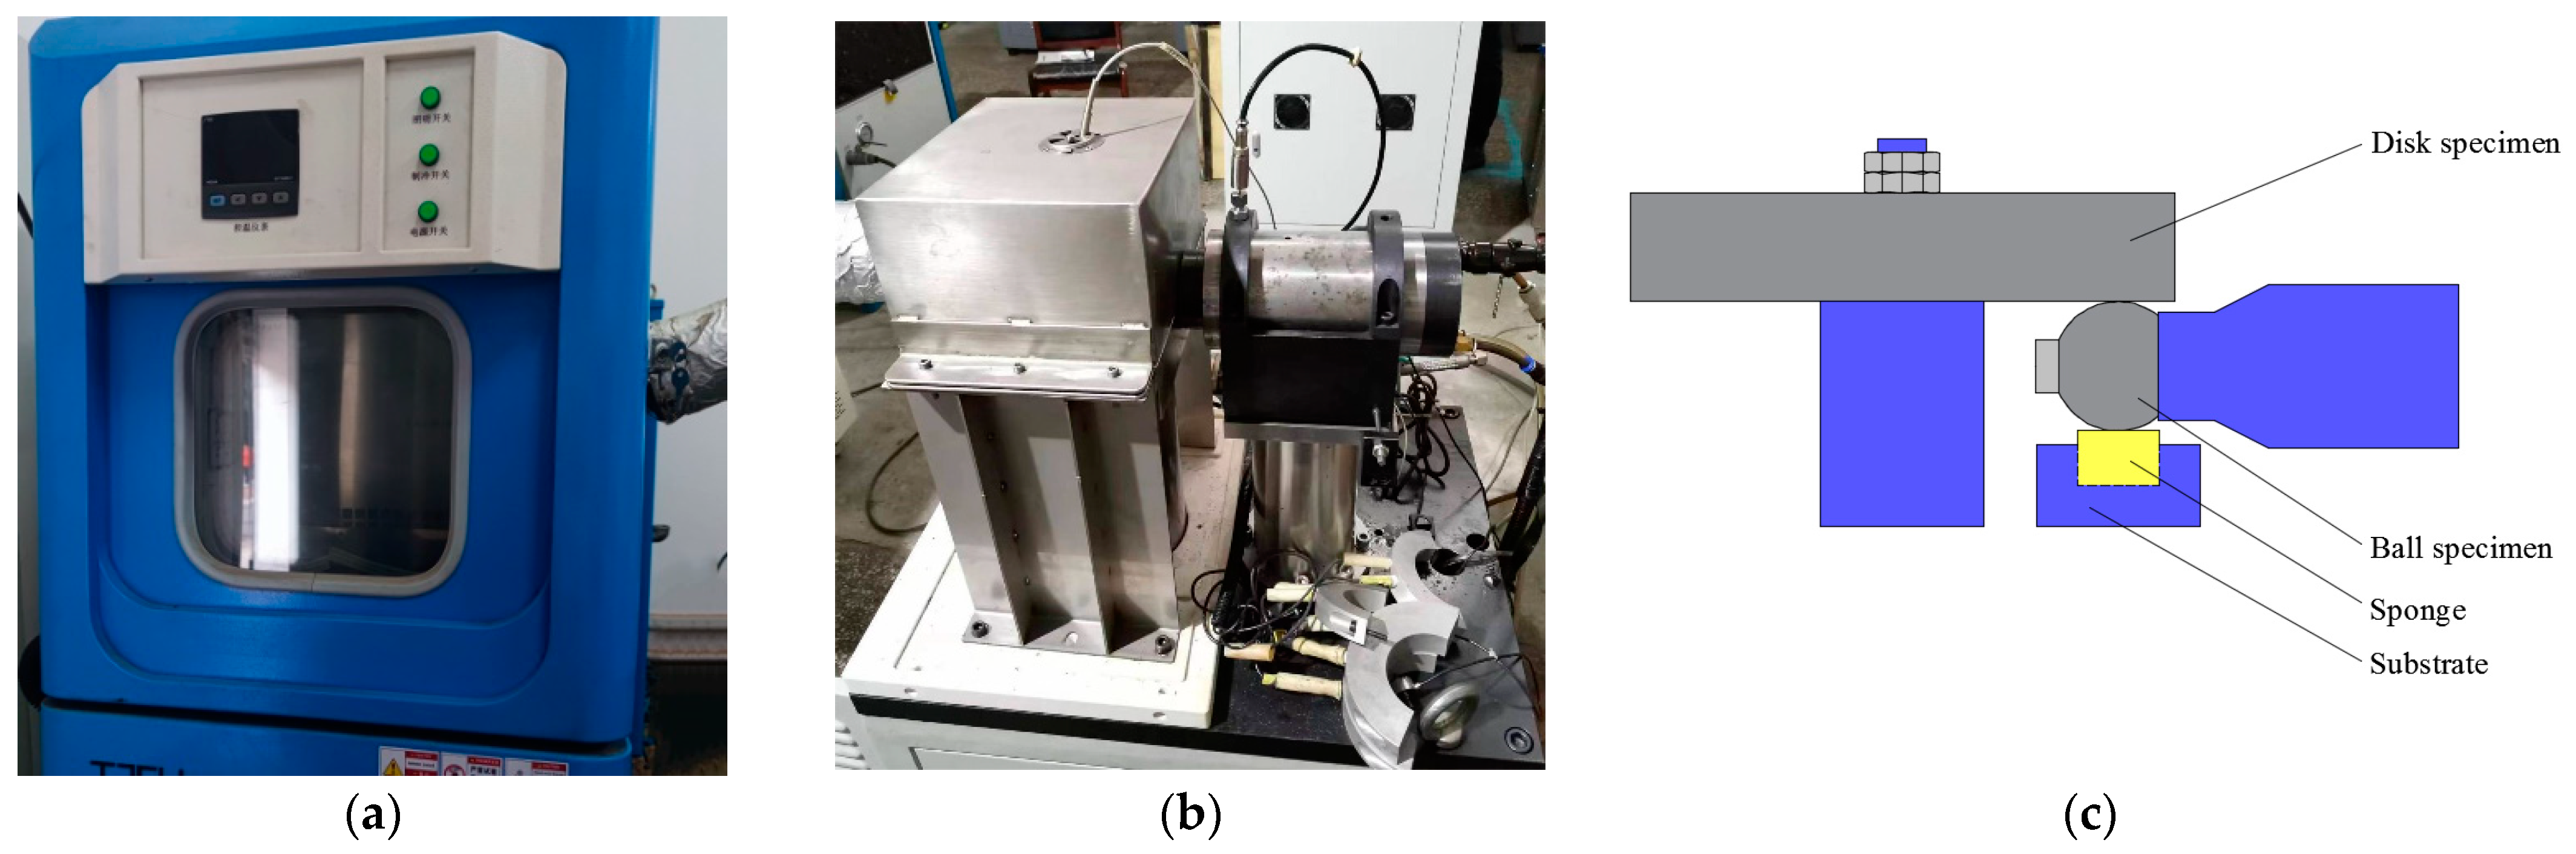
2.1. Traction Characteristic Tester

Test oil was dripped onto a sponge in the self-designed traction characteristic tester in Figure 1 [24,25]. The amount of oil was controlled at around 40 mg, which was appropriate to only moisten the sponge, which was affixed to the substrate beneath the ball specimen, coming into contact with the ball. The self-pressurized tank supplied the liquid nitrogen, which was transformed into low-temperature nitrogen gas and sent into the test area via a temperature control device for cooling, while the cooling speed was very fast. To determine the temperature of the test environment, temperature sensors were positioned above the test area.
The entrainment velocity u = ( u 1 + u 2 ) / 2 and slip–roll ratio s = ( u 1 u 2 ) / u were defined. Next, the traction force F values were obtained for different slip–roll ratios (by changing the speed of the ball and disk) at specific loads w, entrainment velocities u, and inlet oil temperatures t. The variation curve of the traction coefficient μ with the slip–roll ratio s was acquired using the test.

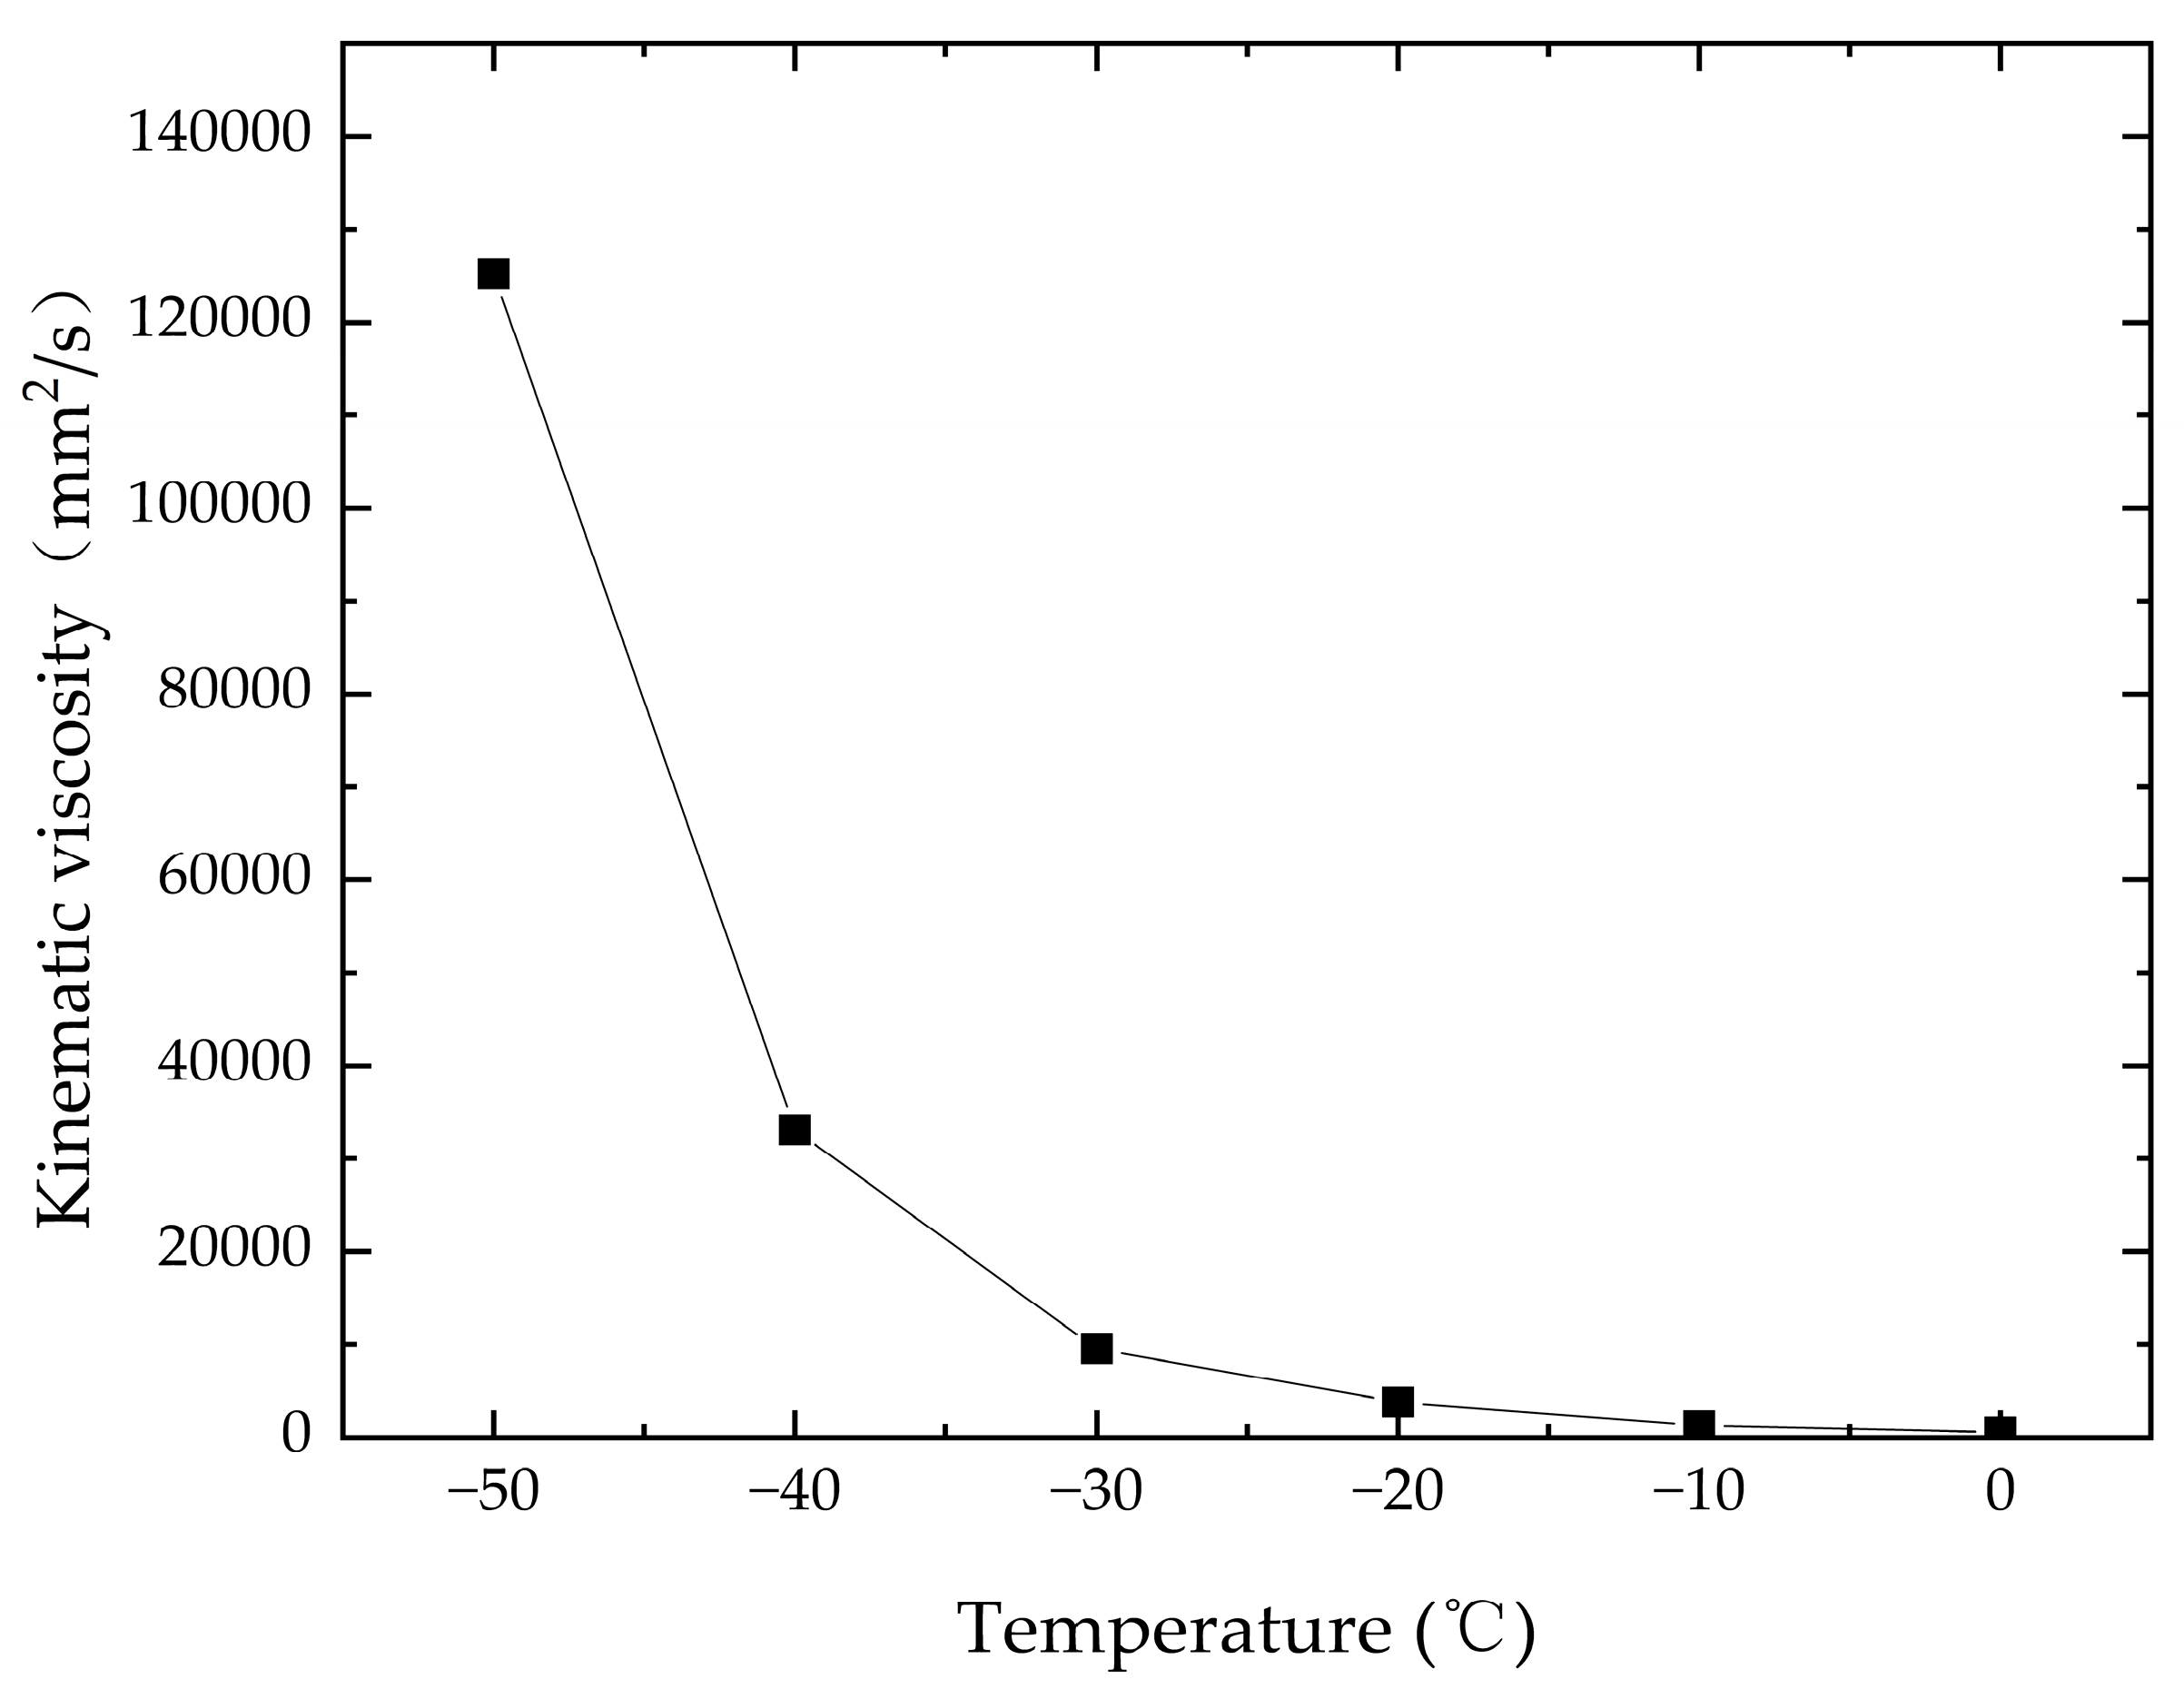
2.2. Lubricant Properties

Table 1 shows the essential properties of a specific lubricant mostly used to lubricate precise bearings like aerospace gyroscopes and momentum wheels. As shown in Figure 2, the kinematic viscosity [26] of the lubricant increased significantly as the temperature decreased. At −15 °C to 20 °C, the lubricant behaves very clearly in the microscopic observation. The white granular flocculent gradually increased as the temperature decreased from −15 °C to −50 °C, reducing the fluidity and almost reaching a grease state at −50 °C. This behavior is shown in Figure 3.

2.3. Experimental Conditions

The operational test parameters included entrainment velocities u of 7 m/s, 8 m/s, 9 m/s, and 10 m/s, nominal loads w of 38 N, 95 N, 189 N, and 309 N, maximum Hertzian stress values p0 of 1.00 GPa, 1.35 GPa, 1.70 GPa, and 2.00 GPa, and lubricant inlet temperatures t of −50 °C, −30 °C, −15 °C, and 0 °C.
The slip–roll ratios ranged from 0 to 0.2. The steel disk and ball consisted of GCr15 steel, with diameters of 90 mm and 19.05 mm, respectively, and a surface hardness of HRC 60–64 after heat treatment.

3. Results and Discussion

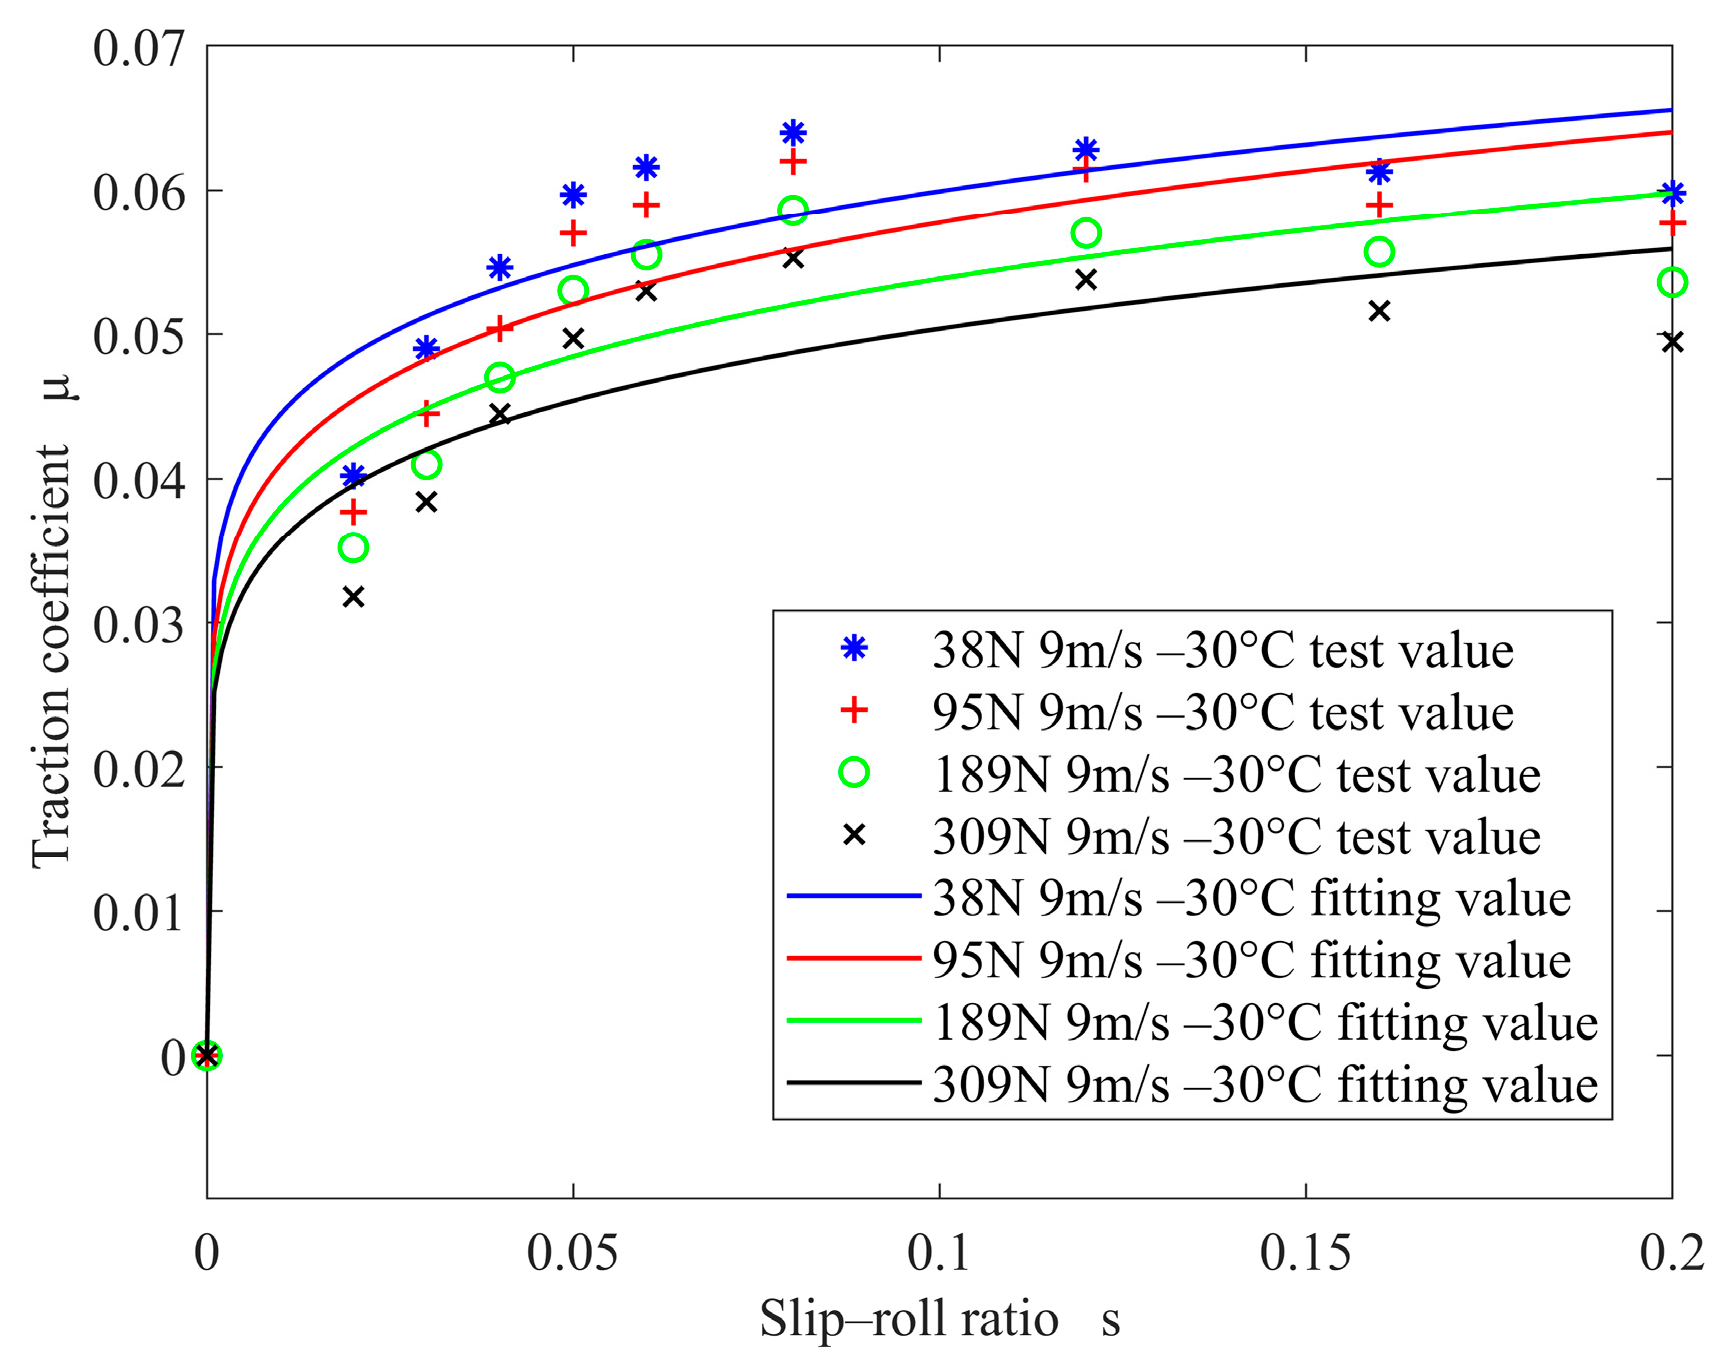
3.1. Slip–Roll Ratio
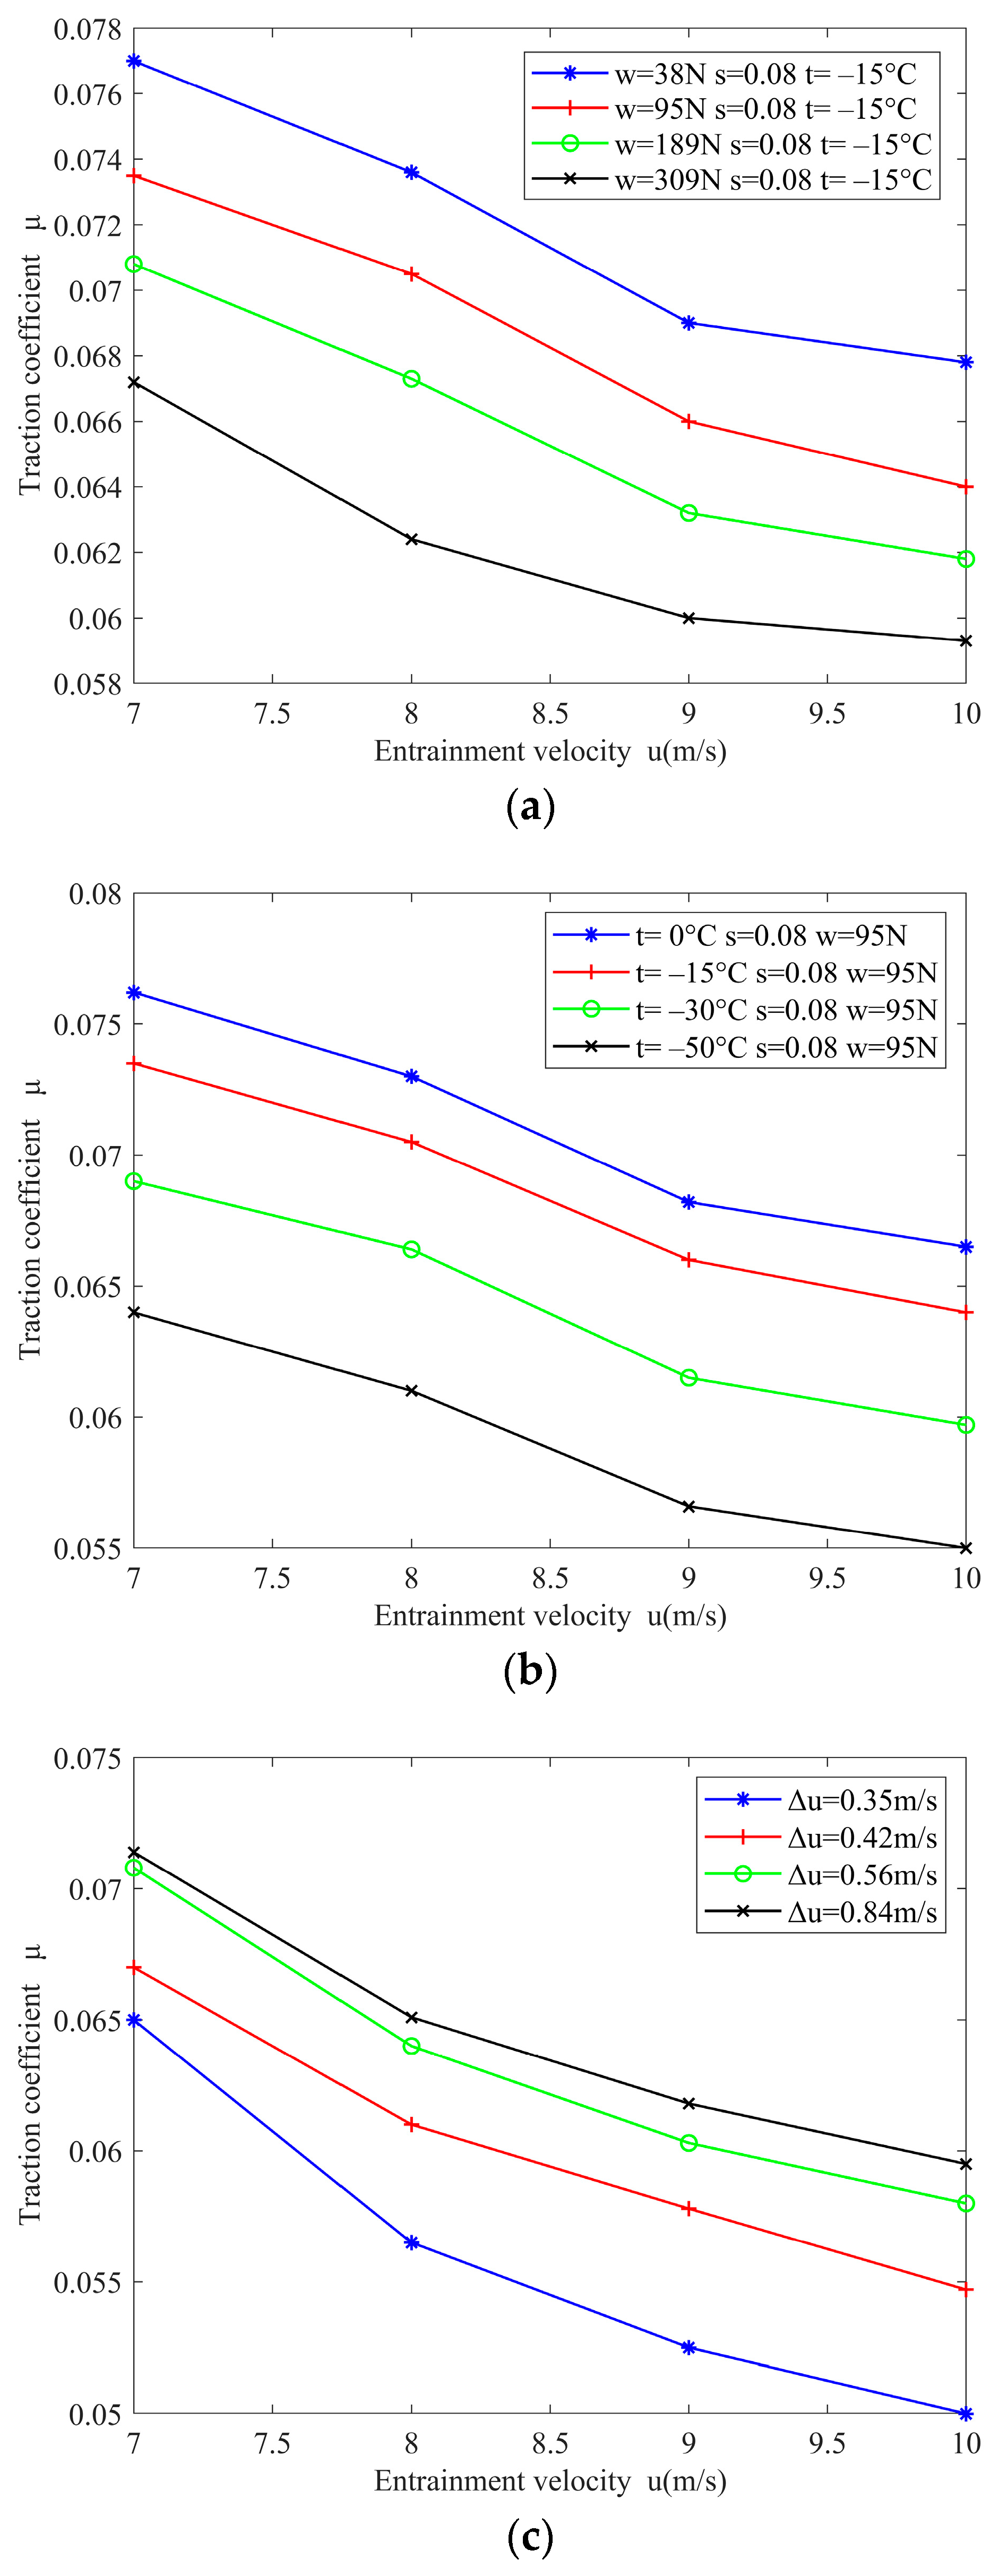
The traction coefficient curves changed in conjunction with the slip–roll ratio at different loads, entrainment velocities, and temperatures (Figure 4). The experimental findings and tribological theory [27] indicated the lubrication state in the interfaces is between boundary lubrication and film lubrication in low-temperature micro-oil lubrication. As shown in Figure 4, the traction coefficient increased approximately linearly in conjunction with a slip–roll ratio below 0.05, which could be attributed to the low shear strain rate of the oil film in this region. The shear stress was proportional to the shear strain rate, while the lubricant exhibited linear viscoelasticity. At a slip–roll ratio exceeding 0.05 and below 0.08, the traction coefficient changed in close accordance with the logarithmic function, showing a nonlinear relationship, during which the lubricant exhibited obvious nonlinear viscoelasticity [26,28]. The traction coefficient declined as the slip–roll ratio increased, indicating a distinct thermal effect of the lubricant at low temperatures and slip–roll ratios above 0.08 [29].

3.2. Load

The traction coefficient variation with load is shown in Figure 5, which applies to various entrainment velocities and inlet oil temperatures. This type of lubricant is suitable for high-load working conditions with low-temperature micro-oil lubrication because the traction coefficient decreases with the rise in load under various working conditions; this is more pronounced when the load is small and is slower when the load increases. Analysis indicated that the ball–disk contact area comprised a combined boundary and film lubrication state in low-temperature micro-oil conditions. Therefore, the contact area deformation continued at higher loads, increasing lubricant adhesion and decreasing the traction coefficient.

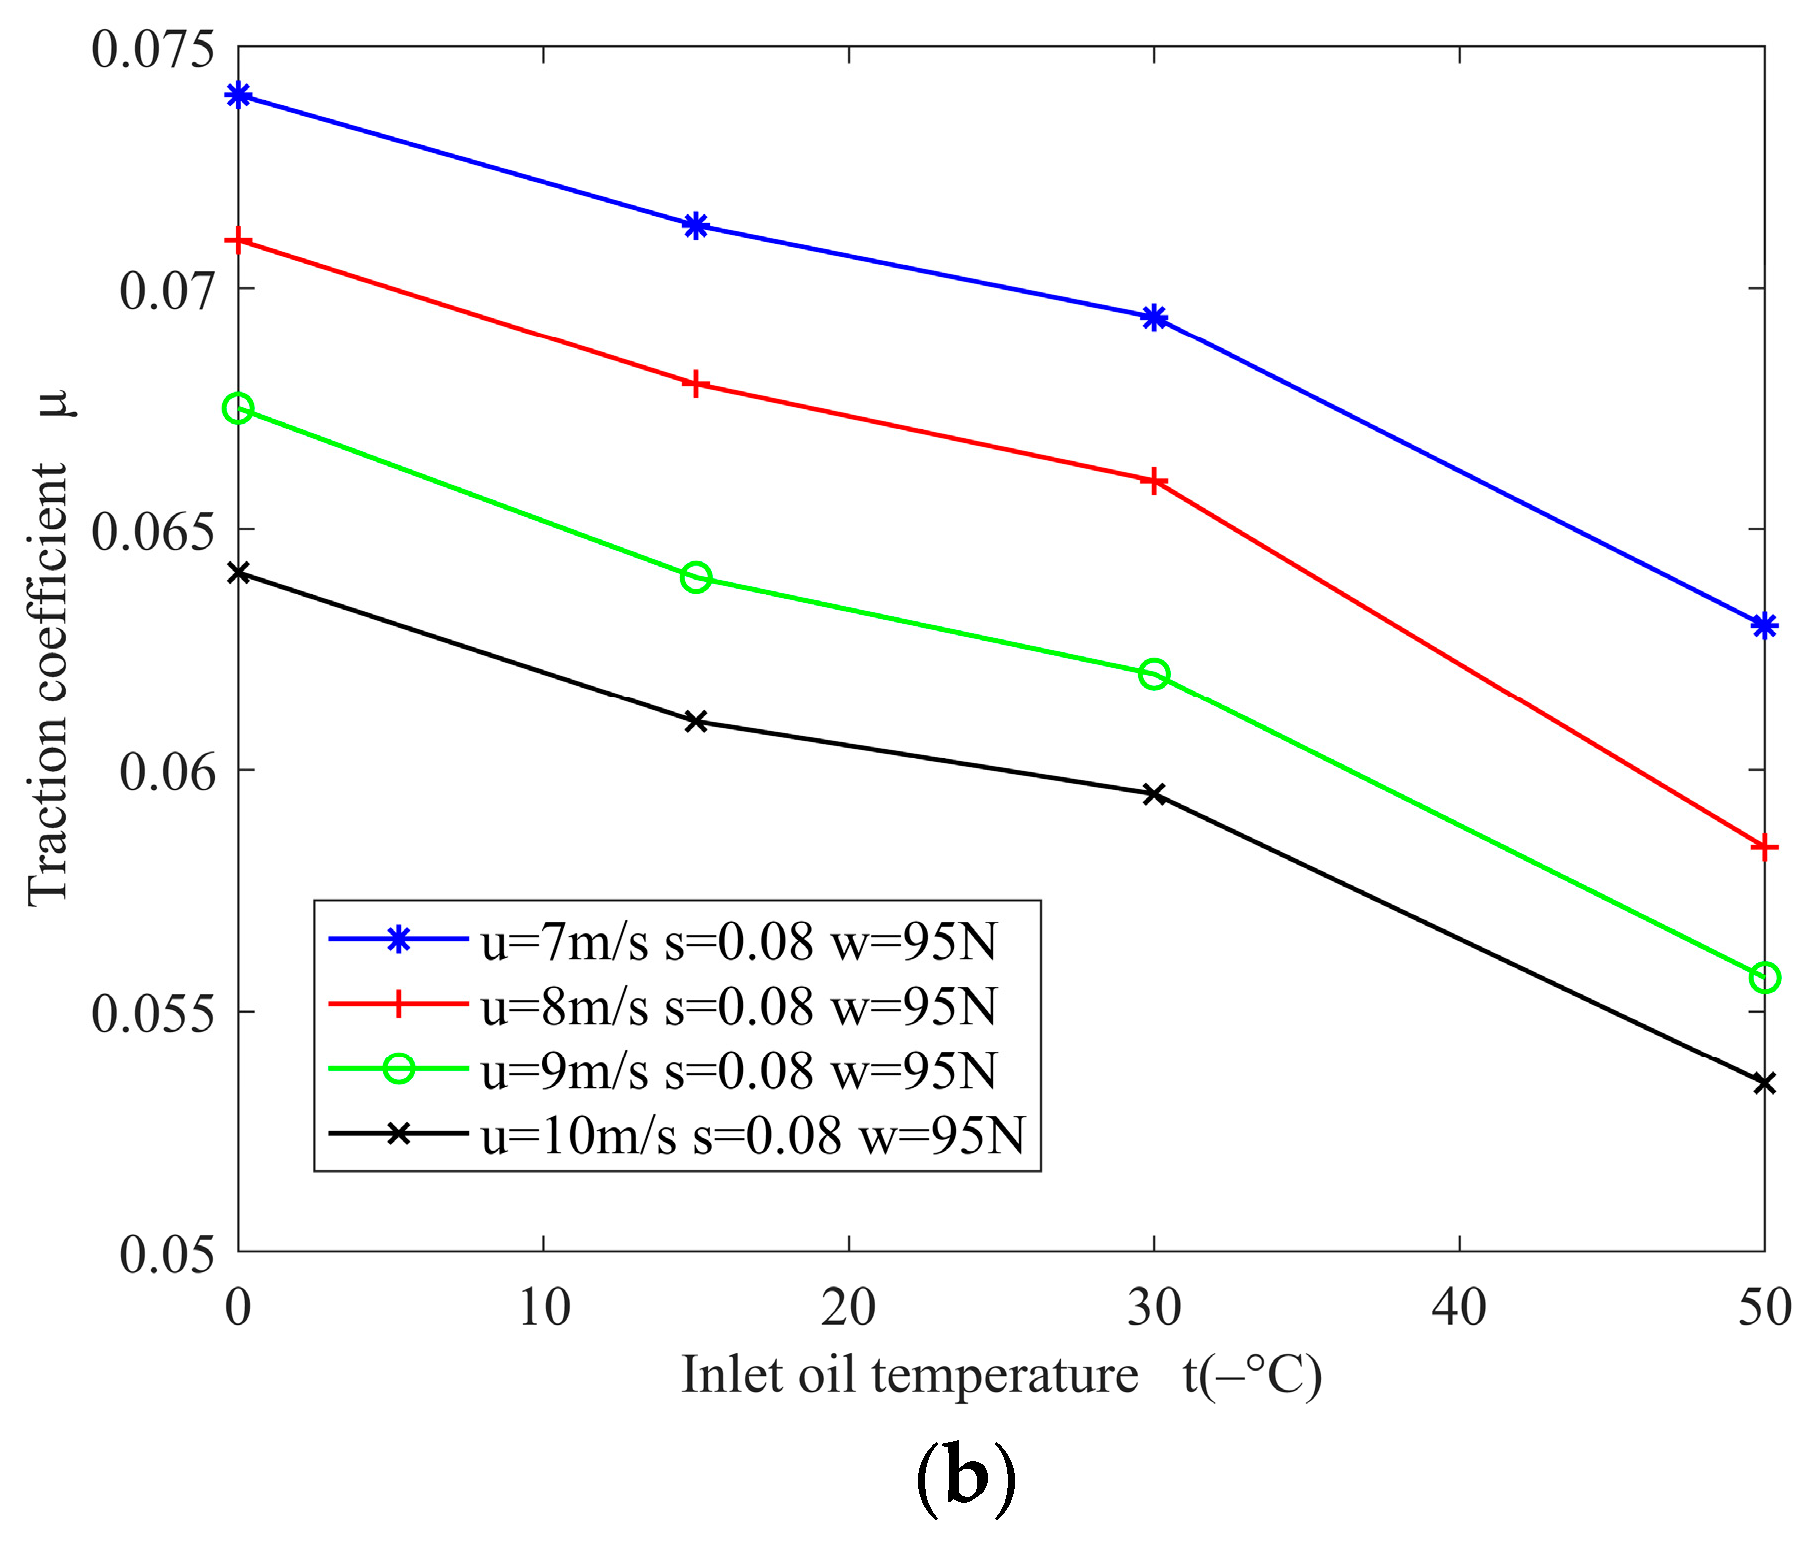
3.3. Entrainment Velocity

Figure 6 shows the curves of the traction coefficient variation with the entrainment velocities at different loads and inlet oil temperatures. As shown in Figure 4b and Figure 6, the traction coefficient declined as the entrainment velocity increased. Analysis suggested that the lubricant entered the contact zone more rapidly as the entrainment velocity increased, enhancing its lubrication ability and reducing the traction coefficient.

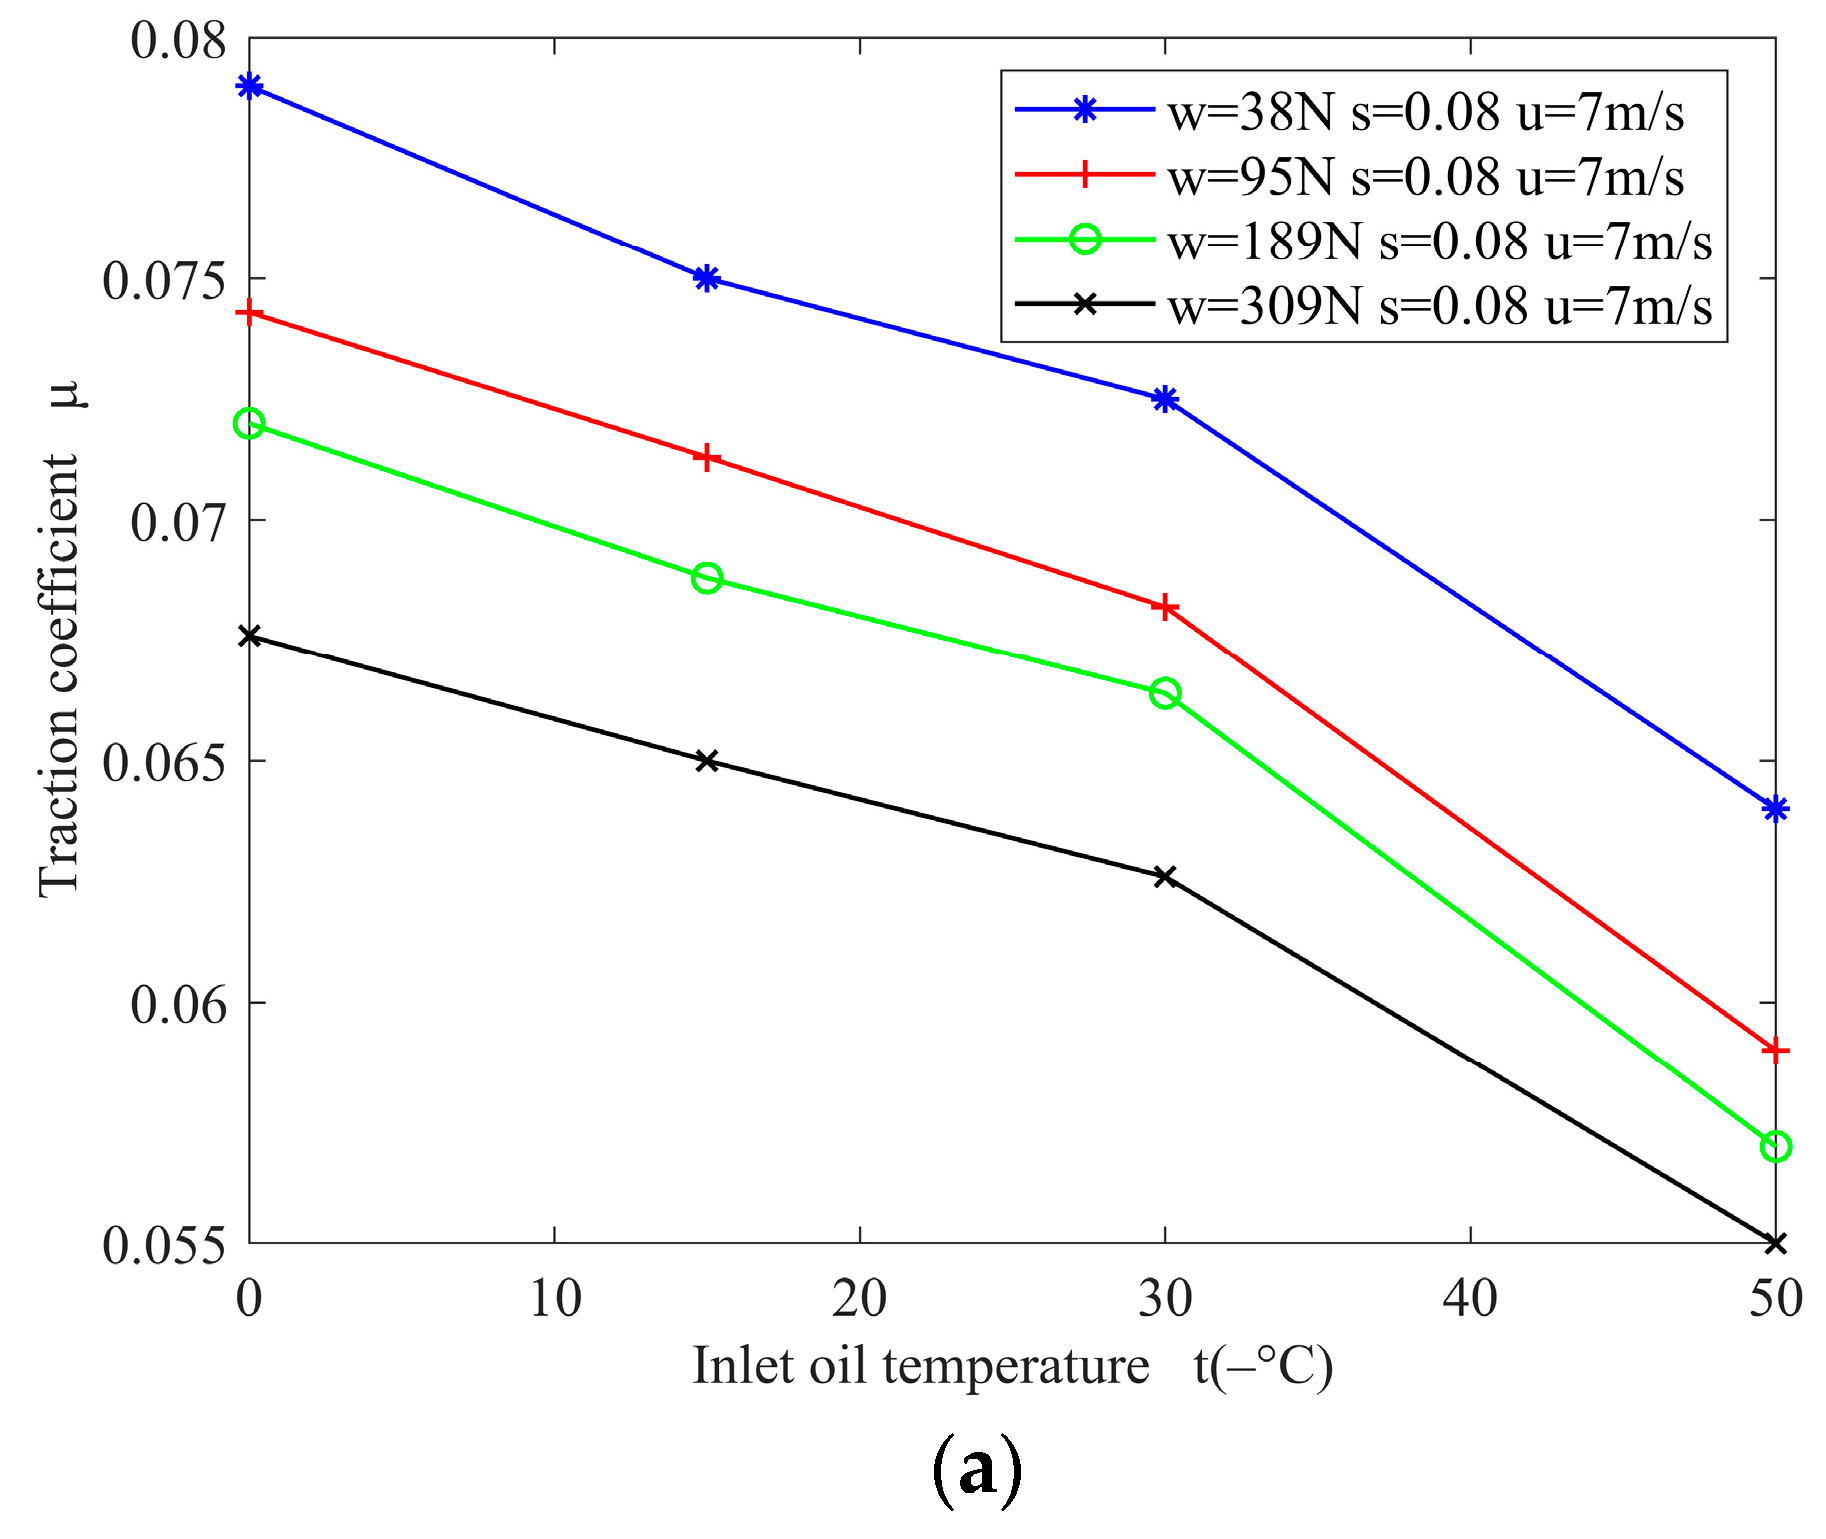
3.4. Inlet Oil Temperature

Figure 7 shows the curves of the traction coefficient variation with the inlet oil temperature at different loads and entrainment velocities. As shown in Figure 4c and Figure 7, the traction coefficient declined at a lower inlet oil temperature, which was inconsistent with the results of previous studies [30,31], where the lubricant traction coefficient increased as the temperature decreased in oil bath conditions. As illustrated in Figure 2 and Figure 3, the kinematic viscosity and adhesion of the lubricant increased dramatically at temperatures below 0 °C, reducing its fluidity. Micro-oil lubrication increased the lubricating oil’s adhesion to the contact area, facilitating film lubrication formation as the oil temperature decreased. Therefore, the oil film thickness increased while the traction coefficient decreased, enhancing the lubrication effect.

4. Rheological Model Analysis

As shown in Figure 1c and Figure 2, the lubricant became highly viscous at low temperatures, similar to grease. Therefore, this paper selected the Herschel–Bulkley (H-B) model for analysis.

4.1. The H–B Model

The constitutive equation of the H–B model [32] was simplified as follows:
τ = τ s + ϕ γ n
where τ s is the yield shear stress, n is the rheological index, and   ϕ is the plastic viscosity.
The H–B model was used to derive the relationship between the traction coefficient and slip–roll ratio s as follows:
μ = 1 w A τ d A
γ ˙ = s u h
τ = τ s + ϕ ( γ ˙ ) n
ϕ = ϕ 0 e α p
where w is the load, τ is the shear stress, γ ˙ is the shear strain rate, μ is the traction coefficient, s is the slip–roll ratio, A is the contact area, h is the oil film thickness, ϕ 0 is the plastic viscosity of the oil at atmospheric pressure, α is the pressure–viscosity coefficient of oil, p is the contact stress, and e is the constant, with e = 2.71828 .
Equations (3)–(5) were substituted into Equation (2):
μ = 1 w a a a 2 x 2 a 2 x 2 τ s d x d y + 1 w s n a a a 2 x 2 a 2 x 2 ( ϕ 0 e α p ( u h ) n ) d x d y
In the above equation, let:
b = 1 w a a a 2 x 2 a 2 x 2 τ s d x d y
c = 1 w a a a 2 x 2 a 2 x 2 ( ϕ 0 e α p ( u h ) n ) d x d y
μ = b + c s n
where a is the contact circle radius, and where b, c, and n are obtained by fitting the lubricant test data.
The least squares method was employed for rapid lubricant traction coefficient fitting, using the H–B, modified H–B, and T–J models for calculation. Figure 8 shows the comparison between the H–B model fitting and test values. The fitted curve exhibited an increase inconsistent with the test results, with a considerable fitting error.

4.2. The Modified H–B Model

Due to the fact that the solution is proposed according to an isothermal issue, an error was evident between the H–B model and the experimental results. Therefore, the impact of temperature requires consideration. This paper proposed a modified H–B model by adding a term to the H–B model to reflect the effect of temperature.
τ = τ s + ϕ ( γ ˙ ) n + κ γ ˙  
where κ is the same unit as viscosity, and its value changes with different traction curves, while the other terms retain their meaning as in the H–B model.
Based on the derivation process and assumptions of the H–B model, a new relationship was obtained between the slip–roll ratio and traction coefficient using the modified model:
μ = 1 w a a a 2 x 2 a 2 x 2 τ s d x d y + 1 w s n a a a 2 x 2 a 2 x 2 ( ϕ 0 e α p ( u h ) n ) d x d y + 1 w s a a a 2 x 2 a 2 x 2 κ ( u h ) d x d y
Assuming that the viscosity of the lubricant in the above equation did not vary with the slip–roll ratio, then:
d = 1 w a a a 2 x 2 a 2 x 2 κ ( u h ) d x d y
The modified H–B model was used to derive the relationship between the traction coefficient and the slip–roll ratio variation as follows:
μ = b + c s n + d s
where b and c retain the same meaning as in the H–B model, and d is shown in Equation (12).
Figure 9 compares the modified H–B model fitting and experimental results. Under micro-oil lubrication at low temperatures, utilizing the modified H–B model clearly compensated for the deficiency of the H–B model in the thermal effect region. Compared with the H–B model, the modified H–B model improved the consistency between the theoretical prediction and the experimental traction coefficient values of the lubricant. The modified model increased the traction coefficient prediction accuracy at different slip–roll ratios.

4.3. The Modified H–B Model vs. the T–J Model

The T–J rheological model is commonly used for lubricant analysis [33], presenting the following simplified form of constitutive Equation [34]:
Δ u h = u G b d τ d x + F ( τ )
where u is the entrainment velocity, Δu is the slide speed, h is the oil film thickness, b is the contact circle radius, G is the oil film shear elastic modulus, and τ is the oil film shear stress. When τ < τc (τc is the ultimate oil film shear stress), F(τ) = 0. When ττc, F(τ) = (τΔu/(τch)).
The approximate traction force formula was determined via integration over the contact area:
F = φ b 2 τ c ¯
where τ c ¯ is the average ultimate shear stress, and F is traction force.
φ = π 2 arcsin 1 l 2 1 + l 2 + 2 l 1 + l 2
l = 2 3 G ¯ b h τ c × u u
μ = F w
where G ¯ is the average elasticity shear modulus, w is the load, and μ is the traction coefficient.
Figure 10 shows a comparison between the modified H–B and T–J model results. The fitted curve of the T–J model did not decrease in conjunction with a decline in the test values, while the correlation coefficient of the fitted values was lower than the modified H–B model. In the whole test range, the modified H–B model displayed better consistency between the theoretical prediction and test lubricant traction coefficient values than the T–J model, increasing the fitting accuracy.

5. Conclusions

(1)
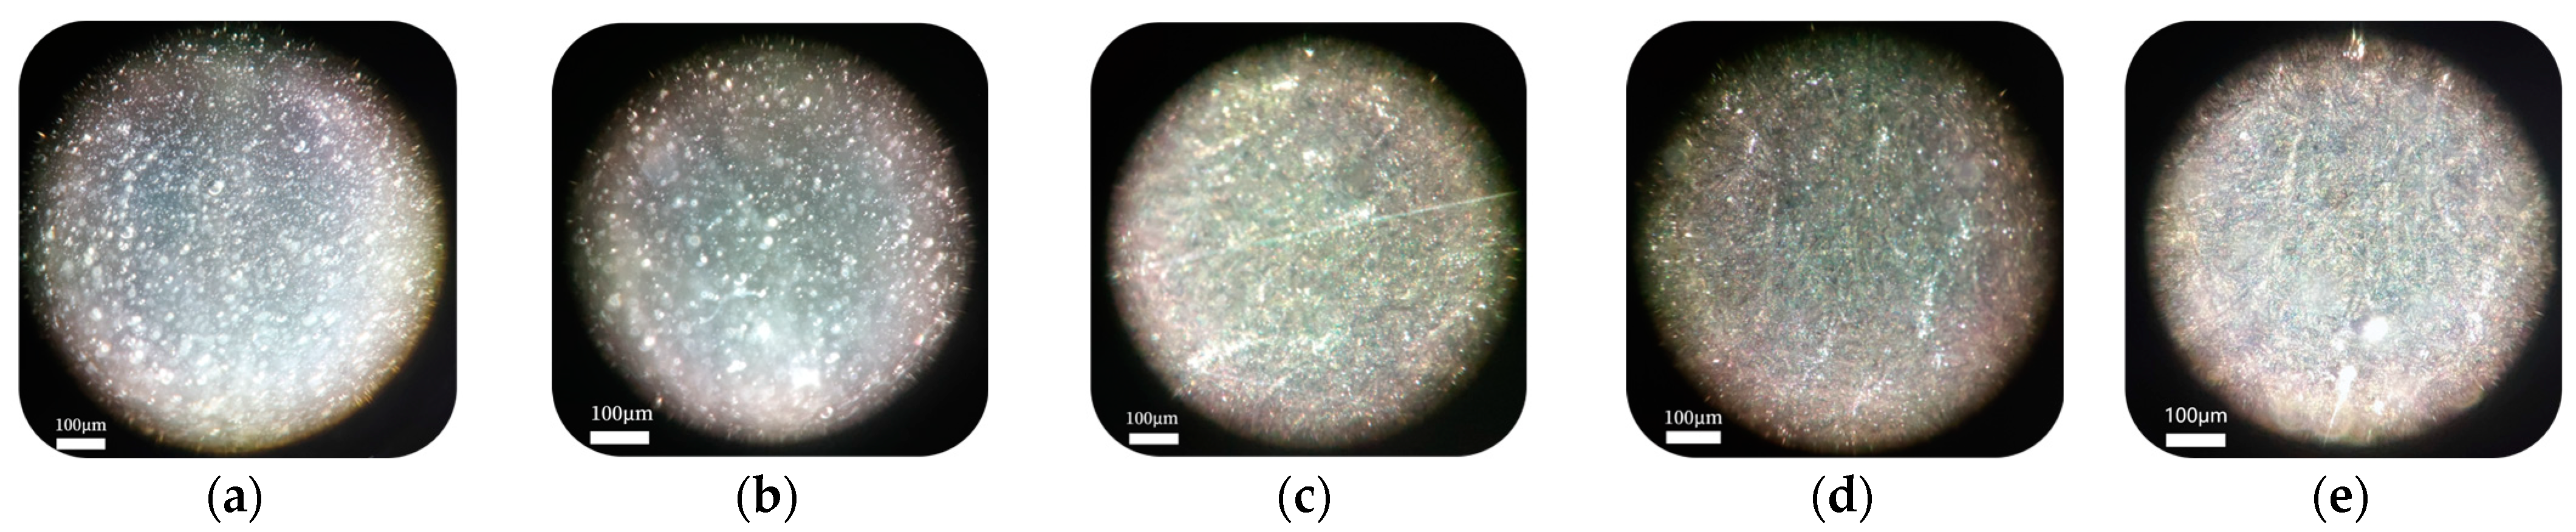
The kinematic viscosity of the lubricating oil increases significantly as the temperature decreases, while the white granular flocculence becomes higher in a microscopic state, reducing the fluidity.
(2)
The lubricant traction coefficient decreases as the load increases at low temperatures, and decreases at a higher entrainment velocity and lower inlet oil temperature.
(3)
The proposed modified H–B model for correction is consistent with the experimental data. The modified H–B model is compared with the commonly used lubricant rheological T–J model, yielding better fitting results. It is suitable for the engineering traction coefficient calculation of lubricating oil with low temperatures and high viscosities.

Author Contributions

Conceptualization, F.G., L.T. and Y.C.; data curation, F.G. and B.S.; formal analysis, F.G. and Y.Z.; funding acquisition, F.G. and Y.C.; investigation, F.G. and Y.Z.; methodology, F.G., Y.C. and B.S.; project administration, F.G. and Y.C.; resources, F.G. and L.T.; software, F.G. and B.S.; supervision, F.G. and Y.C.; validation, Y.Z. and L.S.; writing—original draft preparation, F.G. and B.S.; writing—review and editing, F.G., Y.C. and Y.Z. All authors have read and agreed to the published version of the manuscript.

Funding

This research was funded by the National Natural Science Foundation of China (52005158).

Data Availability Statement

The data used to support the findings of this study are available from the corresponding author upon request.

Conflicts of Interest

Fei Gao, Yan Zhao, and Liming Sun are employed by the company Luoyang Bearing Research Institute Co., Ltd. The remaining authors declare that the research was conducted in the absence of any commercial or financial relationships that could be construed as a potential conflict of interest.

References

  1. Wu, H.H. Analysis of lubrication failure. In Proceedings of the Metallurgical Equipment Branch of China Metal Society and 2012 National Metallurgical Equipment Hydraulic Lubrication Pneumatic Technology Conference, Beijing, China, 12 June 2012. [Google Scholar]
  2. Wang, Y.S.; Liu, Y.L.; Zhang, G.L. Research review on the lubrication characteristics of space bearings. J. Tianjin Univ. Technol. Educ. 2018, 28, 1–5+85. [Google Scholar] [CrossRef]
  3. Pandey, K.R.; Ghosh, K.M. A thermal analysis of traction in elastohydrodynamic rolling/sliding line contacts. Wear Int. J. Sci. Technol. Frict. Lubr. Wear 1998, 216, 103–114. [Google Scholar] [CrossRef]
  4. Li, Z.; Lu, Y.F.; Zhang, C.; Dong, J.L.; Zhao, X.L.; Wang, L.Q. Traction behaviours of aviation lubricating oil and the effects on the dynamic and thermal characteristics of high-speed ball bearings. Ind. Lubr. Tribol. 2020, 72, 15–23. [Google Scholar] [CrossRef]
  5. Su, B.; Lu, X.T.; Su, Z.H.; Yang, H.S. Research on traction characteristics of a type of grease for lower-middle speeds bearing and its rheological models. Lubr. Eng. 2018, 43, 36–40+93. [Google Scholar] [CrossRef]
  6. Zhang, G.T.; Su, B.; Liu, P.; Wang, J.; Zhang, W.H. Experimental research on frictional torque of solid lubricated bearings in liquid nitrogen environment. Bearing 2023, 1–7. Available online: http://kns.cnki.net/kcms/detail/41.1148.TH.20230221.1110.004.html (accessed on 1 December 2023).
  7. Pasdari, M.; Gentle, C.R. Effect of lubricant starvation on the minimum load condition in a thrust-loaded ball bearing. A S L E Trans. 1987, 30, 355–359. [Google Scholar] [CrossRef]
  8. Gentle, C.R.; Pasdari, M. Computer simulation of starvation in thrust-loaded ball-bearings. Wear 1983, 92, 125–134. [Google Scholar] [CrossRef]
  9. Liu, S.Z.; Fu, H.R. The influence of low temperature on lubricating oil’s performance. Lubr. Oil 2010, 25, 18–20. [Google Scholar] [CrossRef]
  10. Wang, Y.S.; Cheng, J.W. Experimental analysis of viscosity temperature and rheological properties of aerospace bearing lubricating oil. Bearing 2015, 11, 39–41+63. [Google Scholar] [CrossRef]
  11. Wang, Y.S.; Cheng, J.W.; Li, H. Friction characteristics of space lubricating oil No.4129 in rolling and sliding contact. China Pet. Process. Petrochem. Technol. 2014, 16, 79–83. [Google Scholar] [CrossRef]
  12. Wang, Y.S.; Li, G.; Cheng, J.W. Impact factors to friction characteristics of space lubricating oil No.4116. J. Aerosp. Power 2016, 31, 2181–2187. [Google Scholar] [CrossRef]
  13. Zhang, L.Y.; Wang, Y.S.; Cao, J.W. Study on viscosity-temperature characteristic of lubricating oils used in high and low temperature instrument bearings. Bearing 2013, 10, 8–11. [Google Scholar] [CrossRef]
  14. Li, J.B.; Liu, J.Y.; Li, K.; Zhou, N.N.; Liu, Y.; Hu, X.D.; Yin, S.L.; Wang, G.R. Tribological properties of oil-impregnated polyimide in double-contact friction under micro-oil lubrication conditions. Friction 2023, 11, 1493–1504. [Google Scholar] [CrossRef]
  15. Shen, X.J.; Tao, D.H.; Gu, J.M. Study on the lubricant with advanced high-low temperature performance for instrument bearings. Lubr. Eng. 2010, 35, 92–95. [Google Scholar]
  16. Shen, Z.Q.; Liu, H.B.; Hao, J.H.; Yang, M.K.; Qiu, M. Finite element analysis of oil injection lubrication for high-speed rolling bearings. Bearing 2021, 10, 24–29. [Google Scholar] [CrossRef]
  17. Liang, H.; Zhang, Y.; Wang, W.Z. Influence of the cage on the migration and distribution of lubricating oil inside a ball bearing. Friction 2022, 10, 1035–1045. [Google Scholar] [CrossRef]
  18. Gao, S.; Han, Q.K.; Chu, F.L. Analysis of dynamic characteristics and skidding state of angular contact bearing by thermos-hydro-elasto-dynamic coupling model. J. Mech. Eng. 2022, 58, 87–97. [Google Scholar]
  19. Zhang, G.Y.; Liang, M.T.; Zhao, Y.Y.; Zhao, W.G.; Li, X.K. Theoretical and experimental study on the lubrication model and transient start-up process of the cryogenic rolling bearing. J. Mech. Eng. 2022, 58, 162–171. [Google Scholar]
  20. Qian, S.; Guo, D.; Liu, S.H.; Lu, X.C. Experimental investigation of lubricant flow properties under micro oil supply condition. J. Tribol. 2012, 134, 041501. [Google Scholar] [CrossRef]
  21. Karthikeyan, B.K.; Teodorescu, M.; Rahnejat, H.; Rothberg, S.J. Thermoelastohydrodynamics of grease-lubricated concentrated point contacts. Proc. Inst. Mech. Eng. Part C J. Mech. Eng. Sci. 2010, 224, 683–695. [Google Scholar] [CrossRef]
  22. Li, S.Y.; Guo, F.; Li, X.M. Numerical analysis of elastohydrodynamic lubrication behavior under micro oil droplet supply. Tribology 2016, 36, 413–420. [Google Scholar] [CrossRef]
  23. Li, X.M.; Guo, F.; Wang, S.P.; Liu, C.L.; Wang, W.Z. Behaviors of a micro oil droplet in an EHL contact. Friction 2016, 4, 359–368. [Google Scholar] [CrossRef]
  24. Li, Z.H.; Su, B.; Liu, P.; Li, J.T.; Wang, J.; Wei, B.Y. Development of traction performance testing machine for aerospace bearing lubricant. Lubr. Eng. 2022, 47, 114–119. [Google Scholar] [CrossRef]
  25. Liu, F.B.; Su, B.; Zhang, G.T.; Ren, J.L.; Zhang, W.H. Development of a Cryogenic Tester with Air Bearing to Test Sliding-Rolling Contact Friction. Lubricants 2022, 10, 119. [Google Scholar] [CrossRef]
  26. Wang, Y.S.; Cao, J.W.; Li, H. Study of frictional and viscosity-temperature characteristics of a space lubricating oil No.4129 in rolling/sliding contact. Acta Armamentarii 2014, 35, 1515–1520. [Google Scholar] [CrossRef]
  27. Wen, S.Z.; Huang, P.; Tian, Y.; Ma, L.R. Principles of Tribology, 5th ed.; Tsinghua University Press: Beijing China, 2020; pp. 5–37. [Google Scholar]
  28. Deng, S.E.; Teng, H.F.; Zhou, Y.W.; Wang, Y.S.; Yang, B.Y. Determination of constitutive equation of aviation lubricating oil HKD and computation on traction force. Lubr. Eng. 2006, 31, 24–27. [Google Scholar]
  29. Gohar, R.; Rahnejat, H. Fundamentals of Tribology, 3rd ed.; World Scientific Press: Singapore, 2018. [Google Scholar]
  30. Wang, W.Z.; Cao, H.; Hu, J.B. Numerical simulation of transient elastohydrodynamic lubrication of helical gears. Tribology 2011, 31, 604–609. [Google Scholar] [CrossRef]
  31. Wang, Y.S.; Cao, J.W.; Cai, Y.J. Study on low-temperature traction behavior of a space lubricating oil No.4116. China Pet. Process. Petrochem. Technol. 2015, 17, 111–116. [Google Scholar]
  32. Yoo, J.; Kim, K. Numerical analysis of grease thermal elastohydrodynamic lubrication problems using the Herschel-Bulkley model. Tribol. Int. 1997, 30, 401–408. [Google Scholar] [CrossRef]
  33. Tevaarwerk, J.L.; Johnson, K.L. The influence of fluid rheology on the performance of traction drives. J. Lubr. Technol. 1979, 101, 266–273. [Google Scholar] [CrossRef]
  34. Meng, Q.Z.; Yang, B.Y. The analysis of traction behavior of the new type high-speedaerial lubricating oil by the T-J model. Mach. Des. Manuf. 2006, 44, 9–11. [Google Scholar]
Figure 1. The traction characteristic tester. (a) The temperature controller; (b) photo of the test rig; (c) the testing arrangement diagram.
Lubricants 11 00528 g001
Figure 2. The kinematic viscosity curve of lubricating oil.
Lubricants 11 00528 g002
Figure 3. The state of lubricating oil at different temperatures: (a) −50 °C; (b) −30 °C; (c) −15 °C; (d) 0 °C; (e) 20 °C.
Lubricants 11 00528 g003
Figure 4. The traction coefficient variation in conjunction with the slip–roll ratio: (a) the traction coefficient variation with the slip–roll ratio under different loads; (b) the traction coefficient variation with the slip–roll ratio at different entrainment velocities; (c) the traction coefficient variation with the slip–roll ratio at different temperatures.
Lubricants 11 00528 g004
Figure 5. The traction coefficient variation with the load at different: (a) at different entrainment velocities; (b) at different inlet oil temperatures.
Lubricants 11 00528 g005
Figure 6. The traction coefficient variation in conjunction with the entrainment velocity: (a) the traction coefficient variation with the entrainment velocity under different loads; (b) the traction coefficient variation with the entrainment velocity at different inlet oil temperatures; (c) the traction coefficient variation with the slip–roll ratio at different entrainment velocities under a load of 189 N and an inlet oil temperature of −15 °C; (d) the traction coefficient variation with the slip–roll ratio at different entrainment velocities under a load of 38 N and an inlet oil temperature of 0 °C.
Lubricants 11 00528 g006aLubricants 11 00528 g006b
Figure 7. The traction coefficient variation in conjunction with the inlet oil temperature: (a) at different loads; (b) at different entrainment velocities.
Lubricants 11 00528 g007aLubricants 11 00528 g007b
Figure 8. The comparison between the H–B model fitting and test values.
Lubricants 11 00528 g008
Figure 9. A comparison between the modified H-B model fitting and test values: (a) At different loads; (b) At different oil inlet temperatures.
Lubricants 11 00528 g009
Figure 10. A comparison between the modified H–B and T–J models in different operational conditions.
Lubricants 11 00528 g010
Table 1. The performance parameters of the lubricants.
Technical ParametersValue
Viscosity index136
Flashpoint, °C266
Condensation point, °C−57
Neutralization value, mgKOH/g0.18
Thermal conductivity K, N/(s · °C)1.5
Disclaimer/Publisher’s Note: The statements, opinions and data contained in all publications are solely those of the individual author(s) and contributor(s) and not of MDPI and/or the editor(s). MDPI and/or the editor(s) disclaim responsibility for any injury to people or property resulting from any ideas, methods, instructions or products referred to in the content.

