Article

Prediction of RUL of Lubricating Oil Based on Information Entropy and SVM

1
Department of Vehicle and Electrical Engineering, Shijiazhuang Campus of Army Engineering University, Shijiazhuang 050003, China
2
Product Research and Development Center, Huabei Diesel Co., Ltd., Shijiazhuang 050081, China
*
Author to whom correspondence should be addressed.
Lubricants 2023, 11(3), 121; https://doi.org/10.3390/lubricants11030121
Submission received: 3 February 2023 / Revised: 23 February 2023 / Accepted: 6 March 2023 / Published: 9 March 2023

Abstract

:
This paper studies the remaining useful life (RUL) of lubricating oil based on condition monitoring (CM). Firstly, the element composition and content of the lubricating oil in use were quantitatively analyzed by atomic emission spectrometry (AES). Considering the large variety of oil data obtained through AES, the accuracy and efficiency of the RUL prediction model may be reduced. To solve this problem, a comprehensive parameter selection method based on information entropy, correlation analysis, and lubricant deterioration analysis is proposed to screen oil data. Then, based on a support vector machine (SVM), the RUL prediction model of lubricant was established. By comparing the experimental results with the output data of the prediction model, it is shown that the accuracy and efficiency of the SVM prediction model established after parameter screening have been significantly improved.

1. Introduction

Lubricating oil is an important part of mechanical equipment. It can reduce friction and wear, cool and clean parts, prevent rust and corrosion, and ensure that the machine operates in good condition [1,2,3]. During the operation of the machine, the lubricating oil gradually deteriorates, producing acid substances, wear particles, water, impurities, etc., until it cannot meet the requirements of the machine, and needs to be replaced [4,5,6,7,8]. At present, the replacement of lubricating oil is mainly based on the service time or mileage recommended by the equipment manufacturer or lubricating oil manufacturer. Most of the recommended values tend to be conservative, and premature replacement of lubricating oil means a waste of oil resources, which will increase economic costs and environmental costs [9]. When the condition of mechanical equipment is poor or the working condition is bad, the lubricating oil will accelerate the deterioration, leading to the premature failure of the lubricating oil. Changing the lubricating oil too late will aggravate the mechanical wear, increase the risk of equipment damage, and even cause serious accidents [10,11]. Therefore, the timing of lubricating oil replacement should be determined according to the actual state of lubricating oil, which is also the concept of condition-based maintenance (CBM).
CBM refers to maintenance according to actual needs. It collects machine information through condition monitoring (CM) and makes the best maintenance decision [12,13]. Lubrication condition monitoring (LCM) is an important aspect of the CBM field. It monitors the lubricating oil status through spectral analysis, iron spectrum analysis, electrochemical analysis, and other methods to provide the basis for machine maintenance and lubricating oil replacement. LCM is an active maintenance strategy often used in the diagnosis and prediction of early failures of mechanical equipment to avoid potential serious equipment failures [14,15,16,17]. The core content of LCM is to extract and analyze key information (physical and chemical properties) from lubricants to generate output to support maintenance decisions. Effective maintenance decisions can extend the life of mechanical equipment, but incorrect or biased maintenance decisions will adversely affect the mechanical equipment [14]. Therefore, timely, accurate, and reliable maintenance decisions should be made based on the information obtained from the LCM.
Oil spectrum analysis is one of the earliest and most successful oil analysis techniques applied in mechanical equipment fault diagnosis, and it is also an important method in the field of LCM [2,7,18,19,20]. Spectral analysis can effectively detect the content of abrasive elements in oil, the status of additives, and the degree of oil pollution. At present, oil spectrum analysis technology has become one of the most effective methods in LCM. Passoni et al. [7] used Raman spectroscopy to identify the spectral differences of automotive lubricants with different SAE specifications and more accurately identified the type of base oil, and the SAE viscosity classes at low and high temperatures of the tested samples. Sejkorová et al. [18] used Fourier transform infrared spectroscopy (FTIR), partial least squares (PLS), and principal component regression (PCR) to build a prediction model for the kinematic viscosity of SAE 15W-40 oil worn at 100 ℃. The experimental results show that the FTIR-PLS model has more advantages. Zzeyani et al. [19] used electronic paramagnetic resonance (EPR) and FTIR to analyze and evaluate the degradation rate of synthetic lubricating oil in diesel vehicles, and the experiment showed that FTIR technology was effective in analyzing the quality of lubricating oil and evaluating the degradation rate. Zhou et al. [20] established a prediction model for the acid value of lubricating oil based on the infrared spectrum monitoring method. In this paper, atomic emission spectroscopy (AES) is selected as the LCM method. AES uses the atomic or ionic emission characteristic spectrum of each element to determine the composition of a substance under thermal or electrical excitation and carries out qualitative and quantitative analysis of elements [21,22]. Compared to other spectral analysis methods, AES can analyze about 70 elements using small amounts of oil samples, with detection limits as low as sub-ppm for most elements. The American Society for Materials and Testing (ASTM) has adopted rotating disc electrode atomic emission spectrometry (RED-AES) as the standard test method for the determination of worn metals and contaminants in used lubricants and has developed ASTM D6595-17 based on this method [23].
However, there are many kinds of lubricating oil indicators obtained through LCM, and some CM data may also have a strong correlation. Therefore, CM data need to be identified and processed to provide support for the establishment of the final residual service life (RUL) prediction model. In most known studies, researchers select required CM data based on experience. This experience-based selection method is likely to lead to unreasonable CM data selection, and even lead to incorrect maintenance decisions. Therefore, it is necessary to scientifically select CM data.
Information entropy is the generalization of physical entropy. It is a measure to describe the uncertainty of variables proposed by C.E. Shannon concerning the concept of thermodynamics and can quantify the information content of variables [24,25]. The importance of CM data for lubricating oil RUL can be judged by calculating the information entropy of CM data. Therefore, the information content of CM data can be quantitatively analyzed by information entropy, which can be used as the basis for the selection of lubricating oil quality indicators.
Based on the above theory, this paper first uses atomic emission spectrometry (AES) to quantitatively analyze the element composition and content of the lubricating oil in use. Then, the information content of CM data is analyzed quantitatively using the information entropy theory, and the appropriate quality index is selected as the supporting data of the prediction model based on the correlation between CM data and the deterioration process of lubricating oil. On this basis, the RUL prediction model of lubricating oil was established based on a support vector machine (SVM), and the SVM model was trained and verified by the selected quality index data, to achieve the prediction of lubricating oil RUL. This study proposes a comprehensive parameter selection method based on information entropy, correlation analysis, and lubricating oil deterioration analysis. The experimental results show that the accuracy and efficiency of the SVM prediction model established after parameter screening have been significantly improved.
The procedure for RUL prediction of lubricating oil is shown in Figure 1. The rest of the paper is organized as follows. Section 2 describes the acquisition of oil samples and the determination of element content in oil samples by AES. Section 3 gives the process of screening oil data by information entropy, correlation analysis, and lubricant deterioration analysis. Section 4 introduces the use of SVM to build the RUL prediction model of lubricating oil. In Section 5, the effects of parameter selection on the SVM prediction model are compared to demonstrate the proposed method. Finally, the conclusion is drawn in Section 6.

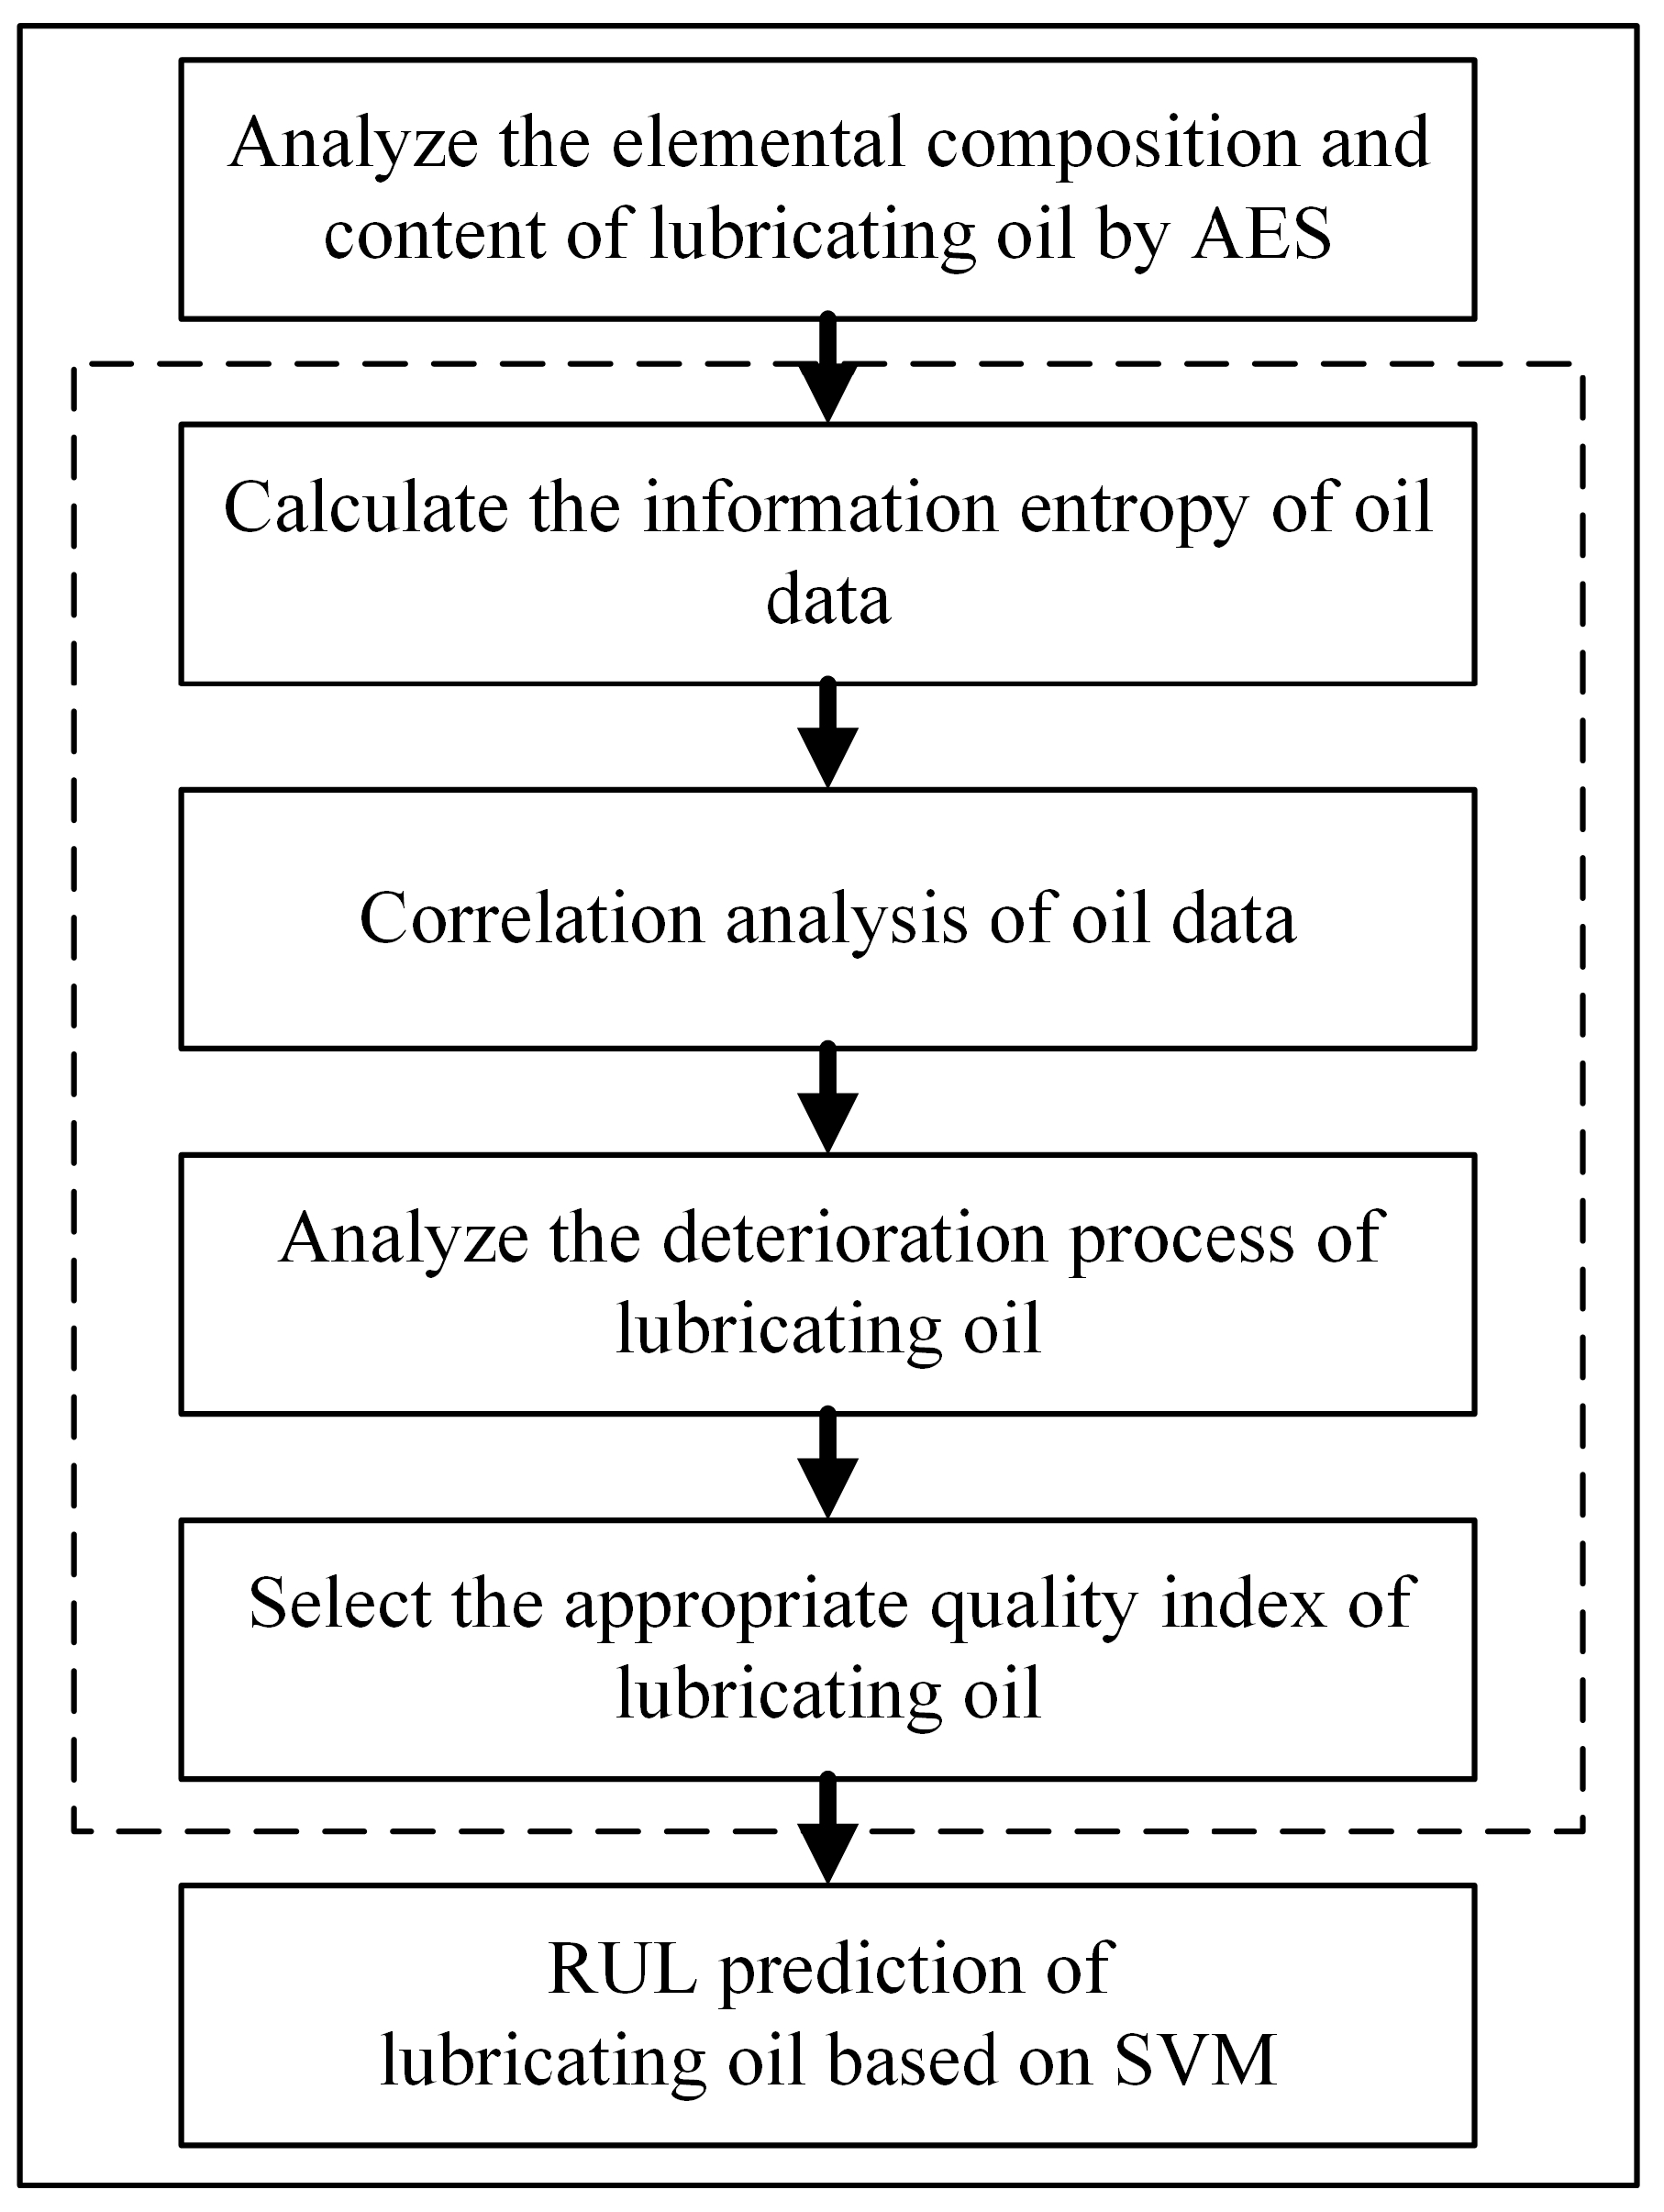
2. Materials and Methods
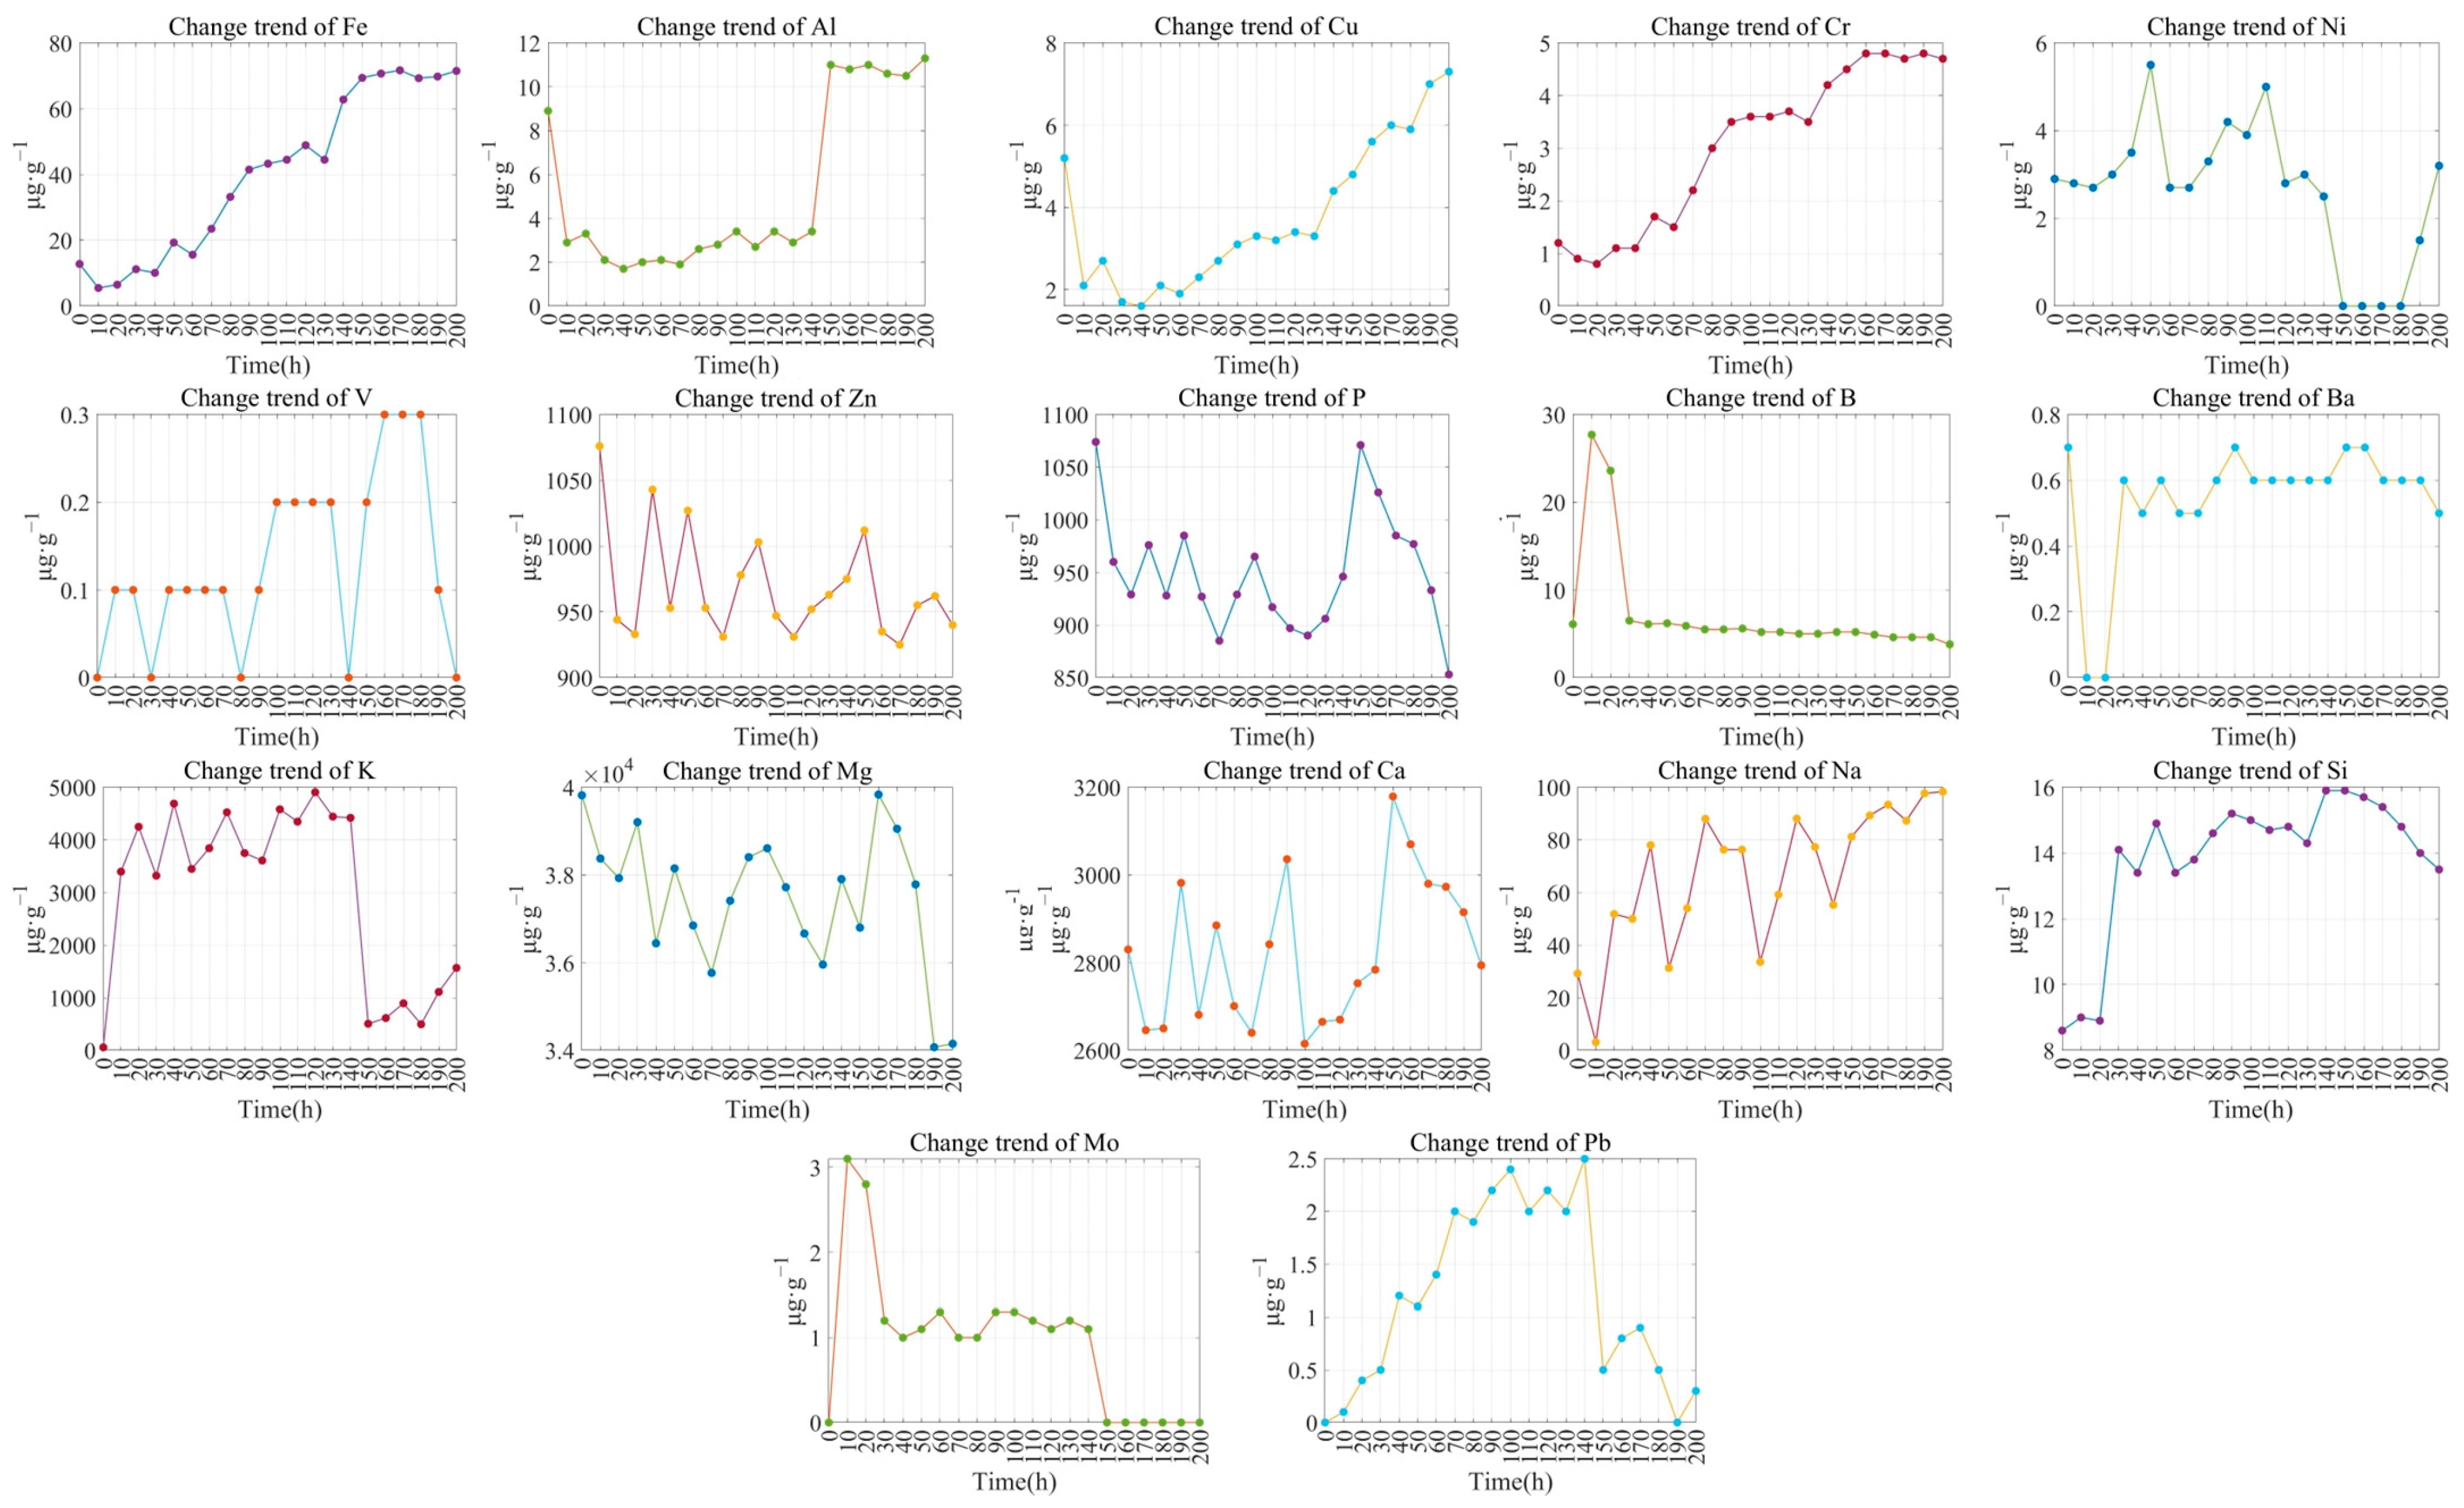
2.1. Oil Samples

The engine bench test can simulate different working conditions and is an important method to test and verify the performance of the engine and its related components.
In this study, a typical diesel engine is selected as the research object, and the reliability test of 200 h under severe conditions is simulated by a bench test. Collect oil samples every 10 working hours, and ensure that the sampling method and location are consistent. The engine oil used in the diesel engine is SAE 15W-40 diesel oil, which is produced by ExxonMobil. The maximum service life specified by the manufacturer is 7500 km or 6 months. The characteristics of the selected engine are shown in Table 1.

2.2. AES Measurements

The oil monitoring equipment used in this study is Spectro Oil Q100 Rotary Disc Electrode Atomic Emission Spectrometer (RDE-AES) manufactured by Spectro Scientific, which is mainly used to detect the content of wear metals, contaminants, and additive elements in lubricants and hydraulic oils. RED-AES delivers oil samples to a high-temperature arc formed between the rod electrode and the disc electrode by rotating the disc electrode. Elements in the oil samples generate characteristic spectra under the excitation of a high-temperature arc. The content of different elements can be determined by detecting the characteristic spectra with an optical system. The main structure of RED-AES is shown in Figure 2.
Using RDE-AES, we detected the content of 17 elements (Fe, Al, Cu, etc.) in lubricating oil. All measurements were carried out at room temperature. To improve the accuracy of the test, we measured each oil sample three times and took the average value as the final test result. Some spectral data of engine oil are shown in Table 2.
As shown in Table 2, the mass fraction of some elements in the lubricant is very small, for example, the average mass fraction of V and Ba elements is less than 1 μg·g−1.
The degradation model of engine oil can be established by spectral data of the oil, and the RUL prediction of the oil can be achieved. However, there are a large number of elements and a small number of samples in the oil data, and some elements have a small change range or irregular change trend. If all spectral data is applied, the complexity of the model and the accuracy of the model will be increased. Therefore, the spectral data of oil need to be processed.

3. Parameter Selection

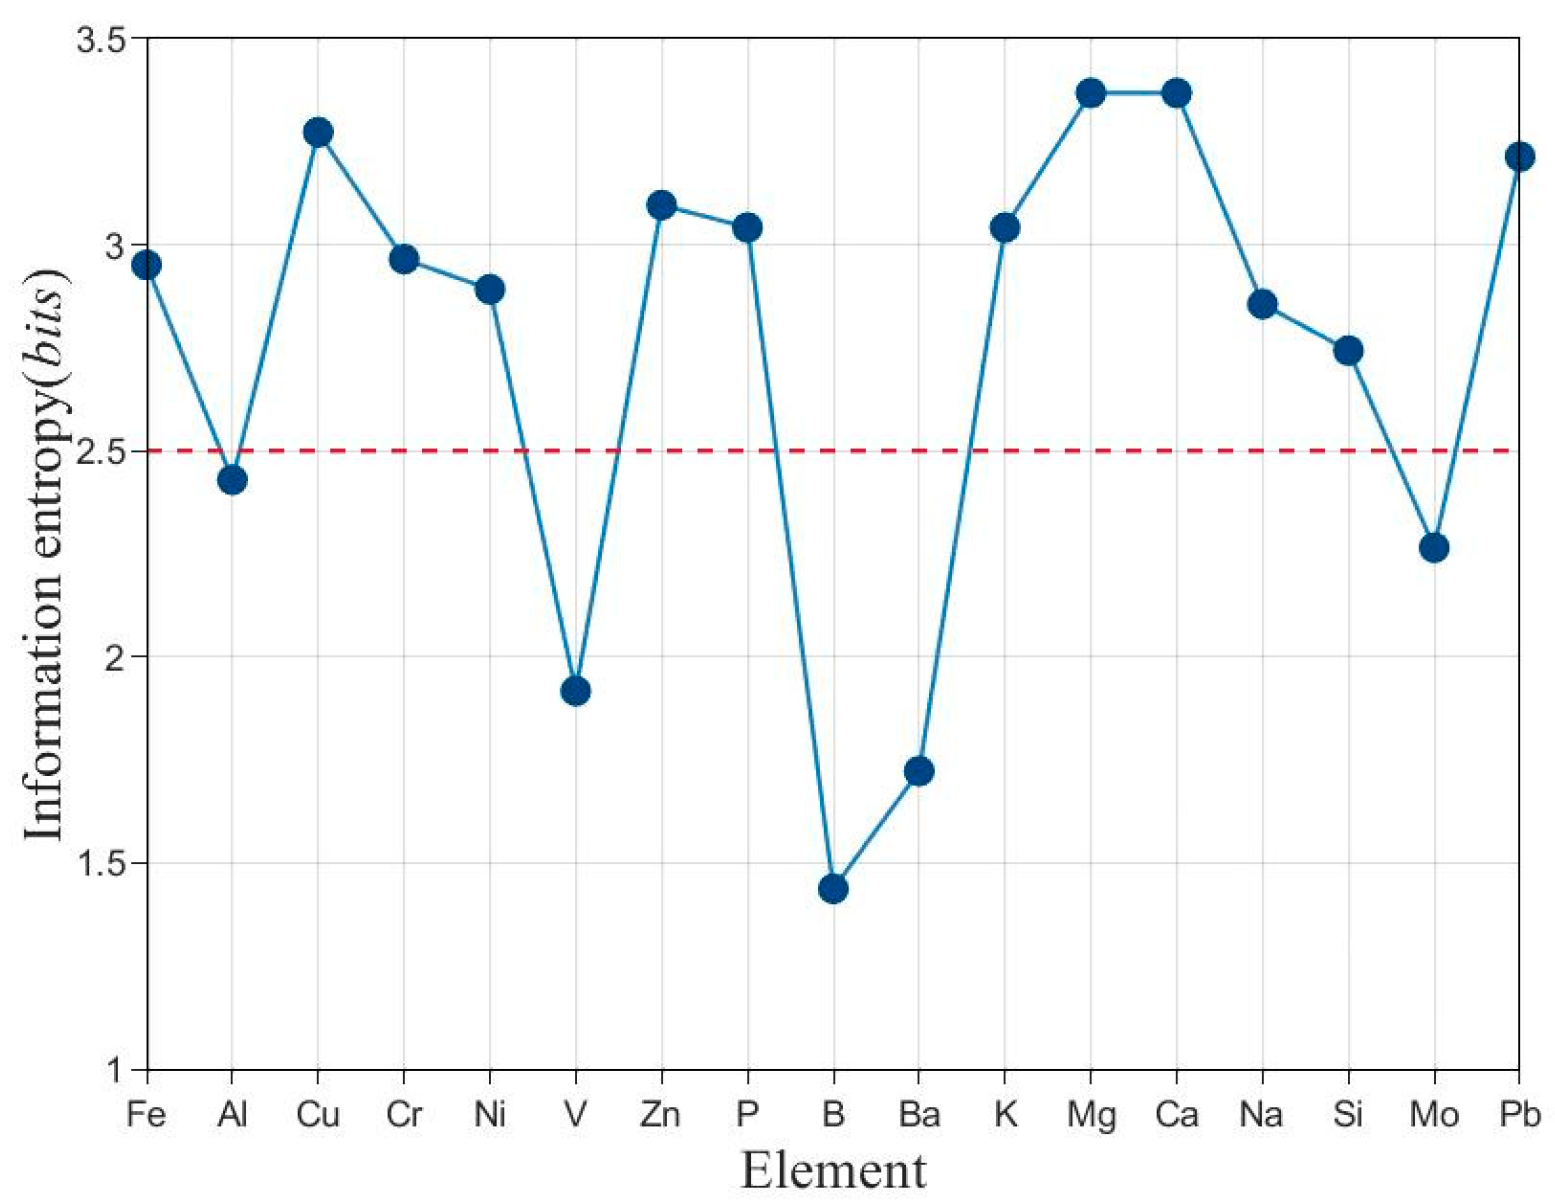
3.1. Information Entropy

As a theory capable of quantifying the information content of variables, information entropy is an effective attribute selection method [25,26,27]. For example, Li et al. [26] proposed the concepts of joint information entropy, conditional information entropy, and mutual information entropy in heterogeneous data decision information systems based on information entropy, and studied the attribute selection algorithm based on information entropy. Sun et al. [27] explored the method of using uncertainty measures based on neighborhood entropy to classify gene expression data. The purpose of this study was to quantify the information content of each element in the oil spectral data by information entropy, to provide a basis for the extraction of characteristic indexes. The formula for calculating information entropy is:
H ( X ) = i = 1 n P ( X i ) log [ P ( X i ) ]
In Equation (1), X represents a random variable; P(Xi) represents the output probability function of the state i; H(X) represents the information entropy of random variable X. The bottom number of the logarithm in Equation (1) can be freely selected. When the bottom number is 2, it is Shannon entropy and the unit of information entropy is bits.
To calculate the information entropy of each element in oil spectrum data, the monitored oil spectrum data are expressed as matrix Z of 17 × 21. zij (I = 1, 2, …, 17; j = 1, 2, …, 21) represents the mass fraction of the element i at time tj. Zi is a 21-dimensional row vector representing the time series vector of the element i. Therefore, Zi’s information entropy is:
H ( Z i ) = j = 1 21 P ( z i j ) log [ P ( z i j ) ]
In Equation (2), P(zij) represents the distribution probability estimated by Zi.
Because the monitoring data are discrete values and there are systematic errors, the information entropy obtained according to Equation (2) cannot well reflect the information content of each element. To solve the above problems, this paper introduces the histogram method. By grouping and sorting the collected data, the frequency distribution histogram is drawn, and then the distribution probability of each grouping data and the information entropy of variables are calculated. The information entropy of each element in the oil spectral data is shown in Figure 3.
It can be seen from Figure 3 that the information entropic value of oil spectrum data of five elements Al, V, B, Ba, and Mo is less than 2.5 bits. It shows that these five elements do not change significantly during the use of engine lubricant and cannot well reflect the deterioration process of engine oil.

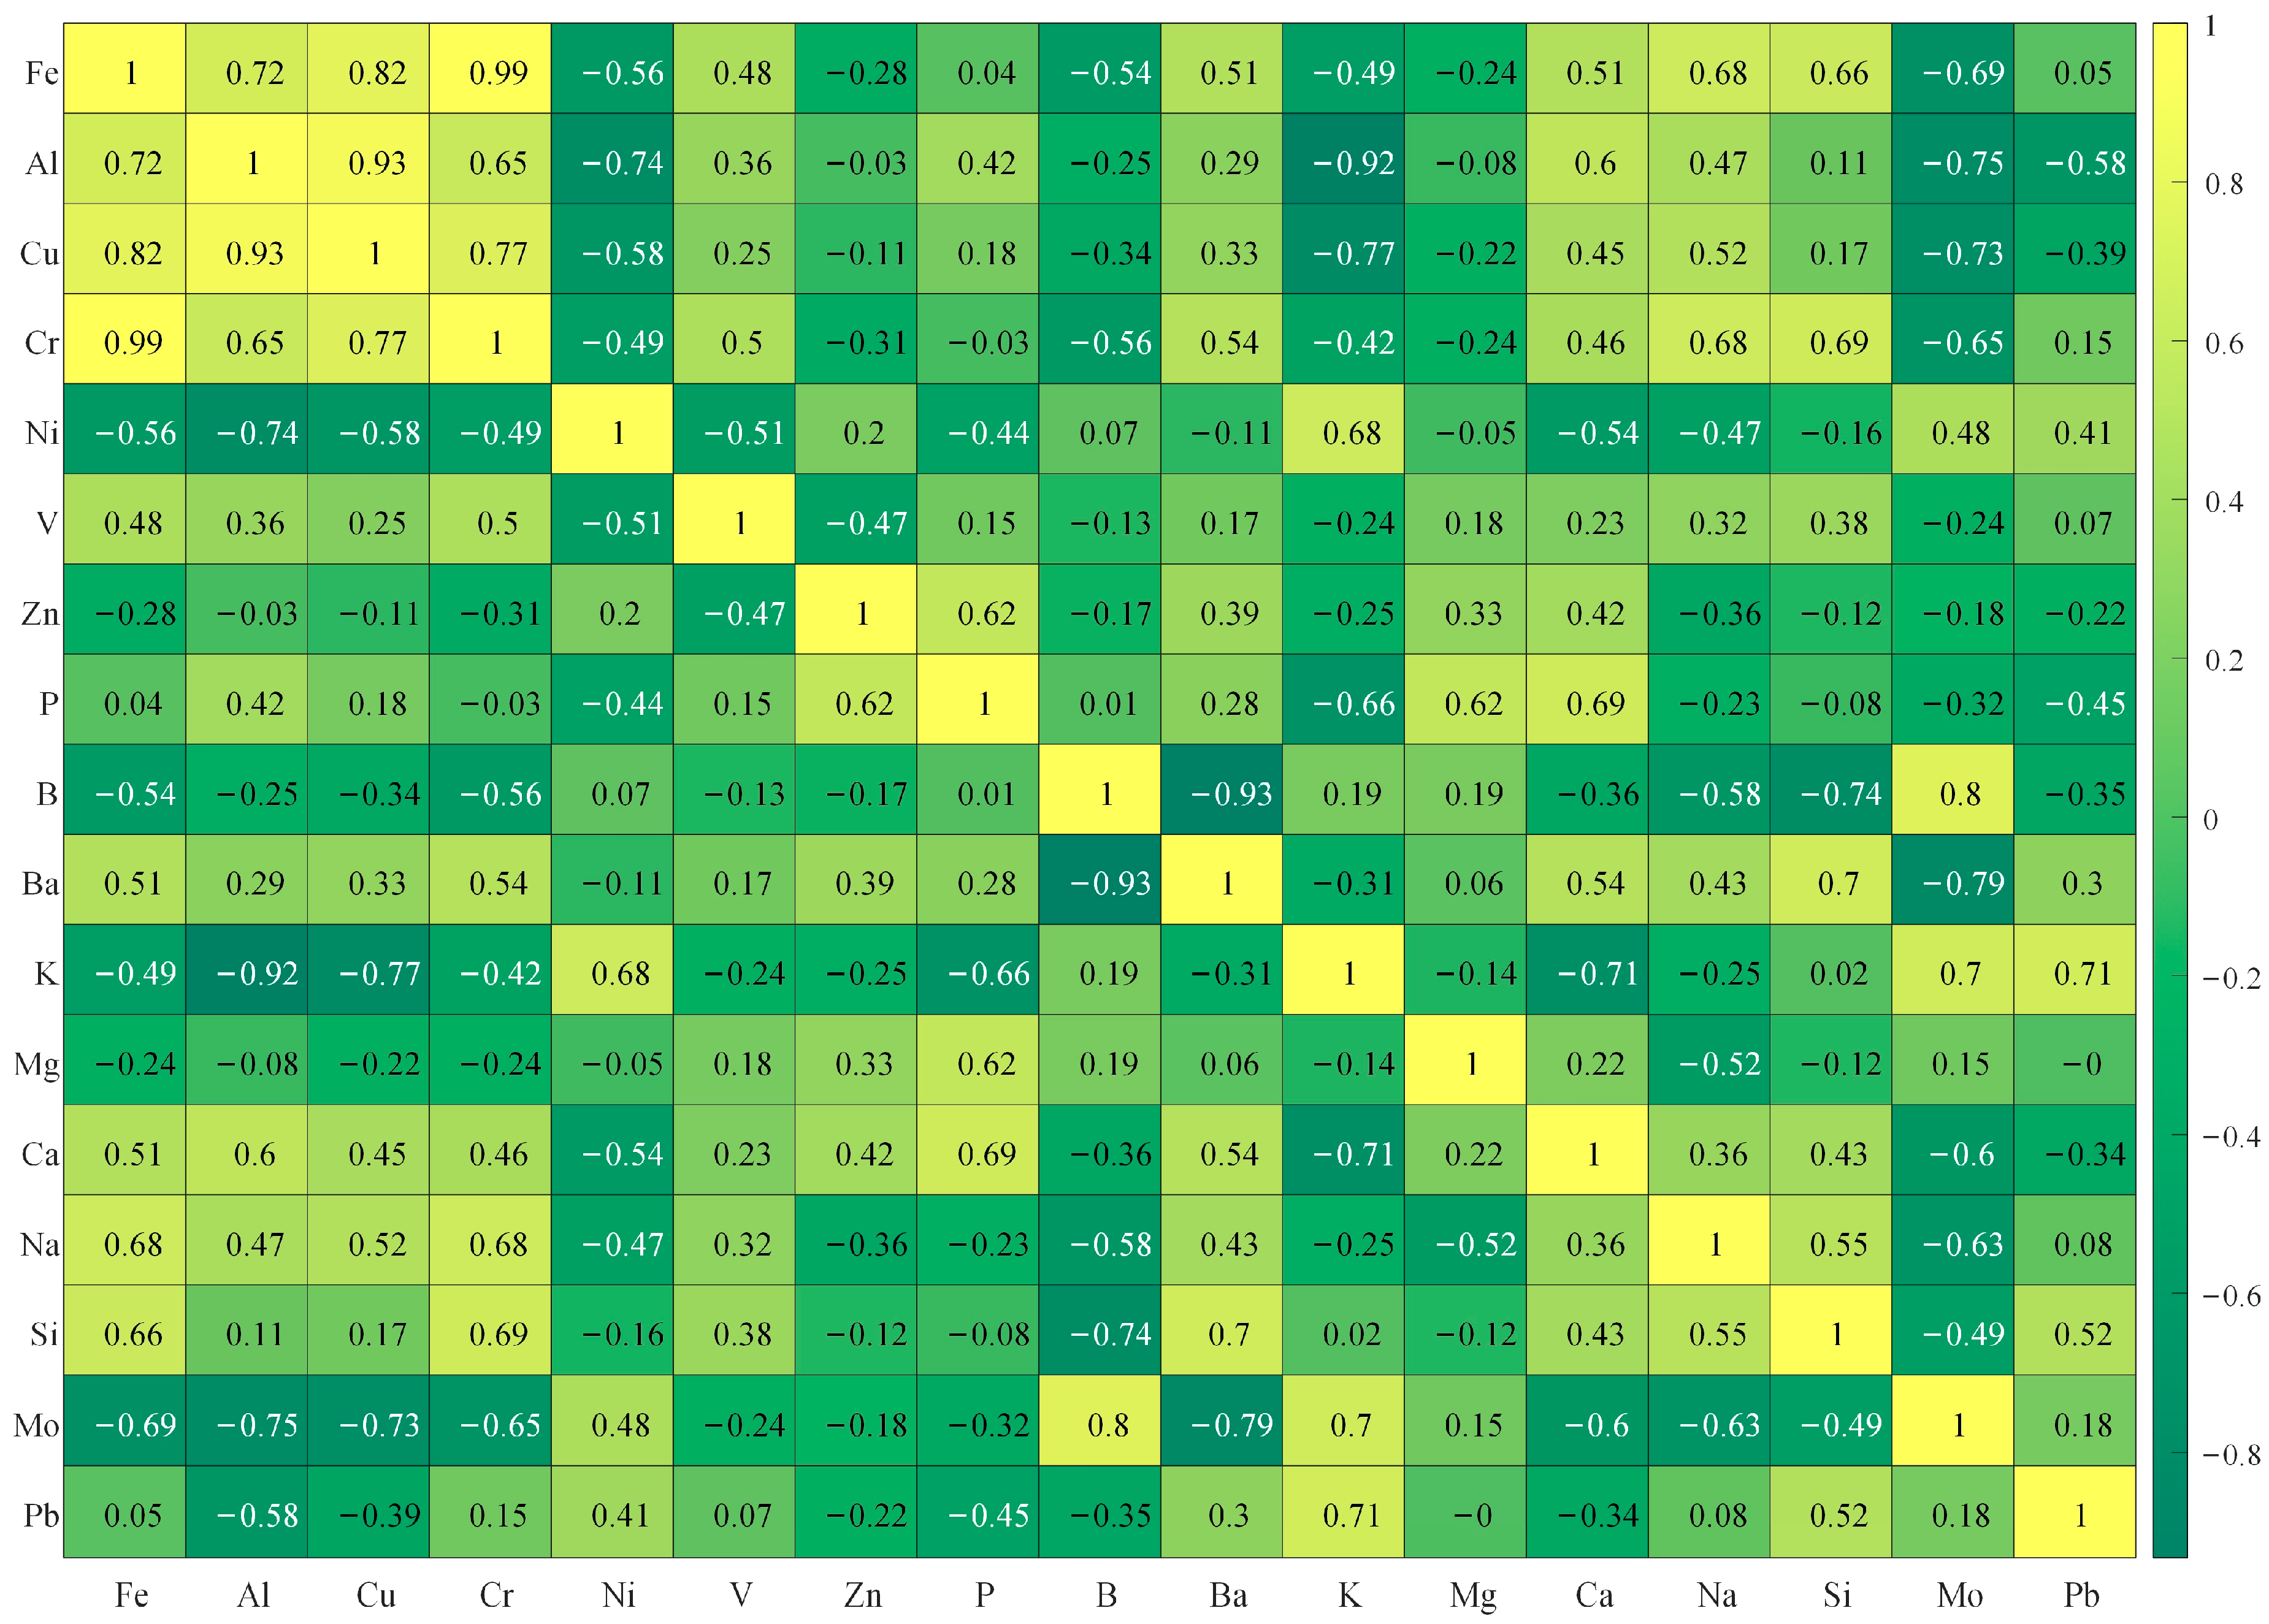
3.2. Correlation Analysis

To explore the relationship between various elements in the oil spectral data, it is necessary to carry out correlation analysis on each element variable. In this paper, Pearson product-moment correlation coefficients (PCCs) are used. PCCs between two variables are defined as the quotient of covariance and standard deviation between the two variables:
ρ X , Y = cov ( X , Y ) σ X σ Y = E [ ( X μ X ) ( Y μ Y ) ] σ X σ Y
In Equation (3), ρ represents the overall correlation coefficient between X and Y variables.
The PCCs between the two variables can be estimated by estimating the covariance and standard deviation of the sample:
r X , Y = i = 1 n [ ( X i X ¯ ) ( Y i Y ¯ ) ] i = 1 n ( X i X ¯ ) 2 i = 1 n ( Y i Y ¯ ) 2
In Equation (4), r represents the estimated PCCs based on the sample.
Replace X and Y in Equation (4) with the observed values of Zi and Zj (i, j = 1, 2, …, 17) of the two elements in the oil spectral data to obtain the PCCs between the two elements in the oil spectral data. The PCCs of each element in oil spectral data are shown in Figure 4.
As shown in Figure 4, there are highly correlated element variables in the oil spectral data: Fe and Cr, Fe and Cu, Al and Cu, B and Ba, B, and Mo, and Al and K. Elemental variables with strong correlation are Fe and Al, Fe and Na, Al and Cr, Cu and Cr, Cr and Na, Cr and Si, Ni and K, P and Mg, P and Ca, Ba and Si, K and Mo, K and P, Fe and Mo, Al and Ni, Cu and K, Cu and Mo, Cr and Mo, P and K, B and Si, Ba and Mo, K and Ca, and Mo, Na and Mo. It should be noted that when PCCs are negative, the correlation between the two variables is negative.
According to Equations (1)–(4), information entropy discusses the amount of information contained in an element over time, whereas correlation analysis studies the relationship between two elements.

3.3. Potential Source of The Main Elements in Used Lubricating Oil

Engine oil consists mainly of base oil and additives. Base oil is the main component of lubricating oil and determines the basic properties of lubricating oil, which is mainly divided into a mineral base oil, synthetic base oil, and biological base oil, including alkanes, naphthenes, and aromatics [7,28]. Additives are widely used in lubricating oil, which can improve or increase the performance of base oil. Therefore, lubricating oil itself contains a large number of metallic and non-metallic elements. During use, engine oil is affected by various factors, such as oxidation, nitrification, and pollutant invasion, and the element content in lubricating oil will also increase or decrease. It is helpful to study the deterioration process of lubricating oil by studying the sources of various elements in lubricating oil. For example, a significant increase in the concentration of pollutant elements indicates that foreign substances may be mixed into the lubricating oil. The elements in used lubricants generally come from three sources, namely, the contribution of lubricant additive components, the invasion of external pollutants, and the contribution of wear during equipment operation. Potential sources of major elements in used lubricants are shown in Table 3.
It can be seen from Table 3 that the six elements Fe, Al, Cu, Cr, Ni, and V mainly come from wear. The four elements Zn, P, B, and Ba mainly come from lubricant additives. The seven elements K, Mg, Ca, Na, Si, Mo, and Pb may come from not only lubricant additives, but also wear or contamination intrusion.
To further observe the changing trend of each element in the lubricant, we have drawn the changing trend of each element contained in the lubricant, as shown in Figure 5.
As can be seen from Figure 5, with the change of time, wear metal elements mostly show an upward trend, additive elements mostly show a downward trend, and the changing trend of comprehensive elements is uncertain.

3.4. Feature Selection

This paper will combine the information entropy, correlation, and potential sources of each element in the oil spectral data to comprehensively select the indicators for establishing the RUL prediction model of lubricating oil. In combination with the above factors, 12 elements Fe, Cu, Cr, Ni, Zn, P, K, Mg, Ca, Na, Si, and Pb are selected as the oil quality indexes. The specific reasons are as follows:
  • The average mass fraction of V and Ba elements is less than 1 μg·g−1, which has little effect on the quality change of lubricating oil;
  • The information entropic value of oil spectrum data of five elements Al, V, B, Ba, and Mo is less than 2.5 bits, so these five elements cannot reflect the deterioration process of engine oil very well;
  • The five elements Al, V, B, Ba, and Mo can be reflected by other elements with very strong correlation or strong correlation;
  • The 12 elements Fe, Cu, Cr, Ni, Zn, P, K, Mg, Ca, Na, Si, and Pb can completely reflect the changes of wear particles, additives, and pollutants in lubricating oil.

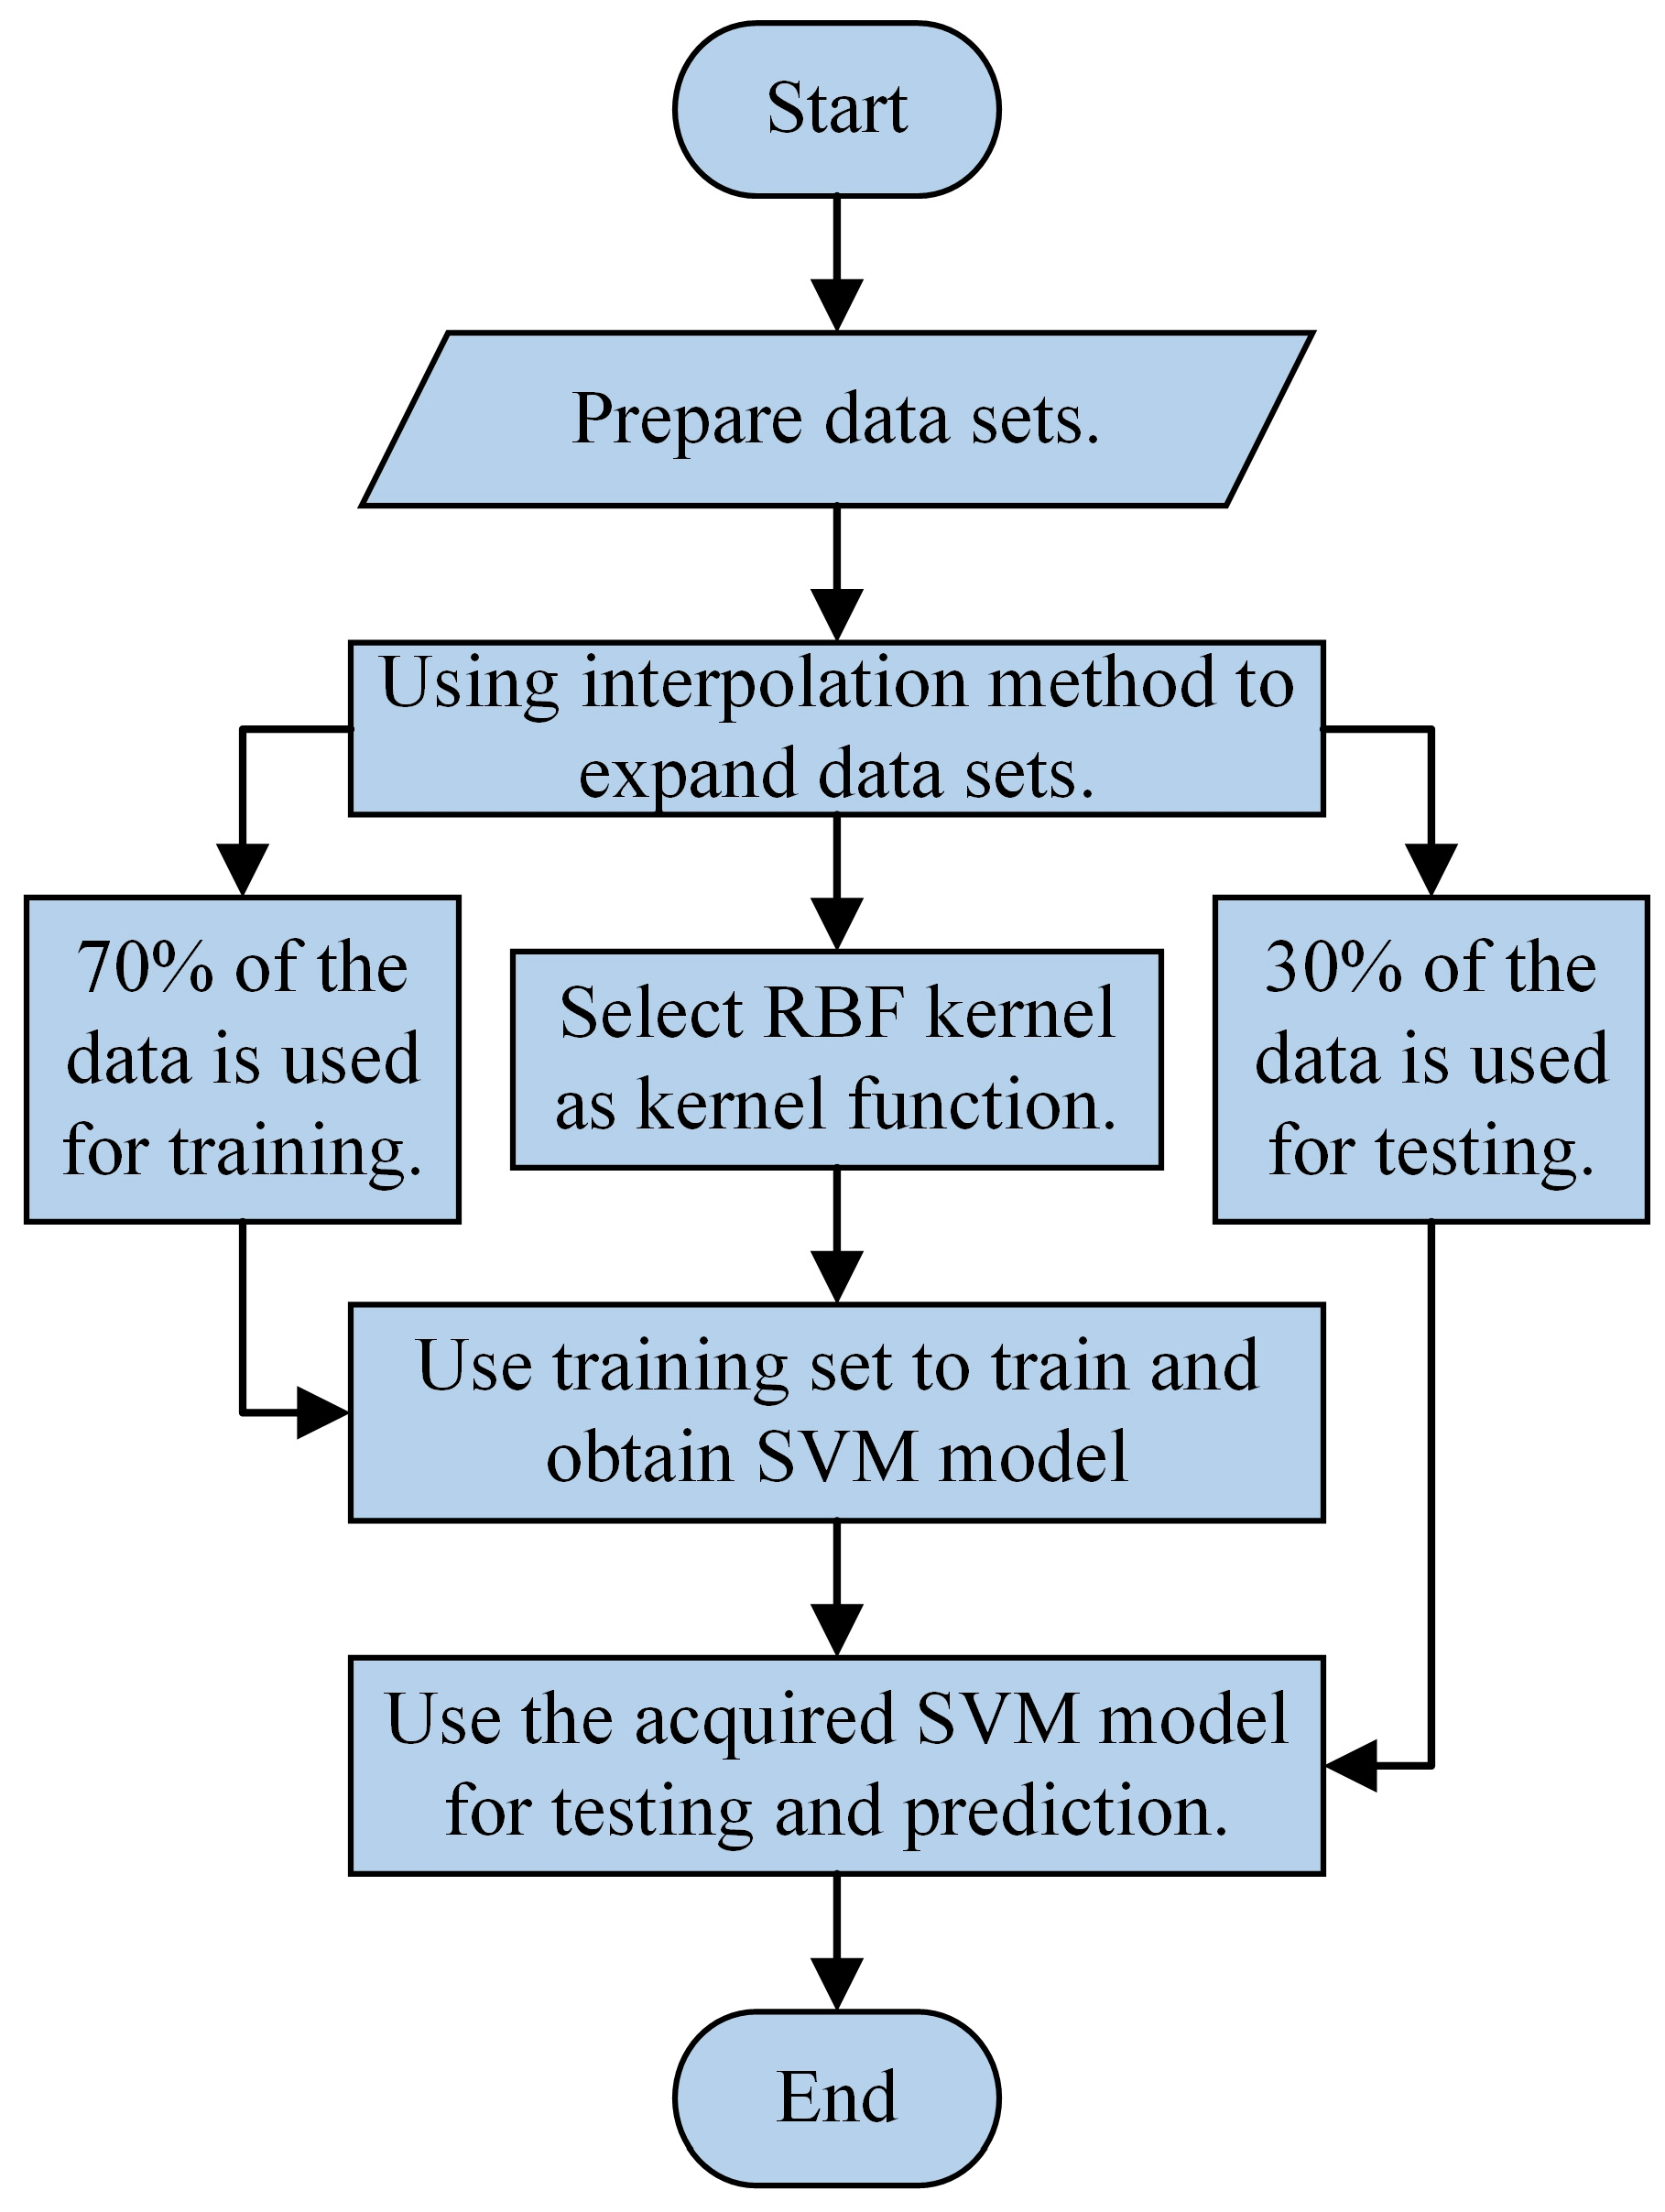
4. RUL Prediction of Lubricating Oil Based on SVM

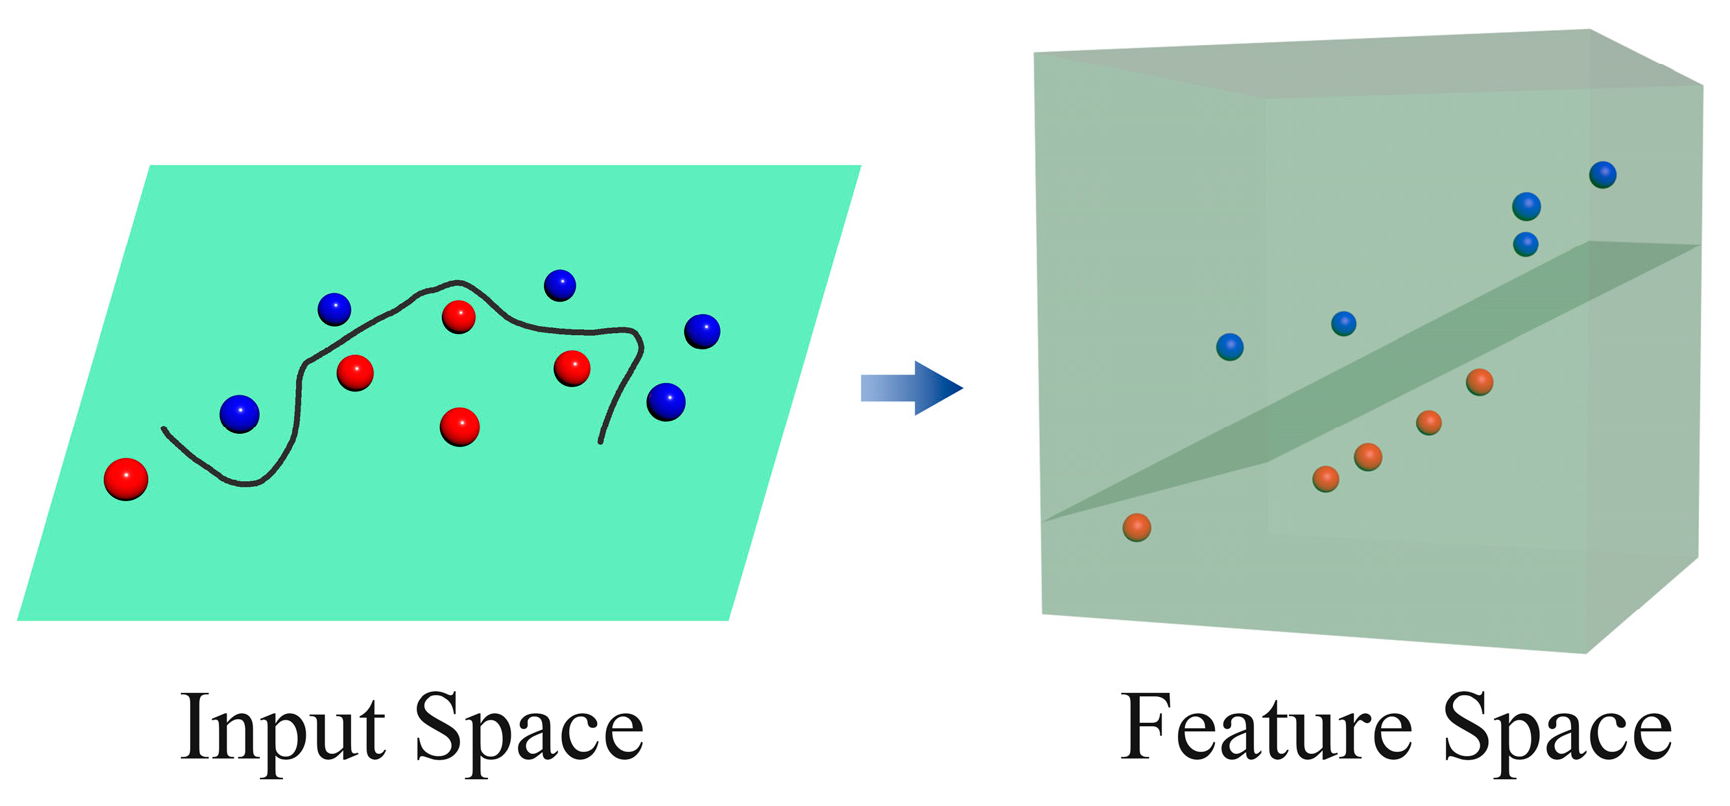
4.1. Principle of SVM

With the wide application of neural network technology, support vector machine (SVM) is one of the most influential methods in supervised learning, which is mainly used to find the optimal solution for data classification [29,30]. As a generalized linear classifier, SVM comprehensively considers the empirical risk and structural risk minimization and uses the optimal classification surface method to divide the linearly separable data samples [31,32].
As shown in Figure 6, in the classification of two-dimensional space, many lines can distinguish two types of points. Which line is the optimal decision boundary? Obviously, the distance between the nearest point to the decision boundary and the decision boundary is as far as possible. This is the maximum interval method. The point closest to the decision boundary is called the support vector.
SVM is a linear classifier, but the problems we encounter in reality are mostly nonlinear. To solve the problem of non-linear classification, SVM introduces Kernel Methods (KMs), which enhance the dimension of data characteristics so that data can be separated by a hyperplane. The basic principle of KMs is shown in Figure 7.
The commonly used kernel functions include the polynomial kernel function, radial basis kernel function (RBF), Laplace kernel function, etc. In this paper, the widely used RBF is selected as the kernel function, and its expression is:
K ( x i , x j ) = exp ( x i x j 2 2 σ 2 )
In Equation (5), xi and xj represent the eigenvectors of the input space; ||xi − xj||2 represents the square Euclidean distance between two eigenvectors; σ is a free parameter that represents the action width of the RBF.

4.2. Lubricating Oil RUL Prediction Model

Based on the above theory, we used MATLAB software to establish an SVM model which could realize the prediction of lubricating oil RUL. RBF was selected as the kernel function in the SVM model. To verify the influence of oil data selection on oil RUL prediction, data before and after parameter screening were used as input variables of SVM. Due to the small amount of oil data measured, to improve the performance of SVM, the interpolation method was used to expand the data set, and all the data were normalized. According to the use time of lubricating oil, the lubricating oil was divided into three states, and the data set was labeled. In the data set, 70% of the data were used for training and 30% for testing. Then, the training set was used to train and obtain the SVM model. Finally, the obtained SVM model was used to test and predict. The establishment process of the lubricating oil RUL prediction model is shown in Figure 8. To evaluate the performance of the SVM model intuitively, the test and prediction results of the SVM model were visualized.

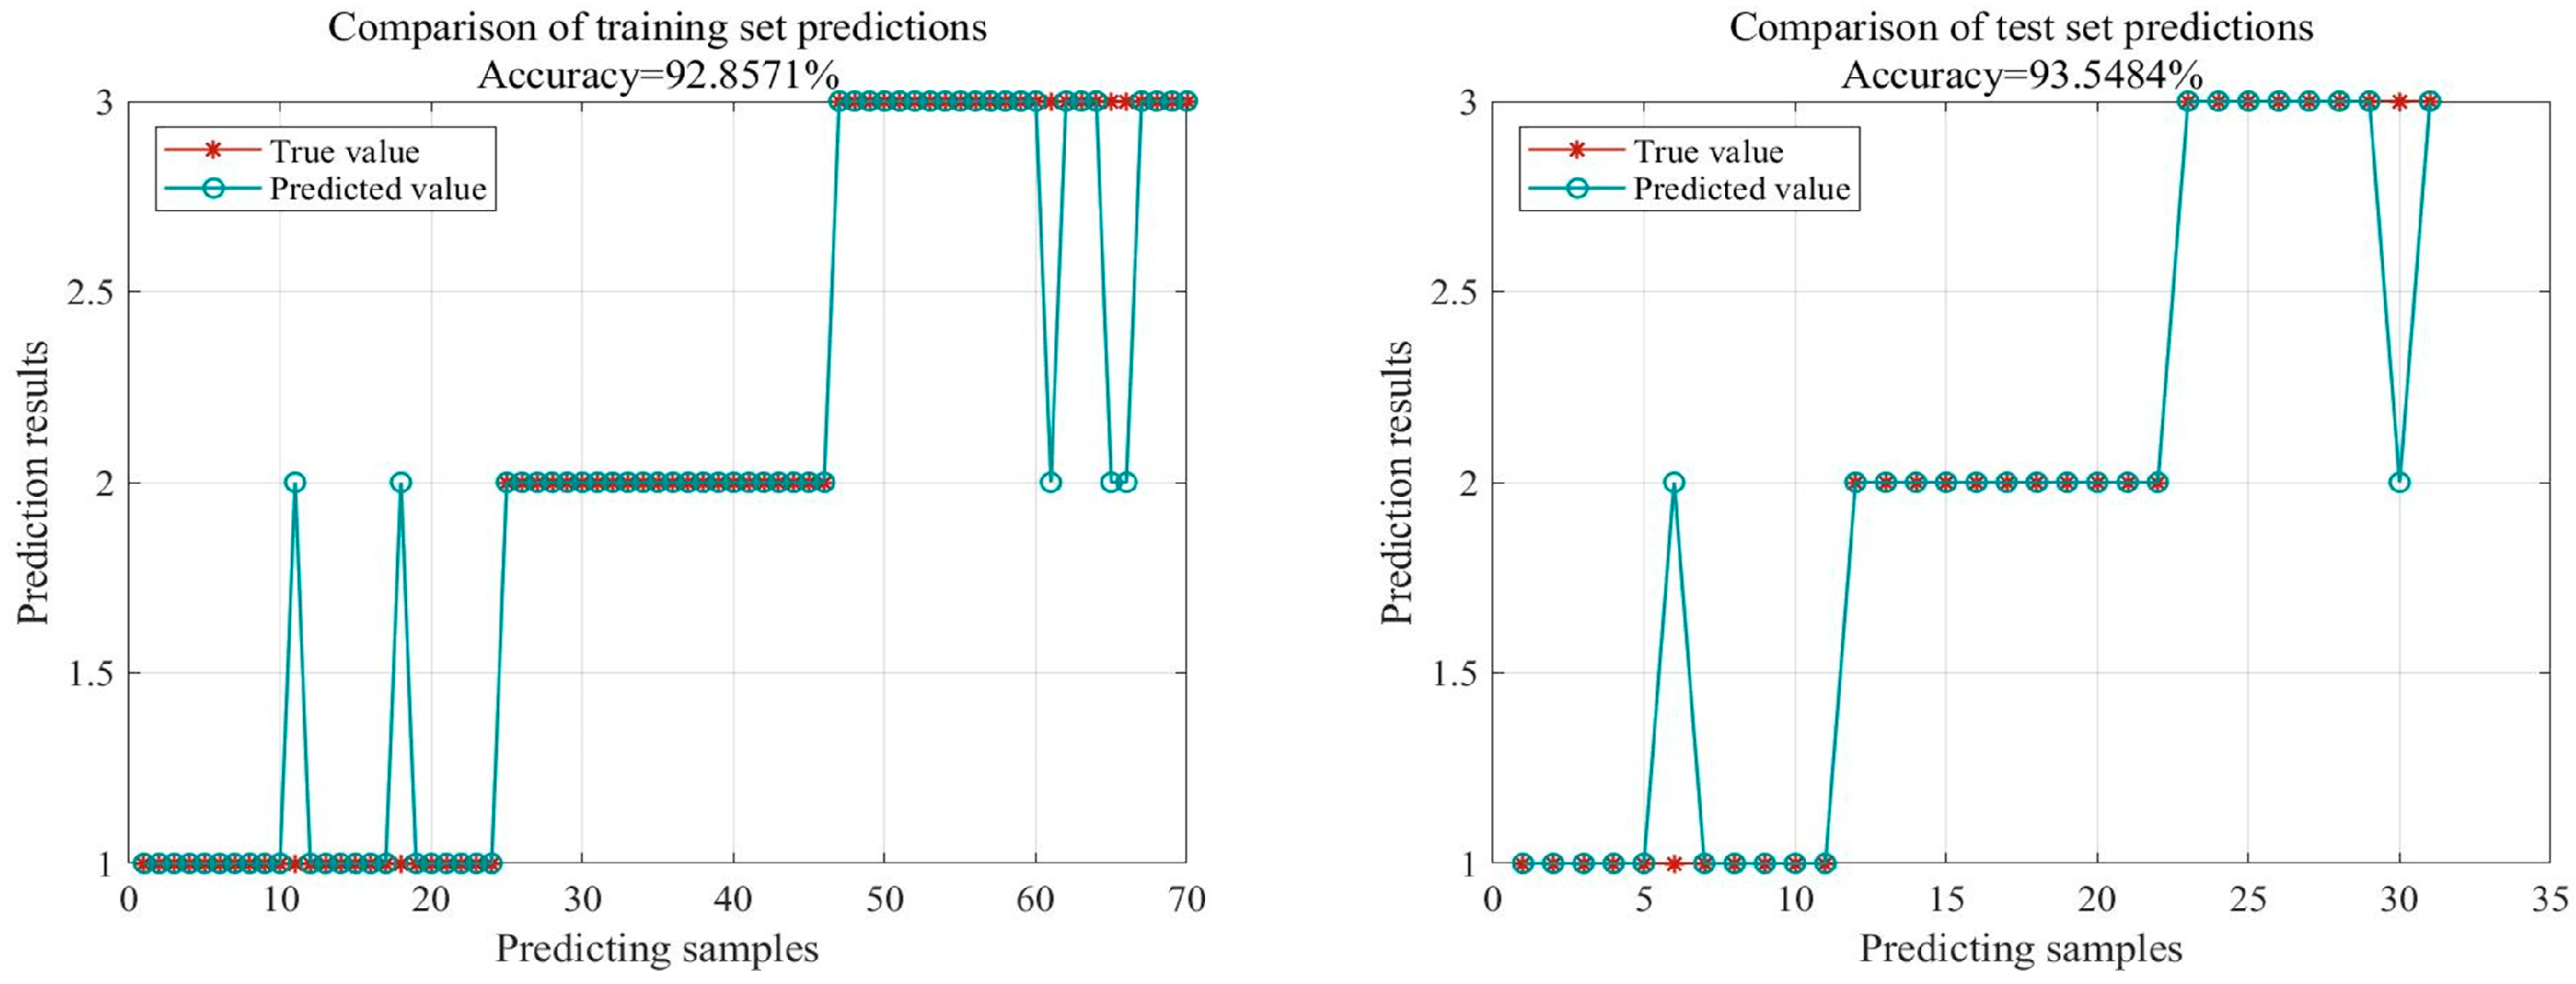
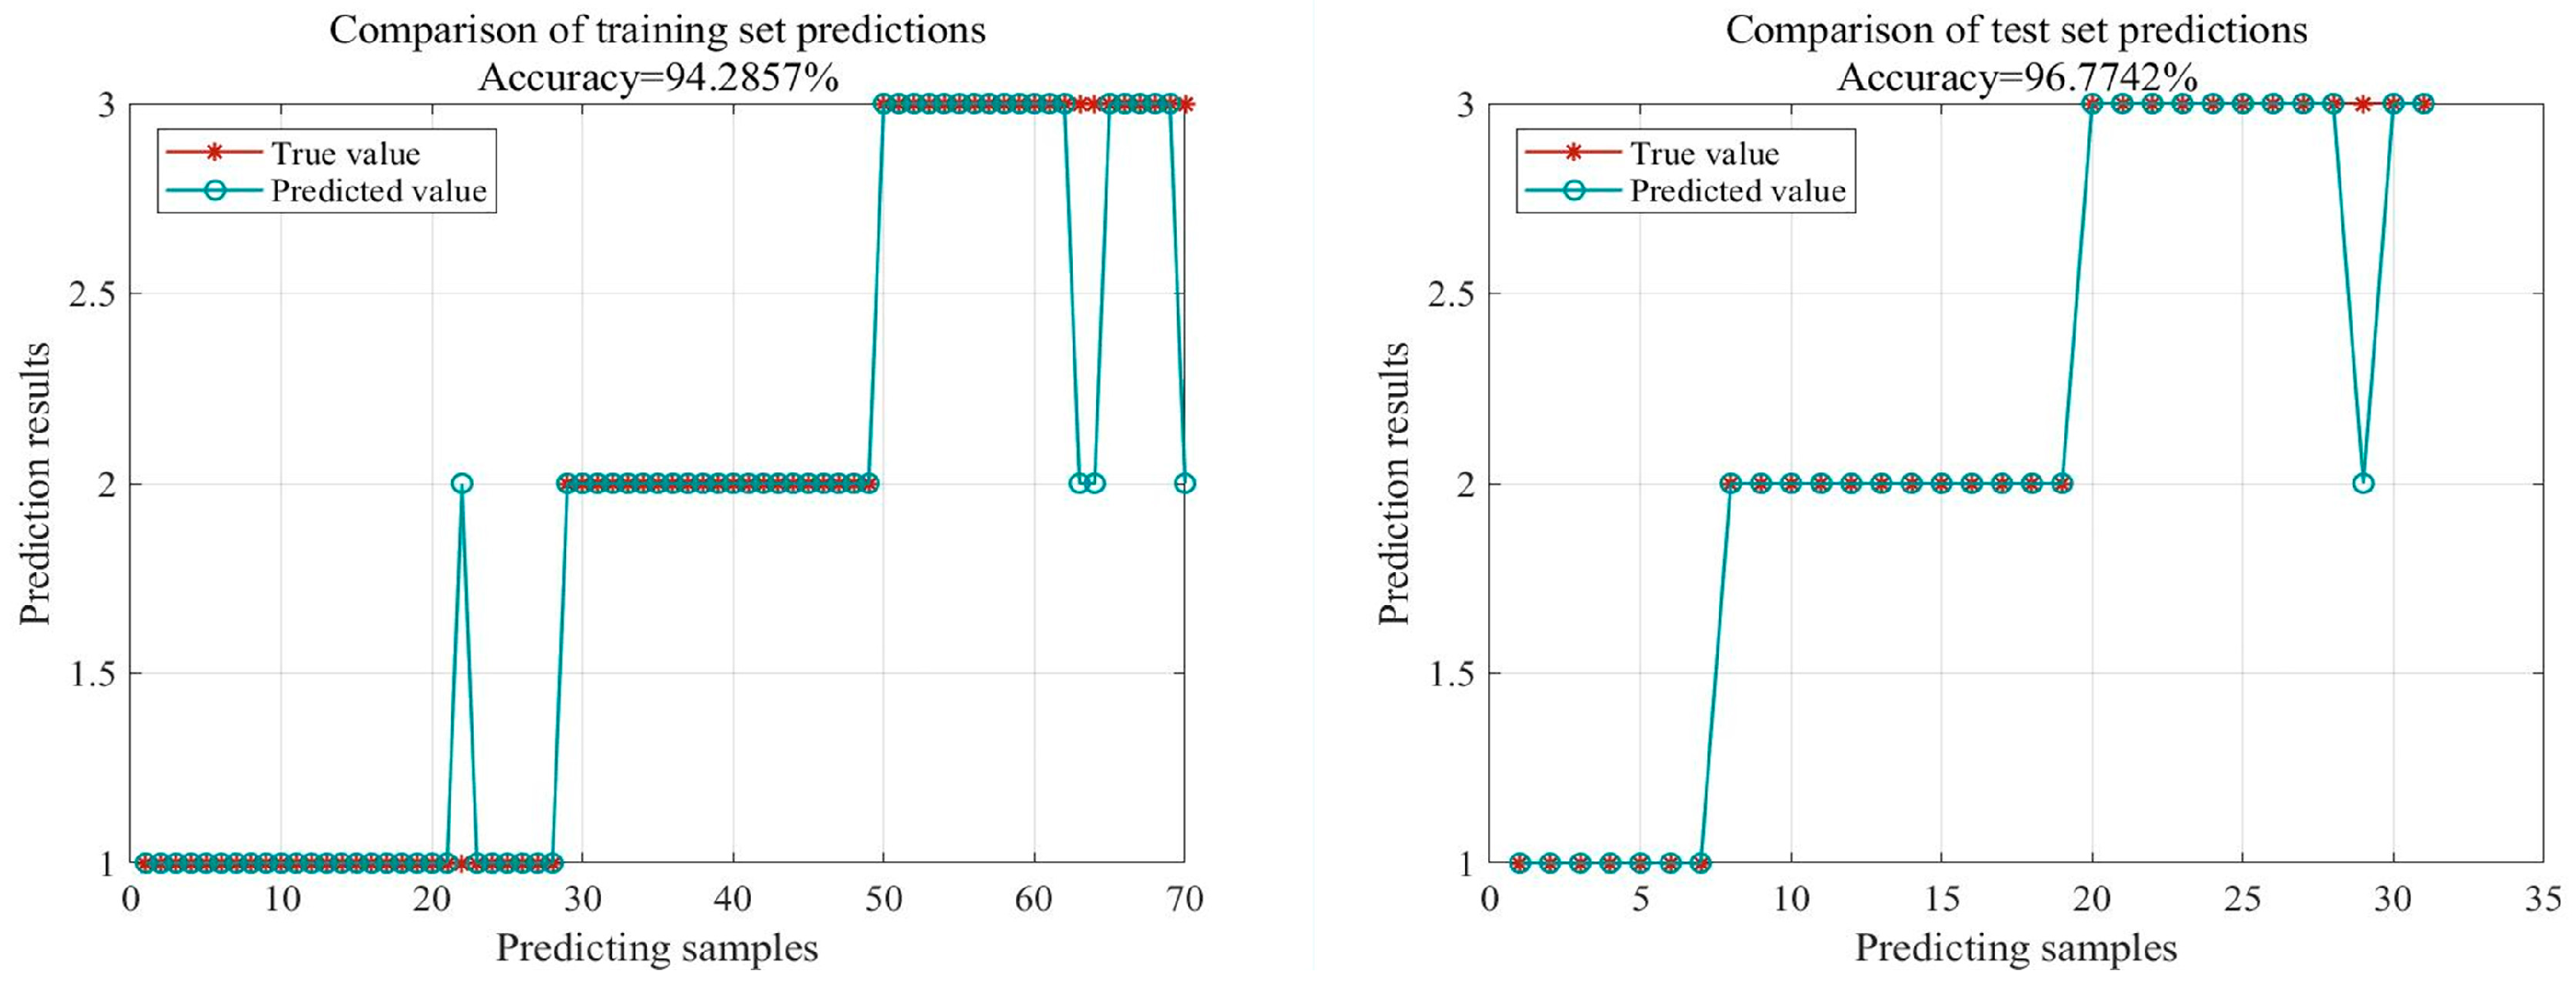
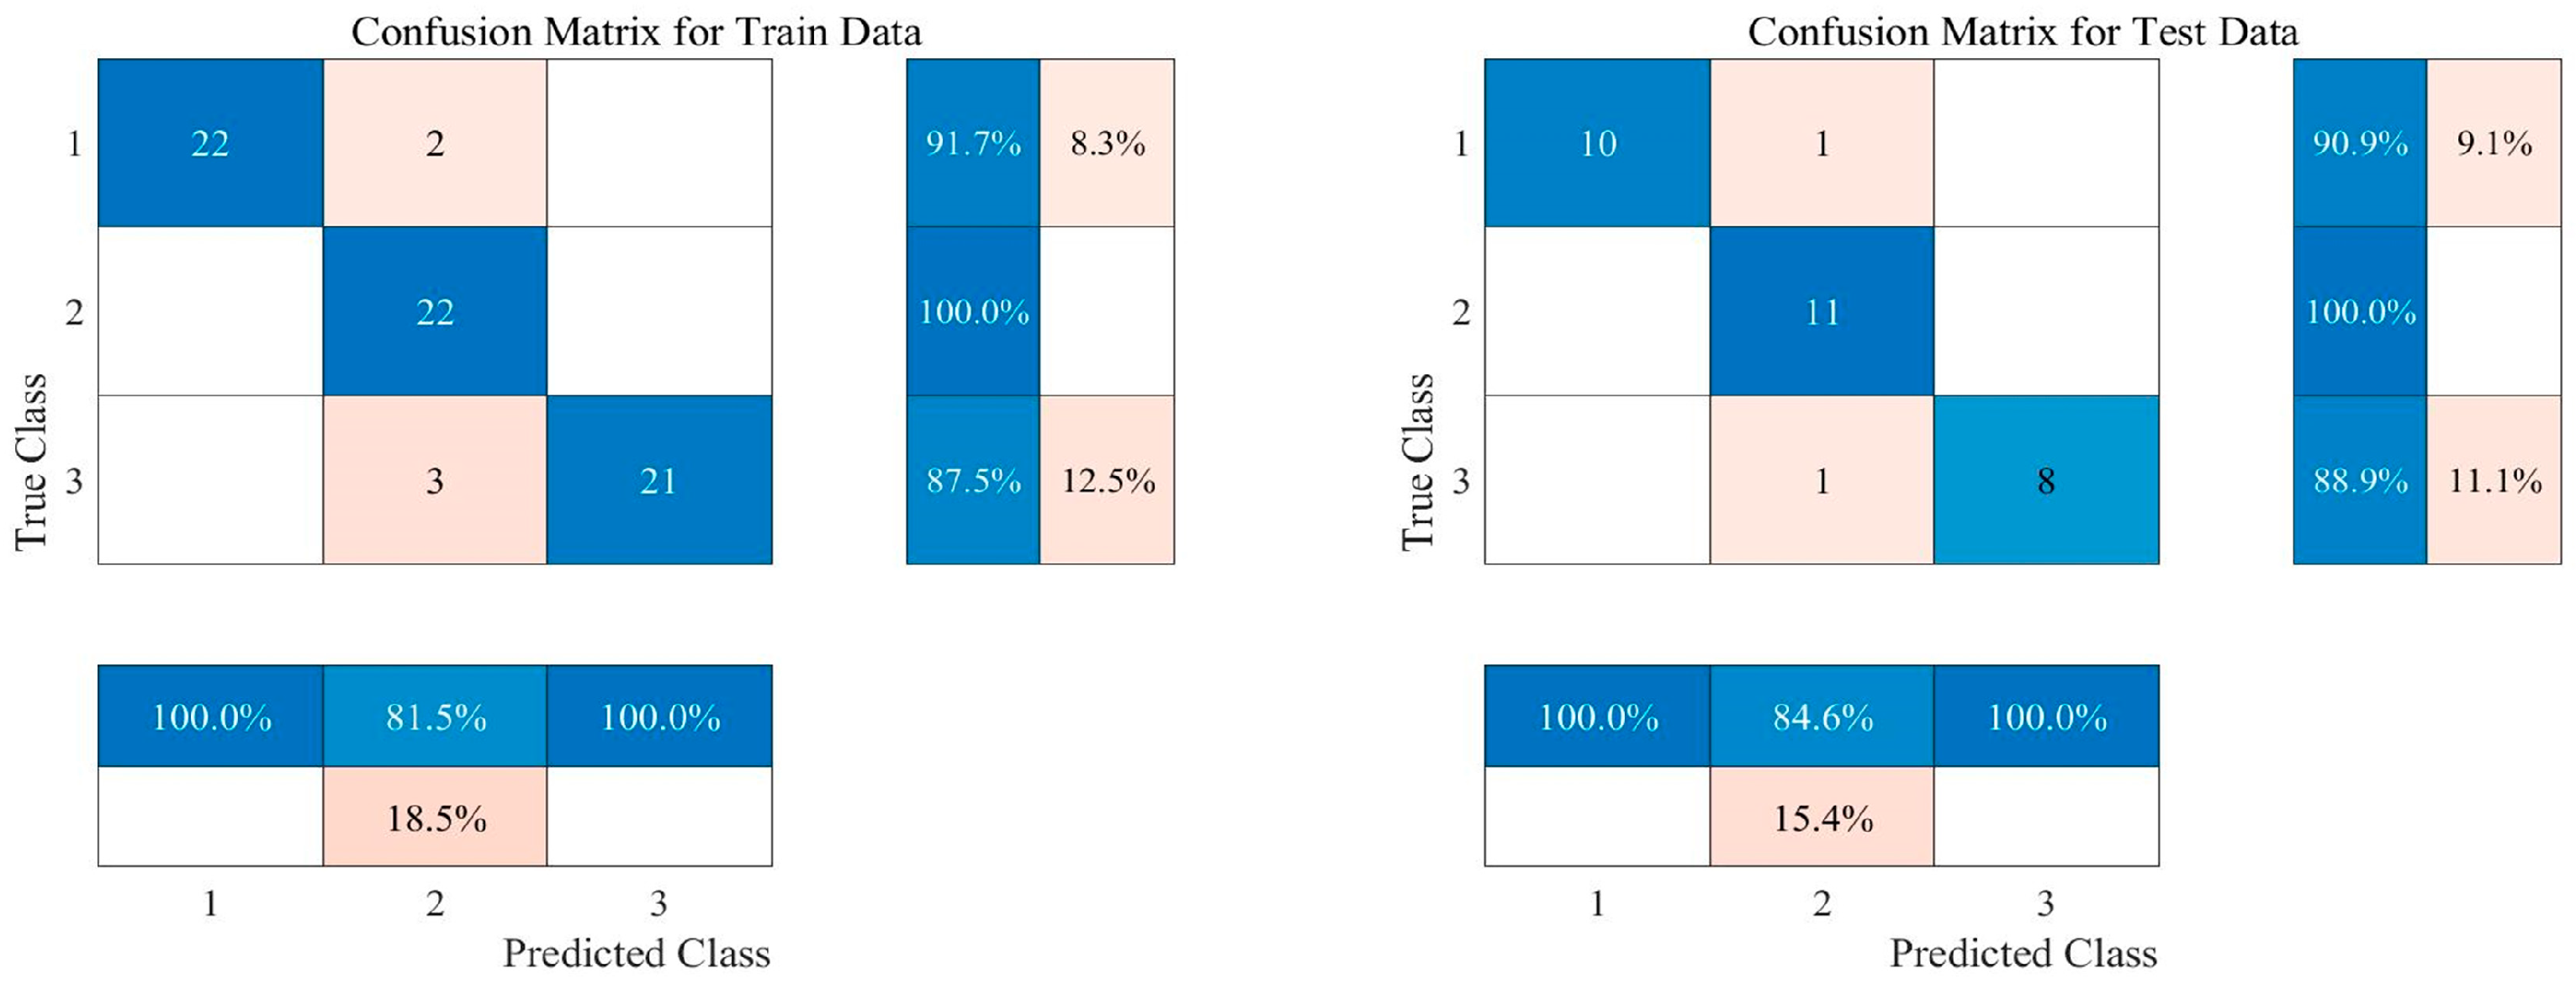
5. Results and Discussions

The training results were visualized to evaluate the SVM model’s performance. Figure 9 shows the prediction results before parameter screening. The accuracy of the training set is 92.8571%, and the accuracy of the test set is 93.5484%. Figure 10 shows the prediction results after parameter screening. The accuracy of the training set is 94.2857%, and the accuracy of the test set is 96.7742%. It can be seen that there is a certain deviation between the experimental data and the relevant output. By comparison, the accuracy of the training set and the test set has been improved after parameter screening compared with that before parameter screening.
To further observe the performance of the SVM model, the confusion matrix of the training results is made, as shown in Figure 11 and Figure 12. First, observe the confusion matrix obtained before parameter screening, and the prediction accuracy of the three stages of the RUL training set of lubricating oil is 91.7%, 100%, and 87.5% respectively, and the prediction accuracy of the test set is 90.9%, 100%, and 88.9% respectively. Then observe the confusion matrix obtained after parameter screening, and the prediction accuracy of the three stages of the training set of lubricating oil RUL is 96.4%, 100%, and 85.7% respectively, and the prediction accuracy of the test set is 100%, 100%, and 91.7% respectively. It can be seen that in most cases, the accuracy of the SVM model obtained after parameter filtering has been improved.
Through the above analysis, it can be seen that the prediction accuracy of the RUL prediction model based on SVM has been improved after parameter screening. Moreover, after parameter filtering, the amount of input data is greatly reduced, which can help to improve the training efficiency of the SVM model. The results show that the comprehensive parameter selection method proposed in this paper, based on information entropy, correlation analysis, and lubricant deterioration process, is effective.

6. Conclusions

This paper studies the prediction of lubricant RUL based on CM data. First, the spectral data of used lubricants were obtained by RDE-AES, and the mass fractions of 17 elements in used lubricants were obtained. In this study, a comprehensive parameter selection method was first proposed. Through comprehensive analysis of information entropy, correlation, and deterioration process of oil data, 12 elements were selected from 17-dimensional spectral data as quality indicators for RUL prediction of lubricant. Then, an SVM model was designed to predict the RUL of the lubricant. The 17-dimensional oil data before parameter screening and 12-dimensional oil data after parameter screening were used as input variables, and the three types of state of lubricant were used as output variables. The comparison between the experiment and the related output showed that the accuracy of the SVM model established after parameter filtering had been significantly improved. Moreover, after parameter filtering, the amount of input data was reduced and the training efficiency of the SVM model was improved. Therefore, the comprehensive parameter selection method based on information Entropy, correlation analysis, and lubricant deterioration process was feasible. Compared with parameter selection based on experience, the parameter selection method proposed in this study has more operability and generalization.

Author Contributions

Conceptualization, Z.L., D.W. and H.W.; methodology, Z.L., D.W. and H.W.; software, Z.L.; validation, Z.L. and D.W.; formal analysis, Z.L. and D.W.; investigation, Z.L.; resources, D.W. and H.W; data curation, Z.L. and M.H.; writing—original draft preparation, Z.L.; writing—review and editing, D.W.; visualization, Z.L.; supervision, H.W.; project administration, D.W.; funding acquisition, H.W. All authors have read and agreed to the published version of the manuscript.

Funding

This research was funded by the National Natural Science Foundation of China, grant 50705097.

Data Availability Statement

The data used to support the findings of this study are included in the manuscript.

Conflicts of Interest

The authors declare no conflict of interest.

References

  1. Rodrigues, J.; Cost, I.; Farinha, J.T.; Mendes, M.; Margalho, L. Predicting motor oil condition using artificial neural networks and principal component analysis. Eksploat. Niezawodn.—Maint. Reliab. 2020, 22, 440–448. [Google Scholar] [CrossRef]
  2. de M. Bezerra, A.C.; de A. Coelho, N.M.; Bertelli, F.; Pacheco, M.T.T.; Silveira, L., Jr. Temperature-Induced Chemical Changes in Lubricant Automotive Oils Evaluated Using Raman Spectroscopy. Appl. Spectrosc. 2021, 75, 145–155. [Google Scholar] [CrossRef] [PubMed]
  3. Shu, G.; Dong, L.; Liang, X. A review of experimental studies on deposits in the combustion chambers of internal combustion engines. Int. J. Engine Res. 2012, 13, 357–369. [Google Scholar] [CrossRef]
  4. Raposo, H.; Farinha, J.T.; Fonseca, I.; Galar, D. Predicting condition based on oil analysis—A case study. Tribol. Int. 2019, 135, 65–74. [Google Scholar] [CrossRef]
  5. Du, Y.; Wu, T.; Makis, V. Parameter estimation and remaining useful life prediction of lubricating oil with HMM. Wear 2017, 376–377, 1227–1233. [Google Scholar] [CrossRef]
  6. Dörr, N.; Agocs, A.; Besser, C.; Ristić, A.; Frauscher, M. Engine Oils in the Field: A Comprehensive Chemical Assessment of Engine Oil Degradation in a Passenger Car. Tribol. Lett. 2019, 67, 68. [Google Scholar] [CrossRef]
  7. Passoni, D.d.J.; Pacheco, M.T.T.; Silveira, L. Raman spectroscopy for the identification of differences in the composition of automobile lubricant oils related to SAE specifications and additives. Instrum. Sci. Technol. 2020, 49, 164–181. [Google Scholar] [CrossRef]
  8. Kurre, S.K.; Garg, R.; Pandey, S. A review of biofuel generated contamination, engine oil degradation and engine wear. Biofuels 2016, 8, 273–280. [Google Scholar] [CrossRef]
  9. Agocs, A.; Nagy, A.L.; Tabakov, Z.; Perger, J.; Rohde-Brandenburger, J.; Schandl, M.; Besser, C.; Dörr, N. Comprehensive assessment of oil degradation patterns in petrol and diesel engines observed in a field test with passenger cars—Conventional oil analysis and fuel dilution. Tribol. Int. 2021, 161, 107079. [Google Scholar] [CrossRef]
  10. Heredia-Cancino, J.A.; Ramezani, M.; Álvarez-Ramos, M.E. Effect of degradation on tribological performance of engine lubricants at elevated temperatures. Tribol. Int. 2018, 124, 230–237. [Google Scholar] [CrossRef]
  11. Langfitt, Q.; Haselbach, L. Coupled oil analysis trending and life-cycle cost analysis for vessel oil-change interval decisions. J. Mar. Eng. Technol. 2016, 15, 1–8. [Google Scholar] [CrossRef] [Green Version]
  12. Jardine, A.K.S.; Lin, D.; Banjevic, D. A review on machinery diagnostics and prognostics implementing condition-based maintenance. Mech. Syst. Signal Process. 2006, 20, 1483–1510. [Google Scholar] [CrossRef]
  13. Gajewski, J.; Vališ, D. The determination of combustion engine condition and reliability using oil analysis by MLP and RBF neural networks. Tribol. Int. 2017, 115, 557–572. [Google Scholar] [CrossRef]
  14. Wakiru, J.M.; Pintelon, L.; Muchiri, P.N.; Chemweno, P.K. A review on lubricant condition monitoring information analysis for maintenance decision support. Mech. Syst. Signal Process. 2019, 118, 108–132. [Google Scholar] [CrossRef]
  15. Wakiru, J.; Pintelon, L.; Muchiri, P.N.; Chemweno, P.K.; Mburu, S. Towards an innovative lubricant condition monitoring strategy for maintenance of ageing multi-unit systems. Reliab. Eng. Syst. Saf. 2020, 204, 107200. [Google Scholar] [CrossRef]
  16. Fan, B.; Li, B.; Feng, S.; Mao, J.; Xie, Y.-B. Modeling and experimental investigations on the relationship between wear debris concentration and wear rate in lubrication systems. Tribol. Int. 2017, 109, 114–123. [Google Scholar] [CrossRef] [Green Version]
  17. Yan, S.; Ma, B.; Wang, X.; Chen, J.; Zheng, C. Maintenance policy for oil-lubricated systems with oil analysis data. Eksploat. Niezawodn.—Maint. Reliab. 2020, 22, 455–464. [Google Scholar] [CrossRef]
  18. Sejkorová, M.; Kučera, M.; Hurtová, I.; Voltr, O. Application of FTIR-ATR Spectrometry in Conjunction with Multivariate Regression Methods for Viscosity Prediction of Worn-Out Motor Oils. Appl. Sci. 2021, 11, 3842. [Google Scholar] [CrossRef]
  19. Zzeyani, S.; Mikou, M.; Naja, J.; Elachhab, A. Spectroscopic analysis of synthetic lubricating oil. Tribol. Int. 2017, 114, 27–32. [Google Scholar] [CrossRef]
  20. Zhou, F.; Yang, K.; Li, D.; Shi, X. Acid Number Prediction Model of Lubricating Oil Based on Mid-Infrared Spectroscopy. Lubricants 2022, 10, 205. [Google Scholar] [CrossRef]
  21. Evans, E.H.; Pisonero, J.; Smith, C.M.M.; Taylor, R.N. Atomic spectrometry update: Review of advances in atomic spectrometry and related techniques. J. Anal. At. Spectrom. 2020, 35, 830–851. [Google Scholar] [CrossRef]
  22. Wang, Z.; Wang, X.; Wang, Q.; Xiong, X.; Luo, H.; Huang, K. Recent developments in chemical vapor generation atomic spectrometry for zinc detection. Microchem. J. 2019, 149, 104052. [Google Scholar] [CrossRef]
  23. D6595-17; Standard Test Method for Determination of Wear metals and Contaminants in Used Lubricating Oils or Used Hydraulic Fluids by Rotating Disc Electrode Atomic Emission Spectrometry. ASTM: West Conshohocken, PA, USA, 2017.
  24. Shannon, C.E. A Mathematical Theory of Communication. Bell System Tech. J. 1948, 27, 379–423. [Google Scholar] [CrossRef] [Green Version]
  25. Xing, X. Physical entropy, information entropy and their evolution equations. Sci. China Ser. A Math. 2001, 44, 1331–1339. [Google Scholar] [CrossRef]
  26. Li, Z.; Qu, L.; Zhang, G.; Xie, N. Attribute selection for heterogeneous data based on information entropy. Int. J. Gen. Syst. 2021, 50, 548–566. [Google Scholar] [CrossRef]
  27. Sun, L.; Zhang, X.; Qian, Y.; Xu, J.; Zhang, S. Feature selection using neighborhood entropy-based uncertainty measures for gene expression data classification. Inf. Sci. 2019, 502, 18–41. [Google Scholar] [CrossRef]
  28. Sejkorová, M.; Hurtová, I.; Jilek, P.; Novák, M.; Voltr, O. Study of the Effect of Physicochemical Degradation and Contamination of Motor Oils on Their Lubricity. Coatings 2021, 11, 60. [Google Scholar] [CrossRef]
  29. Ding, S.; Zhu, Z.; Zhang, X. An overview on semi-supervised support vector machine. Neural Comput. Appl. 2015, 28, 969–978. [Google Scholar] [CrossRef]
  30. Hajirahimi, Z.; Khashei, M. Hybridization of hybrid structures for time series forecasting: A review. Artif. Intell. Rev. 2023, 56, 1201–1261. [Google Scholar] [CrossRef]
  31. Patil, M.A.; Tagade, P.; Hariharan, K.S.; Kolake, S.M.; Song, T.; Yeo, T.; Doo, S. A novel multistage Support Vector Machine based approach for Li ion battery remaining useful life estimation. Appl. Energy 2015, 159, 285–297. [Google Scholar] [CrossRef]
  32. Han, T.; Jiang, D.; Zhao, Q.; Wang, L.; Yin, K. Comparison of random forest, artificial neural networks and support vector machine for intelligent diagnosis of rotating machinery. Trans. Inst. Meas. Control 2017, 40, 2681–2693. [Google Scholar] [CrossRef]
Figure 1. Procedure for RUL prediction of lubricating oil.
Lubricants 11 00121 g001
Figure 2. The main structure of RED-AES.
Lubricants 11 00121 g002
Figure 3. Information entropy of each element in oil spectral data.
Lubricants 11 00121 g003
Figure 4. PCCs of each element in oil spectral data.
Lubricants 11 00121 g004
Figure 5. Change trend of various elements in used lubricating oil.
Lubricants 11 00121 g005
Figure 6. Principle of SVM. (a) General classification surface diagram; (b) Optimal classification surface diagram.
Lubricants 11 00121 g006
Figure 7. The basic principle of KMs.
Lubricants 11 00121 g007
Figure 8. Establishment process of lubricating oil RUL prediction model.
Lubricants 11 00121 g008
Figure 9. Prediction results before parameter filtering.
Lubricants 11 00121 g009
Figure 10. Prediction results after parameter filtering.
Lubricants 11 00121 g010
Figure 11. Confusion matrix before parameter filtering.
Lubricants 11 00121 g011
Figure 12. Prediction results after parameter filtering.
Lubricants 11 00121 g012
Table 1. Characteristics of the selected engine.
ParameterDescription/Value
Engine typeDiesel
Engine cylinderV-8
Engine cooling modeWater-cooling
Table 2. Spectral data for the engine oil (unit: μg·g−1).
Element0 h10 h190 h200 h
Fe12.85.569.871.5
Al8.92.910.511.3
Cu5.22.177.3
Cr1.20.94.84.7
Ni2.92.81.53.2
V00.10.10
Zn1076944962940
P1074960933853
B6.127.74.63.8
Ba0.700.60.5
K57339611111567
Mg39,81838,37434,07134,149
Ca2830264629152794
Na29.23.197.798.3
Si8.691413.5
Mo03.100
Pb00.100.3
Table 3. The potential source of the main elements in used lubricating oil.
CategoryElementSymbolPotential Source of the Specified Element
Abrasive
Metals
IronFeWear and rust of almost all parts (pistons, bearings, gears, crankshafts, shafts, rings, valves, etc.)
AluminumAlWear of piston, bearing, and pump
CopperCuWear of connecting rod bushing and camshaft bushing, corrosion of radiator piping
ChromeCrWear of piston ring, cylinder sleeve, bearing, and the other alloy parts
NickelNiWear of bearing, shaft, and gear
VanadiumVWear of the alloy parts
Additive
Elements
ZincZnZinc dialkyl dithiophosphate (ZDDP)
PhosphorusPPhosphate ester type base oil, antirust additive, load-carrying additives, friction modifier, and ZDDP
BoronBLoad-carrying additives, friction modifiers, and purification dispersants
BariumBaPurification dispersant, rust inhibitor, and demulsifying compound
ComprehensivePotassiumKWater pollution and coolant contamination
MagnesiumMgLubricant additives (purification dispersant, rust inhibitor), engine cylinder, water pollution, and coolant contamination
CalciumCaLubricant additives (purification dispersant), water pollution, and coolant contamination
SodiumNaLubricant additives (rust inhibitor), water pollution, and coolant contamination
SiliconSiLubricant additives (antifoaming agent), dust intrusion (poor working air filter), and piston wear
MolybdenumMoLubricant additives (load-carrying additives, friction modifier, and rust inhibitor) and ring wear
LeadPbFuel intrusion and white alloy bearing wear
Disclaimer/Publisher’s Note: The statements, opinions and data contained in all publications are solely those of the individual author(s) and contributor(s) and not of MDPI and/or the editor(s). MDPI and/or the editor(s) disclaim responsibility for any injury to people or property resulting from any ideas, methods, instructions or products referred to in the content.

