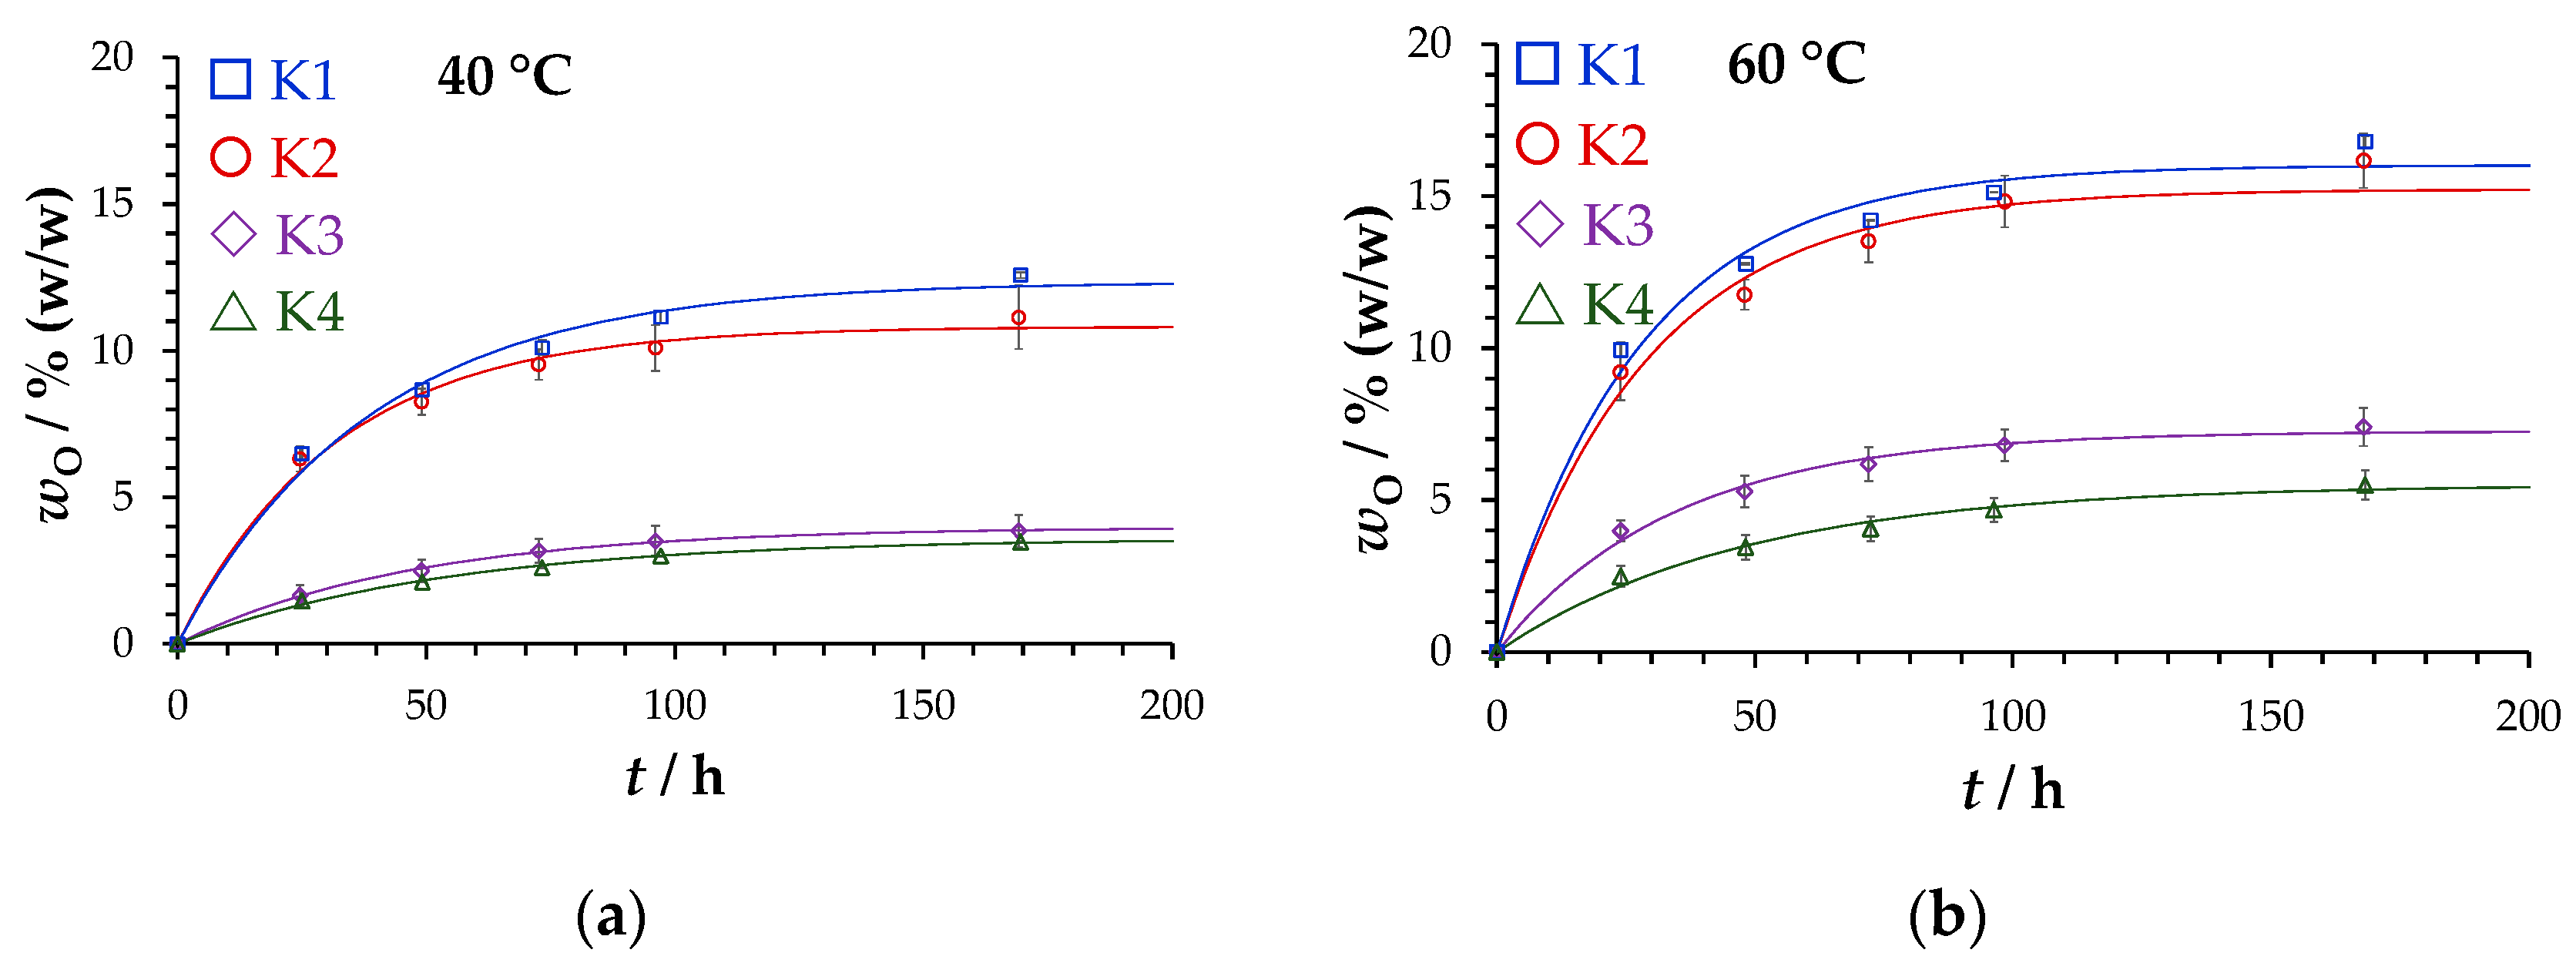
4.1. Oil Separation According to DIN 51817 [7]
Figure 8 presents mass fractions of separated oil of the lubricating greases K1–K4 at 40 °C and 60 °C.
The differential Equation (4) describes the time dependence of oil separation processes in such a way that the oil separation rate is indirectly proportional to a characteristic time
tc and directly proportional to the quantity of oil still to be separated (
). Its integration gives Equation (5), where
is the mass fraction of the separated oil,
is the maximum oil separation,
tc is the characteristic time and
t is the test time.
Equations (4) and (5), respectively, include two parameters: maximum oil separation and characteristic time tc. The first parameter maximum oil separation is a limit value only valid for the applied measurement time, mechanical load and temperature. The second parameter corresponds to the time needed to reach 63.2% of the maximum oil separation . The characteristic time tc is an inverse rate constant, i.e., the smaller it is, the faster oil separates. Both parameters can be used to benchmark oil release properties of tested greases.
Table 2 gives an overview of both the parameters maximum oil separation
and characteristic time
tc. The maximum oil separation
of the greases K1 and K2, respectively, are similar to K3 and K4. This is noteworthy because they are each thickened differently with Li- and Ca-soaps and differ significantly in their NLGI classes (
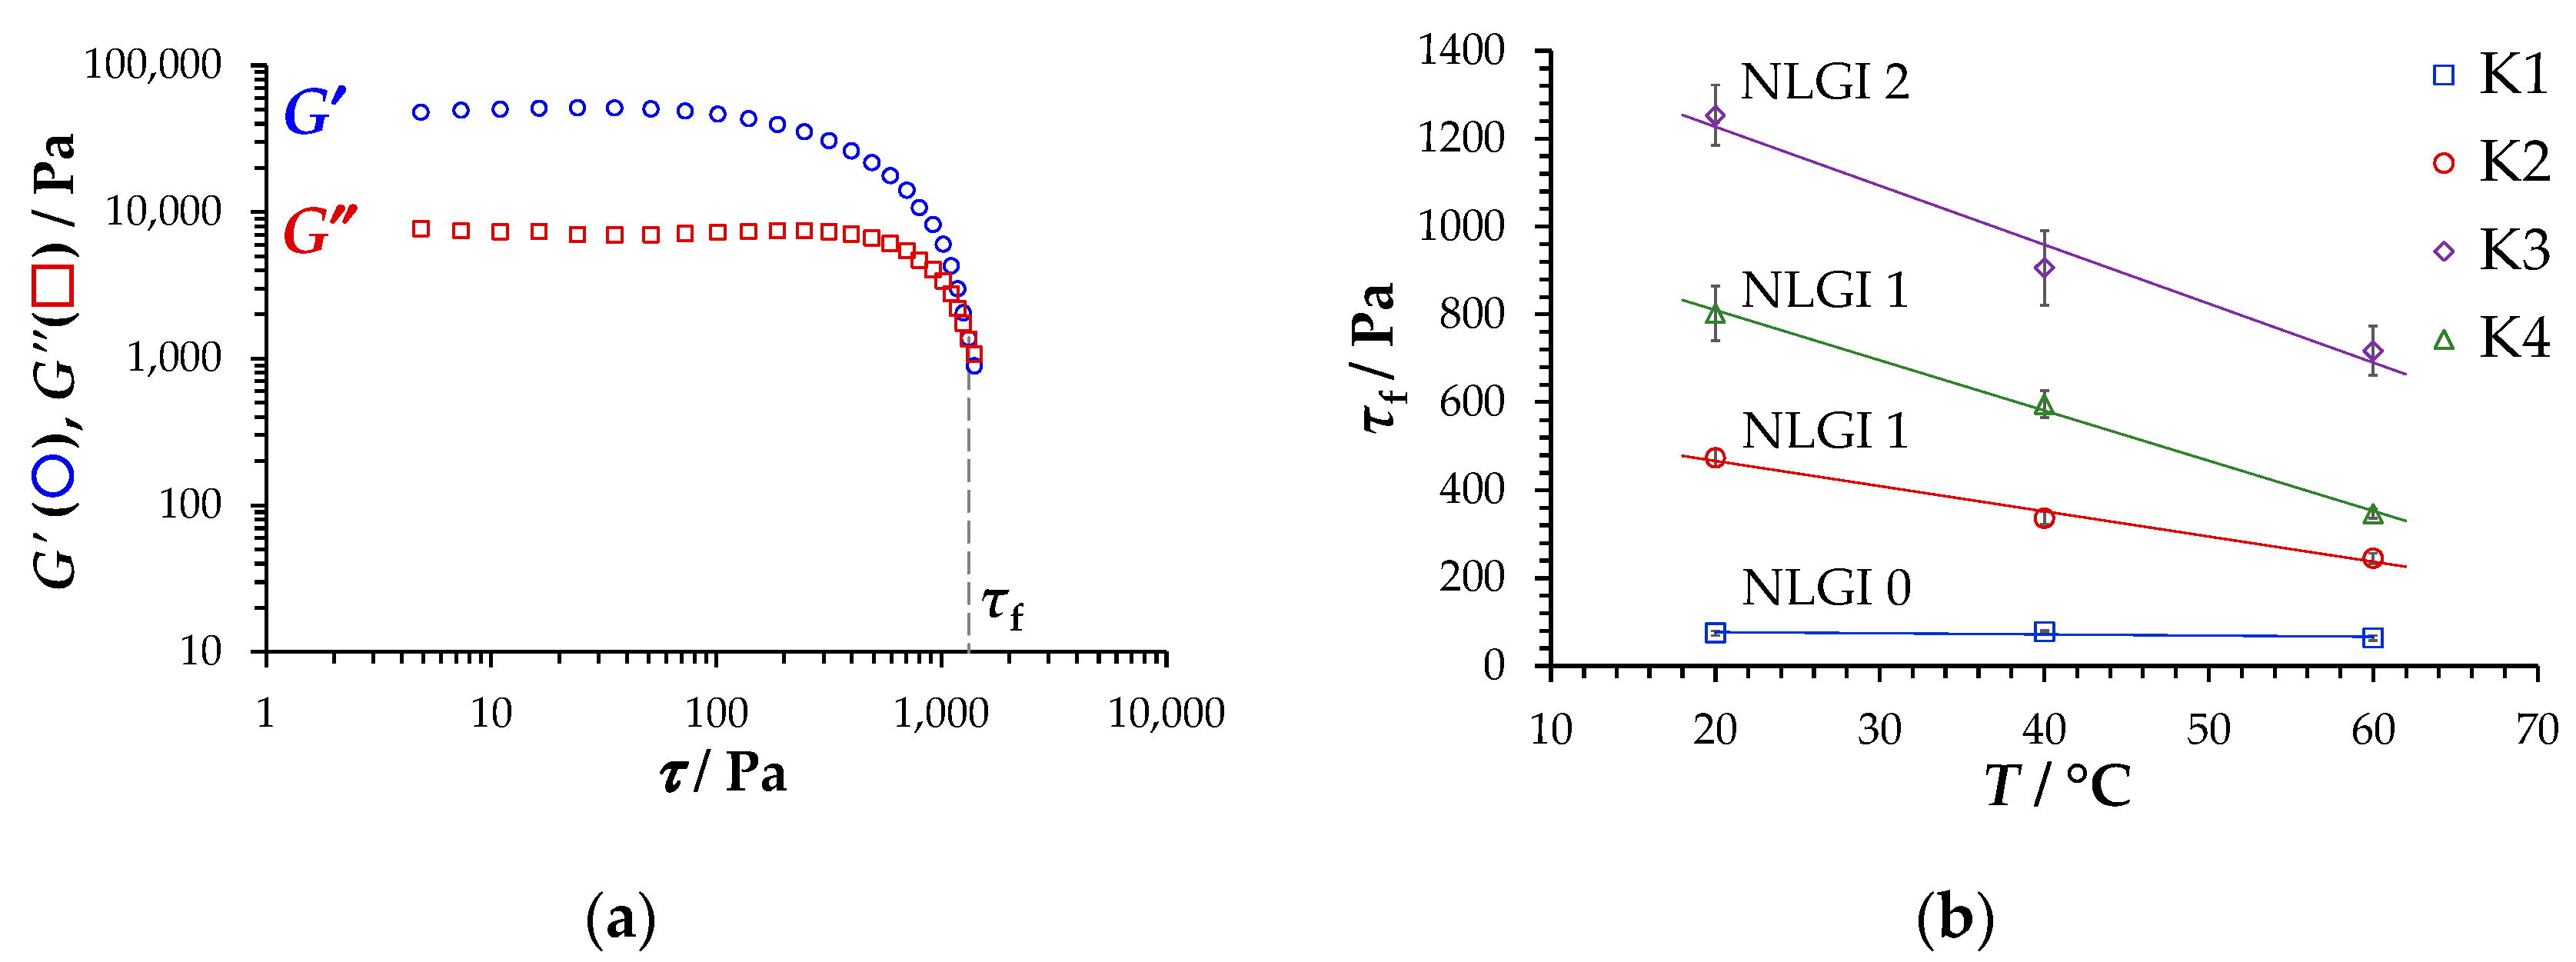
Table 1) or flow points (
Figure 5). The characteristic time
tc of all lubricating greases decreases with rising temperature.
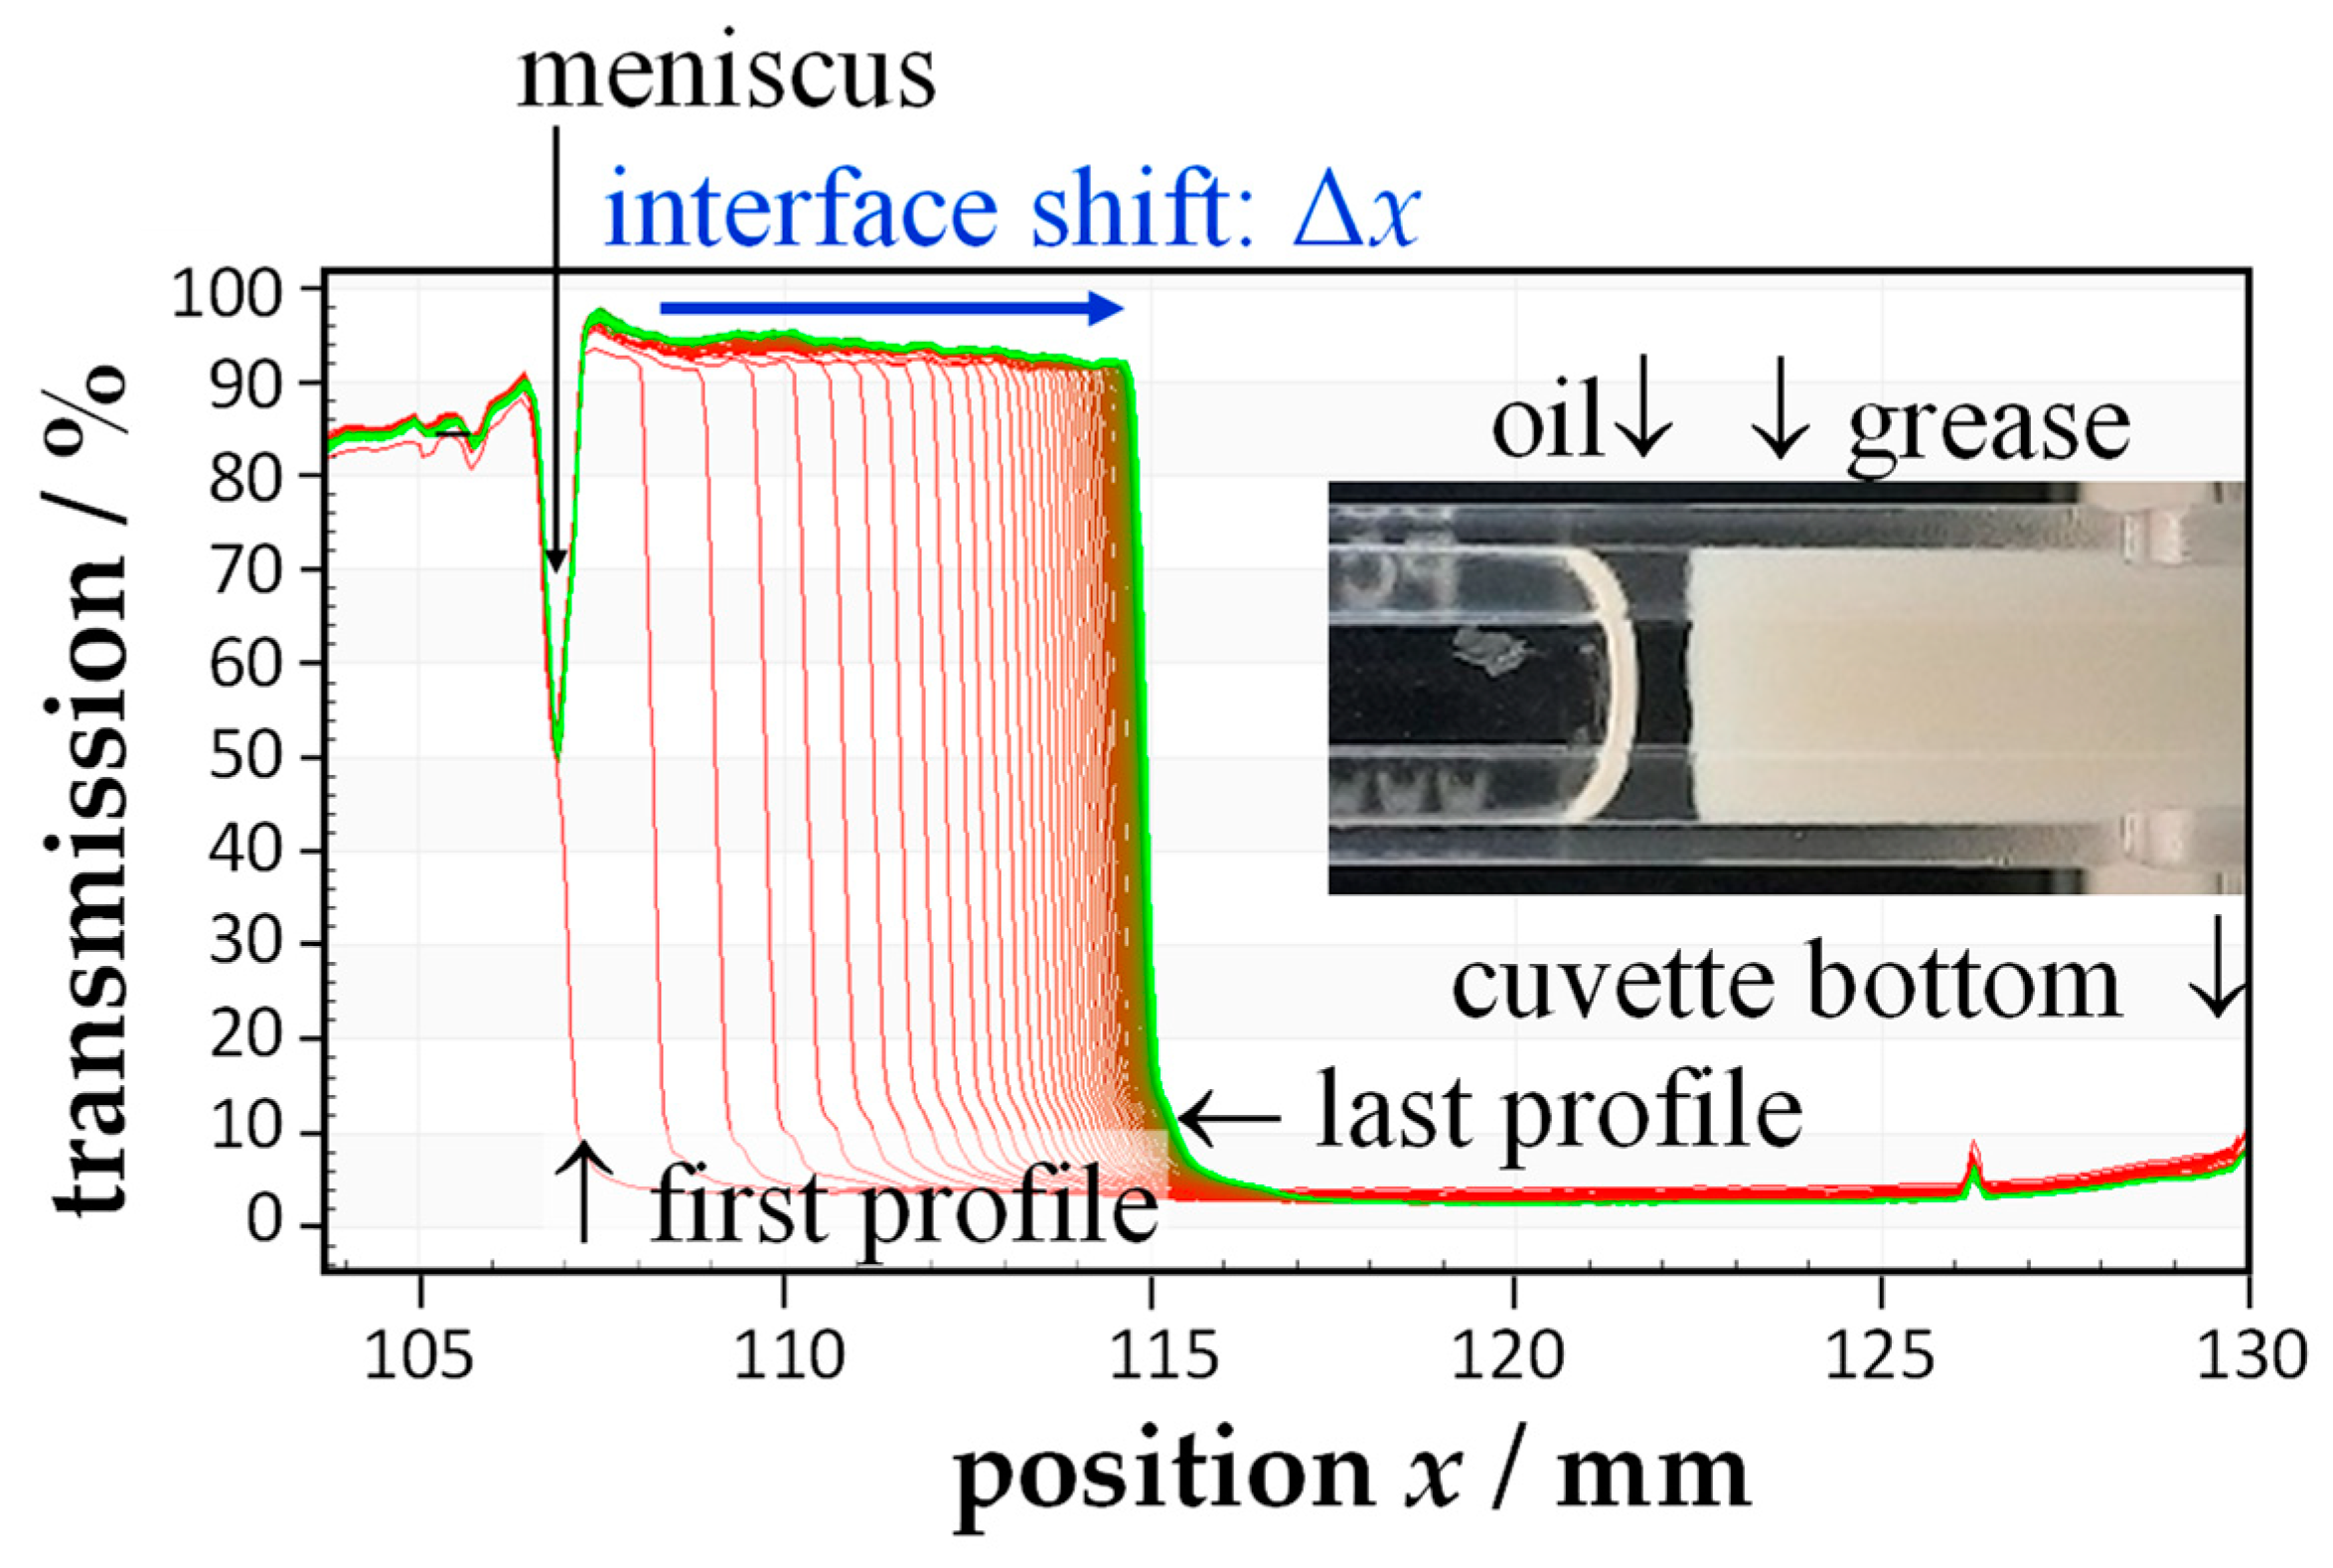
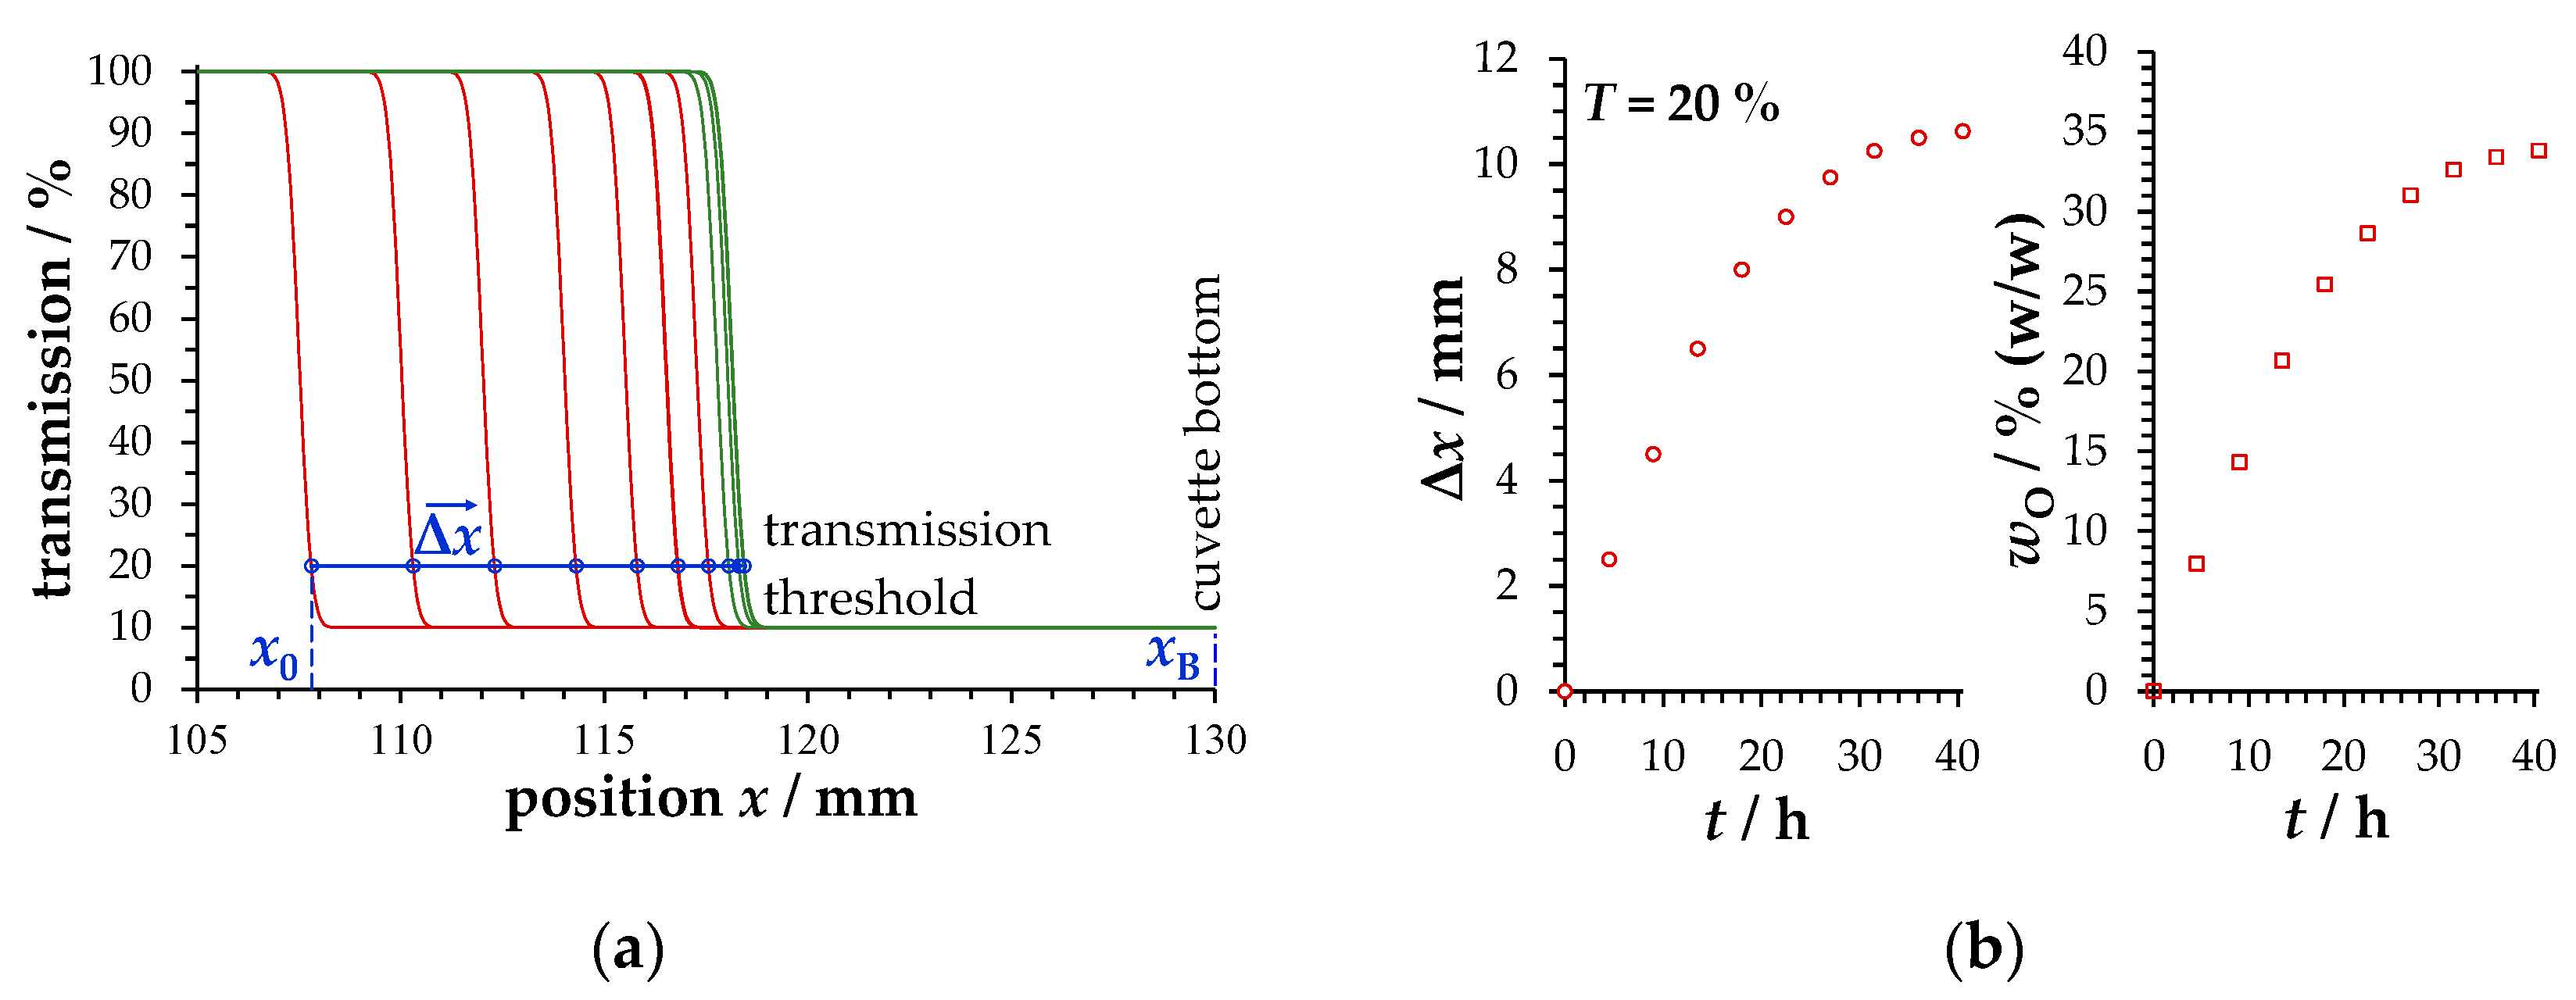
4.2. Analytical Centrifuge Oil Separation
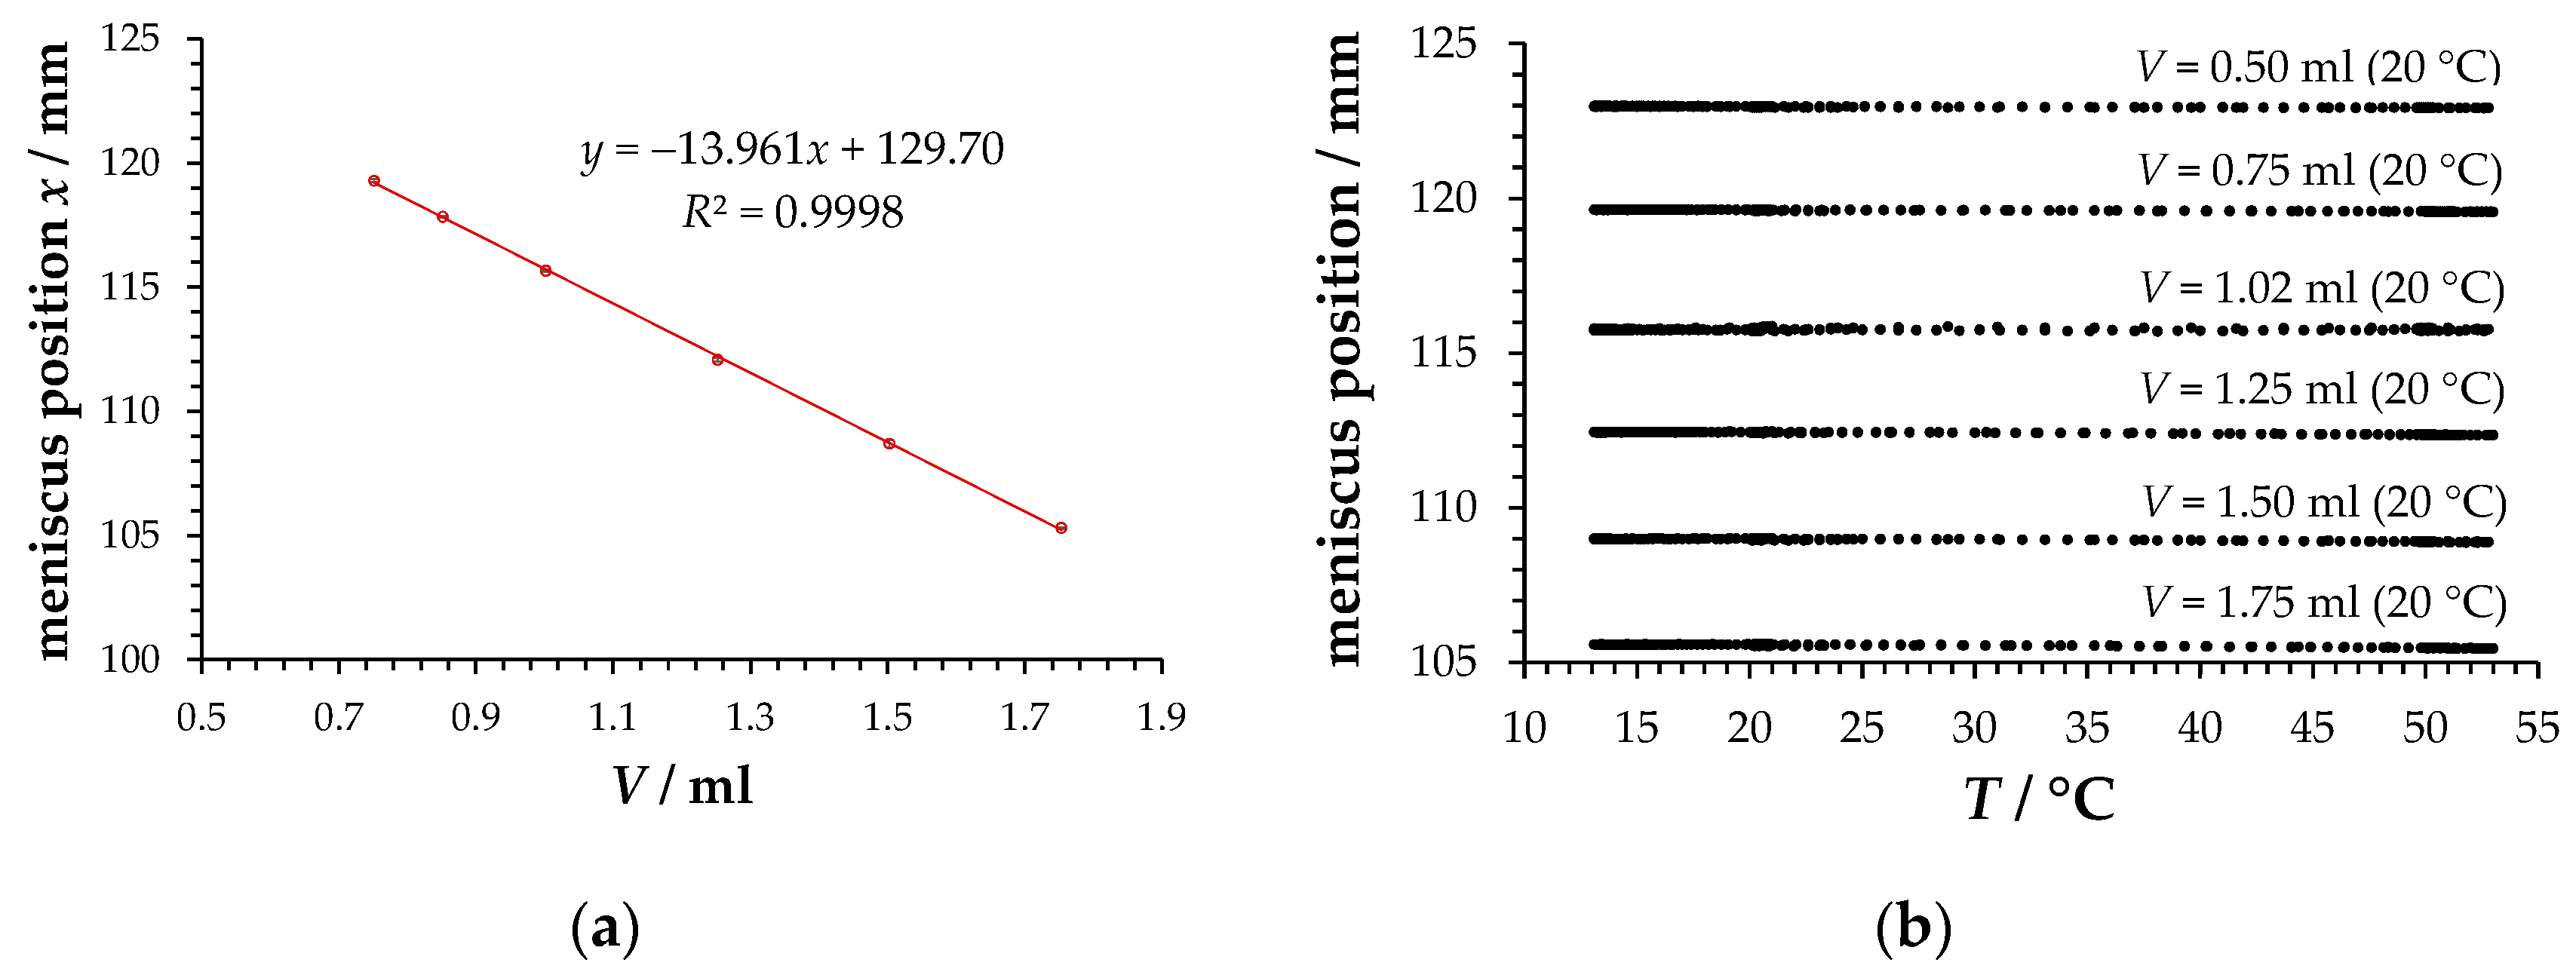
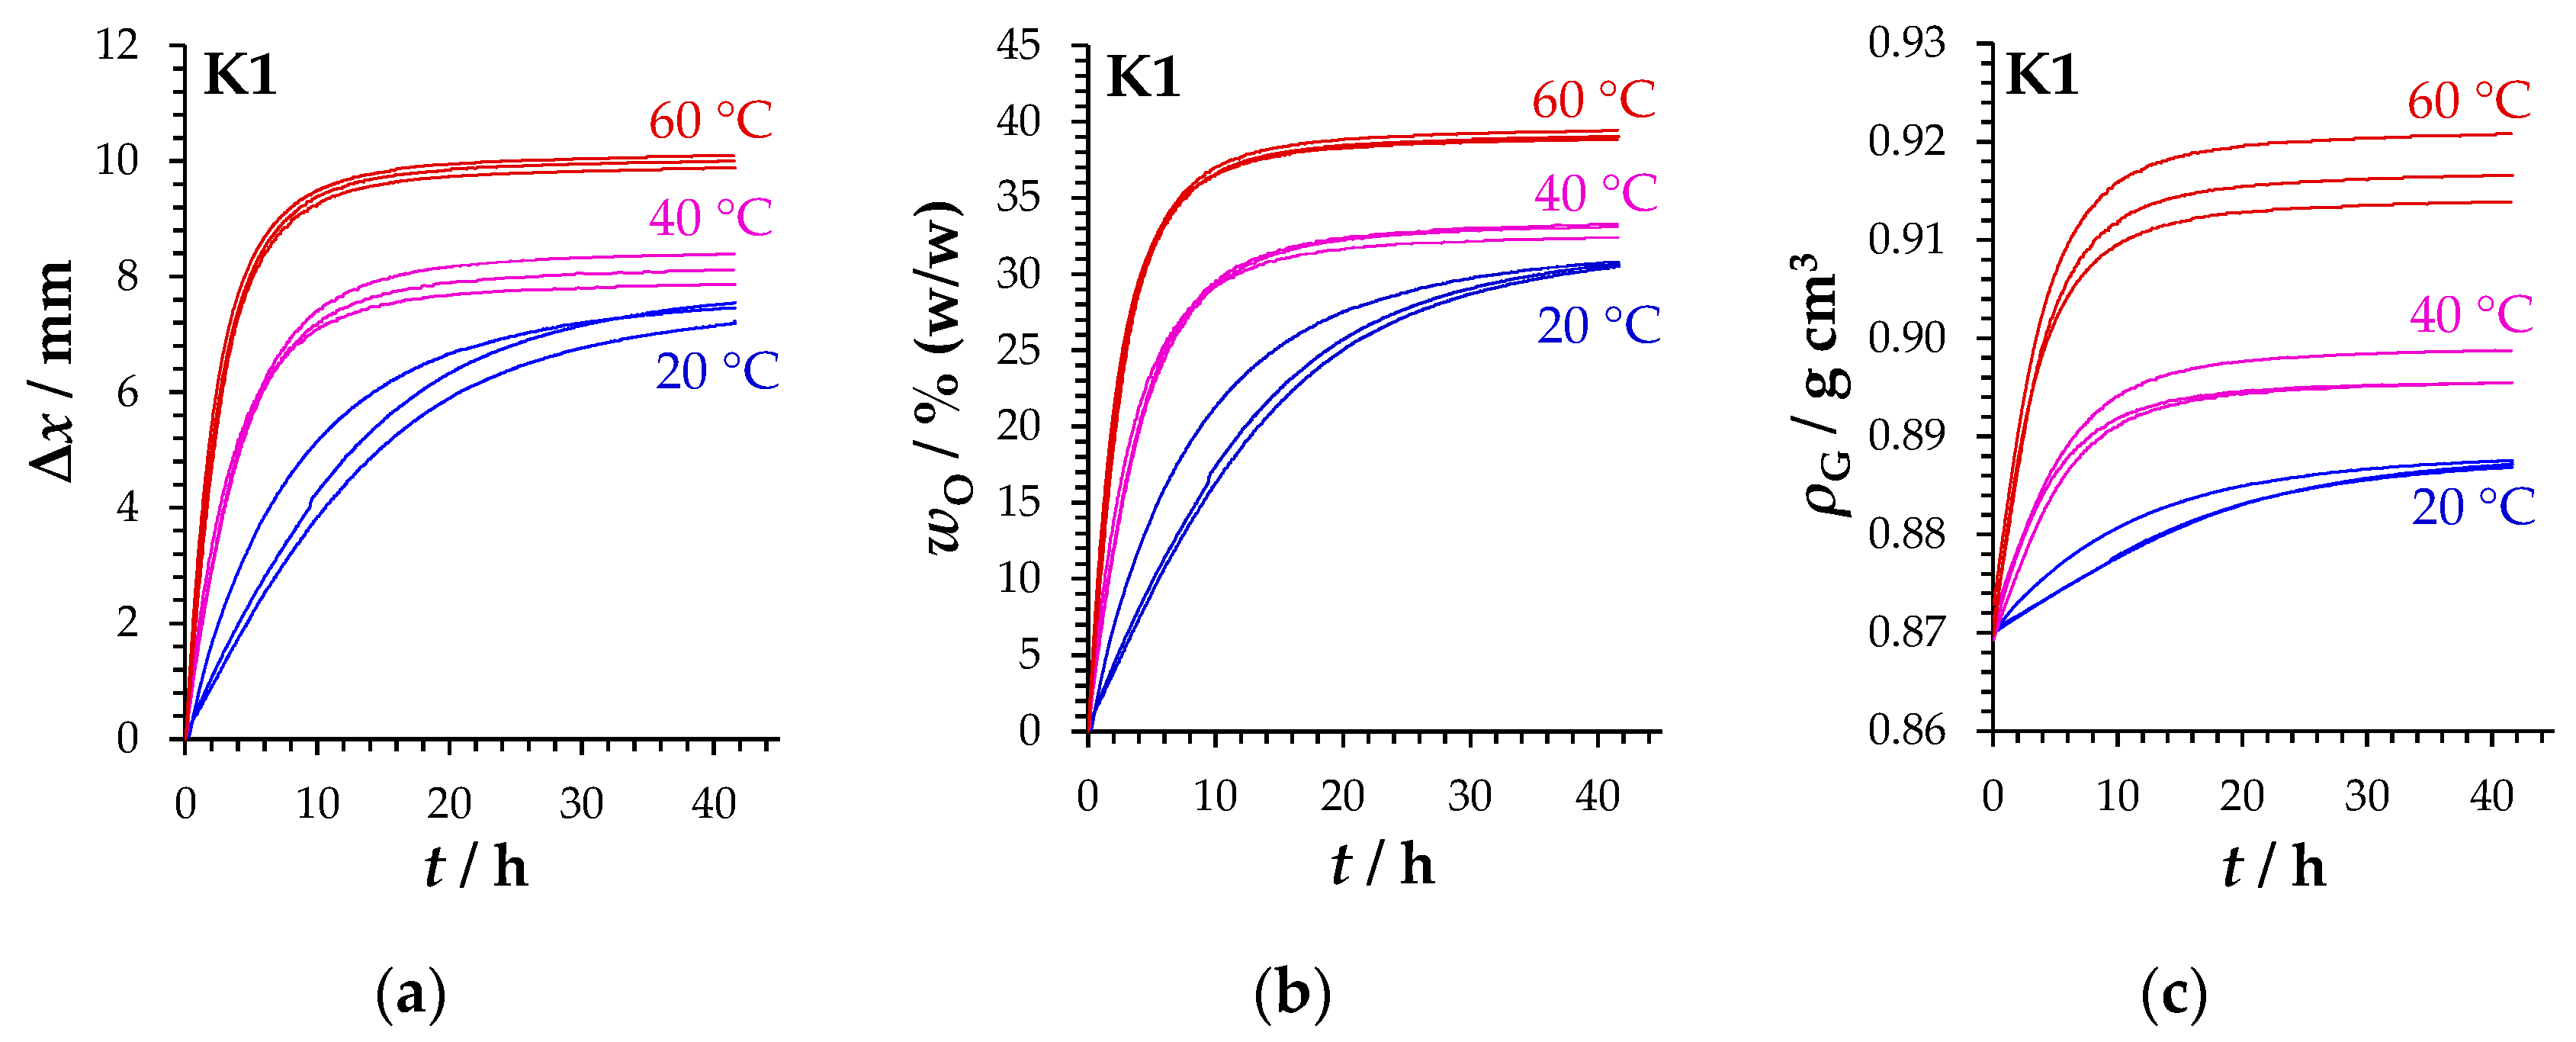
Figure 9 illustrates for the lubricating grease K1 the relationship between interphase shift Δ
x (
Figure 9a) and the mass fraction of separated oil (
Figure 9b) and grease density (
Figure 9c). The mass fraction of separated oil
is obtained by converting the data in
Figure 9a with Equation (1) and the grease density by converting the data in
Figure 9a with Equation (2).
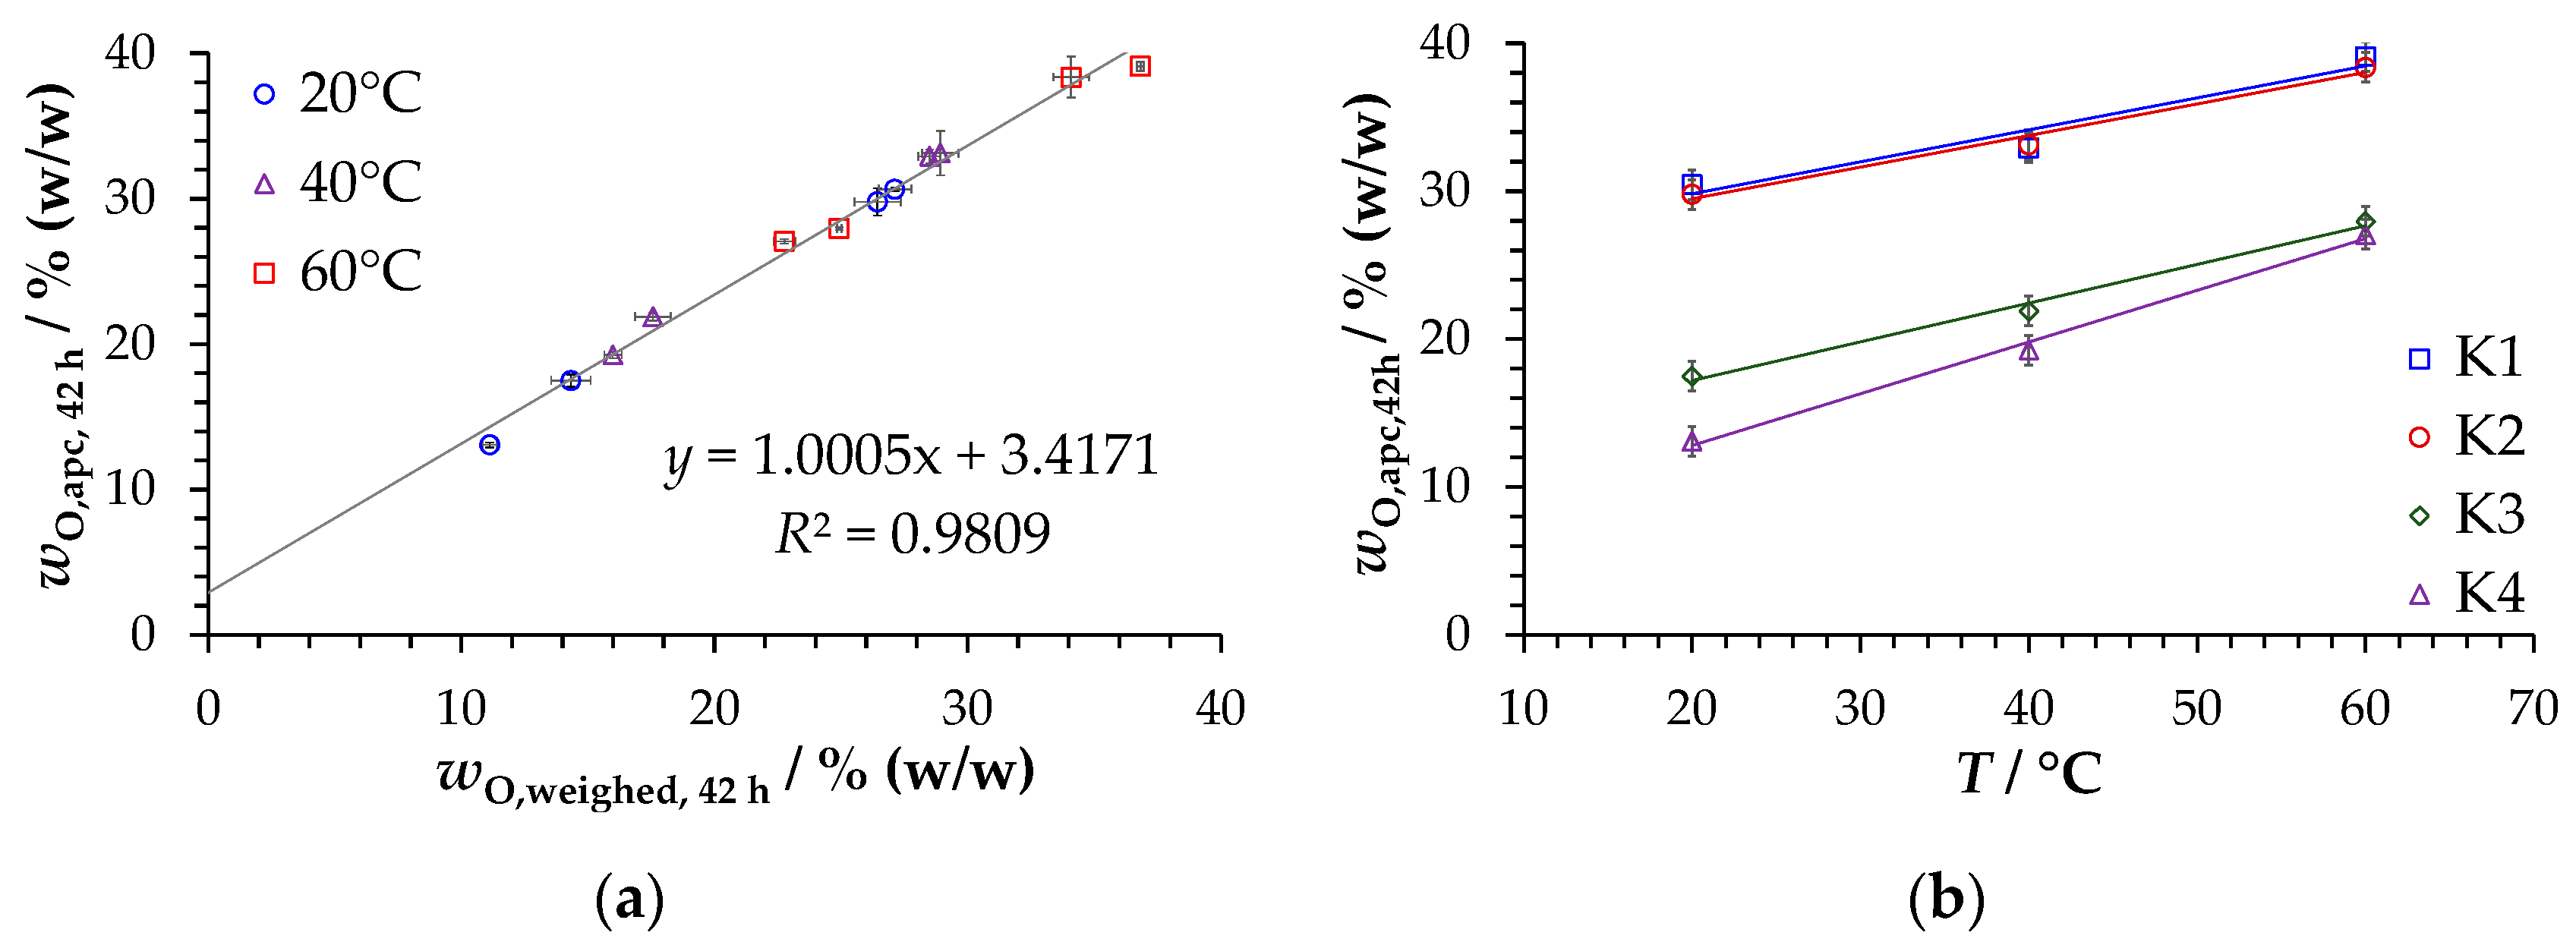
To verify the conversion of transmission profiles into mass fractions of separated oil, the quantities of oil separated after 42 h were carefully withdrawn with a syringe and the cuvettes reweighed. The comparison of the mass fractions calculated from transmission profiles (
) with those from the reweighing of the cuvettes (
) after withdrawing the free oil in a parity diagram (
Figure 10a) reveals a significant correlation. The values obtained from the transmission profiles are on average 3.5% higher because the separated oil cannot be completely removed from the cuvettes with a syringe.
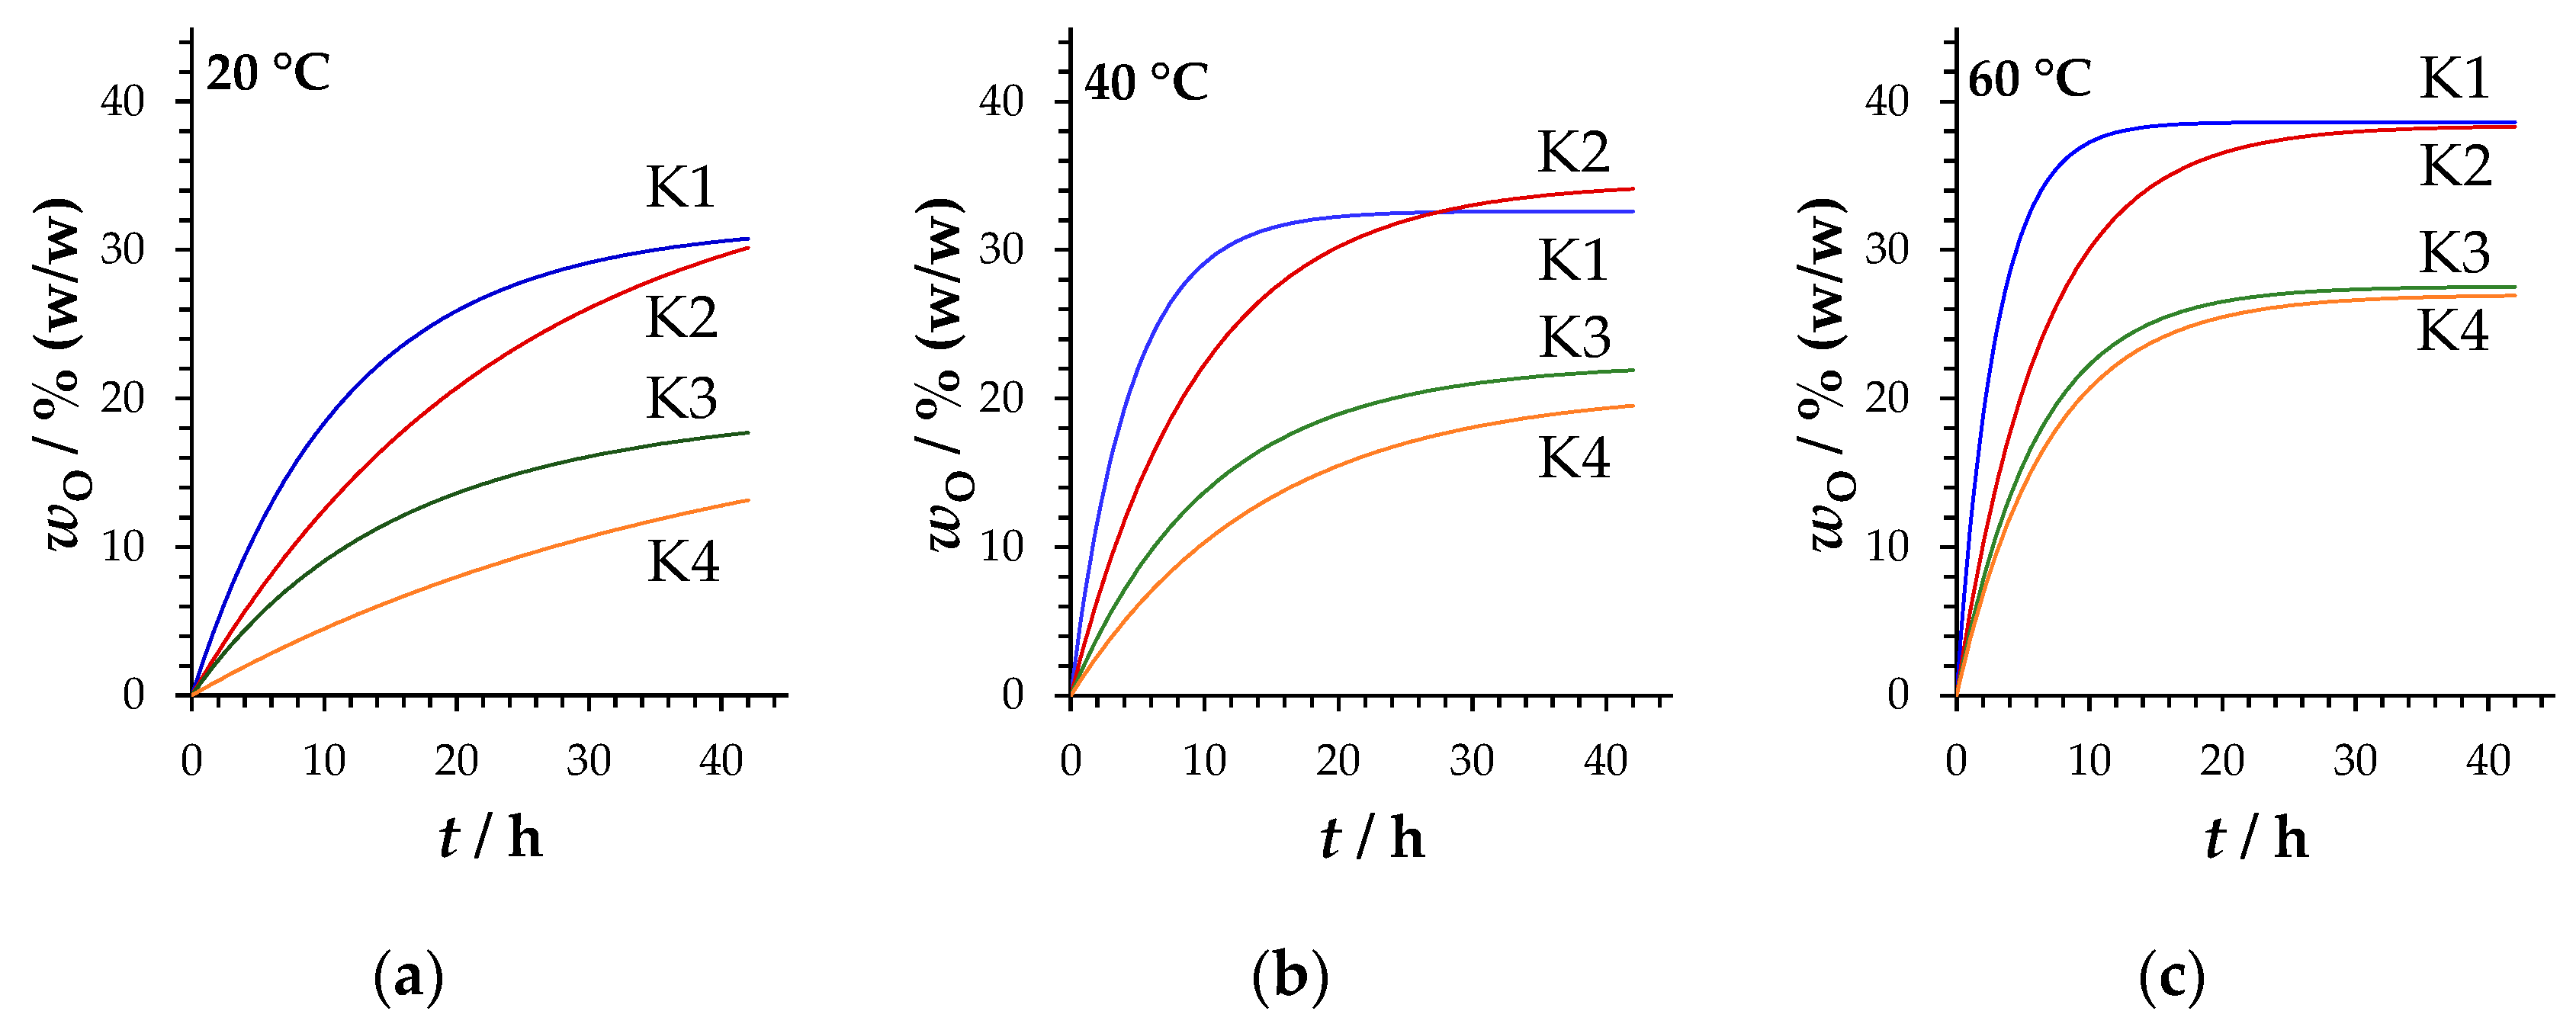
Figure 10b illustrates the increasing oil separation after 42 h with increasing temperature. Just as in the tests according to DIN 51817, the oil separation quantities of the lubricating greases K1 and K2 or K3 and K4 are comparably high.
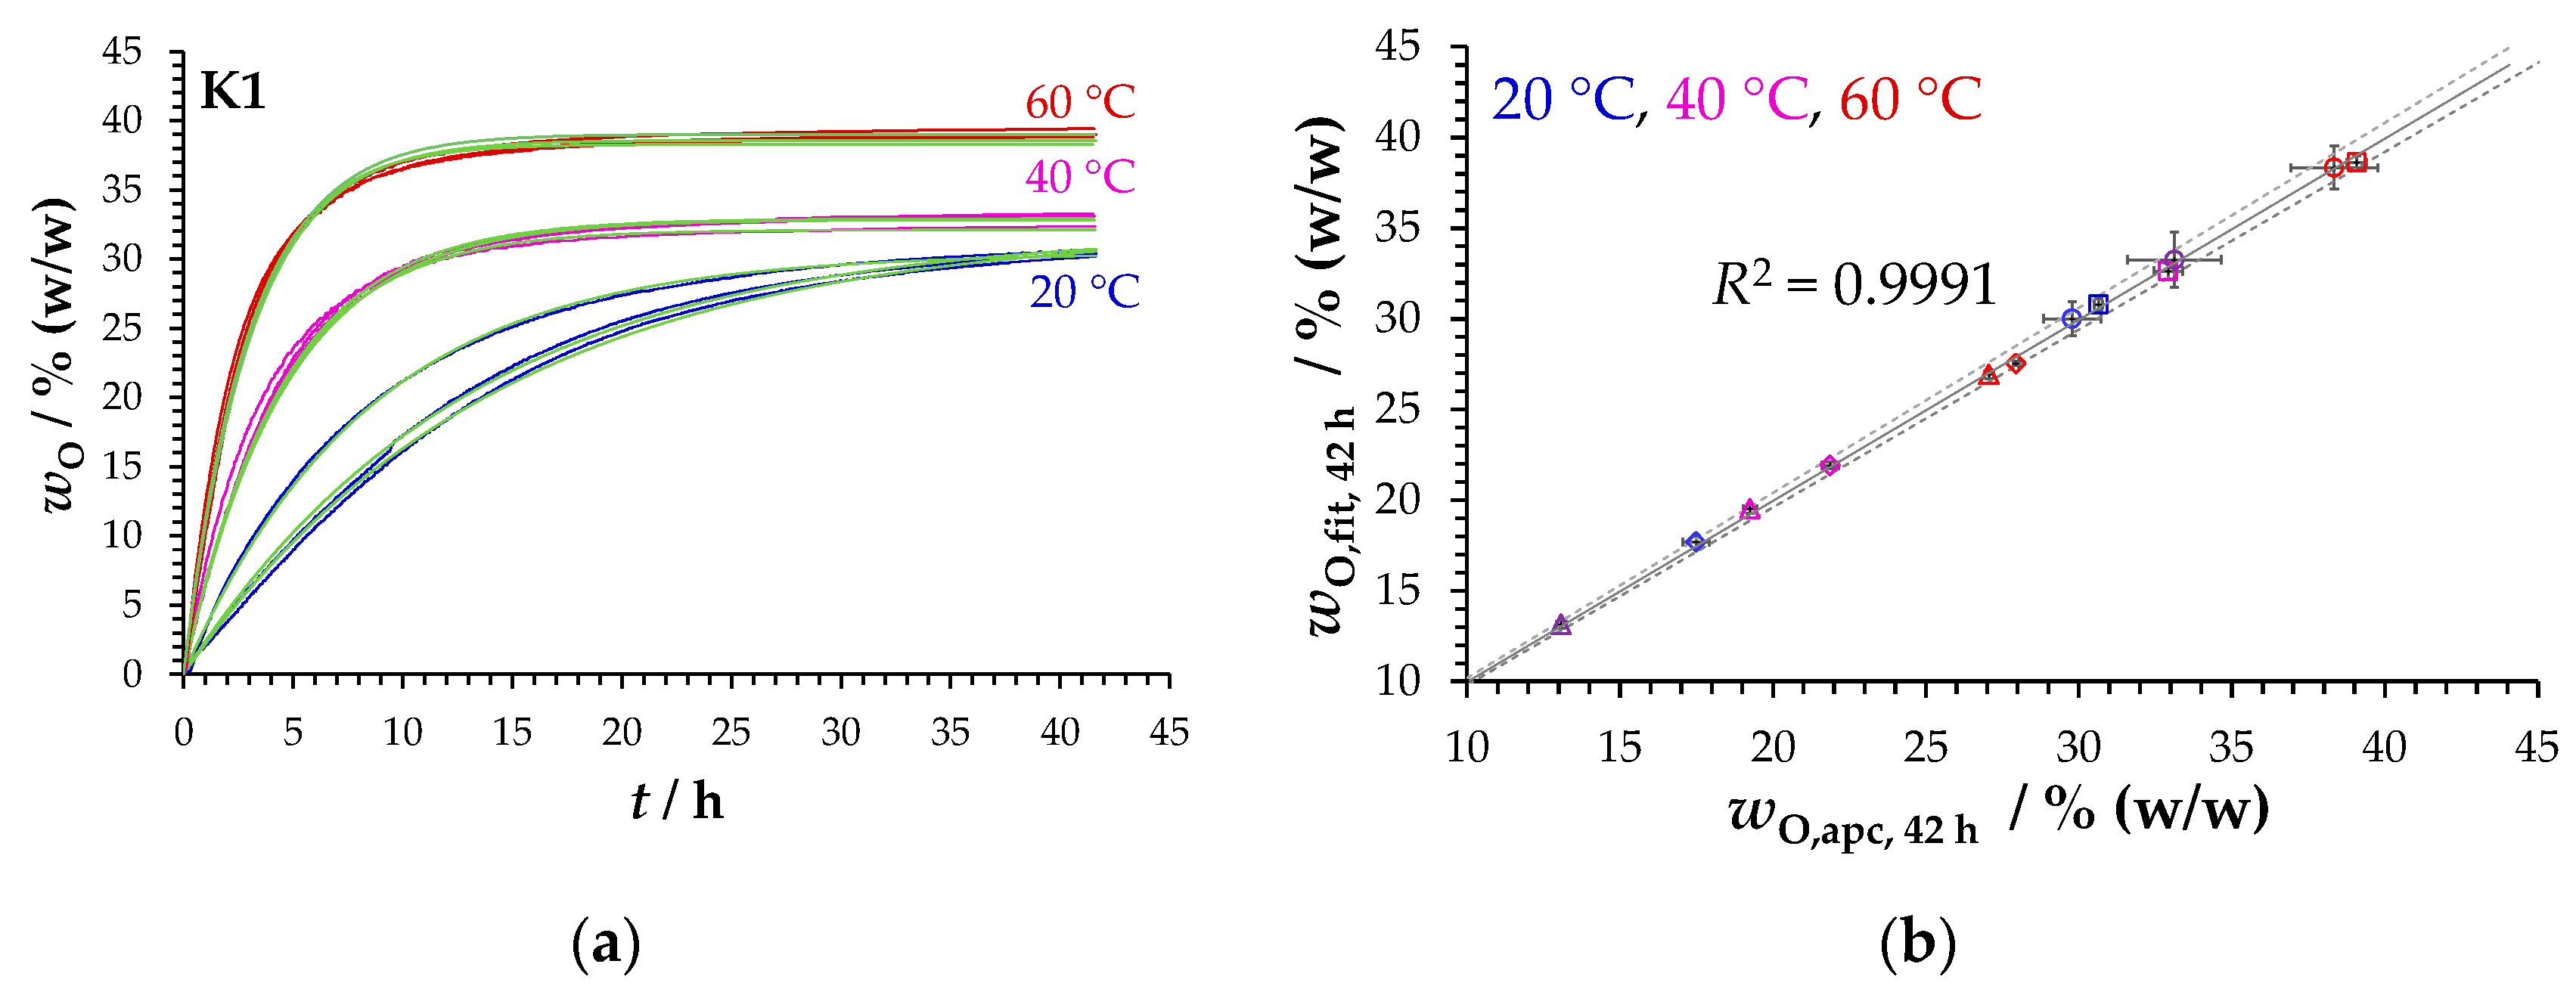
Fitting the 36
-
t data sets (three measurements per temperature and per grease) using Equation (5) results in coefficients of determination
R2 between 0.9958 and 0.9998.
Figure 11a shows a comparison of fit functions (green) and measured curves for grease K1 as an example. In a parity plot (
Figure 11b) the mass fractions of the separated oil (
) obtained from the fit functions for a test time of 42 h are plotted against the corresponding values from the transmission profiles (
). The deviations of the data points from the correlation line are less than ±2%, confirming that Equation (5) adequately describes the
-
t measurement data.
Due to the match between measured and fitted curves, the parameters maximum oil separation
and characteristic time
tc can be used analyzing time profiles of oil separation (
Figure 12).
Table 3 presents the fitting parameters maximum oil separation
and characteristic time
tc versus temperature. Consistent with the DIN 51817 results (
Table 2), the maximum oil separation rates
of the lubricating greases K1 and K2 or K3 and K4 are similar, although they differ with respect to their thickener systems (
Table 1) and flow points (
Figure 5b). Moreover, in accordance with the results of DIN 51817, the oil separation rates increase or characteristic time
s tc decrease as the temperature increases.
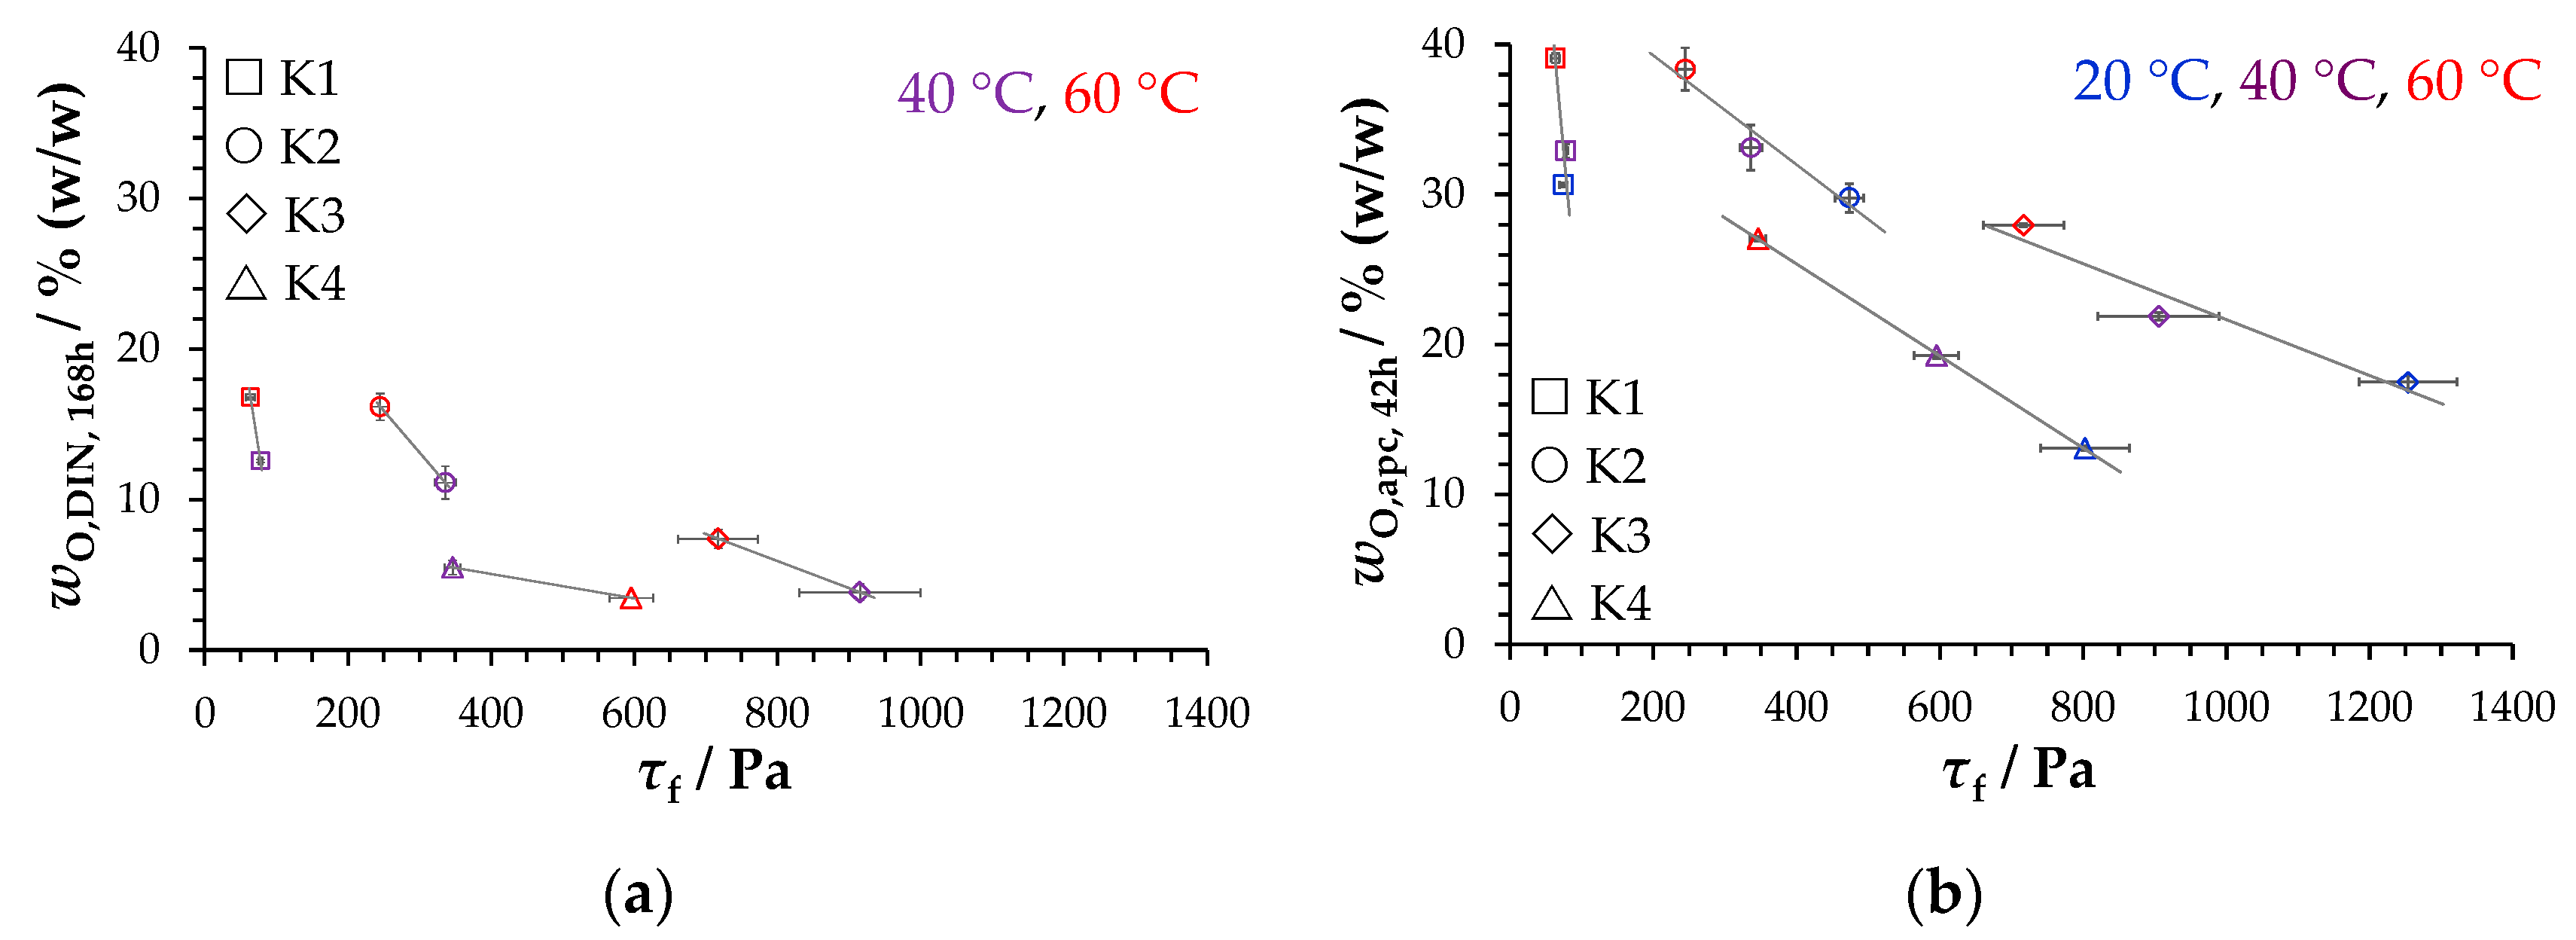
4.3. Method Comparison: Analytical Centrifuge versus DIN 51817 [7]
Figure 13 shows the mass fractions of the separated oil after 168 h according to DIN 51817 [
7] (
Figure 13a) and after 42 h in the analytical centrifuge (
Figure 13b), respectively, compared to the corresponding flow points
of the greases.
The results of both methods in
Figure 13 clearly show higher mass fractions of separated oil at low flow points and lower mass fractions at high flow points. As the temperature increases, the greases become softer and their flow point decreases, respectively. As a result, the fraction of separated oil increases. To interpret these results the idea of a sponge-like structure of agglomerated thickener particles in which oil is embedded helps. The easier the sponge-like structure can be compressed by external forces and/or compacted by attractive particle–particle interactions, the more oil will be separated. This basic finding is understandable, even if no information is available on the physical factors that determine such temperature-dependent compression processes. Such kind of grease-specific physical factors include the volume concentration and structure of thickener particles and the structure of thickener particle network. The lack of information prevents the establishment of a correlation function of oil separation quantity versus flow point
that is valid for the tested lubricating greases K1–K4 and both measurement methods.
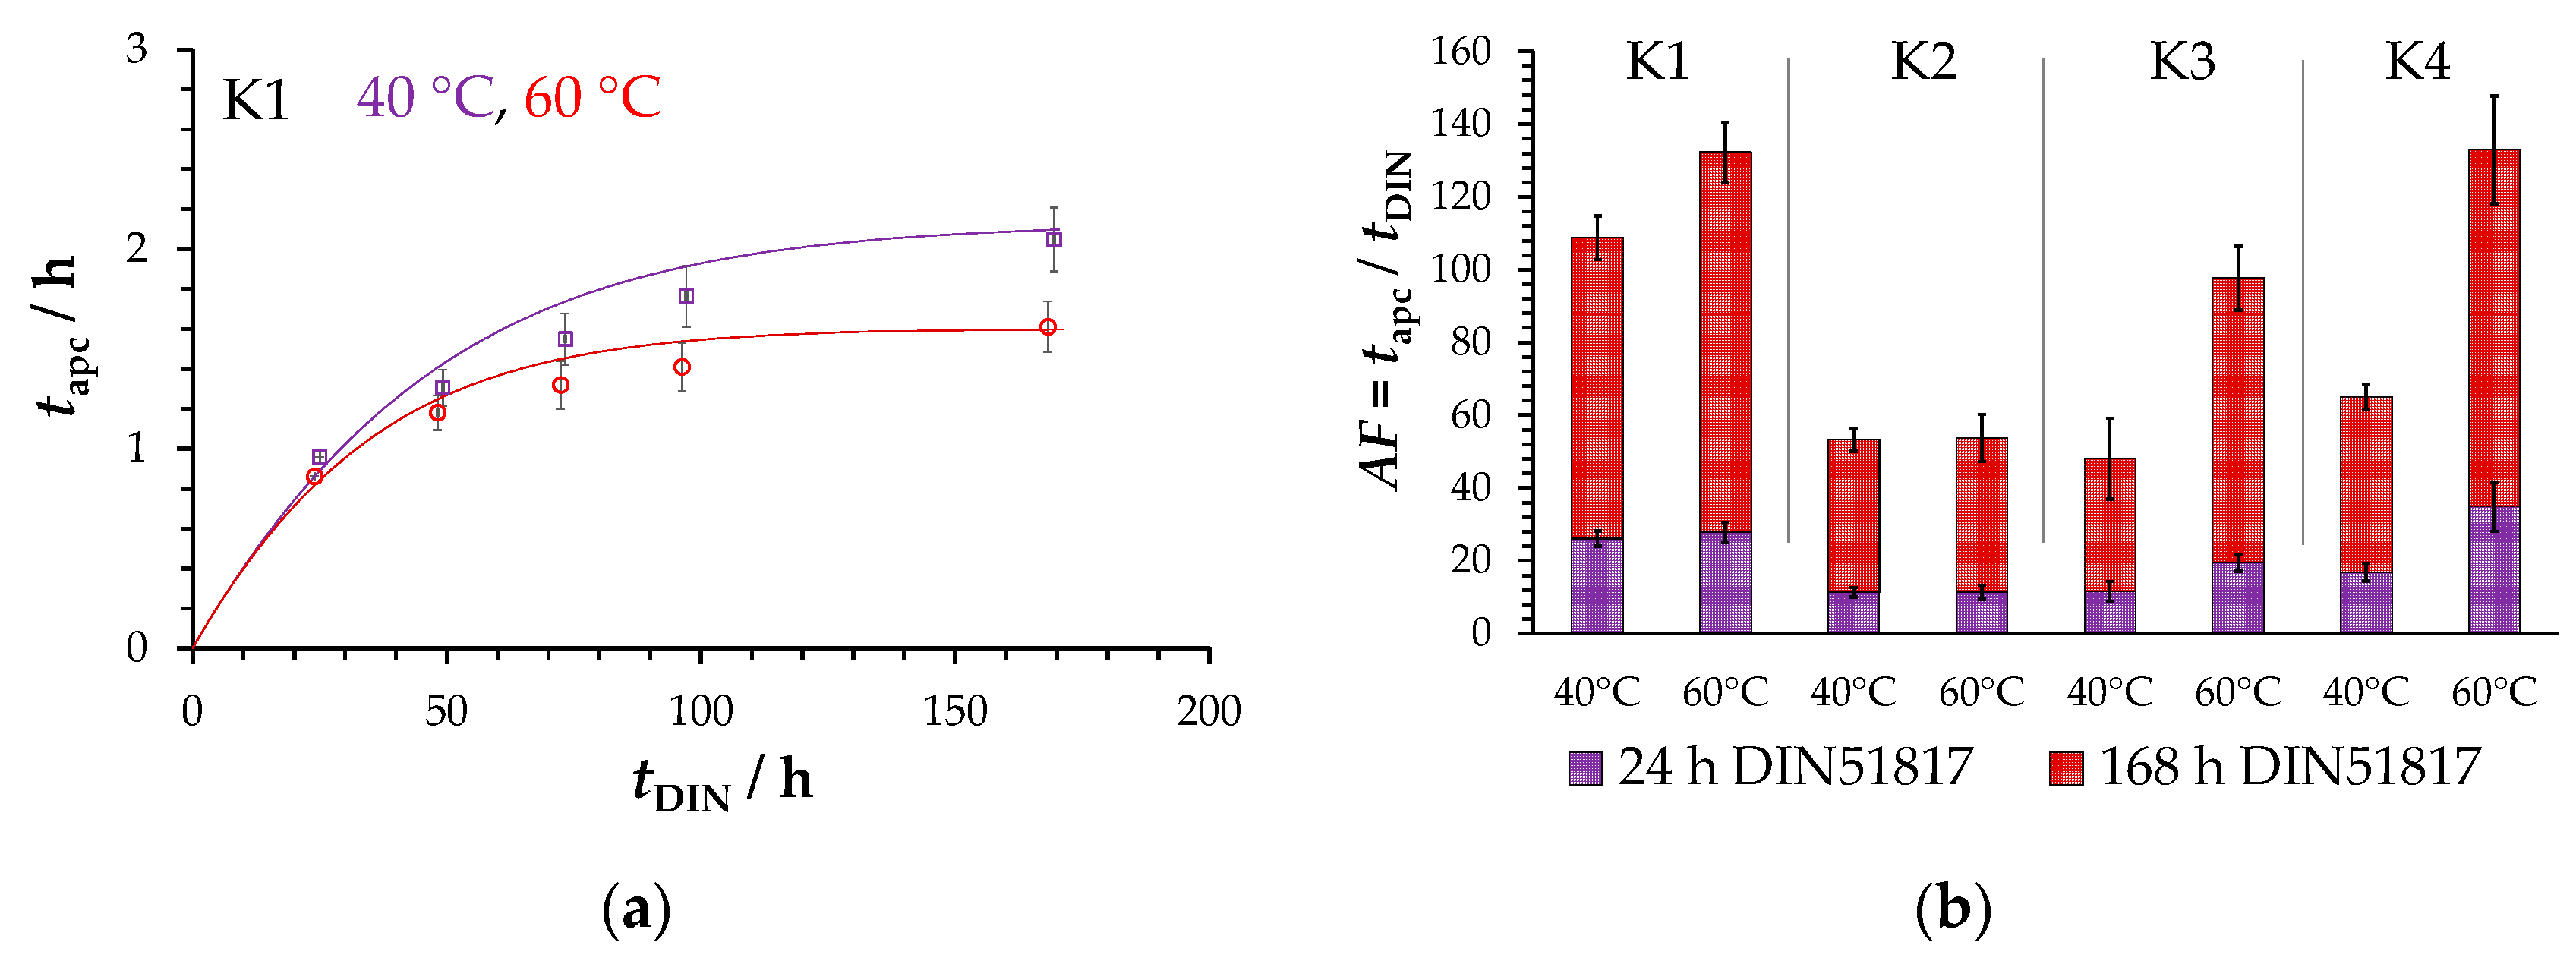
When greases are loaded in a test apparatus according to DIN 51817 [
7] with 100 g additional weight, they are exposed to a pressure of approximately 660 Pa [
6]. In the analytical photo-centrifuge, at a rotational speed of 4000 rpm, the relative centrifugal acceleration (RCA) is 1878 times the acceleration of gravity at the level of 105 mm and 2325 times the acceleration of gravity at the bottom of the cuvette (position 130 mm). The resulting pressure difference of approximately 4 × 10
5 Pa within grease samples is the reason why oil separation in an analytical centrifuge is faster and the amount of separated oil is larger. A comparison of the test times for identical separated oil mass fractions of both methods at 40 °C and 60 °C, listed in
Table 4, reveals that the use of an analytical centrifuge reduces the test times from 24 h to less than 2.5 h and from 168 h to less than 4 h, respectively.
Figure 14a shows the ratio of the test times of the two methods (
tapc,
tDIN) for the same oil separation quantities (
) for the lubricant grease K1 as an example. The ratio of these times gives an acceleration factor
AF (Equation (6)). In
Figure 14b, no single acceleration factor
AF can be identified for all greases and temperatures. Unsurprisingly, acceleration factor
AF depends on both grease formulation and temperature.
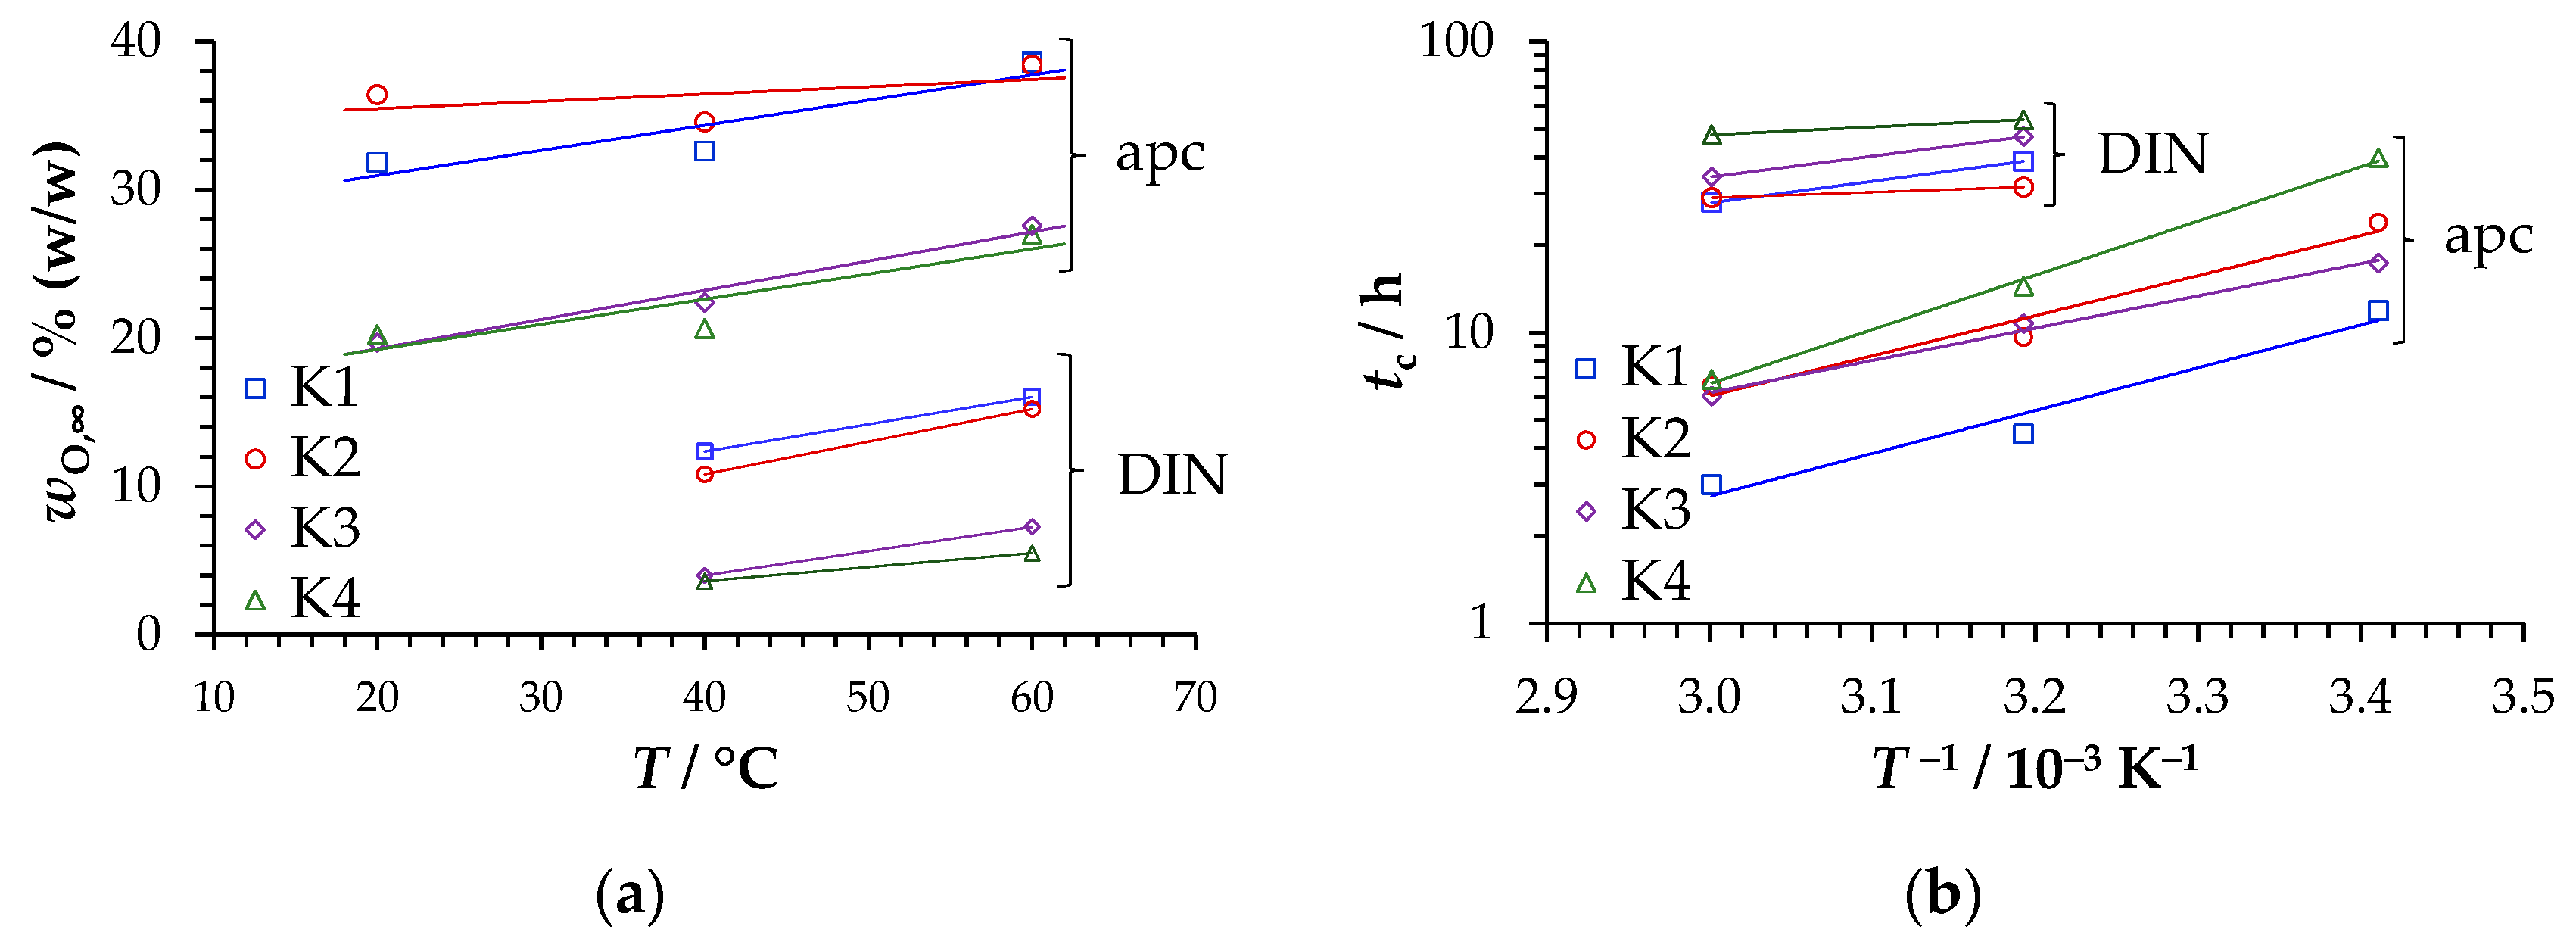
Both measurement methods can be compared not only in terms of mass fractions of separated oil (
Figure 13) and acceleration factors
AF (
Figure 14), respectively, but also in terms of the fit parameters maximum oil separation
and characteristic time
tc.
Figure 15 gives an overview by plotting the maximum oil separation
against temperature and the characteristic time
tc in a logarithmic scale against inverse temperature. The characteristic time
tc is plotted in this way because, according to its meaning, it is an inverse rate constant, for which the Arrhenius Equation (7) should apply, where
T is the absolute temperature,
R is the gas constant,
A is the pre-exponential factor and
Ea is the activation energy.
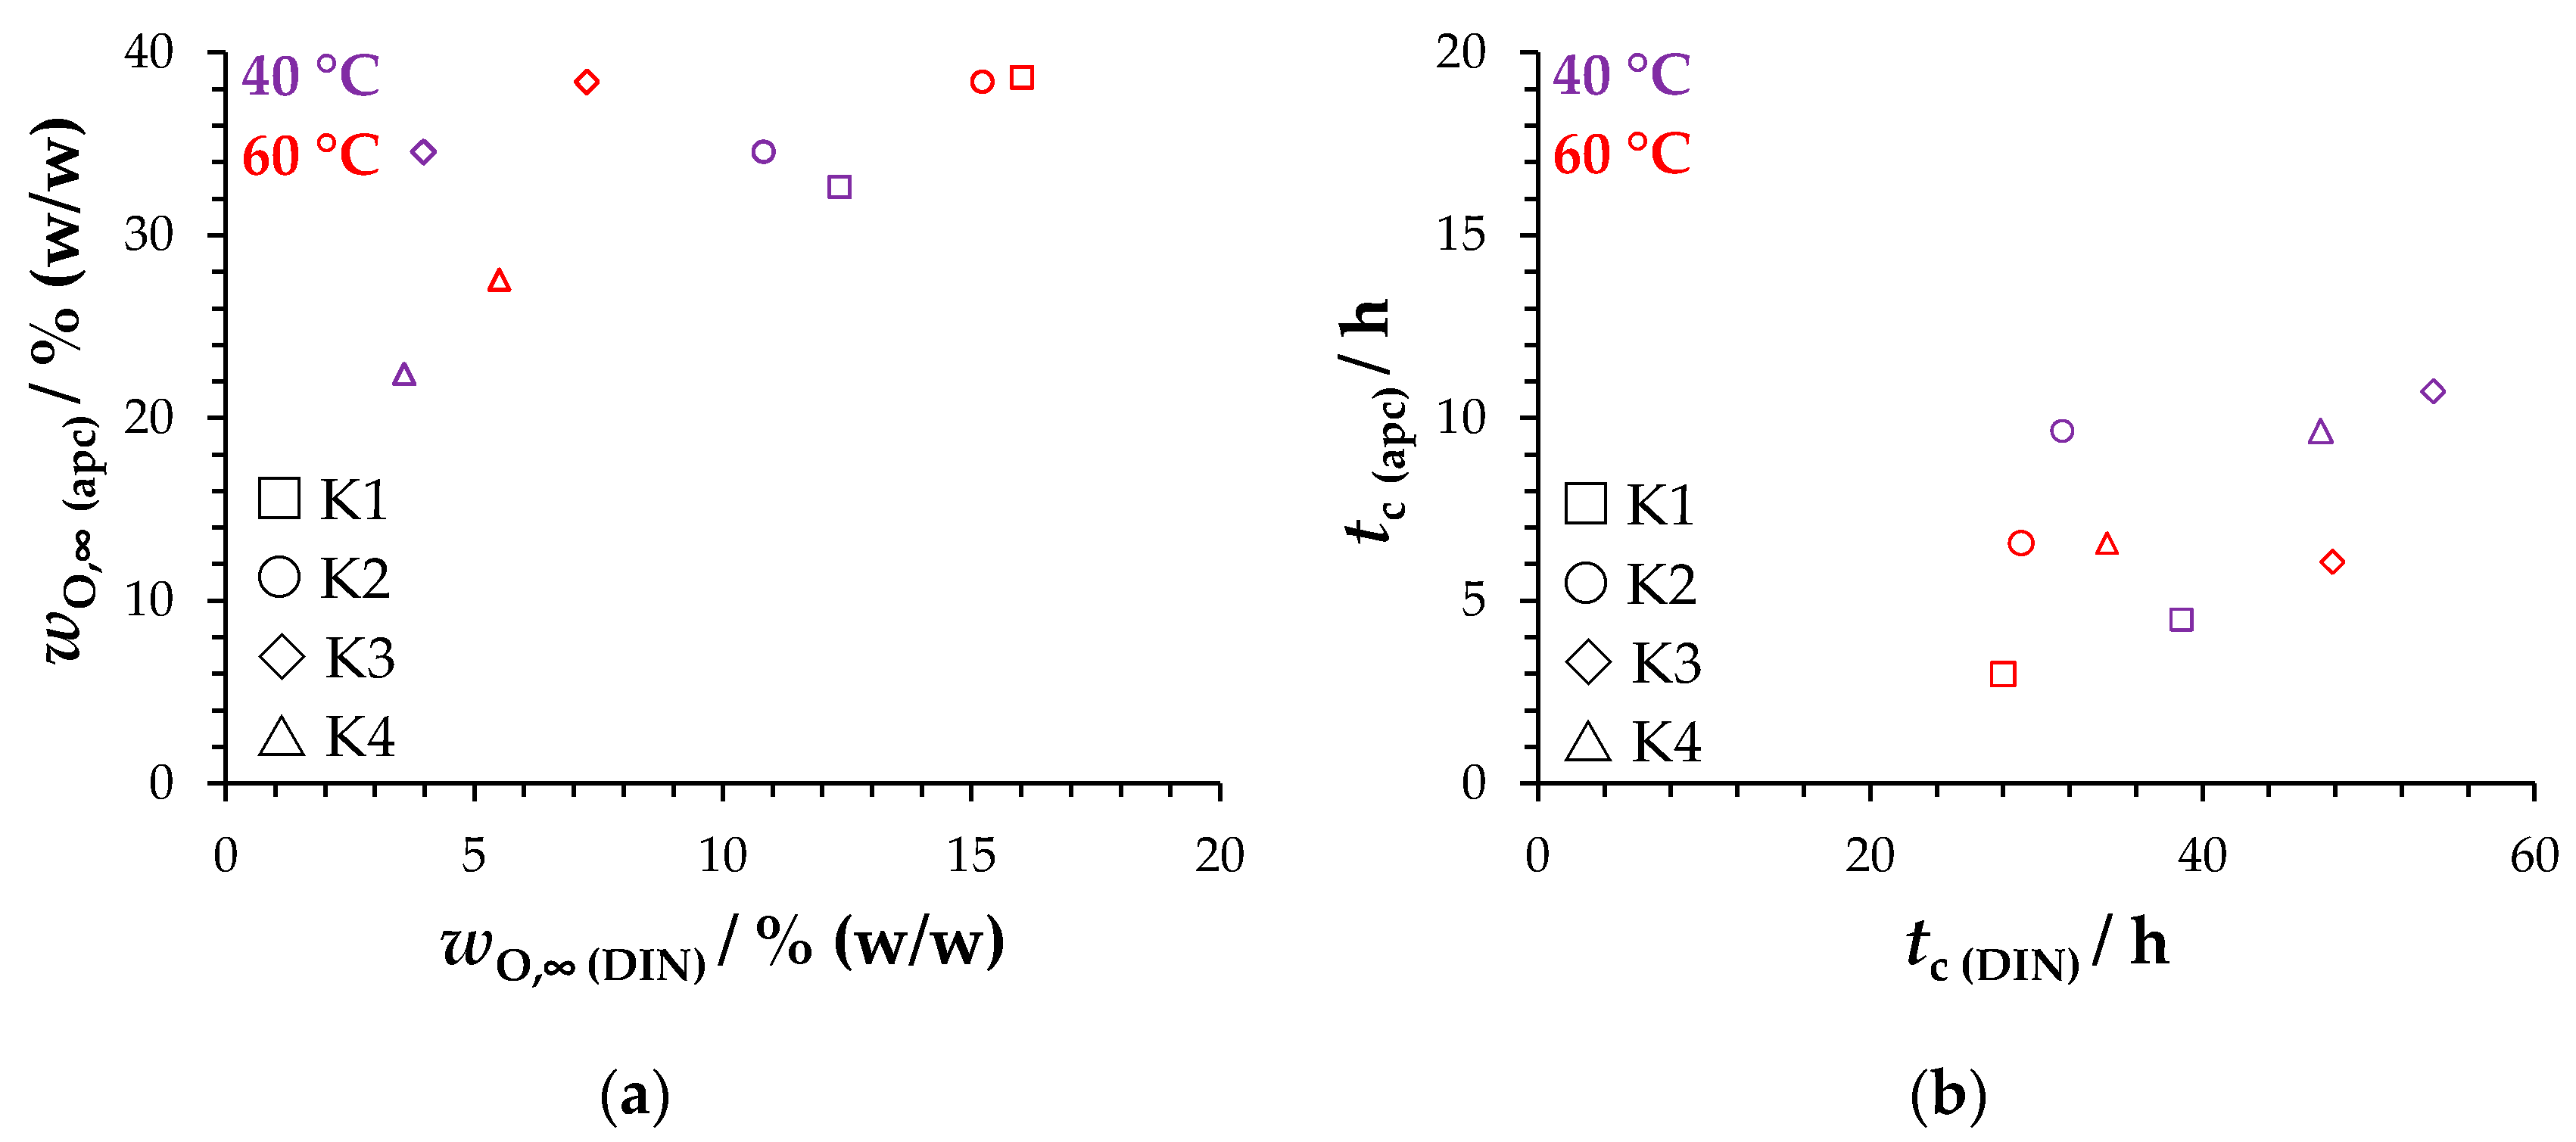
The parity plots in
Figure 16 for maximum oil separation
(
Figure 16a) as well as characteristic time
tc (
Figure 16b) do not reveal simple correlations between the parameters of the two methods, valid for the greases and temperatures tested.
For the parameter maximum oil separation
, regardless of the measurement method used, the following ranking applies: K1 ≈ K2 > K3 ≈ K4. As mentioned above, this is remarkable because K1 and K2, and K3 and K4, respectively, are differently thickened with Li- and Ca-soaps. They also differ significantly in their flow points (
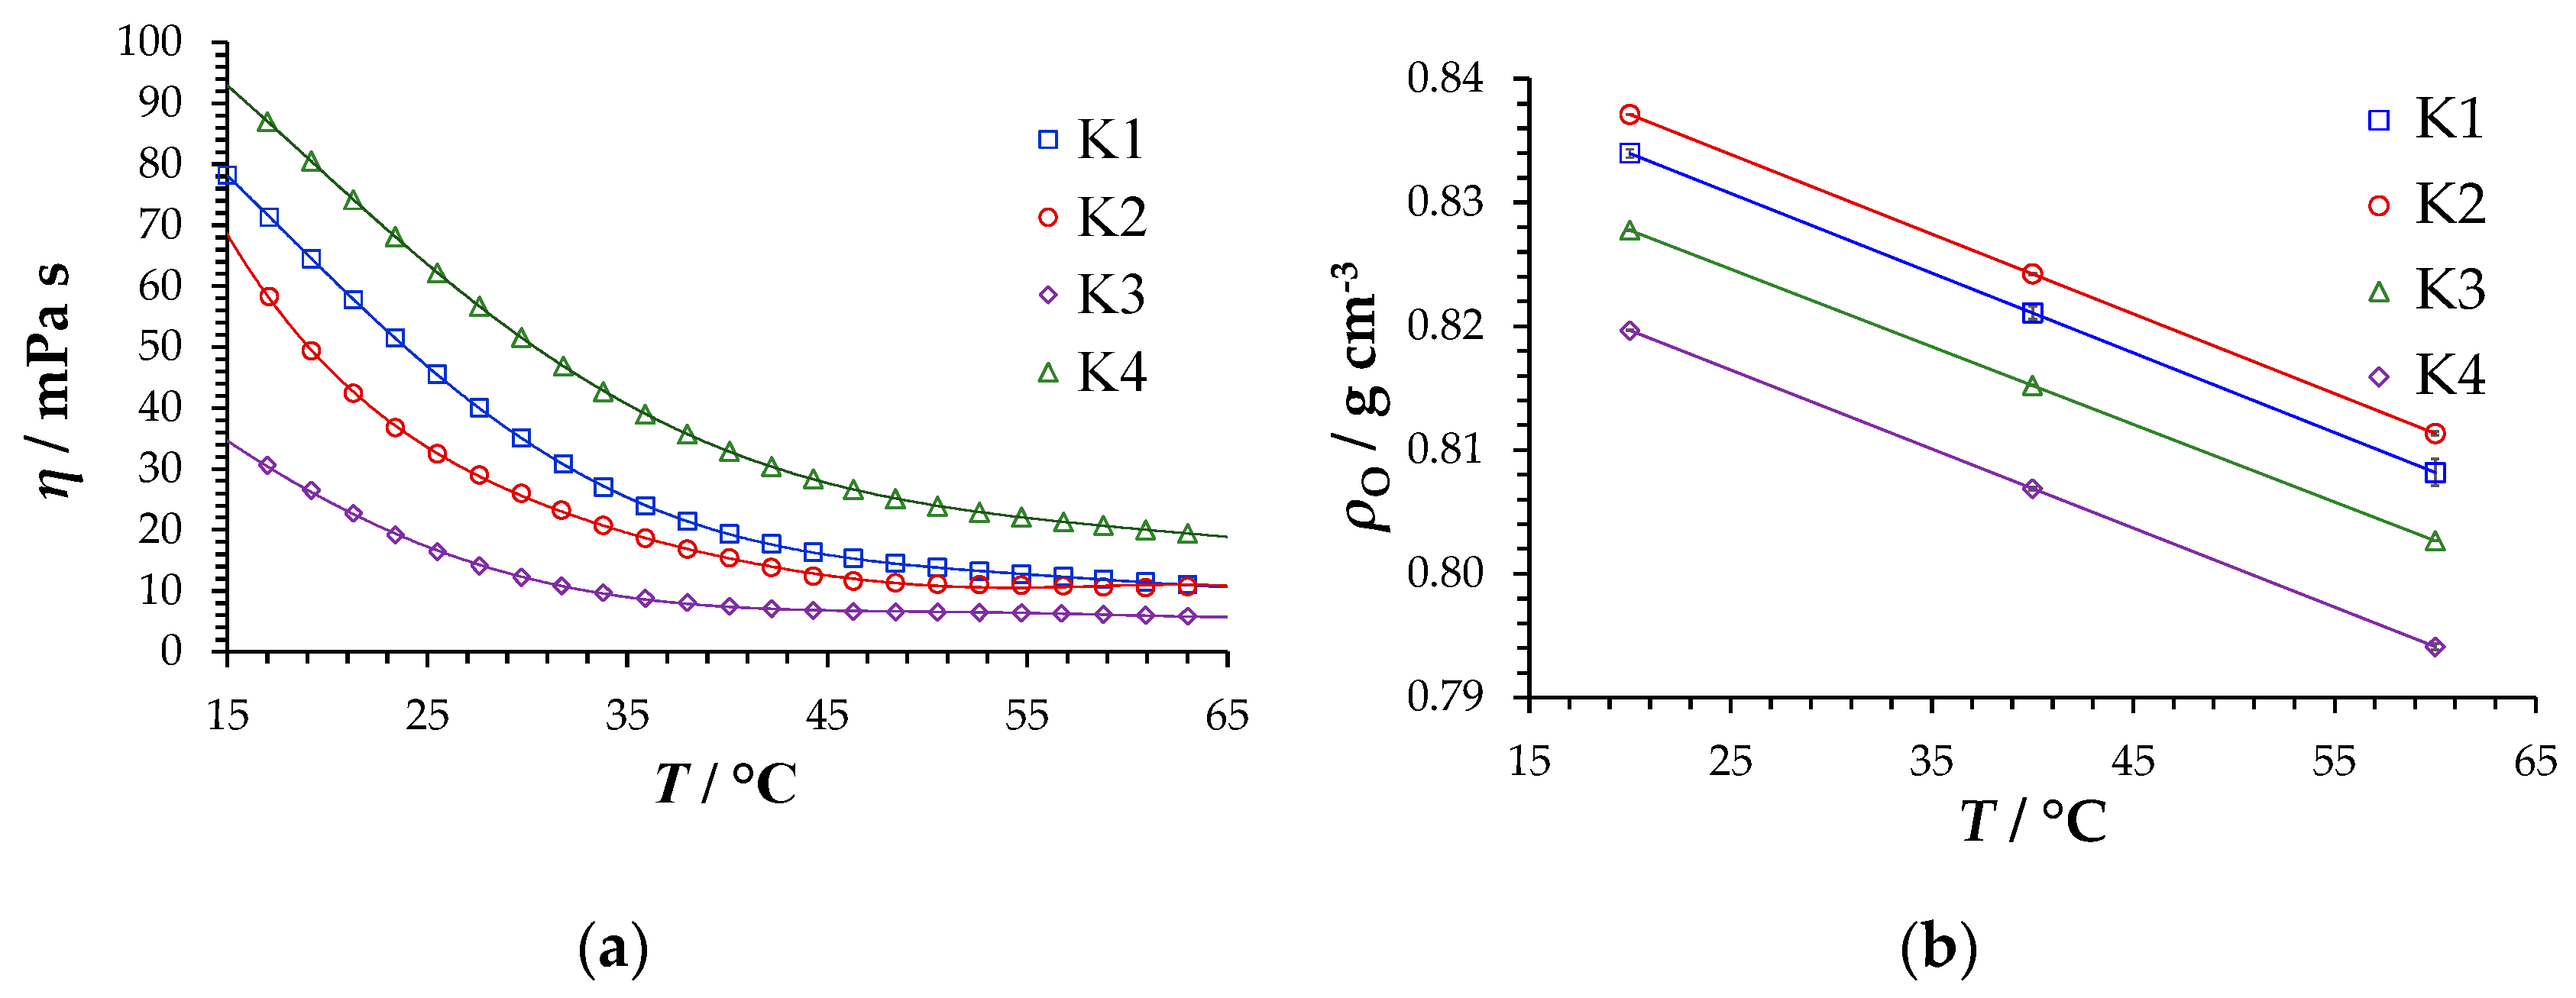
Figure 5). Using the idea of sponge-like thickening structures, the structures of the lubricating greases K1 and K2 can be compressed more than those of K3 and K4.
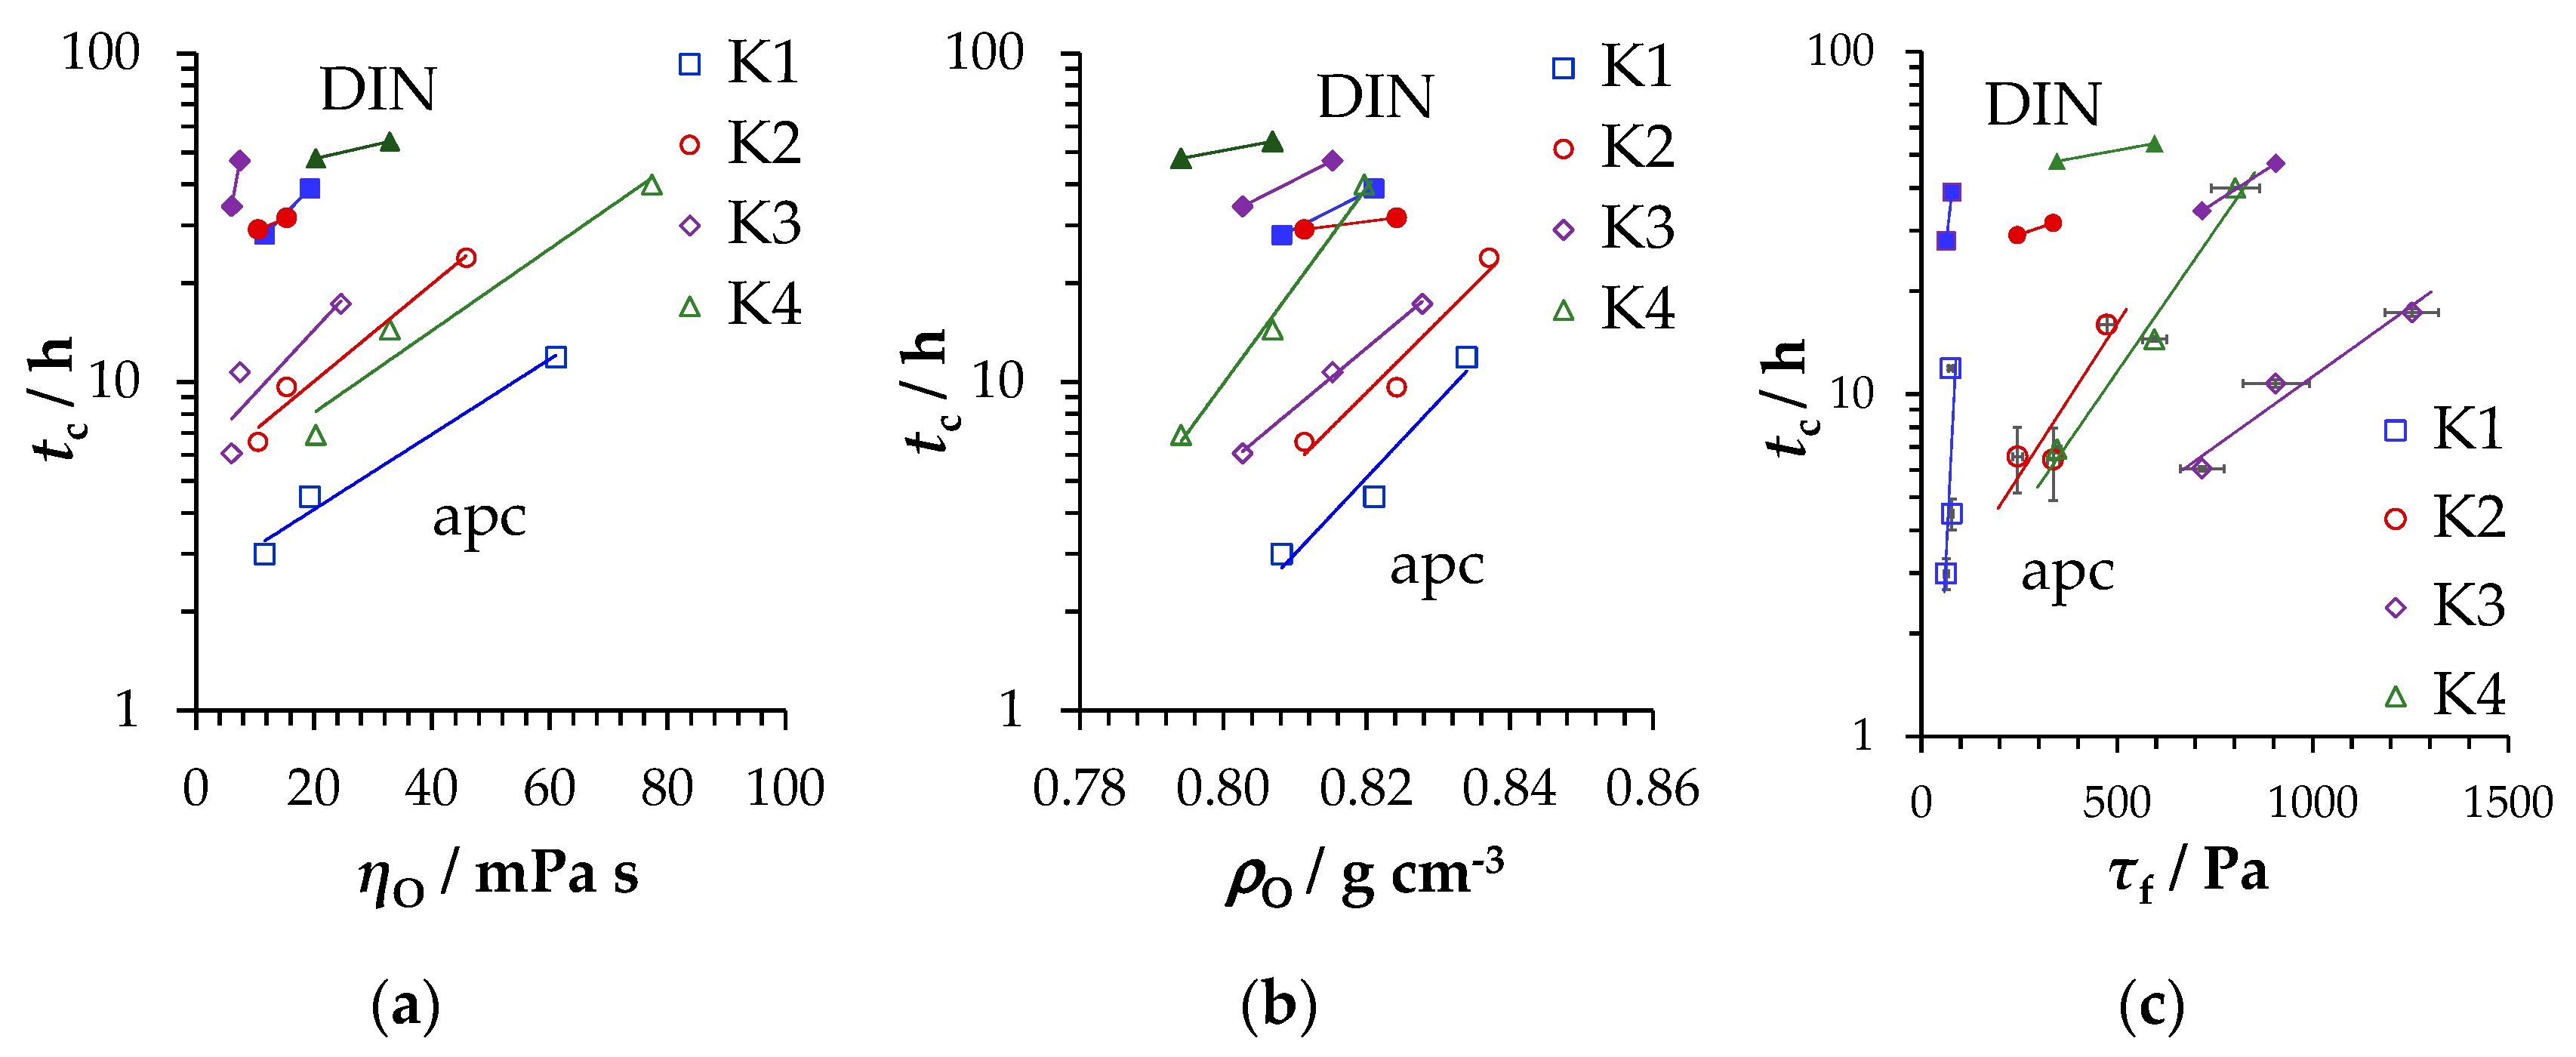
The order in which the characteristic time
tc decreases correlates less with the order of viscosities or densities of the deposited oils (
Figure 17a,b) than with the flow point of the greases (
Figure 17c). Again, sticking to the idea of a sponge structure here as well, it seems that it is not the oil property but the deformability of the porous thickener particle structure under mechanical load that is decisive for the oil separation rate.


