Abstract
The use of numerical simulations for tool tryout and process control is becoming increasingly prevalent. In this work, the deep drawing process of a car inner door panel of DC06 mild steel is numerically analyzed and compared with industrial process results. Five batches of DC06 material were analyzed mechanically and tribologically. Diverse tribological models were developed based on experimental strip drawing tests, where a Coefficient of Friction (CoF) was obtained as a function of contact pressure, sliding velocity, and amount of lubricant. A topography analysis was defined to compare material batches and to replicate industrial tool conditions. The simulation was fed with three tribological models: constant (CoF 0.15), Filzek pressure and velocity dependent, and TriboForm with lubrication zones. Thinning, Forming Limit Diagram (FLD) and draw-in were used as indicators for the comparison. Using the industrial tool, both FLD and draw-in were measured and compared with the numerical models. The constant model predicted the most conservative strain state and also differed most from the experimental results. The P-v-dependent and TriboForm models more accurately predicted the experimental results. This work highlights the importance of considering more complex tribological models to feed numerical simulations to yield results closer to real process conditions.
1. Introduction
Sheet metal forming operations are widely used in mass production. Deep drawing, in particular, is prevalent in the automotive, aerospace, and manufacturing sectors. Using this process, complex shapes can be produced with high accuracy while generating minimal material waste. It involves several stages and parameters, including material properties, tool geometry, lubrication, and process parameters such as blank holder force and drawing speed. The main components of the tooling set components for these operations are a blank holder or binder, a die, and a punch.
To evaluate process windows and optimize process parameters, accurate deep drawing simulations are needed. It is widely agreed that tribological phenomena between the workpiece and tool have a significant impact on the accuracy of numerical simulations [1]. The friction coefficient influences material flow, deformation, and wrinkling during the forming process. Excessive friction impedes material feeding into critical areas and can lead to the premature appearance of cracks.
In industry, a constant Coefficient of Friction (CoF) of 0.15 has been traditionally used for a steel part [2,3]. However, several studies have shown that the friction coefficient depends on various factors including contact pressure [4,5,6], sliding velocity [3,4], lubricant type and amount [7,8], temperature [8,9], strain [3], and tool and sheet roughness [6,10,11,12]. Different studies have analyzed these influences [6,8,9,10,11,12,13,14]. It was found that a decrease in the friction coefficient corresponds to an increase in sliding velocities and contact pressures [13]. As the contact pressure increases, asperities present in the topography of the contact surfaces become flattened. This changes surface contact geometry and affects the friction coefficient [15].
Filzek et al. [8] analyzed the effect of tool temperature on the friction coefficient and found that friction increased up to 77% when the temperature was increased from 20° to 80°. The influence of the strain rate and tool roughness on a car inner door panel implementing TriboForm friction models was studied by Sigvant et al. [11], who concluded that tool roughness can be used as an additional parameter to control material flow. They also highlighted the importance of using an accurate friction model to improve simulation results. Zabala et al. [10] examined the impact of local roughness on a stamping process and conducted an exhaustive analysis of the surface topography in different tool areas. They did not observe any substantial differences between the numerical models that considered or did not consider local roughness.
The effect of lubrication was analyzed by Filzek et al. [8] and Dou et al. [15], who observed a notable decrease in the CoF when increasing the amount of lubricant. Lubricant viscosity also plays an important role in the friction coefficient. Under the boundary lubrication condition, the friction coefficient is composed of solid and fluid friction coefficients. The local heating effect of the friction at the peak causes the viscosity of the lubricant to decrease, resulting in a decrease in the coefficient of fluid friction [15,16]. The effect of variability on material properties was further analyzed by Harsch et al. [17,18], who concluded that material fluctuations contributed significantly to the forming process.
This increased understanding of the influence of various parameters on the friction coefficient has led to the development of more complex tribological models and thus more accurate simulation models [10,11,14,19,20]. Hence, a more in-depth analysis of these different friction models—both simple (Coulomb) and more complex—is required. In particular, pressure- and velocity-dependent models and more advanced models such as TriboForm are of great interest. Moreover, in the context of deep drawing processes, the effect of the variability of material properties on the tribological behavior is an important factor to consider.
The present study is developed within this framework. A highly complex part was analyzed and compared with experimental measurements. An advanced numerical model varying forces by zones and including spacing blocks was developed. Five batches of the same material used in serial production by Ford Valencia in Spain were analyzed. A mechanical characterization and topography analysis was carried out, and several strip drawing tests at various contact pressures, sliding velocities, and amounts of lubricant were performed. The variability in both mechanical properties and friction was analyzed for five batches of the same material, since variability in mechanical properties between batches of the same material is known to influence the final stamping quality [21]. Different tribological models were developed from the experimental tests to feed simulation models. The numerical models were analyzed and compared using the Forming Limit Diagram (FLD) and draw-in experimental measurements.
2. Methodology
2.1. Sheet Material
The material analyzed was a DC06 cold-rolled mild steel of 0.65 mm thickness with a galvanized iron (50G50G-GI) coating. This is a mild–low carbon steel widely used for cold forming, with excellent deep drawing properties. The sheet material was Electro Discharge Textured (EDT textured) by the steel maker [22], which is a common practice in the automotive industry to improve the tribological system.
2.2. Mechanical Characterisation
Tensile tests were performed following the ISO 6892-1:2019 standard. The samples were cut out in rolling, diagonal (45°), and transversal directions. Tensile tests were conducted on three specimens for each rolling direction and per batch. To obtain the strains in the specimen, a deformation analysis with Image Digital Correlation (DIC) was carried out. The DIC-based system employed to develop the required measurements was GOM Aramis software [23].
Forming Limit Diagrams (FLDs) are commonly employed to assess the formability of deep drawing processes [24,25]. FLD analyses the likelihood of necking occurring during the tryout phase. In this work, Nakajima tests following the ISO 12004-1 standard were employed to determine the FLC of the five batches of DC06 mild steel. As in the tensile tests, the DIC system was used for strain measurement.
2.3. Topography Analysis
It has been shown in the literature that sheet roughness plays an important role in deep drawing [26]. The roughness of the sheet should be carefully considered and controlled during the manufacturing process to optimize the process. A low roughness surface can decrease the frictional forces and result in lower forces required for the deep drawing process. This can lead to improved surface quality of the finished product and less tool wear. Surface treatments or coatings can be applied to the sheet to achieve the desired surface roughness for the specific deep drawing application [7]. EDT texturing allows the lubricant entrapping during deep drawing and decreases the CoF of the materials.
To analyze the topography, the samples were first cleaned with acetone to eliminate any residue. Then, they were examined with a SensoFar S-NEOX optical profilometer using the interferometry technique (20× Di objective, acquisition area: 1665 × 1253 µm2). The surface topography parameters on the primary surface (S-F) were computed using SensoMap Premium 7.4 metrology software for data post-processing in accordance with the ISO 25178 standard [27].
From the five materials analyzed, the characteristic features of the surfaces were evaluated using a set of topographical parameters from ISO 25178 [27]. These describe height (Sa, Sq, Sz, Ssk), spatial (Str, Std), and functional (Vmp, Vvv) properties. In this work, the following height properties of each batch were measured. Some of the main parameters are described below.
- Average roughness (Sa). The arithmetic mean of the absolute value of the height within the surface. It is the most commonly used parameter to assess surface topography, together with the two-dimensional roughness parameter Ra.
- Root mean square roughness (Sq). A measurement of the asymmetry of the surface deviation about the mean plane.
- Maximum height (Sz). The sum of the maximum value of the surface peak height and the maximum value of the surface valley within the defined area.
- Skewness (Ssk): The degree of bias of the roughness shape, i.e., the asperity of the surface. A positive skewness gives rise to a surface with more peaks or asperities, whereas a negative skewness leads to more valleys.
2.4. Experimental Measurements
Recording and measuring press and process parameters are critical to the development of an accurate numerical model. Thus, tool roughness and the amount of lubricant in different zones of the part were measured.
Several roughness measurements were taken from the industrial tool, in die, punch, and blank holder. Ra values from 0.41 μm to 2.44 μm were measured. Average values of the two-dimensional Ra parameter were obtained, and an average Ra value for the binder of 0.7 µm was calculated. This Ra average value was used as reference to prepare die blocks for the strip drawing tests (Section 2.5).
In the industrial tests, the amount of lubricant was measured in 18 different zones of the part (9 zones per side) prior to stamping. In the industrial tool, a re-oiler is used that applies different amounts of lubricant to the upper and lower parts of the precut.
To assess simulation accuracy, the draw-in of the part was measured in 11 different zones, and the FLD was obtained in various zones with GOM ARGUS. “Draw-in” refers to the amount of displacement of the edge of the part towards the die cavity during the forming process.
2.5. Strip Drawing Tests
Tribological conditions were characterized with the strip drawing test. This test emulates the conformal contacts in a deep drawing process [12,13] and reproduces the tribological conditions between the dies and sheet material. The strip drawing test machine employed in this work consists of two closed-loop-controlled servo driven axes. Figure 1 depicts the experimental set up. It consists of an upper movable die block, a lower fixed die block, and a sheet metal strip positioned between them.
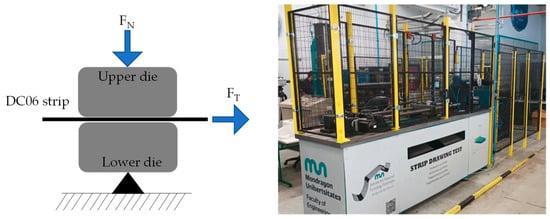
Figure 1.
Scheme of the strip drawing test (left) and strip drawing test machine used for the tests (right).
In this test, a predefined normal force (FN) is applied by moving the upper die using a servomotor coupled to a mechanical jack. Subsequently, the strip is pulled between dies at a constant sliding velocity (v). Both tangential (FT) and normal (FN) forces are recorded during the test. FT is the sum of interface friction forces between the sheet and the upper and lower dies. Therefore, the CoF (µ in Equation (1)) can be calculated with the Coulomb friction law (Equation (1)):
The evaluation area of the friction coefficient was set as in Merklein et al. [13] and Zabala et al. [12]. The die blocks were manufactured from grey cast iron GGG70. A Plus- Plasma Nitriding (PPD) coating was applied to replicate the industrial tool surface, obtaining a surface hardness of 62 HRc. The contact surface of the die blocks was of 30 mm width and 50 mm length. The blocks were prepared with industrial hand polishing methods to obtain the average Ra of the industrial tool (0.7 µm).
Some of the influencing factors of the friction coefficient—sliding velocity, contact pressure, and amount of lubricant—were mapped to investigate their degree of dependency. Table 1 sets out the values assumed for each factor. The strip drawing tests were performed at four different sliding velocities: 10, 50, 100, and 150 mm/s and at five different contact pressures: 2, 5, 10, 15, and 25 MPa. Contact pressure values were based on typical contact pressures in deep drawing operation parts and a first screening conducted by numerical analysis. It was not possible to exceed the chosen upper value of the contact pressure in the strip drawing test due to plastic elongation of the strip. Sliding velocity value levels were set based on the forming process of the inner door part, and tests were performed up to machine maximum sliding velocity.

Table 1.
Analyzed parameters on the strip drawing tests.
Prior to conducting the strip drawing tests, both the strips and die surfaces were cleaned with acetone. The strips were then lubricated on each side with Ferrocoat 6131 metal forming lubricant. This lubricant has a relative density of 0.87 g/cm3 at 50° and a viscosity of 19.6 mm2/s at 40 °C. A micropipette was used to apply the specified amount of lubricant in each test. Three repetitions per sliding velocity and contact pressure were tested to ensure representative results.
Six amounts of lubricant were tested. First, to observe variations between the five batches analyzed, 0.5 g/m2 of lubricant was applied for all contact pressures and a sliding velocity of 10 mm/s. Then, the effect of the amount of lubricant on the friction coefficient was tested with amounts ranging from 0.5 g/m2 to 4 g/m2 for the same sliding velocity and various pressures. Finally, three lubrication levels were tested based on production measurements: 1 g/m2, 2.4 g/m2 (average lubrication), and 4 g/m2 (maximum measured). These results were used to develop the friction models that generated the inputs of the numerical model. The results were also used to reproduce the distribution of lubricant in each zone and on each side of the sheet.
2.6. Tribological Models
To analyze the impact on the numerical results, three models were evaluated:
- Constant. In most industrial simulations, a Coulomb constant model is used for steel deep drawing. In this work, the typical constant value of 0.15 was applied so as to compare with the remaining models.
- Pressure and velocity dependent (P-v dependent). Several studies have demonstrated the influence of contact pressure and sliding velocity on the friction coefficient [4,5,8,10]. In this work, a pressure- and velocity-dependent friction model to calculate the effective coefficient of friction was assumed (Equation (2)) following the potential distribution of Filzek [4]:where is the base friction coefficient, is the contact pressure, is the reference pressure, is the velocity of the sheet relative to the tool in contact, is the reference velocity, and a and e are the velocity factor and pressure exponent, respectively. This model takes into account the decrease in the friction coefficient due to the increase in relative velocity and contact pressure between the sheet and tool in contact. In this work, three P-v-dependent models were implemented for the following amounts of lubricant: 1, 2.4, and 4 g/m2. The maximum, minimum, and mean lubricant amount values were selected to analyze the differences in the tribological models for these boundary values. For simulation, a P-v-dependent single model with a medium level of lubricant was defined, as AutoForm is not able to create different models for each side of the sheet for this tribological model type. Therefore, a simulation model with a P-v-dependent 2.4 g/m2 model was implemented. The average between the two faces was considered for each measured zone, and it was assumed that the P-v-dependent model for the average amount of lubricant was an appropriate approximation.
- TriboForm with lubrication zones. In this case, TriboForm® software was used to create a contact-pressure- and sliding-velocity-dependent model. This model also considers material elasto-plasticity and tool roughness. AutoForm has a TriboForm plug-in that permits implementation of this complex model. It can also define different amounts of lubricant in various zones and sides of the sheet by means of lubrication spots. Nine lubrication zones were defined for each zone and side of the sheet to replicate industrial conditions. These amounts of lubricant were measured in the industrial precut. Three tribological models were defined for three lubricant levels based on the industrial measurements: 1, 2.4, and 4 g/m2. As for the P-v-dependent models, the maximum, minimum, and mean values were selected to analyze the differences between models. To feed the simulation model, the TriboForm 1 g/m2 model was used as the basis. Additional amounts of lubricant were applied to the different zones and sides of the sheet based on experimental measurements with lubrication spots.
The models can be arranged in descending order of complexity as follows: TriboForm with lubrication zones, P-v dependent, and constant. To assess accuracy and validate the models, R-squared (Equation (3)) and Root Mean Squared Error (RMSE) (Equation (4)) were calculated for the P-v-dependent and TriboForm models:
where is the predicted value, is the experimental value, is the mean value of the experimental data, and n is the number of observations.
2.7. Simulation Set-Up
The case study was a DC06 mild steel inner car door panel (Figure 2). This is an industrial component with complex geometries, stretched curvatures, and harsh transitions. Figure 2 illustrates the drawn panel together with the tool set up. As can be observed, there are draw-beads in the blank holding area, mainly to restrain material flow and to improve the robustness of the deep drawing process [11]. The industrial tool has 11 spacer blocks and 8 positioners; these are also included in the numerical model. Table 2 summarizes the principal characteristics of the simulation parameters.
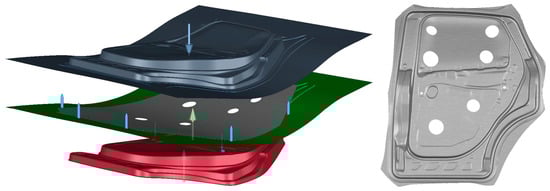
Figure 2.
AutoForm Fe model set-up (left) and final part (right). In AutoForm set-up, from top to bottom: die, sheet and binder, and punch. Spacer blocks are not shown in the set-up.
Table 2.
Main material properties and process parameters of numerical simulation set-up.
DC06’s elasto-plastic behavior is shown in Table 2. These parameters were used as input for the simulation models. It should be noted that the Swift Hockett–Sherby law [28] was assumed for the hardening model, as it has provided accurate modelling for mild steel types in such applications. Regarding yield criteria, the BBC2005 [29] law was assumed.
As regards to mesh type and size, for each simulation elasto-plastic shell elements with 11 integration points through thickness were defined.
Regarding boundary conditions, it was a single action press. The punch was the fixed tool, whereas the die and binder had a vertical movement. As the industrial tool was a multipoint cushion system with four independent cylinders, one column per independent cylinder was defined in the binder. In this work, the binder was considered to be an elastic tool (force controlled), whereas the punch and die were rigid tools. The value of the elastic deformation of the binder was approximated by a single value (tool stiffness) to give a realistic pressure distribution in the contacting area. In this work a tool stiffness of 50 MPa/mm was defined, as it is the value recommended for AutoForm for these types of tools [30]. The 11 spacer blocks with different thicknesses of the industrial tool were also modeled. The stiffness of each spacer block was calculated as an approximation of an elastic beam [30], since the geometry and the material of each spacer block were known.
To obtain a numerical model as close as possible to reality, the three tribological models described in Section 2.6 (constant, P-v dependent and TriboForm with lubrication zones) were employed. The results of each configuration were compared using FLD, draw-in, and thinning as variables.
3. Results
3.1. Tensile Tests and FLDs
Figure 3a,b plot the global ranges of variation of the true strain–stress curves and the experimental Forming Limit Curves (FLCs) obtained for the five batches of DC06 mild steel. FLC separates the safe and failure zones. Table 3 sets out the main mechanical properties of the batches analyzed: 0.2% offset yield strength (Rp 0.2%), ultimate strength (Rm) Lankford coefficients at 0°, 45°, and 90° (r0, r45, and r90), and hardening exponent (n). Similar values were observed between batches.
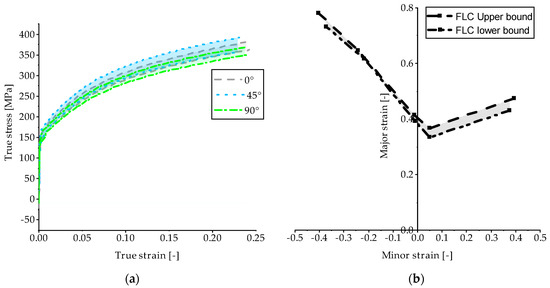
Figure 3.
(a) True stress–strain curves in the rolling directions 0°, 45°, and 90°; (b) Upper and lower Forming Limit Curves. In both cases the global upper and lower limit curves for each test are shown for the 5 batches.
Table 3.
Mechanical properties of the five batches of DC06 material.
3.2. Topography Analysis
The surface topographies of the five batches are shown at the same scale in Figure 4. All of the batches presented similar surface topography, with small rough cavities. Figure 5 depicts the height descriptor parameters (Sa, Sq, Sz, and Ssk) for the measured areas of the five batches. The average roughness (Figure 5a) varied slightly between batches. Sa ranged from 1.23 (DC06_2) to 1.43 μm (DC06_4). In the case of the die blocks, a Sa of 0.65 μm was measured.
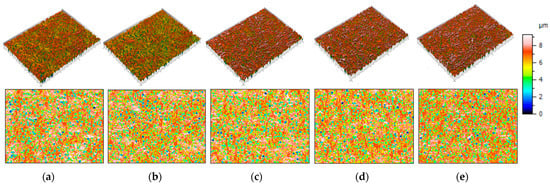
Figure 4.
Representative axonometric (above) and two-dimensional (below) projections of the surface textures corresponding to samples of the five batches: (a) DC06_1; (b) DC06_2; (c) DC06_3; (d) DC06_4; and (e) DC06_5.
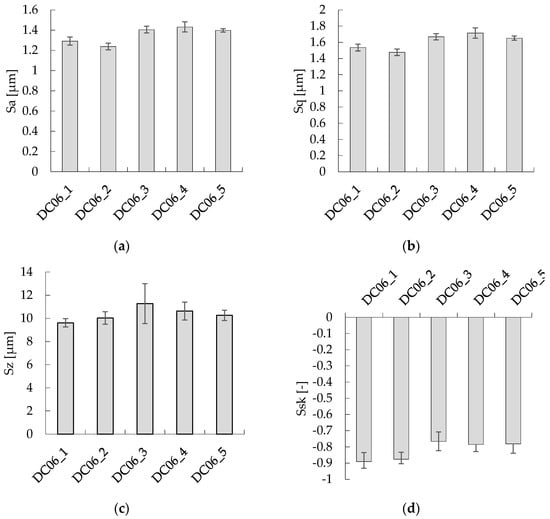
Figure 5.
Height descriptor parameters of the five different batches of DC06 material: (a) average roughness Sa; (b) root mean square roughness Sq; (c) maximum height Sz; and (d) skewness Ssk.
3.3. Strip Drawing Tests
The results obtained from the strip drawing tests are described in this section. Figure 6a plots the friction coefficient of the five analyzed batches. These tests were performed at a sliding velocity of 10 mm/s and contact pressures of 2, 5, 10, and 15 MPa. No clear variation in the CoF was observed between batches; therefore, batch DC06_3 was selected for further tests on lubricant amounts, contact pressures, and sliding velocities.
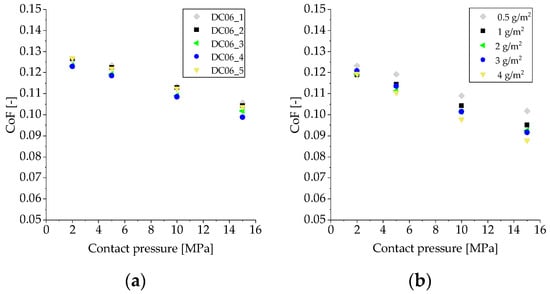
Figure 6.
CoF vs. contact pressure of (a) the five the material batches analyzed (DC06_3) at 10 mm/s and 0.5 g/m2 and (b) one of the batches analyzed (DC06_3) for different amounts of lubricant at 10 mm/s.
The results of the strip drawing tests for different amounts of lubricant are presented in Figure 6b. It can be seen that increasing the amount of lubricant resulted in a slight decrease in CoF. A maximum difference of 15.73% was found between 0.5 g/m2 and 4 g/m2 of lubricant at a contact pressure of 15 MPa. This decrease in the CoF with contact pressure followed the same trend for all levels of lubricant. The difference between the CoF of the minimum and maximum amounts of lubricant also increased slightly as the contact pressure rose.
Figure 7 shows the CoF of DC06_3 for pressures ranging from 2 to 25 MPa and at four sliding velocities (10, 50, 100, and 150 mm/s). Each graph depicts the tests for the different lubrication levels measured in production: 1 g/m2 (Figure 7a), 2.4 g/m2 (Figure 7b), and 4 g/m2 (Figure 7c). The results show that both contact pressure and sliding velocity have a significant influence on the CoF. The decreasing trend of the CoF with contact pressure is more pronounced from 2 to 10 MPa.
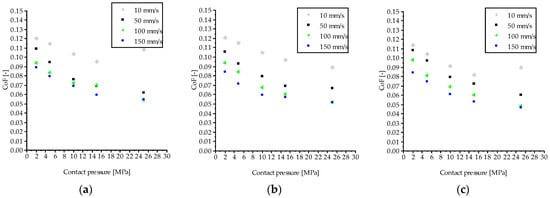
Figure 7.
CoF vs. contact pressure of the DC06_3 batch at different sliding velocities (10, 50, 100, and 150 mm/s): (a) 1 g/m2; (b) 2.4 g/m2; and (c) 4 g/m2.
For 1 g/m2 (Figure 7a) and 4 g/m2 (Figure 7c), a slight increase in the CoF can be observed at the end of the test, although there was no galling in the die blocks. For the minimum lubrication, the CoF ranges from 0.1208 (at 2 MPa and 10 mm/s) to 0.054 (at 25 MPa and 150 mm/s). At the maximum level of lubricant, the CoF ranges from 0.1140 (at 2 MPa and 10 mm/s) to 0.047 (at 25 MPa and 150 mm/s).
3.4. Tribological Models
The pressure–velocity-dependent tribological models were developed based on the DC06_3 strip drawing tests results. For comparison, the models were evaluated under the same contact pressures (2, 5, 10, 15, and 25 MPa) and sliding velocities (10, 50, 100, and 150 mm/s) as the experimental tests.
- Pressure and velocity dependent (P-v dependent). Figure 8 plots the three P-v-dependent models developed for the minimum (Figure 8a), mean (Figure 8b), and maximum (Figure 8c) amounts of lubricant. As observed in the experimental tests, the CoF presents higher values for lower sliding velocities and lower pressures. The boundaries of all the P-v-dependent models are well defined for small contact pressures (2 MPa), whereas for higher contact pressures there are some disparities with respect to the experimental results. The P-v-dependent models for 1 and 4 g/m2 report a slight overestimation of the CoF for high contact pressures and sliding velocities. As an example, the P-v-dependent model for 4 g/m2 presents a small disparity for a sliding velocity of 150 mm/s, in that it estimates a CoF of 0.55 versus an experimental value of 0.047. The increase in the CoF for 25 MPa and 10 mm/s in 1 and 4 g/m2 lubrication levels cannot be replicated by the P-v-dependent models, which show a maximum deviation of 18% with respect to the experimental value for the 1 g/m2 P-v-dependent model. The coefficients of the P-v-dependent friction models (Equation (2)) were calculated with least squares methodology using Microsoft Excel and are presented in Table 4. The P-v-dependent model for 2.4 g/m2 reported the lowest error, with an RMSE of 0.04 (Table 5) and model boundaries in strong agreement with the experimental results.
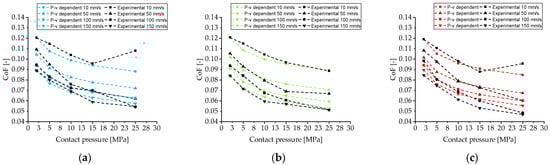 Figure 8. CoF vs. contact pressure of the DC06_3 batch at different sliding velocities (10, 50, 100, and 150 mm/s). P-v-dependent model and experimental data for different amounts of lubricant: (a) 1 g/m2; (b) 2.4 g/m2; and (c) 4 g/m2.
Table 4. Coefficients of the P-v-dependent friction models for each amount of lubricant.
Table 5. R-squared and RMSE calculated for the tribological models.
Figure 8. CoF vs. contact pressure of the DC06_3 batch at different sliding velocities (10, 50, 100, and 150 mm/s). P-v-dependent model and experimental data for different amounts of lubricant: (a) 1 g/m2; (b) 2.4 g/m2; and (c) 4 g/m2.
Table 4. Coefficients of the P-v-dependent friction models for each amount of lubricant.
Table 5. R-squared and RMSE calculated for the tribological models.
- TriboForm with lubrication zones. These models were composed of a cast iron tooling with an average roughness of Sa = 0.65 µm and sheet material with a roughness of Sa = 1.4 μm. The nine lubrication zones defined for each side of the sheet are illustrated in Figure 9. Note that the lubrication scope in the TriboForm library created ranges from 0.5 to 3 g/m2. Hence, zones with amounts of lubricant higher than 3 g/m2 were limited to a maximum of 3 g/m2.
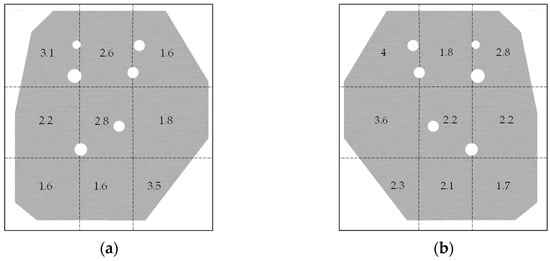 Figure 9. Amount of lubricant (in g/m2) for the lubrication zones defined on each side of the part: (a) top side and (b) bottom side.
Figure 10 shows the three TriboForm models developed for the minimum (Figure 10a), mean (Figure 10b), and maximum (Figure 10c) amounts of lubricant. The trend is the same as that for the experimental results and the P-v-dependent models, i.e., the CoF is lower with increasing contact pressure and sliding velocity. Note that for all TriboForm models there is an overestimation of the CoF for lower contact pressures (2 MPa) and low sliding velocities. This overestimation is about 11.97% (Figure 10a), 5.64% (Figure 10b), and 6.09% (Figure 10c) with respect to the experimental values for 2 MPa and 10 mm/s. On the other hand, the TriboForm models accurately predicted the CoF for high contact pressures and sliding velocities.
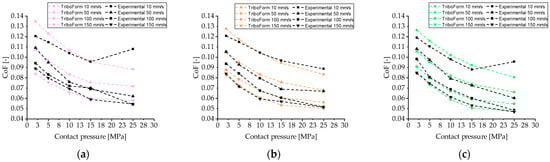
Figure 10.
CoF vs. contact pressure of the DC06_3 batch at different sliding velocities (10, 50, 100, and 150 mm/s). TriboForm model and experimental data. (a) 1 g/m2; (b) 2.4 g/m2; and (c) 4 g/m2.
To assess the accuracy of the models, R-squared and RMSE were calculated for each of the tribological models developed (Table 5). All models report similar RMSE values, ranging from 0.04 to 0.07. The lowest RMSE was found for both the TriboForm and P-v-dependent friction models for an amount of lubricant of 2.4 g/m2. The higher RMSE values from the 1 and 4 g/m2 models were due to a singularity in the CoF value for a contact pressure of 25 MPa and sliding velocity of 10 mm/s, among other factors. As for R-squared, all models presented similarly high values. For 2.4 g/m2, the highest R-squared was found for both the P-v-dependent and TriboForm models.
For the purpose of comparison, Figure 11 shows all tribological models (constant, P-v dependent, and TriboForm) with their extrapolated values. In the plot, the sliding velocity ranges from 1 to 300 mm/s and the contact pressure ranges from 1 to 40 MPa. For sliding velocities and contact pressures outside the tested range, different trends can be observed for each model. At these boundaries, CoF values ranging from 0.029 to 0.146 were obtained. In terms of the amount of lubricant, the greater the amount the lower the CoF. However, as mentioned previously, no substantial differences were observed.
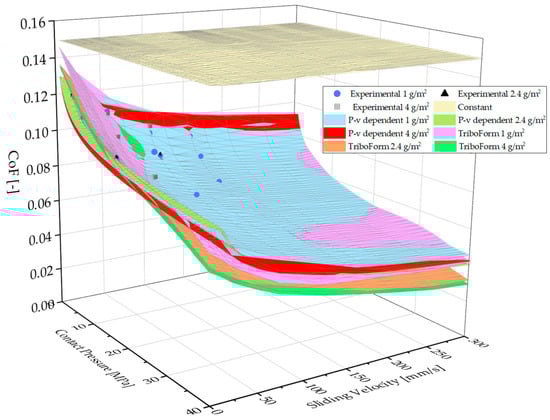
Figure 11.
A 3D plot of CoF vs. contact pressure and sliding velocity of constant, P-v-dependent, and TriboForm models. The dots represent experimental points from strip drawing tests.
For sliding velocities higher than 150 mm/s, the 2.4 and 4 g/m2 TriboForm models presented the lowest friction coefficient for all contact pressures. In the case of sliding velocities lower than 10 mm/s, all the TriboForm models reported a higher CoF than the P-v-dependent models for the same contact pressures. For example, the TriboForm predicted CoF reached a value of 0.146 for 1 MPa, 1 mm/s, and 1 g/m2, which is 11.81% higher than the P-v-dependent model for the same conditions. For sliding velocities higher than 150 mm/s and high contact pressures (40 MPa), there are also differences between the two models. For example, for 300 mm/s a global minimum CoF of 0.025 was obtained in the TriboForm model of 4 g/m2, versus a CoF value of 0.043 in the P-v-dependent model of 4 g/m2. With respect to the constant model (CoF 0.15), substantial differences were observed. For high contact pressures and sliding velocities (e.g., 40 MPa and 300 mm/s), the P-v-dependent model estimated a CoF 64.67% lower than the constant model. Under the same conditions, the TriboForm model estimated a CoF 76.95% lower than the constant model. The TriboForm model for 1 g/m2 estimated a CoF value of 0.419 at 40 MPa and 300 mm/s, which was 40.13% higher than the TriboForm model for 4 g/m2 (with a CoF of 0.029).
Overall, the difference between the P-v-dependent and TriboForm models was higher for contact pressure and sliding velocity values outside the strip drawing test range. This was especially the case for the TriboForm 2.4 and 4 g/m2 models, with the former presenting a marked change in the trend for these extreme values.
3.5. Numerical Results
Figure 12 depicts the FLDs of the car inner door panel for the three tribological models studied. The yellow zone represents the 20% safety margin of the FLC. The cloud of points denotes the principal strain states of each element of the part. Note that these colored zones are valid for linear strain paths. As the complexity of the friction model increases, an evident decrease in the overall stretching state of the component can be observed from left to right. The use of the traditional constant friction model employed in industrial simulations in a force-controlled model with spacer blocks led to severe splits in several zones of the part (see Figure 13a). Compared with the constant model, the P-v-dependent (Figure 12b) and TriboForm (Figure 12c) models reported a drastic change in FLD and delivered a valid process without any risk of splits. Note that in these two models a significant thickening occurs. This was especially the case for the TriboForm model, where minor strains of −0.506 were achieved in a localized zone of the part.
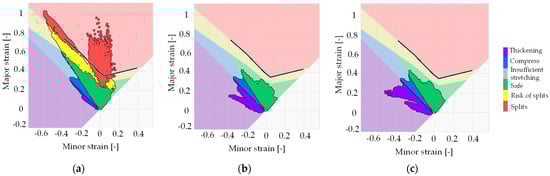
Figure 12.
Simulation results of FLD diagrams of the part applying the three tribological models: (a) constant (mu 0.15); (b) P-v dependent; and (c) TriboForm with lubrication zones. The legend represents the different strain states.
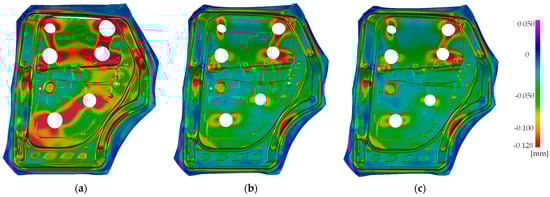
Figure 13.
Thinning of the three tribological models analyzed: (a) constant; (b) P-v dependent, and (c) TriboForm with lubrication zones. Negative values indicate more stretching (or more thinning) of the part with respect to reference thickness.
Figure 13 shows the thinning values of the whole part for each model. Thinning values represent the reduction in the initial thickness (in mm) due to the stretching or compression (thickening) of the part during the process [31]. The scale in the figure indicates the thinning of the material as a negative number, whereas thickening is depicted as positive. In deep drawing industrial operations, a 20% thinning of the initial thickness is defined as the limit of an acceptable part. In this work, for an initial thickness of 0.64, the limit of thinning was 0.128 mm. There is a marked difference between the thinning of the constant model versus the P-v-dependent and TriboForm models. In all the simulations, thickening was observed mainly in the blank holder area of the component. Thickening was also found in certain areas out of the holding zone, which could lead to wrinkles in the industrial process.
Three zones were selected to obtain a more quantitative analysis of the thinning between the three models: zone 1, zone 2, and zone 3 (Figure 14). The maximum thinning (in absolute value) of each zone was selected for the comparison. As can be observed in Figure 14, the constant model presented the highest thinning for all zones. The TriboForm and P-v-dependent models reported the same thinning value in zone 1. The major thinning difference between the P-v-dependent and TriboForm models was observed in zone 2, where the TriboForm thinning was 8.87% lower than the P-v-dependent model. This same zone is where all major differences were found: the constant model predicted a substantial split, as compared with values of 0.248 and 0.226 for the P-v-dependent and TriboForm models, respectively.
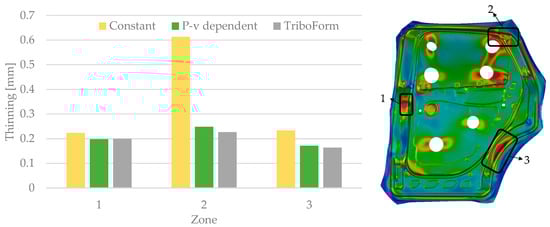
Figure 14.
Thinning (in absolute value) of the three zones (1, 2 and 3) analyzed for the three tribological models. The value of maximum thinning of each zone highlighted was selected for the analysis.
For draw-in measurements, 11 points were selected for the analysis. Their position was based on production measurements, and their coordinates were exactly the same for each of the three numerical models (Figure 15). The figure compares draw-in differences of the P-v-dependent and TriboForm models with respect to the constant model. In general, the trends shown for draw-in corresponded to the strain and thinning results, i.e., major strain values led to low draw-in values.
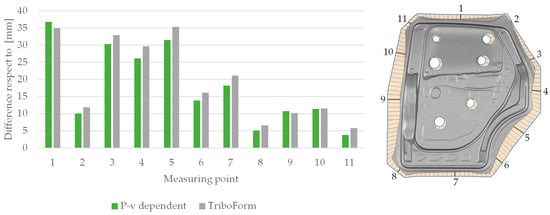
Figure 15.
Difference in draw-in prediction (in mm) for P-v-dependent and TriboForm with lubrication zones models with respect to the constant model (left) for the eleven points analyzed (right).
Overall, both the TriboForm and P-v-dependent models presented higher draw-in values than the constant model at all points analyzed. Significant differences in draw-in were observed for points 1, 3, 4, and 5, reaching 36.79 mm (P-v dependent, zone 1) with respect to the constant model. However, the complexity of the analyzed geometry did not permit identification of any clear trend for all points of the TriboForm and P-v-dependent models. From points 2 to 8 and point 11, higher draw-in values were obtained for the TriboForm model. However, for points 1 and 9, slightly higher draw-in values were obtained for the P-v-dependent model, with a maximum difference of 1.98 mm with respect to the TriboForm model.
3.6. Experimental Measurements
In the industrial process, the draw-in of the 11 points and the FLD were measured. GOM ARGUS was used to measure the strain state of different zones after stamping. For that, a chemical etched pattern applied in the initial precuts was used. The FLD of three critical zones of the part was selected to make a numerical–experimental comparisons. Figure 16a–c illustrate the experimental FLD contours of the selected zones, and Figure 17 shows the differences between numerical draw-in and experimental measurements.
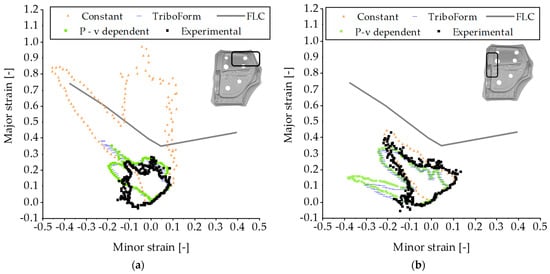
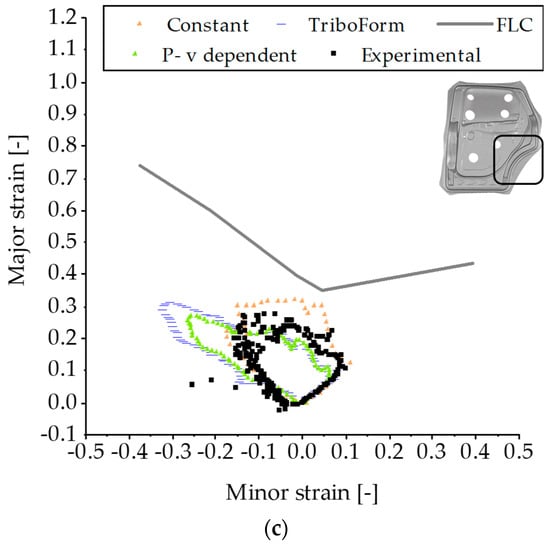
Figure 16.
FLD contour diagrams of three zones of the industrial part. Tribological models (constant, P-v dependent and TriboForm) vs. experimental. (a) Zone 1; (b) Zone 2; and (c) Zone 3.
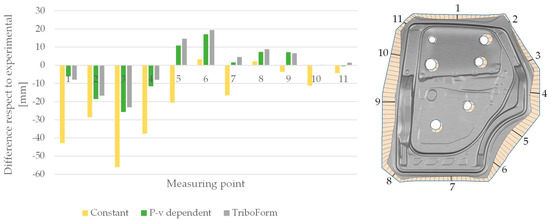
Figure 17.
Differences (in mm) between numerical draw-in of the three tribological models and experimental values for the 11 points analyzed.
4. Discussion
As regards to roughness measurements (Figure 5), a maximum variation in Sa of 16.26% between batches was found (Figure 5). A number of studies [11,32] have reported the effect of roughness on the CoF, reporting a lower CoF for higher rugosities. In the present study, the variation in surface roughness (Sa) was found to be small, resulting in very similar CoF values for all materials.
The strip drawing test results (Figure 7a–c) were in agreement with the state of the art. The CoF decreases with increasing sliding velocity [4,13,33,34] and with increasing contact pressure [5,6]. As observed in Figure 7, the trend of CoF decreasing with contact pressure was more pronounced from 2 to 10 MPa. This phenomenon was studied by Karupannasamy et al. [35], who concluded that the surface deformation had a marked effect on CoF evolution at low contact pressures. Moreover, increasing amounts of lubricant have been found to lead to a decrease in CoF [8]; however, in the present study no significant differences were observed from 0.5 to 4 g/m2 (Figure 6b). Although our results indicated that the influence of the lubricant is strongest at higher contact pressures (Figure 6b), Filzek et al. [8] observed the opposite effect. This phenomenon could be attributed to hydrostatic and hydrodynamic fluid effects [36]. High levels of lubricant can lead to a mixed-layer lubrication regime, resulting in significant variability in CoF values for the same contact pressures and sliding velocities [37]. Contact area size can have also an effect on this variation In the CoF. Recklin et al. [38] observed variations in the effect of the amount of lubricant between the same tests with different contact areas due to its distribution over the contact area. Lubricant viscosity also can affect the results, as its low viscosity (19.6 mm2/s at 40 °C) might cause a lubricant sweep during the process.
Turning to the deep drawing process, draw-beads and spacer blocks are a key factor in the blank holder pressure. FLDs and material flow are highly affected by this variable, as the friction coefficient greatly depends on the contact pressure and tool configuration has a significant impact on this pressure distribution. In the present work, the traditional constant model had a constant CoF value of 0.15, which led to severe splits in the upper zone of the part. In contrast, the TriboForm model was able to take into account lubrication spots, material elasto-plasticity, and tool roughness, which should lead to a model closer to industrial tool conditions. Lower friction takes place in high pressure radius areas [39], whereas in low pressure areas higher friction is expected. For this reason, higher draw-in values were expected for the TriboForm model, as the draw-beads present lower friction. In this work, a Filzek pressure- and velocity-dependent model also represented a model closer to real conditions but without lubrication zones and plastic deformation effects. The P-v-dependent model (Figure 12b) presented less thickening than the TriboForm model (Figure 12c) but more than the constant model (Figure 12a). This may be due to the lubrication zones. In certain zones of the part (see Figure 9), lubrication reached levels of up to 3 g/m2. Lubricant in such quantities could cause wrinkles on the part, which may have led to zones with significant thickening.
Sliding velocity is also a significant factor. Sliding velocities higher than 150 mm/s were reached in the stamping process (Figure 18). For contact pressures lower than 2 MPa and higher than 25 MPa and sliding velocities lower than 10 mm/s and higher than 150 mm/s, the tribological models were extrapolated (Figure 11). In these zones the CoF tended to be lower (TriboForm) or higher (P-v dependent). The same trend for both lower and higher contact pressures was found by Zabala et al. [10] with a TriboForm model for a mild steel. This may be one of the reasons why the experimental FLD contour differs from those obtained by simulation using the TriboForm and P-v-dependent models.
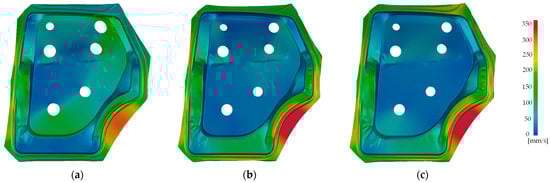
Figure 18.
Tangential velocity (in mm/s) for the three tribological models analyzed at the stage of maximum velocity: (a) constant; (b) P-v dependent; and (c) TriboForm.
Moreover, sliding velocity had a marked effect on the draw-in results. The highest sliding velocities were observed in the bottom-right side of the part for all the numerical models (Figure 18). This zone also showed the highest draw-in values and notable differences between the TriboForm and P-v-dependent models compared with the constant model. As the friction coefficient was characterized for high sliding velocities, in zones where velocity was high, friction was low for the P-v-dependent and TriboForm models. This is a factor in the draw-in differences between the TriboForm and P-v-dependent models and the constant model and between the P-v-dependent and the TriboForm models. Figure 11 illustrates these differences.
The real CoF might similarly be overestimated for the same contact pressures and a low sliding velocity (i.e., 10 mm/s) if only contact pressure and not a range of sliding velocities were considered in the tribological model. For high sliding velocities (i.e., 150 mm/s) and pressures between 1 and 40 MPa, the CoF ranged from 0.095 to 0.047 considering both TriboForm and P-v-dependent model values. These values were 36.85% and 67.80% lower than the constant model and led to differences in FLD and thinning, as observed in Figure 12 and Figure 14.
Figure 16 compares the numerical models with the experimental FLD measurements of the industrial part in three zones: at the top (zone 1), where spacer blocks have their lowest thickness; on the left (zone 2); and in the bottom-right zone of the part (zone 3). Only the outer contour of each FLD is shown. As can be observed, the greatest FLD differences between models were in zone 1 (Figure 16a). In this zone, the constant model had severe splits (Figure 13a) and thus the FLD strains were high, reaching major strain values of 0.97 and minor strain values of −0.45. For the same zone, both the P-v-dependent and TriboForm models reported a similar strain state that was closer to the experimental results.
With regard to the minor strain values, the numerical predictions in both the TriboForm and P-v-dependent predictions underestimated the experimental values. The models predicted values up to −0.22, whereas a minor strain of −0.15 was measured in the experimental FLD. Overall, this zone presented higher pressures due to spacer block disposition. This high pressure did not affect the friction coefficient for the constant model, as its value was 0.15 for all zones. However, the zone 1 CoF values in the TriboForm and P-v-dependent models decreased due to pressure dependency, leading to lower strains.
As for zone 2 (Figure 16b), the FLD distribution of the constant model was similar to that of the experimental results. The TriboForm model predicted a similar distribution shape but tended towards more thickening and compression in some zones. Minor strains of up to −0.38 were reached in the P-v-dependent model, with more thickening in zone 2.
Thinning plots (Figure 13b,c) illustrate the thickening in both the TriboForm and P-v-dependent models, in which a small, concentrated thickening zone (purple) can be seen in zone 2. Thickening in this zone was also observed in the industrial part; however, this presented lower minor strains. The TriboForm model reached its major strain value of 0.33 for a minor strain of −0.18 and achieved a minor strain of −0.3 in the thickening zone. In zone 2, the experimental FLD strains reached a maximum of 0.41. This was 20.73% and 18.39% higher than the maximum major strains of the TriboForm and P-v-dependent models, respectively, for the same minor strain value (−0.195).
Figure 16c shows the FLD contours for all the numerical models and the experimental measurements in zone 3. In this case, the constant model also overestimated the strain state of the part, reaching major strain values of 0.32 versus experimental values of 0.25. Both the P-v-dependent and TriboForm models reported a deviation, tending towards lower minor strains than the experimental measurements for the same major strains. The TriboForm model had the highest deviation, with the lowest minor strain of −0.323, whereas the experimental boundary had minor strains up to −0.15. Some singular points achieved minor strain values of −0.253 due to a local thickening of the part. Overall, in zone 3 both the TriboForm and P-v-dependent models estimated more compression and thickening zones than the experimental results, whereas the constant model was more conservative.
In addition to FLD measurements, draw-in was also compared. Figure 17 shows the draw-in differences between the models and experimental measurements for the 11 points analyzed. No clear trend could be discerned. The draw-in of the constant model for points 1, 2, 3, and 4 was markedly different as this was the zone with the highest major strain values. In the experimental part, higher draw-in values were observed for points 1, 2, 3, 4, and 6. The highest draw-in differences of more than 20 mm were mainly found in the constant model (points 1, 2, 3, and 4). An error of less than 12 mm was found for points 8, 9, 10, and 11. In the zone where higher sliding velocities were found (near points 5 and 6), the TriboForm and P-v-dependent models predicted a higher draw-in than that of the industrial part. Overall, the constant model showed the largest deviation from the experimental draw-in. This model underestimated the draw-in except for points 6 and 8. The TriboForm and P-v-dependent models had similar draw-in values. Points 1, 3, 4, and 5 were found to be the most sensitive to variations in the tribological model, exhibiting differences of up to 36.79 mm. The disparity in the roughness of the tool might be one of the causes of these differences [8,11].
Tool stiffness plays an important role in simulation accuracy, as it affects the pressure contact distribution and, as a result, the strain distribution of the part [40]. A stiffer tool generates higher contact pressures, which can lead to higher compressive stresses in the sheet. This could be one of the sources of deviation, and future work will be developed to consider its influence.
5. Conclusions
In the present study, the deep drawing process of a car inner door panel of DC06 mild steel has been numerically analyzed and compared with industrial process results. A mechanical characterization and topography analysis was carried out, and strip drawing tests at various contact pressures, sliding velocities, and amounts of lubricant were performed. Tribological models were developed from the experimental tests to feed simulation models. The numerical models were analyzed and compared using the FLD and draw-in experimental measurements.
The following conclusions were drawn:
- The use of complex tribological models with the friction coefficient as a function of contact pressure, sliding velocity, and amount of lubricant substantially improved the simulation accuracy compared with the constant model.
- The TriboForm with lubrication zones and P-v-dependent models predicted similar results; the TriboForm model predicted slightly more thickening.
- The constant model predicted a lower draw-in value than the P-v-dependent and TriboForm with lubrication zones models for all points measured. With respect to the experimental results, no clear trend was observed.
- For batches of DC06 mild steel, no significative differences in the friction coefficient were found. This suggests a variation in the roughness of the sheets as an incontrollable noise that is not batch dependent. Nonetheless, this did not significantly affect the friction coefficient results (less than 0.01).
- For the analyzed materials, there were no major differences in the values of the coefficient of friction based on the amount of lubricant applied. The variation in the amount of lubricant (from 0.5 to 4 g/m2) led to maximum CoF variation of 0.014.
In future lines, further research will conducted to analyze the influence of tool stiffness on the tribological behavior and FLD, as well as the draw-in results.
Author Contributions
Conceptualization, L.M., J.T. and L.G.; Methodology, L.M., J.T. and L.G.; Validation, L.M., J.T. and L.G.; Formal analysis, L.M., J.T. and L.G.; Investigation, L.M., J.T., E.G., I.P., N.M. and L.G.; Resources, L.G. and E.G.; Data curation, L.M.; Visualization, L.M., J.T. and L.G.; Writing—original draft preparation, L.M., J.T. and L.G.; Writing—review and editing, L.M., J.T., E.G., I.P., N.M. and L.G.; Project administration, L.M., J.T., E.G. and L.G.; Funding acquisition, L.G. and E.G. All authors have read and agreed to the published version of the manuscript.
Funding
This research was part of the ISTAMP project under SMART Eureka program, it was funded by the Centre for the Development of Industrial Technology (CDTI) of the Spanish Ministry of Science and Innovation, grant number IDI-20220061.
Data Availability Statement
Not applicable.
Acknowledgments
The authors want to acknowledge Alaitz Zabala for the confocal microscopy measurements carried out and Eneko Saenz de Argandoña for the help with strip drawing tests.
Conflicts of Interest
The authors declare no conflict of interest.
References
- Tisza, M.; Fulop, T. A general overview of tribology of sheet metal forming. J. Plast. Technol. 2001, 6, 11–25. [Google Scholar]
- Andersson, A. Numerical and experimental evaluation of springback in a front side member. J. Mater. Process. Technol. 2005, 169, 352–356. [Google Scholar] [CrossRef]
- Sigvant, M.; Hol, J.; Chezan, T.; van den Boogaard, T. Friction modelling in sheet metal forming simulations: Application and validation on an U-Bend product. In Advanced Constitutive Models in Sheet Metal Forming; Institute of Virtual Manufacturing: Berlin/Heidelberg, Germany, 2015; pp. 135–142. [Google Scholar]
- Filzek, J.; Ludwig, M.; Groche, P. Improved FEM simulation of sheet metal forming with friction modelling using laboratory tests. In Proceedings of the IDDRG, Bilbao, Spain, 5–8 June 2011. [Google Scholar]
- Gil, I.; Mendiguren, J.; Galdos, L.; Mugarra, E.; de Argandoña, E.S. Influence of the pressure dependent coefficient of friction on deep drawing springback predictions. Tribol. Int. 2016, 103, 266–273. [Google Scholar] [CrossRef]
- de Argandoña, E.S.; Zabala, A.; Galdos, L.; Mendiguren, J. The effect of material surface roughness in aluminum forming. Procedia Manuf. 2020, 47, 591–595. [Google Scholar] [CrossRef]
- Hol, J.; Wiebenga, J.H.; Carleer, B. Friction and lubrication modelling in sheet metal forming: Influence of lubrication amount, tool roughness and sheet coating on product quality. J. Phys. Conf. 2017, 896, 12026. [Google Scholar] [CrossRef]
- Filzek, J.; Keil, D.; Schröder, H. Temperature Induced Friction Increase in Friction Test and Forming Demonstrator for Sheet Metal Forming. In Proceedings of the 24th International Conference on Material Forming (ESAFORM 2021), Liège, Belgium, 14–16 April 2021. [Google Scholar]
- Aha, B.; Hettich, D.; Veldhuis, M.; Filzek, J. Higher Productivity in Forming High-alloyed Steel by Temperature Insensitive Friction Behavior. In Proceedings of the 24th International Conference on Material Forming (ESAFORM 2021), Liège, Belgium, 14–16 April 2021. [Google Scholar]
- Zabala, A.; de Argandoña, E.S.; Cañizares, D.; Llavori, I.; Otegi, N.; Mendiguren, J. Numerical study of advanced friction modelling for sheet metal forming: Influence of the die local roughness. Tribol. Int. 2021, 165, 107259. [Google Scholar] [CrossRef]
- Sigvant, M.; Pilthammar, J.; Hol, J.; Wiebenga, J.H.; Chezan, T.; Carleer, B.; Van Den Boogaard, T. Friction in sheet metal forming: Influence of surface roughness and strain rate on sheet metal forming simulation results. Procedia Manuf. 2019, 29, 512–519. [Google Scholar] [CrossRef]
- Zabala, A.; Galdos, L.; Childs, C.; Llavori, I.; Aginagalde, A.; Mendiguren, J.; de Argandoña, E.S. The interaction between the sheet/tool surface texture and the friction/galling behaviour on aluminium deep drawing operations. Metals 2021, 11, 979. [Google Scholar] [CrossRef]
- Merklein, M.; Zoeller, F.; Sturm, V. Experimental and numerical investigations on frictional behaviour under consideration of varying tribological conditions. Adv. Mater. Res. 2014, 966, 270–278. [Google Scholar] [CrossRef]
- Sigvant, M.; Pilthammar, J.; Hol, J.; Wiebenga, J.H.; Chezan, T.; Carleer, B.; Boogaard, A.H.V.D. Friction in Sheet Metal Forming Simulations: Modelling of New Sheet Metal Coatings and Lubricants. IOP Conf. Ser. Mater. Sci. Eng. 2018, 418, 012093. [Google Scholar] [CrossRef]
- Dou, S.; Xia, J. Analysis of sheet metal forming (Stamping process): A study of the variable friction coefficient on 5052 aluminum alloy. Metals 2019, 9, 853. [Google Scholar] [CrossRef]
- Galdos, L.; Trinidad, J.; Otegi, N.; Garcia, C. Friction Modelling for Tube Hydroforming Processes—A Numerical and Experimental Study with Different Viscosity Lubricants. Materials 2022, 15, 5655. [Google Scholar] [CrossRef] [PubMed]
- Harsch, D.; Heingärtner, J.; Hortig, D.; Hora, P. Process Windows for Sheet Metal Parts based on Metamodels. J. Phys. Conf. Ser. 2016, 734, 32014. [Google Scholar] [CrossRef]
- Harsch, D.; Heingärtner, J.; Renkci, Y.; Hora, P. Influence of scattering material properties on the robustness of deep drawing processes. In Proceedings of the Forming Technology Forum 2017, Enschede, The Netherlands, 12–13 October 2017. [Google Scholar]
- Tatipala, S.; Wall, J.; Johansson, C.M.; Sigvant, M. Data-driven modelling in the era of Industry 4.0: A case study of friction modelling in sheet metal forming simulations. J. Phys. Conf. Ser. 2018, 1063, 012135. [Google Scholar] [CrossRef]
- Sigvant, M.; Pilthammar, J.; Hol, J.; Wiebenga, J.H.; Chezan, T.; Carleer, B.; Boogaard, A.H.V.D. Friction and lubrication modelling in sheet metal forming simulations of the Volvo XC90 inner door. J. Phys. Conf. Ser. 2016, 734, 32090. [Google Scholar] [CrossRef]
- Hora, P.; Heingärtner, J.; Manopulo, N.; Tong, L. Zero Failure Production Methods Based on a Process Integrated Virtual Control. In Proceedings of the 8th International Conference and Workshop on Numerical Simulation of 3D Sheet Metal Forming Processes, Seoul, Republic of Korea, 21–26 August 2011; Volume 47, pp. 35–47. [Google Scholar] [CrossRef]
- Aspinwall, D.K.; Wise, M.L.H.; Stout, K.J.; Goh, T.H.A.; Zhao, F.L.; El-Menshawy, M.F. Electrical discharge texturing. Int. J. Mach. Tools Manuf. 1992, 32, 183–193. [Google Scholar] [CrossRef]
- GOM. ARAMIS [www Document]. 2020. Available online: https://www.gom.com/en/products/3d-testing (accessed on 9 February 2021).
- Panich, S.; Barlat, F.; Uthaisangsuk, V.; Suranuntchai, S.; Jirathearanat, S. Experimental and theoretical formability analysis using strain and stress based forming limit diagram for advanced high strength steels. Mater. Des. 2013, 51, 756–766. [Google Scholar] [CrossRef]
- Bleck, W.; Deng, Z.; Papamantellos, K.; Gusek, C.O. A comparative study of the forming-limit diagram models for steel sheets. J. Mater. Process. Technol. 1998, 83, 223–230. [Google Scholar] [CrossRef]
- Pereira, M.P.; Yan, W.; Rolfe, B.F. Contact pressure evolution and its relation to wear in sheet metal forming. Wear 2008, 265, 1687–1699. [Google Scholar] [CrossRef]
- UNE-EN ISO 25178-2; Especificacion Geometrica de Productos (GPS). Calidad Superficial: Areas. Parte 2: Terminos, Definiciones y Parametos de Calidad Superficial. AENOR: Madrid, Spain, 2013.
- Swift, H.W. Plastic instability under plane stress. J. Mech. Phys. Solids 1952, 1, 1–18. [Google Scholar] [CrossRef]
- Banabic, D. Sheet Metal Forming Processes; Springer: Berlin/Heidelberg, Germany, 2016; Volume 53. [Google Scholar] [CrossRef]
- AutoForm Engineering GmbH. AutoForm R10 Software Manual; AutoForm Engineering GmbH: Freienbach, Switzerland, 2022. [Google Scholar]
- Altan, T.; Tekkaya, E. Sheet Metal Forming: Fundamentals; ASTM International: West Conshohocken, PA, USA, 2012. [Google Scholar]
- Trzepieciński, T.; Bazan, A.; Lemu, H.G. Frictional characteristics of steel sheets used in automotive industry. Int. J. Automot. Technol. 2015, 16, 849–863. [Google Scholar] [CrossRef]
- Kosanov, J.; Lenard, J.G.; Uhrig, J.; Wallfarth, B. The effect of lubricant additives on the coefficient of friction in the flat-die test. Mater. Sci. Eng. A 2006, 427, 274–281. [Google Scholar] [CrossRef]
- Hansen, B.; Purr, S.; Meinhardt, J.; Merklein, M. Investigation of the tribological behavior of car body parts in series production. Procedia Manuf. 2019, 27, 51–56. [Google Scholar] [CrossRef]
- Karupannasamy, D.K.; De Rooij, M.B.; Schipper, D.J. Multi-scale friction modelling for rough contacts under sliding conditions. Wear 2013, 308, 222–231. [Google Scholar] [CrossRef]
- Guo, B.; Gong, F.; Wang, C.J.; Shan, D.B. Flow stress and tribology size effects in scaled down cylinder compression. Trans. Nonferrous Met. Soc. China 2009, 19, s516–s520. [Google Scholar] [CrossRef]
- Dubois, A.; Kanim, A.N.M. Metal Forming and Lubrication. Ref. Modul. Mater. Sci. Mater. Eng. 2019, 1, 1–9. [Google Scholar] [CrossRef]
- Recklin, V.; Dietrich, F.; Groche, P. Influence of test stand and contact size sensitivity on the friction coefficient in sheet metal forming. Lubricants 2018, 6, 41. [Google Scholar] [CrossRef]
- Bolay, C.; Essig, P.; Kaminsky, C.; Hol, J.; Naegele, P.; Schmidt, R. Friction modelling in sheet metal forming simulations for aluminium body parts at Daimler AG. IOP Conf. Ser. Mater. Sci. Eng. 2019, 651, 012104. [Google Scholar] [CrossRef]
- Zabala, A.; Llavori, I.; de Argandoña, E.S.; Mendiguren, J. Towards the automation of the die spotting process: Contact blue pattern decryption. J. Manuf. Process. 2020, 58, 1285–1296. [Google Scholar] [CrossRef]


Disclaimer/Publisher’s Note: The statements, opinions and data contained in all publications are solely those of the individual author(s) and contributor(s) and not of MDPI and/or the editor(s). MDPI and/or the editor(s) disclaim responsibility for any injury to people or property resulting from any ideas, methods, instructions or products referred to in the content. |
© 2023 by the authors. Licensee MDPI, Basel, Switzerland. This article is an open access article distributed under the terms and conditions of the Creative Commons Attribution (CC BY) license (https://creativecommons.org/licenses/by/4.0/).