Influence of Parasitic Electric Currents on an Exemplary Mineral-Oil-Based Lubricant and the Raceway Surfaces of Thrust Bearings


Abstract
:1. Introduction
- The relative permittivity εr gives the electrical polarization ability of a dielectric;
- The breakdown field strength E (also breakdown voltage) indicates the highest field strength that can be applied to a material without it failing as an insulating medium;
- The specific electrical resistance ρ or its reciprocal, the electrical conductivity κ, describes the electrical conductivity of a material.
2. Materials
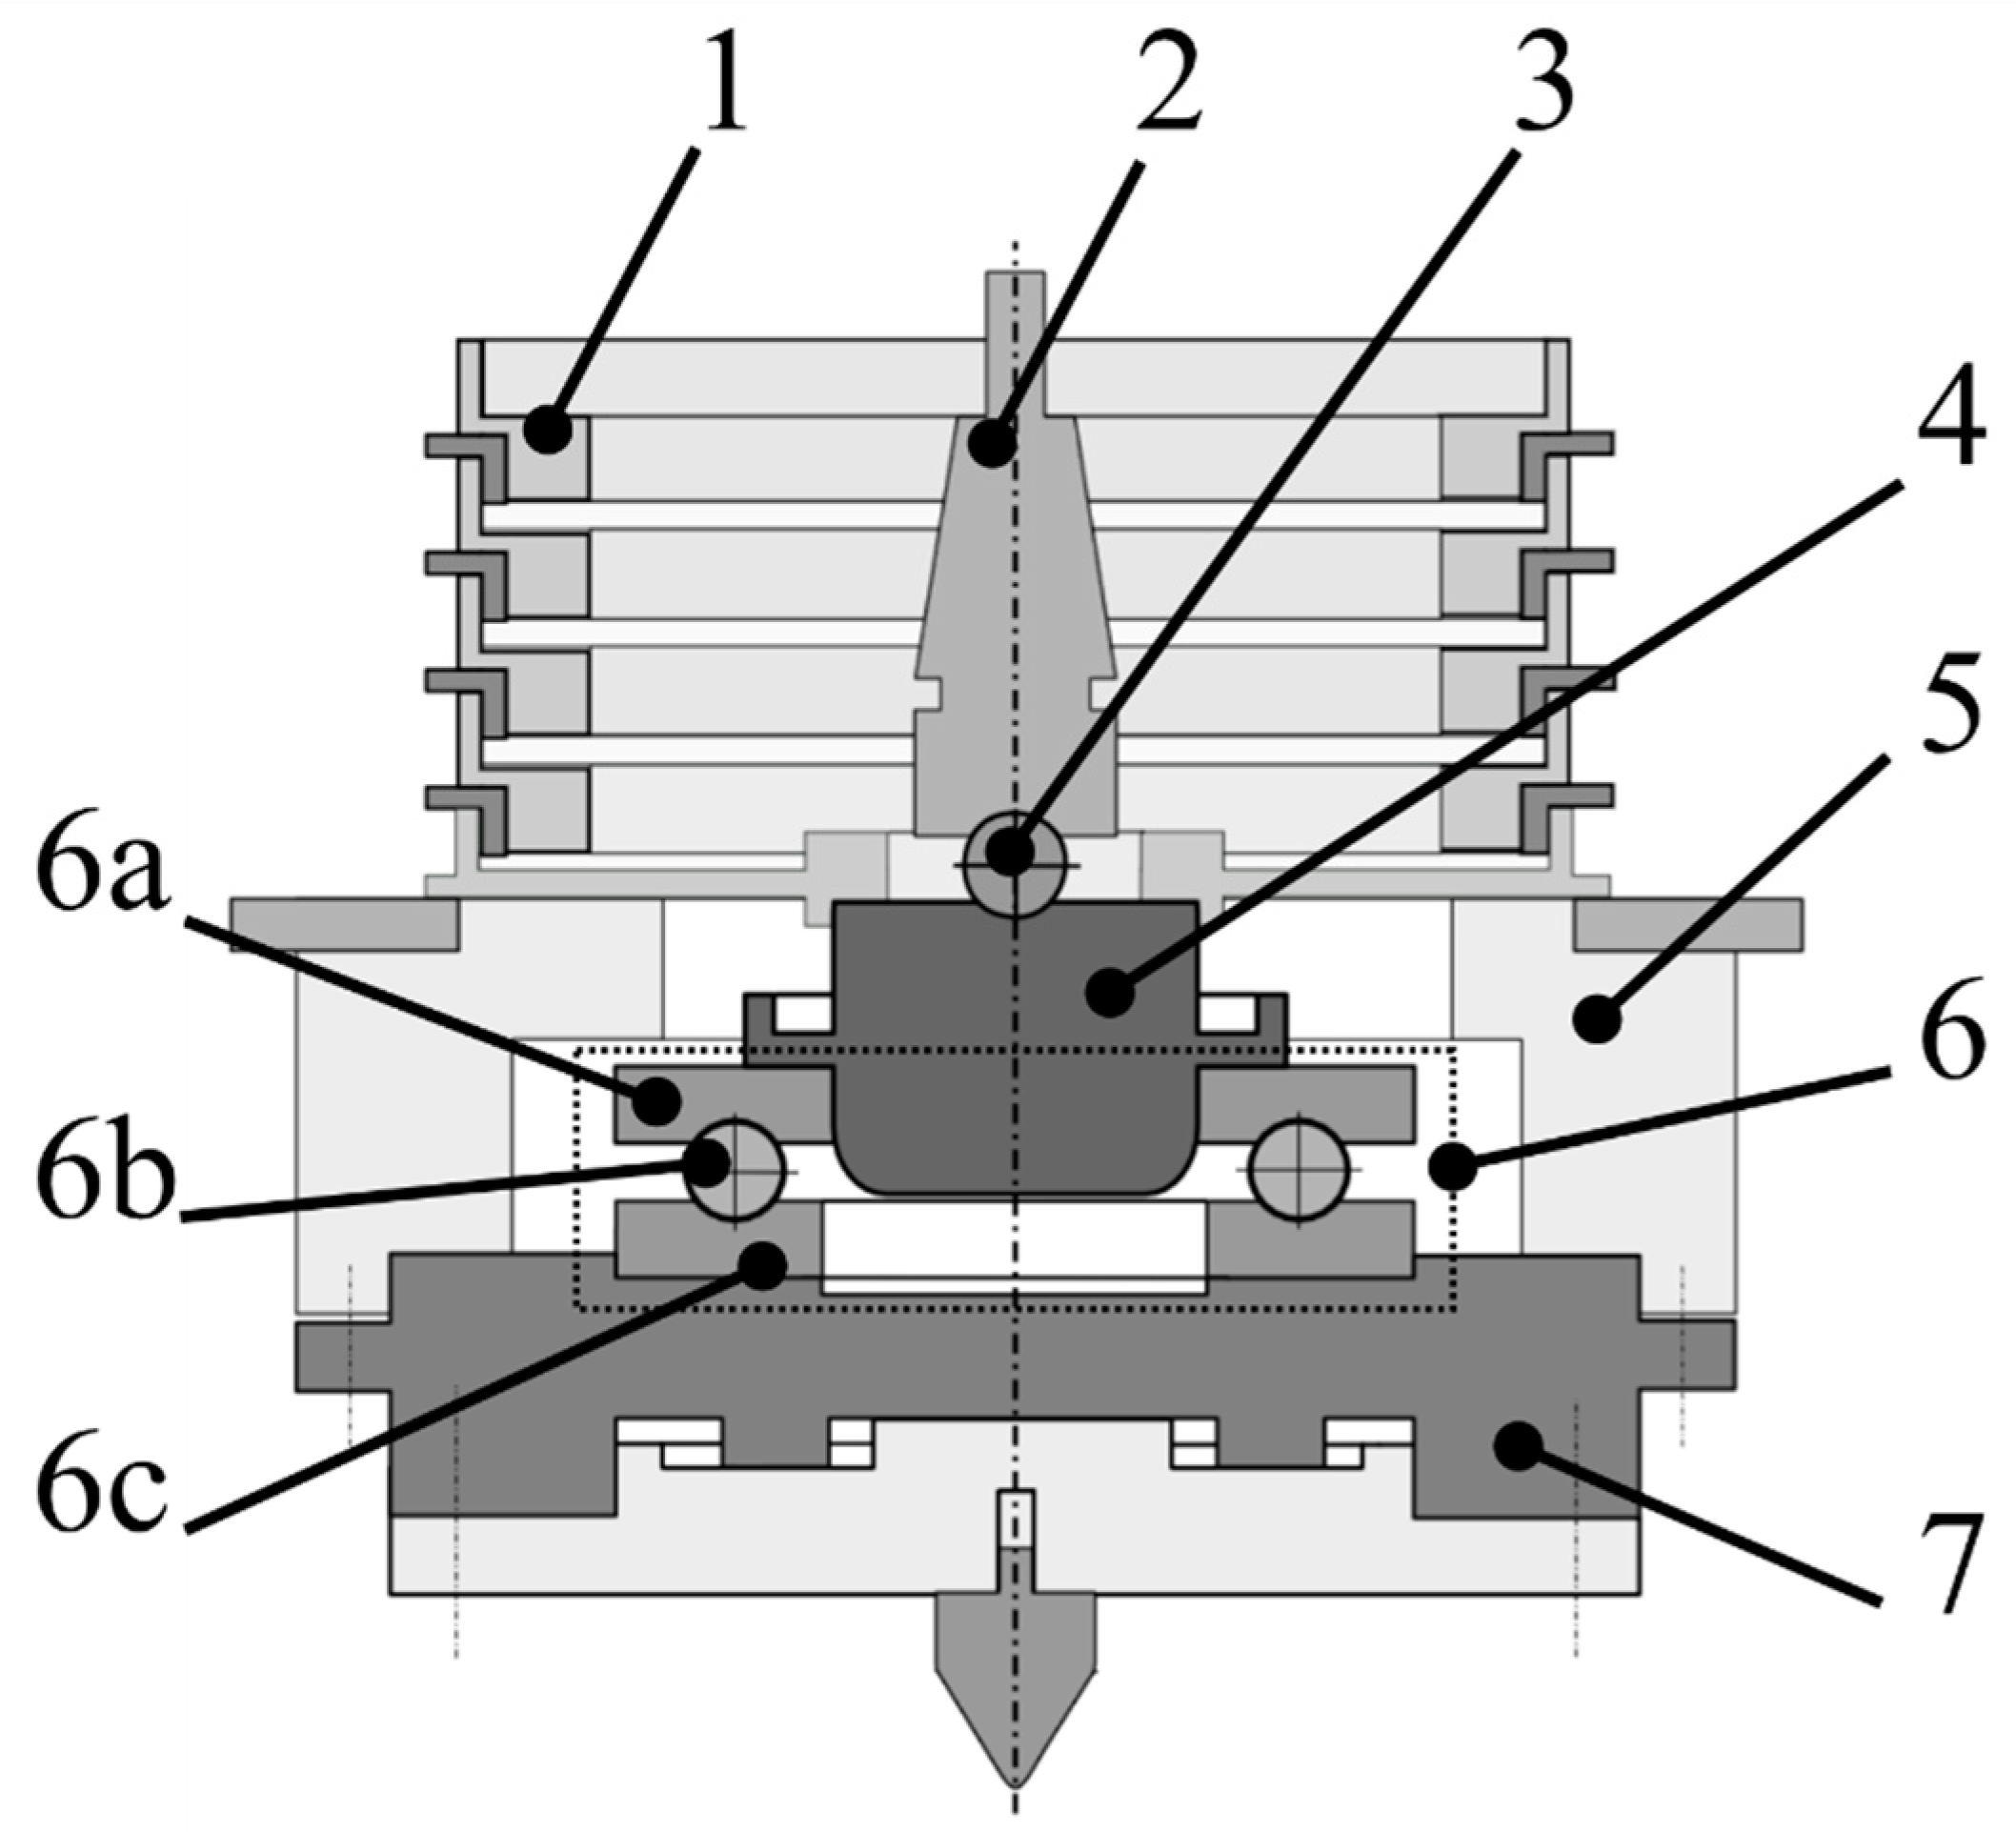
3. Experiment Description and Boundary Conditions
- Test series A—axial load 4000 N (C0/P 19);
- Test series B—axial load 6000 N (C0/P 13);
- Test series C—axial load 8000 N (C0/P 10).
4. Results
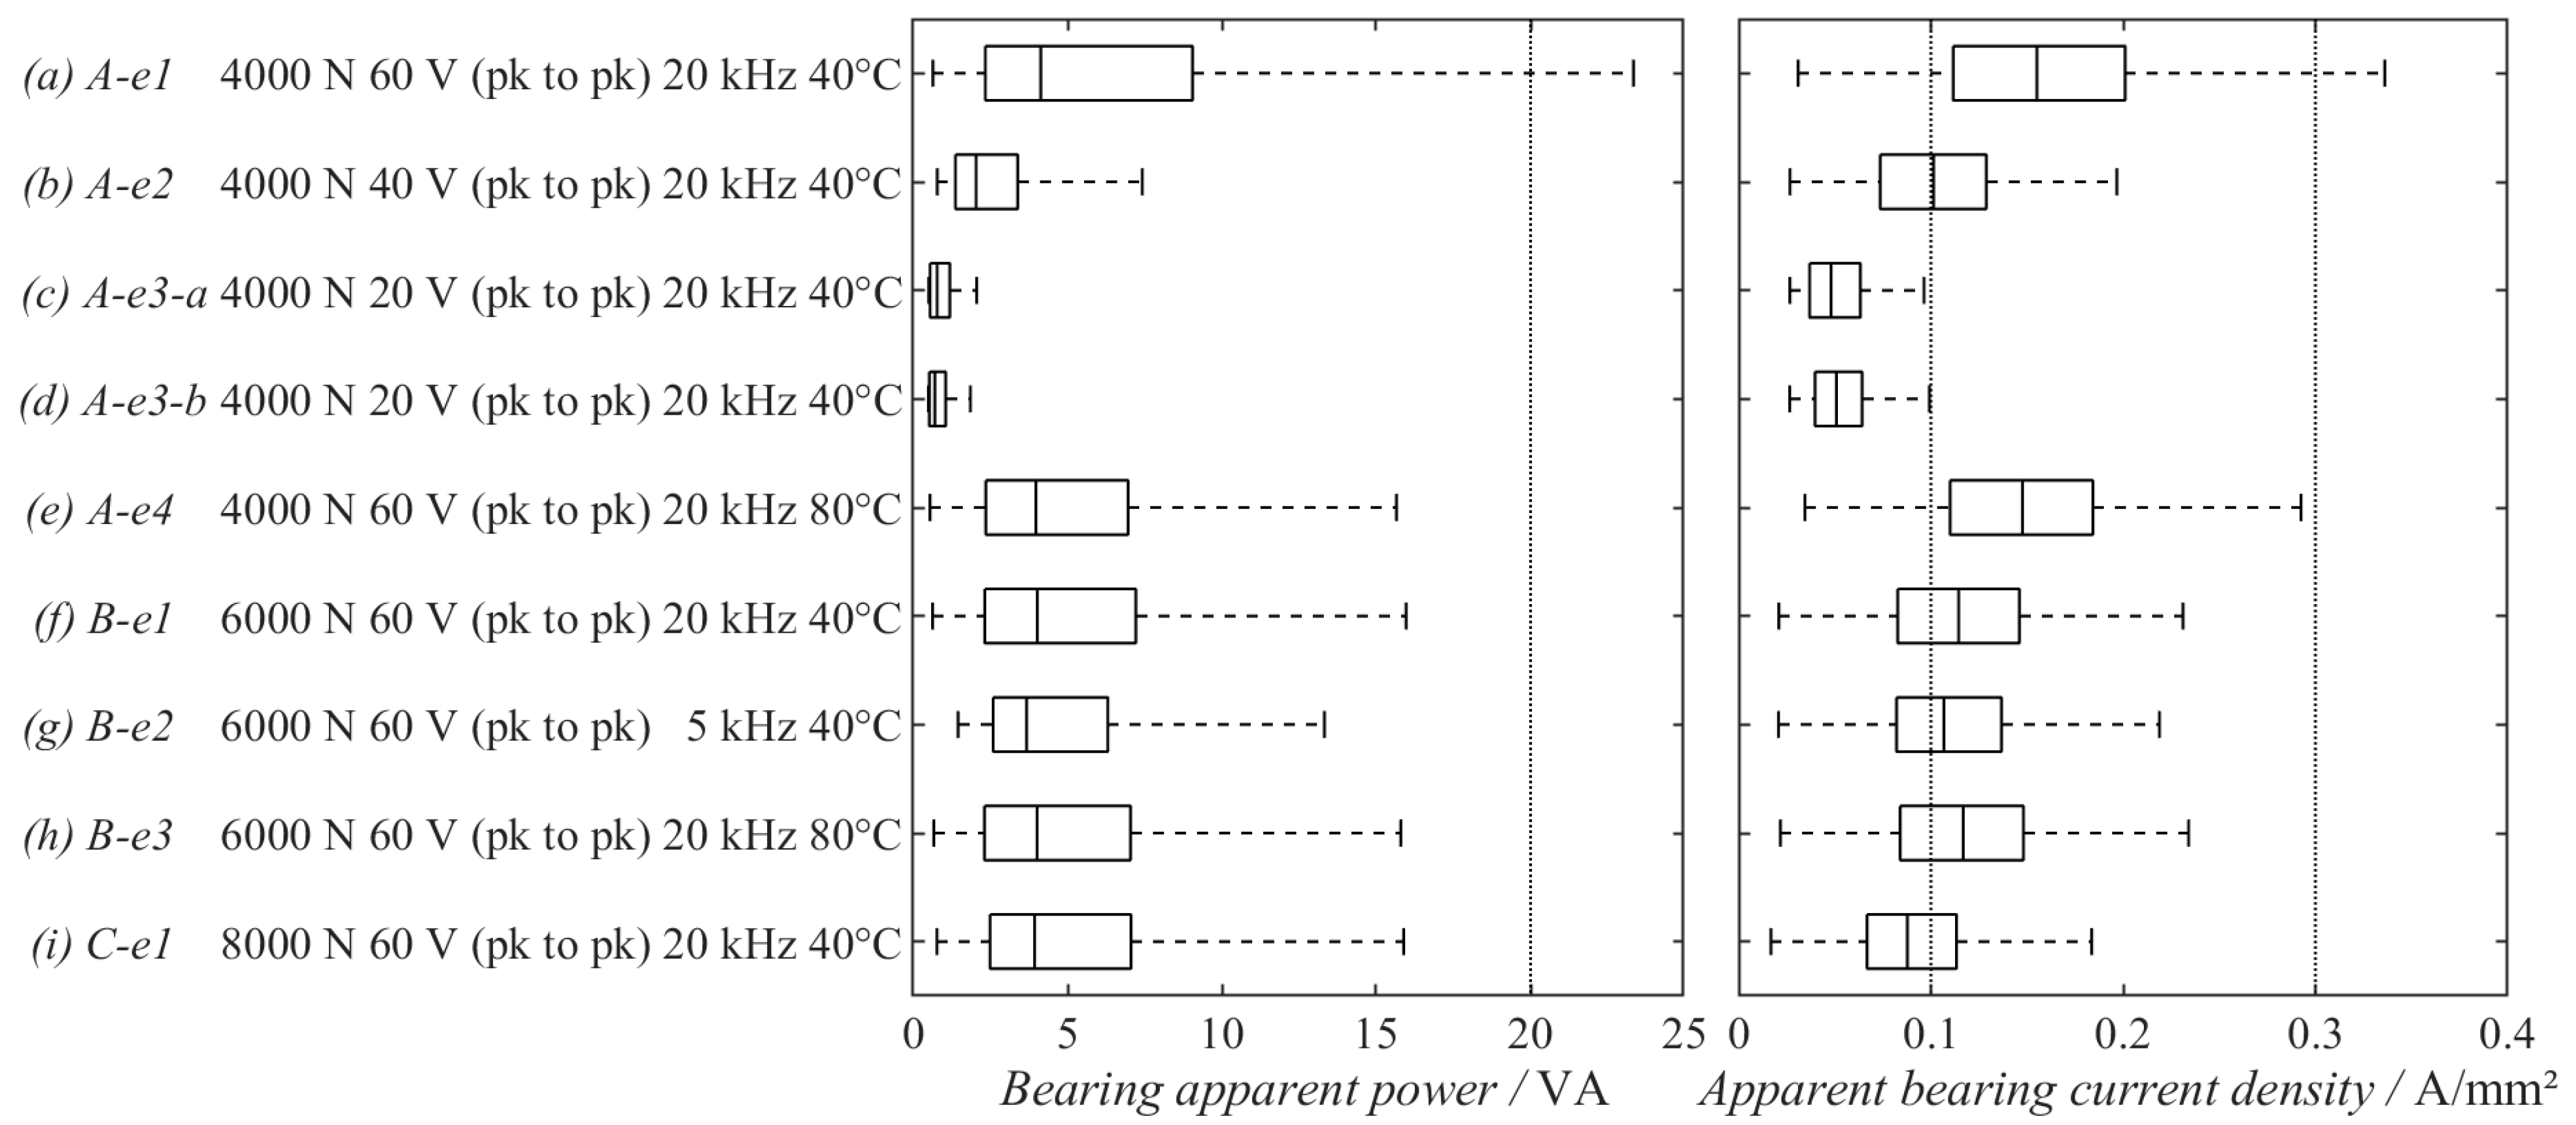
4.1. Electrical Load over Time
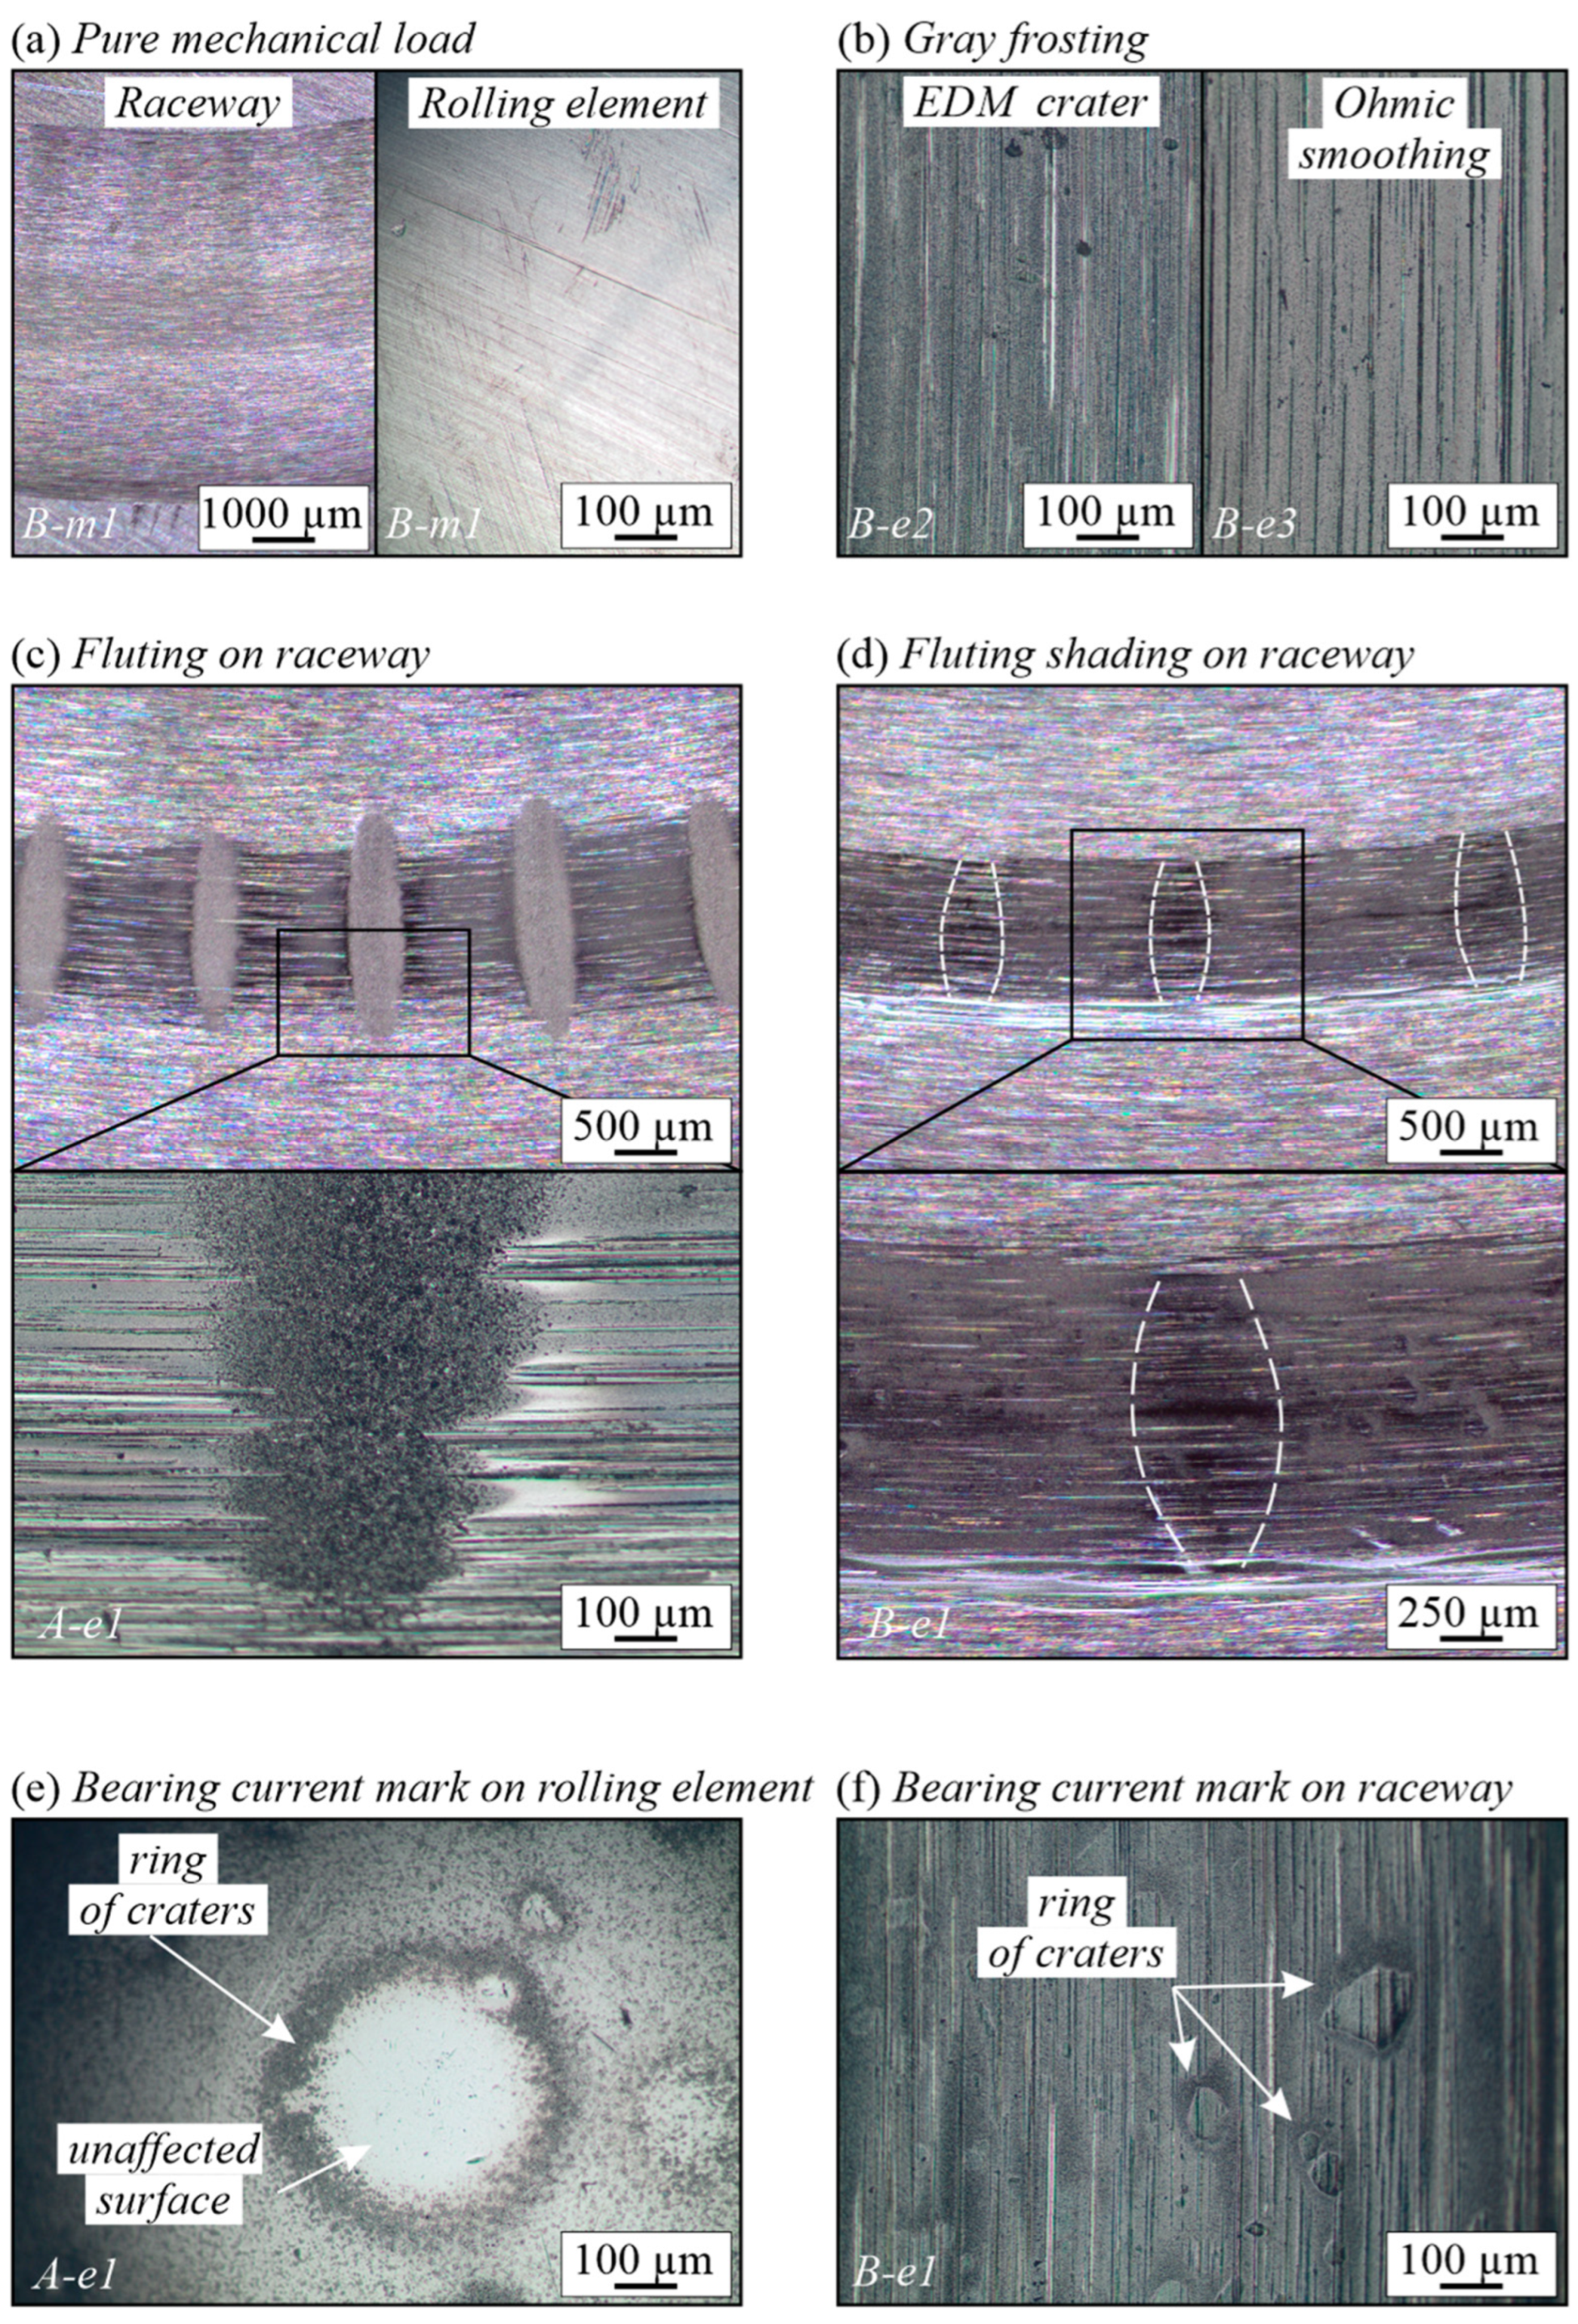
4.2. Occurring Surface Changes
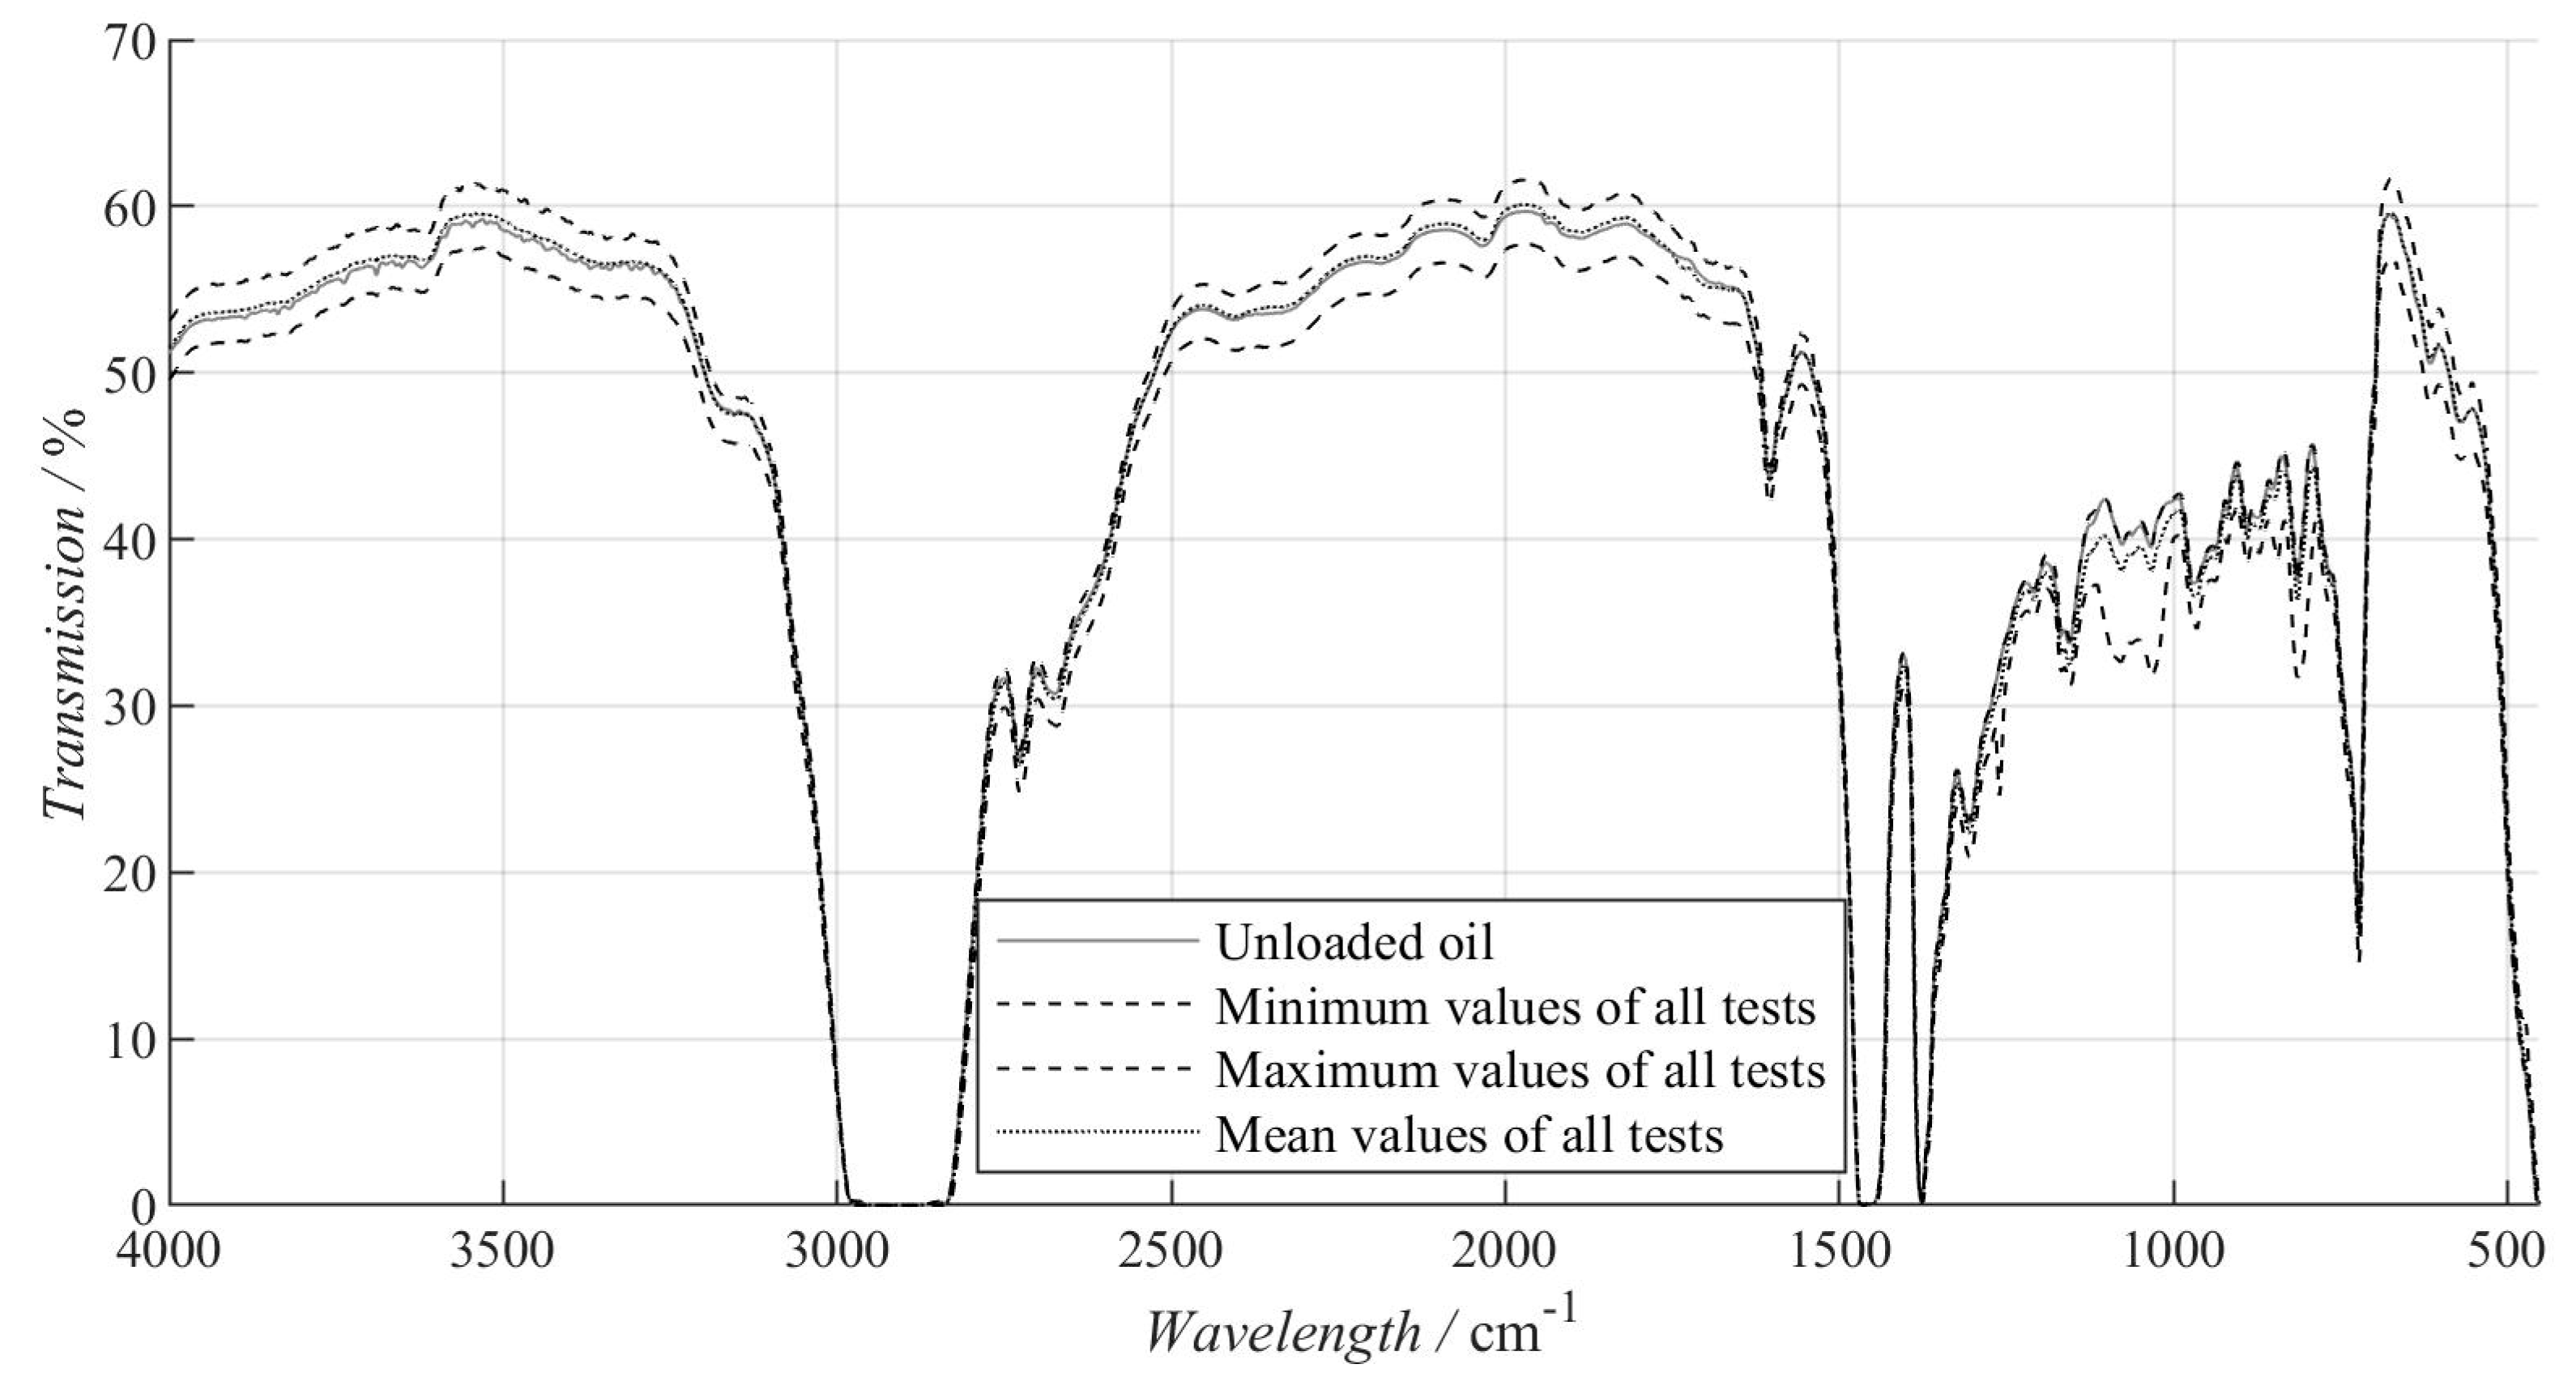
4.3. IR Spectroscopy
4.4. Chemical Wear Elements (cf. Table 7) and Contaminants (cf. Table 8)

| Chemical Wear Elements in mg/kg | |||||||||
|---|---|---|---|---|---|---|---|---|---|
| Designation | FE | Cr | Sn | Al | Ni | Cu | Pb | Mo | Mn |
| Reference | - | - | - | - | - | - | - | - | - |
| A-m1 | 10 | ||||||||
| A-m2 | 35 | 1 | 1 | ||||||
| A-e1 | 17 | ||||||||
| A-e2 | 16 | 1 | |||||||
| A-e3-a | 6 | ||||||||
| A-e3-b | 14 | 1 | 1 | ||||||
| A-e4 | 98 | 1 | |||||||
| B-m1 | 10 | ||||||||
| B-e1 | 9 | ||||||||
| B-e2 | 23 | ||||||||
| B-e3 | 14 | ||||||||
| C-m1 | 40 | 1 | 1 | 1 | 1 | ||||
| C-e1 | 44 | 8 | |||||||
| Impurities | Additives in mg/kg | |||||||||
|---|---|---|---|---|---|---|---|---|---|---|
| Designation | Si | K | Na | Li | Ca | Mg | Zn | P | Ba | S |
| Reference | - | - | - | - | 2 | - | - | 1 | - | 4036 |
| A-m1 | 286 | 2 | 1 | - | - | - | 1 | 3 | - | 4056 |
| A-m2 | 11 | - | - | - | 5 | - | 1 | - | - | 3684 |
| A-e1 | 39 | - | 1 | 1 | 3 | - | 1 | 2 | - | 3869 |
| A-e2 | 11 | - | - | - | 1 | - | 1 | 2 | - | 3933 |
| A-e3-a | 12 | - | - | 1 | - | - | - | 2 | - | 3810 |
| A-e3-b | 148 | - | - | - | 2 | - | 1 | - | - | 3915 |
| A-e4 | 32 | - | - | - | 2 | - | 2 | - | - | 3831 |
| B-m1 | 8 | - | - | - | 4 | - | - | - | - | 3640 |
| B-e1 | - | - | - | - | - | - | - | - | - | 3721 |
| B-e2 | 3 | - | - | - | 2 | 1 | 1 | 5 | - | 3829 |
| B-e3 | 59 | - | - | - | 1 | - | 3 | - | - | 3901 |
| C-m1 | 56 | 1 | - | - | 4 | 1 | - | 3 | - | 3807 |
| C-e1 | 1007 | - | - | - | 2 | - | 1 | 4 | - | 3980 |
4.5. Viscosity (cf. Table 9)
| Designation | Viscosity at 40 °C /mm/s² | Viscosity at 80 °C /mm/s² | Oxidation index /- | Color Code /- |
|---|---|---|---|---|
| Reference | 105 | 10.8 | - | 1 |
| A-m1 | 104.9 | 11.11 | 10 | 2.5 |
| A-m2 | 104.9 | 10.91 | 25 | 5.5 |
| A-e1 | 105.1 | 10.88 | <5 | 2 |
| A-e2 | 92.2 | 10.78 | - | 2 |
| A-e3-a | 104.5 | 10.78 | 7 | 1.5 |
| A-e3-b | 105.6 | 10.89 | 12 | 2 |
| A-e4 | 105.3 | 10.79 | 30 | 6 |
| B-m1 | 105.6 | 10.88 | 14 | 2.5 |
| B-e1 | 105.4 | 10.88 | 10 | 2 |
| B-e2 | 105.3 | 10.85 | 6 | 2 |
| B-e3 | 105.8 | 10.91 | 35 | 4 |
| C-m1 | 103.6 | 10.79 | 12 | 3 |
| C-e1 | 105.4 | 10.74 | 10 | 3 |
5. Conclusions
- Electrical load over the test period: significant
- Change in the rolling surface: significant
- Lubricant analysis: further research necessary
Author Contributions
Funding
Conflicts of Interest
References
- Schneider, V.; Behrendt, C.; Höltje, P.; Cornel, D.; Becker-Dombrowsky, F.M.; Puchtler, S.; Gutiérrez Guzmán, F.; Ponick, B.; Jacobs, G.; Kirchner, E. Electrical Bearing Damage, A Problem in the Nano- and Macro-Range. Lubricants 2022, 10, 194. [Google Scholar] [CrossRef]
- Graf, S.; Capan, R.; Koch, O.; Sauer, B. Electrically induced damage of rolling bearings due to parasitic converter currents in electrical drive trains. In Proceedings of the International Commercial Vehicle Symposium, Kaiserslautern, Germany, 13–15 September 2022; ISBN 978-3-658-40782-7. [Google Scholar] [CrossRef]
- Zika, T. Electric Discharge Damaging in Lubricated Rolling Contacts. Ph.D. Dissertation, Technische Universität Wien, Wien, Austria, 2010. [Google Scholar]
- Kriese, M.; Wittek, E.; Gattermann, S.; Tischmacher, H.; Poll, G.; Ponick, B. Influence of bearing currents on the bearing lifetime for converter driven machines. In Proceedings of the 2012 International Conference on Electrical Machines, Marseille, France, 2–5 September 2012; pp. 1735–1739. [Google Scholar] [CrossRef]
- Bechev, D. Prüfmethodik zur Charakterisierung der Elektrischen Eigenschaften von Wälzlagerschmierstoffen. Ph.D. Thesis, Technische Universität Kaiserslautern, Kaiserslautern, Germany, 2020. [Google Scholar]
- Gonda, A.; Capan, R.; Bechev, D.; Sauer, B. The Influence of Lubricant Conductivity on Bearing Currents in the Case of Rolling Bearing Greases. Lubricants 2019, 7, 108. [Google Scholar] [CrossRef] [Green Version]
- Spikes, H.A. Triboelectrochemistry: Influence of Applied Electrical Potentials on Friction and Wear of Lubricated Contacts. Tribol. Lett. 2020, 68, 90. [Google Scholar] [CrossRef]
- García Tuero, A.; Rivera, N.; Rodríguez, E.; Fernández-González, A.; Viesca, J.L.; Battez, A.H. Influence of Additives Concentration on the Electrical Properties and the Tribological Behaviour of Three Automatic Transmission Fluids. Lubricants 2022, 10, 276. [Google Scholar] [CrossRef]
- Weicker, M. Gleichtakteffekte bei Umrichtergespeisten Elektromotoren. Ph.D. Thesis, Technische Universität Darmstadt, Darmstadt, Germany, 2021. [Google Scholar]
- Phrashad, H. Tribology in Electrical Environments; Elsevier: Amsterdam, The Netherlands, 2006. [Google Scholar]
- Chen, Y.; Jha, S.; Raut, A.; Zhang, W.; Liang, H. Performance Characteristics of Lubricants in Electric and Hybrid Vehicles: A Review of Current and Future Needs. Front. Mech. Eng. 2020, 6, 571464. [Google Scholar] [CrossRef]
- Tischmacher, H.; Gattermann, S. Einflussgrößen auf Lagerströme bei umrichtergespeisten Elektromotoren. VDI-Berichte 2022, 2013, 45–59. [Google Scholar]
- Durkin, W.; Fish, G.; Dura, R. Compositional Effects on the Electrical Properties of Greases; elgi Eurogrease Q2: Hamburg, Germany, 2022. [Google Scholar]
- Esmaeili, K.; Wang, L.; Harvey, T.J.; White, N.M.; Holweger, W. Electrical Discharges in Oil-Lubricated Rolling Contacts and Their Detection Using Electrostatic Sensing Technique. Sensors 2022, 22, 392. [Google Scholar] [CrossRef] [PubMed]
- Erdemir, A.; Farfan-Cabrera, L.; Anderson, W.B. Comparative Tri Comparative Tribological Properties of Commercial Drivetrain Lubricants under Electrified Sliding Contact Conditions. In Proceedings of the 2nd STLE Tribology & Lubrication for E-Mobility Conference, Online, 30 November 2022. [Google Scholar]
- Radnai, B. Wirkmechanismen bei Spannungsbeaufschlagten Wälzlagern. Ph.D. Thesis, Technische Universität Kaiserslautern, Kaiserslautern, Germany, 2016. [Google Scholar]
- Holweger, W.; Bobbio, L.; Mo, Z.; Fliege, J.; Goerlach, B.; Simon, B. A Validated Computational Study of Lubricants under White Etching Crack Conditions Exposed to Electrical Fields. Lubricants 2023, 11, 45. [Google Scholar] [CrossRef]
- Muetze, A. Bearing Currents in Inverter-Fed AC Motors. Ph.D. Thesis, TU Darmstadt D 17, Shaker Verlag, Aachen, 2004. [Google Scholar]
- Recker, C.; Weicker, M. Einfluss der elektrischen Schmierfettleitfähigkeit auf Die Ausbildung von Lagerströmen bei umrichterbetriebenen 1.5 kW-Asynchronmotoren, Aachen, 2022. 5. VDI-Fachkonferenz—Schadensmechanismen an Lagern. Available online: https://www.vdi-wissensforum.de/weiterbildung-maschinenbau/schadensmechanismen-an-lagern/ (accessed on 31 July 2022).
- Jagenbrein, A. Investigations of Bearing Failures due to Electric Current Passage. Ph.D. Thesis, Technische Universität Wien, Vienna, Austria, 2005. [Google Scholar]
- Bechev, D.; Kiekbusch, T.; Sauer, B. Characterization of Electrical Lubricant Properties for Modelling of Electrical Drive Systems with Rolling Bearings; Forschungsvereinigung Antriebstechnik eV (FVA): Frankfurt, Germany, 2018; Volume 3. [Google Scholar]
- Graf, S.; Werner, M.; Koch, O.; Götz, S.; Sauer, B. Breakdown voltages in thrust bearings: Behavior and Measurement. Tribol. Trans. 2023, 66, 488–496. [Google Scholar] [CrossRef]
- Graf, S. Charakterisierung und Auswirkungen von Parasitären Lagerströmen in Mischreibung. Ph.D. Thesis, RPTU Kaiserslautern-Landau, Kaiserslautern, Germany, 2023. [Google Scholar]
- Hamrock, J.B.; Dowson, D. Isothermal elastohydrodynamic lubrication of point contacts III: Fully Flooded Results. J. Lubr. Technol. 1977, 99, 264–275. [Google Scholar] [CrossRef]
- Schneider, V.; Stockbrügger, J.O. FVA 863 I—Stromdurchgang am Wälzlager; FVA-Heft Nr. 1501: Frankfurt, Germany, 2022. [Google Scholar]
- Gemeinder, Y. Lagerimpedanz und Lagerschädigung bei Umrichtergespeisten Antrieben. Ph.D. Thesis, Technische Universität Darmstadt, Darmstadt, Germany, 2016. [Google Scholar]
- Joshi, A. Electrical Characterisations of Bearings. Ph.D. Thesis, Chalmers University of Technology, Gothenburg, Switzerland, 2019. [Google Scholar]
- Kohaut, A. Riffelbildung in Wälzlagern Infolge Elektrischer Korrosion; Zeitschrift für angewandte Physik 1.5; FAG Kugelfischer G. Schäfer: Schweinfurt, Germany, 1948; pp. 197–211. [Google Scholar]
- Zika, T.; Gebeshuber, I.C.; Buschbeck, F.; Preisinger, G.; Gröschl, M. Surface analysis on rolling bearings after exposure to defined electric stress. Proc. Inst. Mech. Eng. Part J J. Eng. Tribolog 2009, 223, 787–797. [Google Scholar] [CrossRef]
- Didenko, T.; Pridemore, W.D. Electrical Fluting Failure of a Tri-Lobe Roller Bearing. J. Fail. Anal. Preven. 2012, 12, 575–580. [Google Scholar] [CrossRef]
- Loos, J.; Bergmann, I.; Goss, M. Influence of high electrical currents on WEC formation in rolling bearings. Tribol. Trans. 2021, 64, 708–720. [Google Scholar] [CrossRef]
- Pohrer, B.; Zuercher, M.; Tremmel, S.; Wartzack, S.; Schlücker, E. Einfluss des tribochemischen Schichtaufbaus auf die Ausbildung elektrisch induzierter Wälzlagerschäden. Tribol. Und Schmier. Bd. 2016, 63, 32–39. [Google Scholar]
- Perez, J. Oxidative properties of lubricants using thermal analysis. Thermochim. Acta 2000, 47–56. [Google Scholar] [CrossRef]
- Maguire, E. Monitoring of Lubricant Degradation with RULER and MPC. Available online: http://urn.kb.se/resolve?urn=urn:nbn:se:liu:diva-57846 (accessed on 31 July 2022).
- Rudszuck, T.; Förster, E.; Nirschl, H.; Guthausen, G. Low-field NMR for quality control on oils. Magn. Reson. Chem. 2019, 57, 777–793. [Google Scholar] [CrossRef]
- Rudszuck, T.; Zick, K.; Groß, D.; Nirschl, H.; Guthausen, G. Dedicated NMR sensor to analyze relaxation and diffusion in liquids and its application to characterize lubricants. Magn. Reson. Chem. 2021, 59, 825–834. [Google Scholar] [CrossRef]

| Geometrical Data | Surface and Calculation Data | |||
|---|---|---|---|---|
| d: | 42 mm | 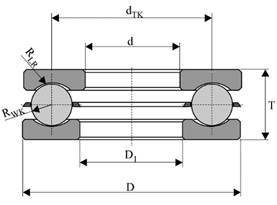 | C: | 35.2 kN |
| dTK: | 53 mm | C0: | 77.6 kN | |
| D: | 68 mm | nlimit: | 4400 min−1 | |
| D1 | 40 mm | Sa *: | 0.51 µm | |
| RLR *: | 5.8 mm | Sq * | 0.64 µm | |
| RWK *: | 5.15 mm | Sk * | 1.53 µm | |
| T: | 19 mm | Spk * | 0.32 µm | |
| Svk * | 0.89 µm | |||
| Temperature/°C | 10 | 40 | 80 |
| Kinematic viscosity/mm2/s | 816.8 | 104.8 | 19.2 |
| Density/g/cm3 | 0.89 | 0.87 | 0.85 |
| Conductivity/nS/m | <0.001 | ||
| Relative permittivity/- | 2.15 | ||
| Designation | Force/N | Rotation Speed/rpm | Temperature/°C | Common-Mode-Voltage/V (pk to pk) | Switching Frequency/kHz |
|---|---|---|---|---|---|
| A-m1 | 4000 | 1000 | 40 | - | - |
| A-m2 | 80 | ||||
| A-e1 | 4000 | 1000 | 40 | 60 | 20 |
| A-e2 | 40 | 40 | |||
| A-e3 * | 40 | 20 | |||
| A-e4 | 80 | 60 | |||
| B-m1 | 6000 | 1000 | 40 | - | - |
| B-e1 | 6000 | 1000 | 40 | 60 | 20 |
| B-e2 | 40 | 5 | |||
| B-e3 | 80 | 20 | |||
| C-m1 | 8000 | 1000 | 40 | - | - |
| C-e1 | 8000 | 1000 | 40 | 60 | 20 |
| Parameter | Unit | Test Series A | Test Series B | Test Series C |
|---|---|---|---|---|
| Contact force | N | 4000 | 6000 | 8000 |
| C0/P | - | 19 | 13 | 10 |
| Hertzian pressure | MPa | 1494 | 1710 | 1883 |
| Single contact area | mm² | 0.27 | 0.35 | 0.43 |
| Lubrication gap height * | µm | 0.79 @40 °C | 0.76 @40 °C | 0.72 @40 °C |
| 0.22 @80 °C | 0.21 @80 °C | - | ||
| Specific lubrication gap | - | 1.23 @40 °C | 1.19 @40 °C | 1.13 @40 °C |
| 0.34 @80 °C | 0.33 @80 °C | - |
| Designation | Apparent Bearing Current Density/A/mm² | Bearing Apparent Power/VA | Bearing Stress/109 A/mm² | Average Discharge Frequency/Hz |
|---|---|---|---|---|
| A-e1 | 0.16 | 4.13 | 19.35 | 17,860 |
| A-e2 | 0.10 | 2.04 | 12.10 | 16,978 |
| A-e3-a | 0.05 | 0.78 | 0.60 | 14,647 |
| A-e3-b | 0.05 | 0.70 | 0.60 | 16,692 |
| A-e4 | 0.15 | 3.97 | 18.14 | 15,398 |
| B-e1 | 0.11 | 4.02 | 13.31 | 18,301 |
| B-e2 | 0.11 | 3.67 | 13.31 | 4690 |
| B-e3 | 0.12 | 4.01 | 14.52 | 17,990 |
| C-e1 | 0.08 | 3.93 | 0.97 | 10,788 |
| Designation | Rotating Ring | Stationary Ring | Rolling Elements |
|---|---|---|---|
| A-m1 | Mechanical run-in | Mechanical run-in | Mechanical run-in |
| A-m2 | Mechanical run-in | Mechanical run-in | Mechanical run-in |
| A-e1 | Fluting | Fluting shading | Bearing current marks |
| A-e2 | Gray frosting | Gray frosting | Gray frosting |
| A-e3-a | No electrically induced change | Gray frosting | No electrically induced change |
| A-e3-b | No electrically induced change | Gray frosting | Gray frosting |
| A-e4 | Gray frosting | Gray frosting | Gray frosting |
| B-m1 | Mechanical run-in | Mechanical run-in | Mechanical run-in |
| B-e1 | Gray frosting/Bearing current marks | Fluting shading | Bearing current marks |
| B-e2 | Gray frosting/Bearing current marks | Gray frosting | Bearing current marks |
| B-e3 | Gray frosting | Gray frosting | No electrically induced change |
| C-m1 | Pitting | Pitting | Pitting |
| C-e1 | Gray frosting | Pitting/ Gray frosting | Pitting/ Gray frosting |
Disclaimer/Publisher’s Note: The statements, opinions and data contained in all publications are solely those of the individual author(s) and contributor(s) and not of MDPI and/or the editor(s). MDPI and/or the editor(s) disclaim responsibility for any injury to people or property resulting from any ideas, methods, instructions or products referred to in the content. |
© 2023 by the authors. Licensee MDPI, Basel, Switzerland. This article is an open access article distributed under the terms and conditions of the Creative Commons Attribution (CC BY) license (https://creativecommons.org/licenses/by/4.0/).
Share and Cite
Graf, S.; Koch, O.; Sauer, B. Influence of Parasitic Electric Currents on an Exemplary Mineral-Oil-Based Lubricant and the Raceway Surfaces of Thrust Bearings. Lubricants 2023, 11, 313. https://doi.org/10.3390/lubricants11080313
Graf S, Koch O, Sauer B. Influence of Parasitic Electric Currents on an Exemplary Mineral-Oil-Based Lubricant and the Raceway Surfaces of Thrust Bearings. Lubricants. 2023; 11(8):313. https://doi.org/10.3390/lubricants11080313
Chicago/Turabian StyleGraf, Simon, Oliver Koch, and Bernd Sauer. 2023. "Influence of Parasitic Electric Currents on an Exemplary Mineral-Oil-Based Lubricant and the Raceway Surfaces of Thrust Bearings" Lubricants 11, no. 8: 313. https://doi.org/10.3390/lubricants11080313