Manipulate A2/B2 Structures in AlCrFexNi Alloys for Improved Mechanical Properties and Wear Resistance

Department of Chemical and Materials Engineering, University of Alberta, Edmonton, AB T6G 2H5, Canada
*
Author to whom correspondence should be addressed.
Lubricants 2023, 11(9), 392; https://doi.org/10.3390/lubricants11090392
Submission received: 11 August 2023
/
Revised: 5 September 2023
/
Accepted: 8 September 2023
/
Published: 12 September 2023
(This article belongs to the Special Issue Wear and Corrosion Behaviour of Metals and Alloys)
Abstract
:Precipitation strengthening of body-center cubic (A2) alloys via ordered B2 nanoprecipitates is expected to achieve a desirable combination of strength and ductility. In this work, the A2/B2 configuration is manipulated by adjusting Fe content in medium-entropy AlCrFexNi (x = 0, 0.5, 1.0, 1.5, 2.0, 2.5 and 3.0) alloys fabricated via arc-melting for improved mechanical properties and wear resistance. As Fe content increases, the fraction of A2 phase increases, and A2 nanoprecipitates in the B2 matrix change to a weave-like A2/B2 structure. Continuously increasing Fe content leads to a mixture of BMAP (B2 matrix with A2 precipitates) and AMBP (A2 matrix with B2 precipitates), and finally to a complete AMBP structure. The yield strength decreases and fracture strain increases with increasing Fe content except x = 0. The alloy of x = 0 displays slightly higher hardness because of its relatively brittle B2 matrix. Cracks tend to propagate along A2/B2 interfaces. AMBP structure exhibits greater toughness than the BMAP structure. The alloy of x = 0 displays the second-greatest wear volume loss due to its relatively brittle B2 matrix. When Fe is added, the wear volume loss decreases considerably but shows a trend of an upward parabola with respect to the Fe content. After achieving the highest volume loss at x = 1.5 with a mixture of AMBP and BMAP, the volume loss decreases again. A completely uniform AMBP structure at x = 3.0 shows the least volume loss.
1. Introduction
Precipitation strengthening is an effective approach for alloys to achieve prominent strength, and specific precipitate morphology could lead to an outstanding strength-ductility combination [1,2,3]. For instance, Ni-base face-center cubic (FCC) superalloys with coherent ordered-L12 cuboidal nanoprecipitates possess excellent high-temperature creep resistance [4]. Cu-base alloys with cuboidal L12 coherent precipitates exhibit a considerably high softening temperature [5]. Disordered body-center cubic (A2) alloys with coherent ordered B2 cuboidal nanoprecipitates possess excellent compressive properties at both room and medium temperatures [6]. The morphology of precipitates can be modified, which helps optimize the corresponding mechanical properties [7,8].
The A2/B2 structure and the morphology of precipitates in medium-entropy and high-entropy alloys are adjustable, providing opportunities to obtain better mechanical properties for the alloys. Studies on equiatomic AlCrFeNi and AlCoCrFeNi alloys with representative A2/B2 structures demonstrate good strength but unsatisfactory ductility. Based on the information on mixing enthalpy as shown in Figure 1, Al, and Ni elements tend to stay in the B2 phase, while Fe and Cr elements tend to be concentrated in the A2 phase, and Co shows equal tendencies to stay in both B2 and A2 phases. Many researchers have reported to have successfully obtained a wish-for A2/B2 structure with good mechanical properties by adjusting Al [9,10,11,12], Co [13,14], Cr [15,16], and Ni [17,18]. However, it is unclear how the most abundant element, Fe, in the medium- or high-entropy alloys affects their A2/B2 microstructure. Besides, from the perspective of cost-effectiveness, increasing Fe content in the alloys would lead to better economic efficiency. It is thus worth investigating the effect of Fe on A2/B2 structure in order to obtain desirable properties. Additionally, considering the high cost of Co and the fact that Co plays no role or even a negative role in affecting the mechanical properties and corrosive wear resistance of AlCoCrFeNi alloys, it is removed in the present study on variations in the A2/B2 structure in equiatomic AlCrFeNi alloy caused by adjusting the Fe content in the alloy.
Figure 2 shows equilibrium phase diagrams of AlCrFexNi alloys with different Fe contents which were calculated using Thermo-Calc software with the TCHEA6 database. One may see that all the seven alloys have A2/B2 microstructures, and the volume fraction of the A2 phase increases while that of the B2 phase decreases, respectively, as the Fe content increases. The morphology of the A2/B2 microstructure should change correspondingly, including the shapes, sizes and densities of the phases. It is feasible to modify the A2/B2 microstructure by adjusting Fe content in the AlCrFexNi alloy for improved mechanical properties. In addition to mechanical properties, the wear resistance is also one of important properties for practical applications of the alloys, which influences their performance and service life [20,21].
In this work, Fe content is adjusted in AlCrFexNi (x = 0, 0.5, 1.0, 1.5, 2.0, 2.5 and 3.0) to optimize the A2/B2 microstructure for desirable mechanical properties and wear resistance. The microstructural evolution with respect to the Fe content is analyzed. Corresponding compressive mechanical properties are tested, and efforts are made to elucidate the underlying deformation mechanisms. Sliding wear tests are performed to evaluate the wear resistance of alloys with different A2/B2 microstructures. Correlations among the wear behavior, microstructure, and mechanical properties are analyzed and discussed. Since little work has been carried out to investigate the effect of Fe on Al-Cr-Fe-Ni alloys within such a large range of Fe content (from 0 to 50 at.%), this study would help elucidate how Fe content affects the microstructure of A2/B2 duplex-phase Al-Cr-Fe-Ni alloys, and determine an appropriate composition to obtain desirable mechanical properties and wear resistance for effective industrial applications.
2. Experimental Procedures
2.1. Materials Preparation
The nominal compositions of AlCrFexNi (x = 0, 0.5, 1.0, 1.5, 1.0, 2.5, and 3.0, in molar ratio) are listed in Table 1. The AlCrFexNi alloys were prepared using an arc-melting furnace under the protection of argon atmosphere. High-purity raw metal powders were mixed with nominal concentrations of the elements and then pressed into disc-like bulk samples for the following arc melting process. Each sample was turned over and re-melted for four times to minimize the compositional homogeneity. The as-cast samples were then cut into samller ones with planned shape and size using an electrical wire-cutting machine, for various tests and analyses.
2.2. Microstructure Characterization
Crystal structure analysis and phase identification were carried out with an X-ray diffractometer (Rigaku XRD Ultima IV, Tokyo, Japan) with Cu Kα radiation. Scanning range of 2θ from 20° to 90° was used for the XRD analysis, which was carried out at a scanning speed of 4°/min. The microstructure was characterized using a scanning electron microscope (Zeiss EVO M10 SEM, Jena, Germany) equipped with energy-dispersive X-ray spectroscopy (EDS). For the SEM observation, the specimens were mechanically ground using sand paper from 240-grit to 3000-grit and then polished using 1μm diamond suspension. Thin-foil TEM specimens prepared via electro-polishing after mechanical thinning were analyzed using a transmission electron microscope (JEOL JEM-ARM 200CF S/TEM) equipped with EDS detector operated at 200 kV; selected area electron diffraction (SAED) was taken to determine the crystal structures of phases in the samples, while EDS was used to determine their chemical compositions and elemental distributions.
2.3. Mechanical Property Evaluation
Macro-hardness (Rockwell scale, HRC) of the alloys was measured using a ZHR Rockwell hardness tester (ZwickRoell, Chestermere, Canada) under the load of 150 kgf. Local microhardness of specific microstructural domains was measured using an NHT3 indentation tester (Anton Paar, Montreal, Canada) with a Berkovich diamond tip. The holding time was set as 10 s at the peak load of 50 mN. The Oliver and Pharr method [22] was used to calculate microhardness. Compressive tests were performed at room temperature using an electromechanical universal test machine (TestResources, Shakopee, MN, USA) at the strain rate of 1 × 10⁻³·s−1 with the cylindrical sample of Φ4 × 8 mm in dimensions.
2.4. Wear Tests
Sliding wear tests were performed using a ball-on-disc tribometer (CSEM Instruments, Needham, MA, USA) with the silicon nitride ball against rotating sample surface for 30 min in the ambient environment. Before the test, the surfaces of all samples were mechanically ground and polished to have the same roughness. The normal load was 10 N and rotary speed of the sample was 191 r/min, corresponding to a sliding speed of 2 cm/s. The ball slid on the rotating sample along a circular path of ~2 mm in diameter. Wear tracks and volume losses of samples after wear tests were measured using a ZeGage™ Pro three-dimensional optical profiler (Zygo, Tucson, AZ, USA). Worn surface and subsurface morphologies were examined with SEM.
3. Results
3.1. Initial Structures
XRD patterns of AlCrFexNi alloys were obtained, which are shown in Figure 3. Characteristic diffraction peaks of B2 phase were detected at ~31° and ~55° in alloys containing low Fe content as x = 0~1.0, because of high fractions of the B2 phase in the alloys. As Fe content increases, the fraction of the B2 phase decreases, so that the intensities of characteristic diffraction peaks of the B2 phase, especially at ~55° gradually decrease. However, all the AlCrFexNi alloys with different Fe contents display the A2/B2 duplex-phase structure with different A2/B2 ratios, which is consistent with the Thermos-Calc calculation results (see Figure 2). It should be mentioned that some discrepancy in the volume fraction of phases between calculated and experimental results may exist, since the alloys made from the real solidification process are not in their equilibrium states as those shown in the calculated phase diagrams.
A representative microstructure of the AlCrFe1.0Ni alloy was characterized with SEM and TEM, and obtained results are presented in Figure 4. From the SEM image in back-scattered (BSE) mode shown in Figure 4a, one may see that two phases, a light one and a dark one, forming a weave-like structure, and a lamellar structure near the grain boundary. Results of the SEM-EDS compositional analysis shown in Figure 4e demonstrate that the light phase is rich in Fe and Cr, while the dark phase is rich in Al and Ni. The atomic concentrations of different elements in the light and dark phases are listed in Table 2. TEM images and corresponding SAED patterns are shown in Figure 4b–d. It should be mentioned that the contrasts of two phases in the SEM-BSE image and TEM image are opposite, i.e., the light phase in the SEM-BSE image is the dark phase in the TEM image and vice versa. One may see in Figure 4b–d that the (Fe, Cr)-rich dark phase (light phase in SEM-BSE image) has a disordered BCC crystal structure (A2), and the (Al, Ni)-rich light phase (dark phase in SEM-BSE image) has an ordered BCC crystal structure (B2). Due to more negative (see Figure 1), Al and Ni elements tend to form the B2 phase, while the remaining Fe and Cr elements tend to form the A2 phase.
Microstructures of all the seven AlCrFexNi alloys characterized via SEM are displayed in Figure 5. One may see from Figure 5a1–a3 that when x = 0, the central area of grain is composed of spherical A2 nanoparticles dispersed in the B2 matrix. From the center to the grain boundary, A2 nanoparticles gradually change from spherical, through ellipsoidal, to large plate-like domains. At x = 0.5, as shown in Figure 5b1–b4, the spherical and plate-like A2 particles form within the grains, and the microstructure in the central area of grain is composed of spherical and plate-like A2 nanoparticles distributed in the B2 matrix, forming an irregular weave-like structure (see Figure 5b4). The A2 phase near the grain boundary gradually grows to form a lamellar structure with the B2 phase, and very tiny A2 nanoparticles precipitate can be seen in the large B2 lamellas (see Figure 5b3). As x increases to 1.0, the volume fraction of weave-like A2/B2 structure becomes larger, and the lamellar A2/B2 structure near the grain boundary becomes finer, as Figure 5c1–c3 illustrate. At x = 1.5, the microstructure is composed of two characteristic domains, as shown in Figure 5d1–d3, one is the B2 matrix, with different-sized A2 particles, denoted as BMAP domain, and the other is the A2 matrix embedded with near-spherical B2 nanoparticles, denoted as the AMBP domain. As x increases to 2.0, one may see in Figure 5e1–e4 that the volume fraction of the AMBP domain increases, since the increase in Fe content contributes to the formation of the A2 phase. The average size of B2 nanoparticles in AMBP domain is about 179 nm. When Fe content increases to x = 2.5, the volume fraction of AMBP domain continues to increase, and the BMAP domain is hardly observable, as Figure 5f1–f3 illustrates. The average size of B2 nanoparticles in AMBP domain decreases to about 142 nm. When x = 3.0, similar to that of x = 2.5, only the AMBP domain is observed, as shown in Figure 5g1–g3. The fraction of A2 phase continues to increase due to increased Fe content; thus, the average size of B2 nanoparticles continues to decrease, which is about 101 nm on average. Considering the microstructural evolution in AlCrFexNi alloys as displayed in Figure 5, the volume fraction of the A2 phase, which is rich in Fe and Cr, gradually increases with increasing Fe content, while the fraction of the B2 phase, which is rich in Al and Ni, correspondingly decreases. As a result, the morphology of A2/B2 structure varies with the Fe content, which may significantly affect their mechanical properties.
3.2. Mechanical Properties
In Al-Cr-Fe-Ni alloys, the Fe- and Cr-rich disordered A2 phase is softer than Al- and Ni-rich ordered B2 phase. Thus, with increasing Fe content, the volume fraction of A2 phase increases, which would lead to a reduction of hardness and compressive strength. However, hardness, mechanical properties, and wear resistance are also influenced by other factors such as the phase composition, morphology, and arrangement. For example, the morphology of the A2/B2 structure in Al-(Co)-Cr-Fe-Ni alloys is significantly affected by the Al/Ni content ratio, leading to variable mechanical properties [23,24,25,26]. The Al30Ni30Fe20Cr20 alloy with a higher B2/A2 ratio even exhibits a lower compressive strength than an Al20Ni20Fe30Cr30 alloy that has a low B2/A2 ratio, due to the morphological variations in the A2/B2 structure [20]. An AlCoCrFeNiNb1.0 coating with the greatest hardness shows the second-lowest wear resistance among five AlCoCrFeNiNbx coatings [27] due to the interactions between constituent phases during the wear process. The interlamellar spacing of ferrite–cementite structure strongly affects the strength and ductility of pearlite steels via interphase boundary strengthening [28,29]. The wear resistance is also affected by phase morphologies for alloys having similar overall hardness values [30,31], some of which may achieve higher wear resistance with lower hardness [32] due to better balanced strength and ductility. Therefore, the wear resistance is affected by both hardness and ductility, which determine the fracture toughness of the material. For the AlCrFexNi alloy system, adjusting Fe content to manipulate the A2/B2 structure turns out to be effective in achieving desirable mechanical properties and wear resistance (see Section 3.3).
Macrohardness (Rockwell Scale) was measured to evaluate the overall hardness of the AlCrFexNi alloys with respect to the Fe content. Results of the measurement are shown in Figure 6, and the corresponding values are given in Table 3. One may see that the alloy with x = 0 exhibits the greatest hardness due to its largest fraction of the hard B2 phase. The hardness gradually decreases as x increases from 0 to x = 1.0, which may be ascribed to the increase in the fraction of the relatively softer A2 phase as Fe content increases. However, as x continuously increases, the precipitation strengthening of the A2 matrix by B2 nanoparticles is enhanced as B2 nanoparticles become finer, thus leading to a slight increase in hardness even the volume fraction of the A2 phase/domain increases and eventually becomes the dominant phase. This may explain the observations that from x = 1.0 to x = 2.0, the hardness remains nearly unchanged. After x = 2.0, the hardness somewhat increases mainly due to the further refinement of high-density B2 nanoparticles.
Compressive stress–strain curves of AlCrFexNi alloys are shown in Figure 7a, and corresponding values of 0.2% compressive yield strength and fracture strain are shown in Figure 7b as a function of x, i.e., the Fe content. The yield strength is the lowest point at x = 0, where the alloy has a simple microstructure of A2 nanoparticles distributed in the B2 matrix. When Fe is added, the yield strength increases to the highest point at x = 0.5, and subsequently decreases monotonously till x = 3.0 as the Fe content increases. In contrast, fracture strain keeps increasing monotonously with the increase in the Fe content, and reaches the highest point at x = 3.0. Values of the mechanical properties of the AlCrFexNi alloys are listed in Table 3.
It should be pointed out that the Fe-free alloy has both lower yield and peak strengths than Fe-containing alloys. However, the former shows a slightly higher hardness (Figure 6). This inconsistency could be related to plasticity and strain hardening rate. As shown in Table 3, the Fe-containing alloys are more ductile than the Fe-free one. For Fe0 alloy with lower ductility, it has a higher strain hardening rate, which is estimated by the (peak strength-yield strength)/fracture strain. Thus, for Fe0 alloy, the plastic deformation induced by indentation could be more concentrated in the vicinity of the indenter and its highest strain-hardening rate could lead to the largest limit to dislocation movement and thus the resistance to local plastic deformation. This could be a possible reason for its slightly higher hardness than those of Fe-containing alloys, as shown in Figure 6.
It should also be pointed out that overall, the higher peak or fracture strengths and fracture strains of Fe-containing alloys make them tougher, which certainly benefits their resistance to fracture and wear.
Figure 8 illustrates representative structural features of AlCrFe0.5Ni alloy before and after the compressive test. The initial microstructure before the compressive test is shown in Figure 8a. During the compressive test, cracks are generated. Figure 8b illustrates a crack passing through alternating A2 and B2 phases, as pointed out by a green arrow. The interface between phases with lattice misfit may hinder the dislocation movement, which may harden the material but deteriorates its ductility [33,34]. The A2/B2 interface itself might favor crack propagation [35] along the interface due to the misfit strain, as pointed out by the yellow arrows in Figure 8b. Thus, the structure with larger A2/B2 interfacial areas near grain boundaries may promote crack propagation and thus the fracture of the alloy, corresponding to a low fracture strain of the AlCrFe0.5Ni alloy. The grain boundaries are another preferential path for crack propagation [26], as shown in Figure 8c, because of their higher strain energy that makes the boundaries less mechanically stable. As depicted in Figure 8d, there are many A2 nanoprecipitates embedded in the B2 phase domains near grain boundaries. The microcracks bypass the A2 nanoparticles along A2/B2 interfaces, as marked by yellow arrows. These A2 nanoparticles may impede the cracks propagation by blocking, splitting, and zigzagging the cracks, thus increasing total crack propagation path, which more or less toughens the B2 phase.
Representative microstructural features of AlCrFe1.5Ni alloy before and after the compressive test are comparably illustrated in Figure 9. The initial structure (Figure 9a) of AlCrFe1.5Ni alloy is composed of two domains, AMBP and BMAP, with different matrixes and precipitate morphologies, which strongly affect their mechanical behaviors. The equilibrium morphology of precipitates is determined by both elastic energy and interfacial energy of the precipitate/matrix interface [36,37]. The interfacial energy generally influences the shape of small-sized particles. The elastic energy due to the lattice misfit at the coherent precipitate/matrix interface may play a more predominant role in affecting the particle’s shape [36,38]. Smaller and moderate lattice misfits lead to a spherical shape and a cuboidal shape, respectively, which would exhibit a good strength-ductility combination [2]. While a moderate and larger lattice misfit leads to a weave-like shape and coarser second particles, which would show high strength at the expense of ductility [33]. Thus, the AlCrFe0.5Ni alloy with near weave-like structure and the AlCrFe1.0Ni alloy with weave-like structure show higher strength but reduced ductility. In contrast, the AlCrFe3.0Ni alloy with uniform spherical precipitates possesses better a strength–ductility combination. Figure 7b displays a crack propagating along the boundary of AMBP and BMAP domains. Due to lower toughness of the harder B2 phase, compared to that of A2 phase, BMAP domain is expected to have high strength but lower ductility [23,39]. While the AMBP domain is expected to have not only better toughness but also high strength, since the tough A2 matrix is strengthened by harder B2 nanoprecipitates [2,40,41]. As shown in Figure 9c, the crack coming from the BMAP domain blunts in AMBP domain. Figure 9d shows the representative crack propagation inside the BMAP domain. As indicated by the yellow arrows, cracks split and propagate along the larger interface of the plate-like A2/B2 structure [35], some of which are blunt in the AMBP domain. Figure 10 displays representative indentation marks, typical load–penetration depth curves, and corresponding micro-hardness of the AMBP and BMAP domains in the AlCrFe2.0Ni alloy. For further information and comparison, two alloys, respectively having an FeCr single-A2 phase and an AlNi single-B2 phase, were also prepared and their hardness was measured. Micro-hardness values of the A2 and B2 phases under a load of 50 mN were determined to be 4.987 ± 0.202 GPa and 6.734 ± 0.237 GPa, respectively. In this work, the hardness values of the duplex-phase AMBP domain and the BMAP domain were determined to be 6.761 ± 0.299 GPa and 7.132 ± 0.284 GPa, respectively. Based on the measured microhardness values of A2, B2, the AMBP and BMAP, AMBP domains are strengthened via the strengthening of the A2 matrix by high-density nanoscale B2 particles, while the BMAP domain is strengthened via the strengthening of its B2 matrix by irregular-shape A2 nanoparticles [2,40]. The A2 particles also toughen the B2 matrix in the BMAP domain by blocking crack growth and affecting the crack propagation in the A2+B2 structure [35]. Thus, although the increase in the volume fraction of BMAP domain reduces the ductility when compared with the AlCrFe2.5Ni and AlCrFe3.0Ni alloys, the AlCrFe1.5Ni and AlCrFe2.0Ni alloys still show a relatively good fracture strain around 44%. Although the precipitation of A2 nanoparticles would toughen the BMAP domain by increasing the total crack propagation path due to crack bypassing the A2 nanoparticles along A2/B2 interfaces (see Figure 8d), large and flat plate-like A2/B2 interfaces provide a level road for crack propagation (Figure 9d). Therefore, one may infer that decreasing the BMAP domain and increasing the AMBP domain will lead to higher resistance to crack propagation and thus better mechanical performance.
3.3. Wear Behavior
Volume losses of AlCrFexNi alloys after sliding wear tests were measured and are presented in Figure 11. One may see that except the alloy at x = 0, the wear volume loss of AlCrFexNi exhibits an ‘arched trend’, i.e., increasing first and then decreasing. The alloy of x = 0 exhibits a relatively large wear loss, while at x = 0.5, the wear loss sharply decreases. As x continuously increases, the wear volume loss reaches the highest value at x = 1.5, and then decreases to the lowest one at x = 3.0. Correspondingly, the wear track depth and width are the largest for the alloy at x = 1.5, and they reach the lowest at x = 3.0, as illustrated by the cross-sectional wear track profiles shown in Figure 12a and the three-dimensional track profiles in Figure 12b, respectively.
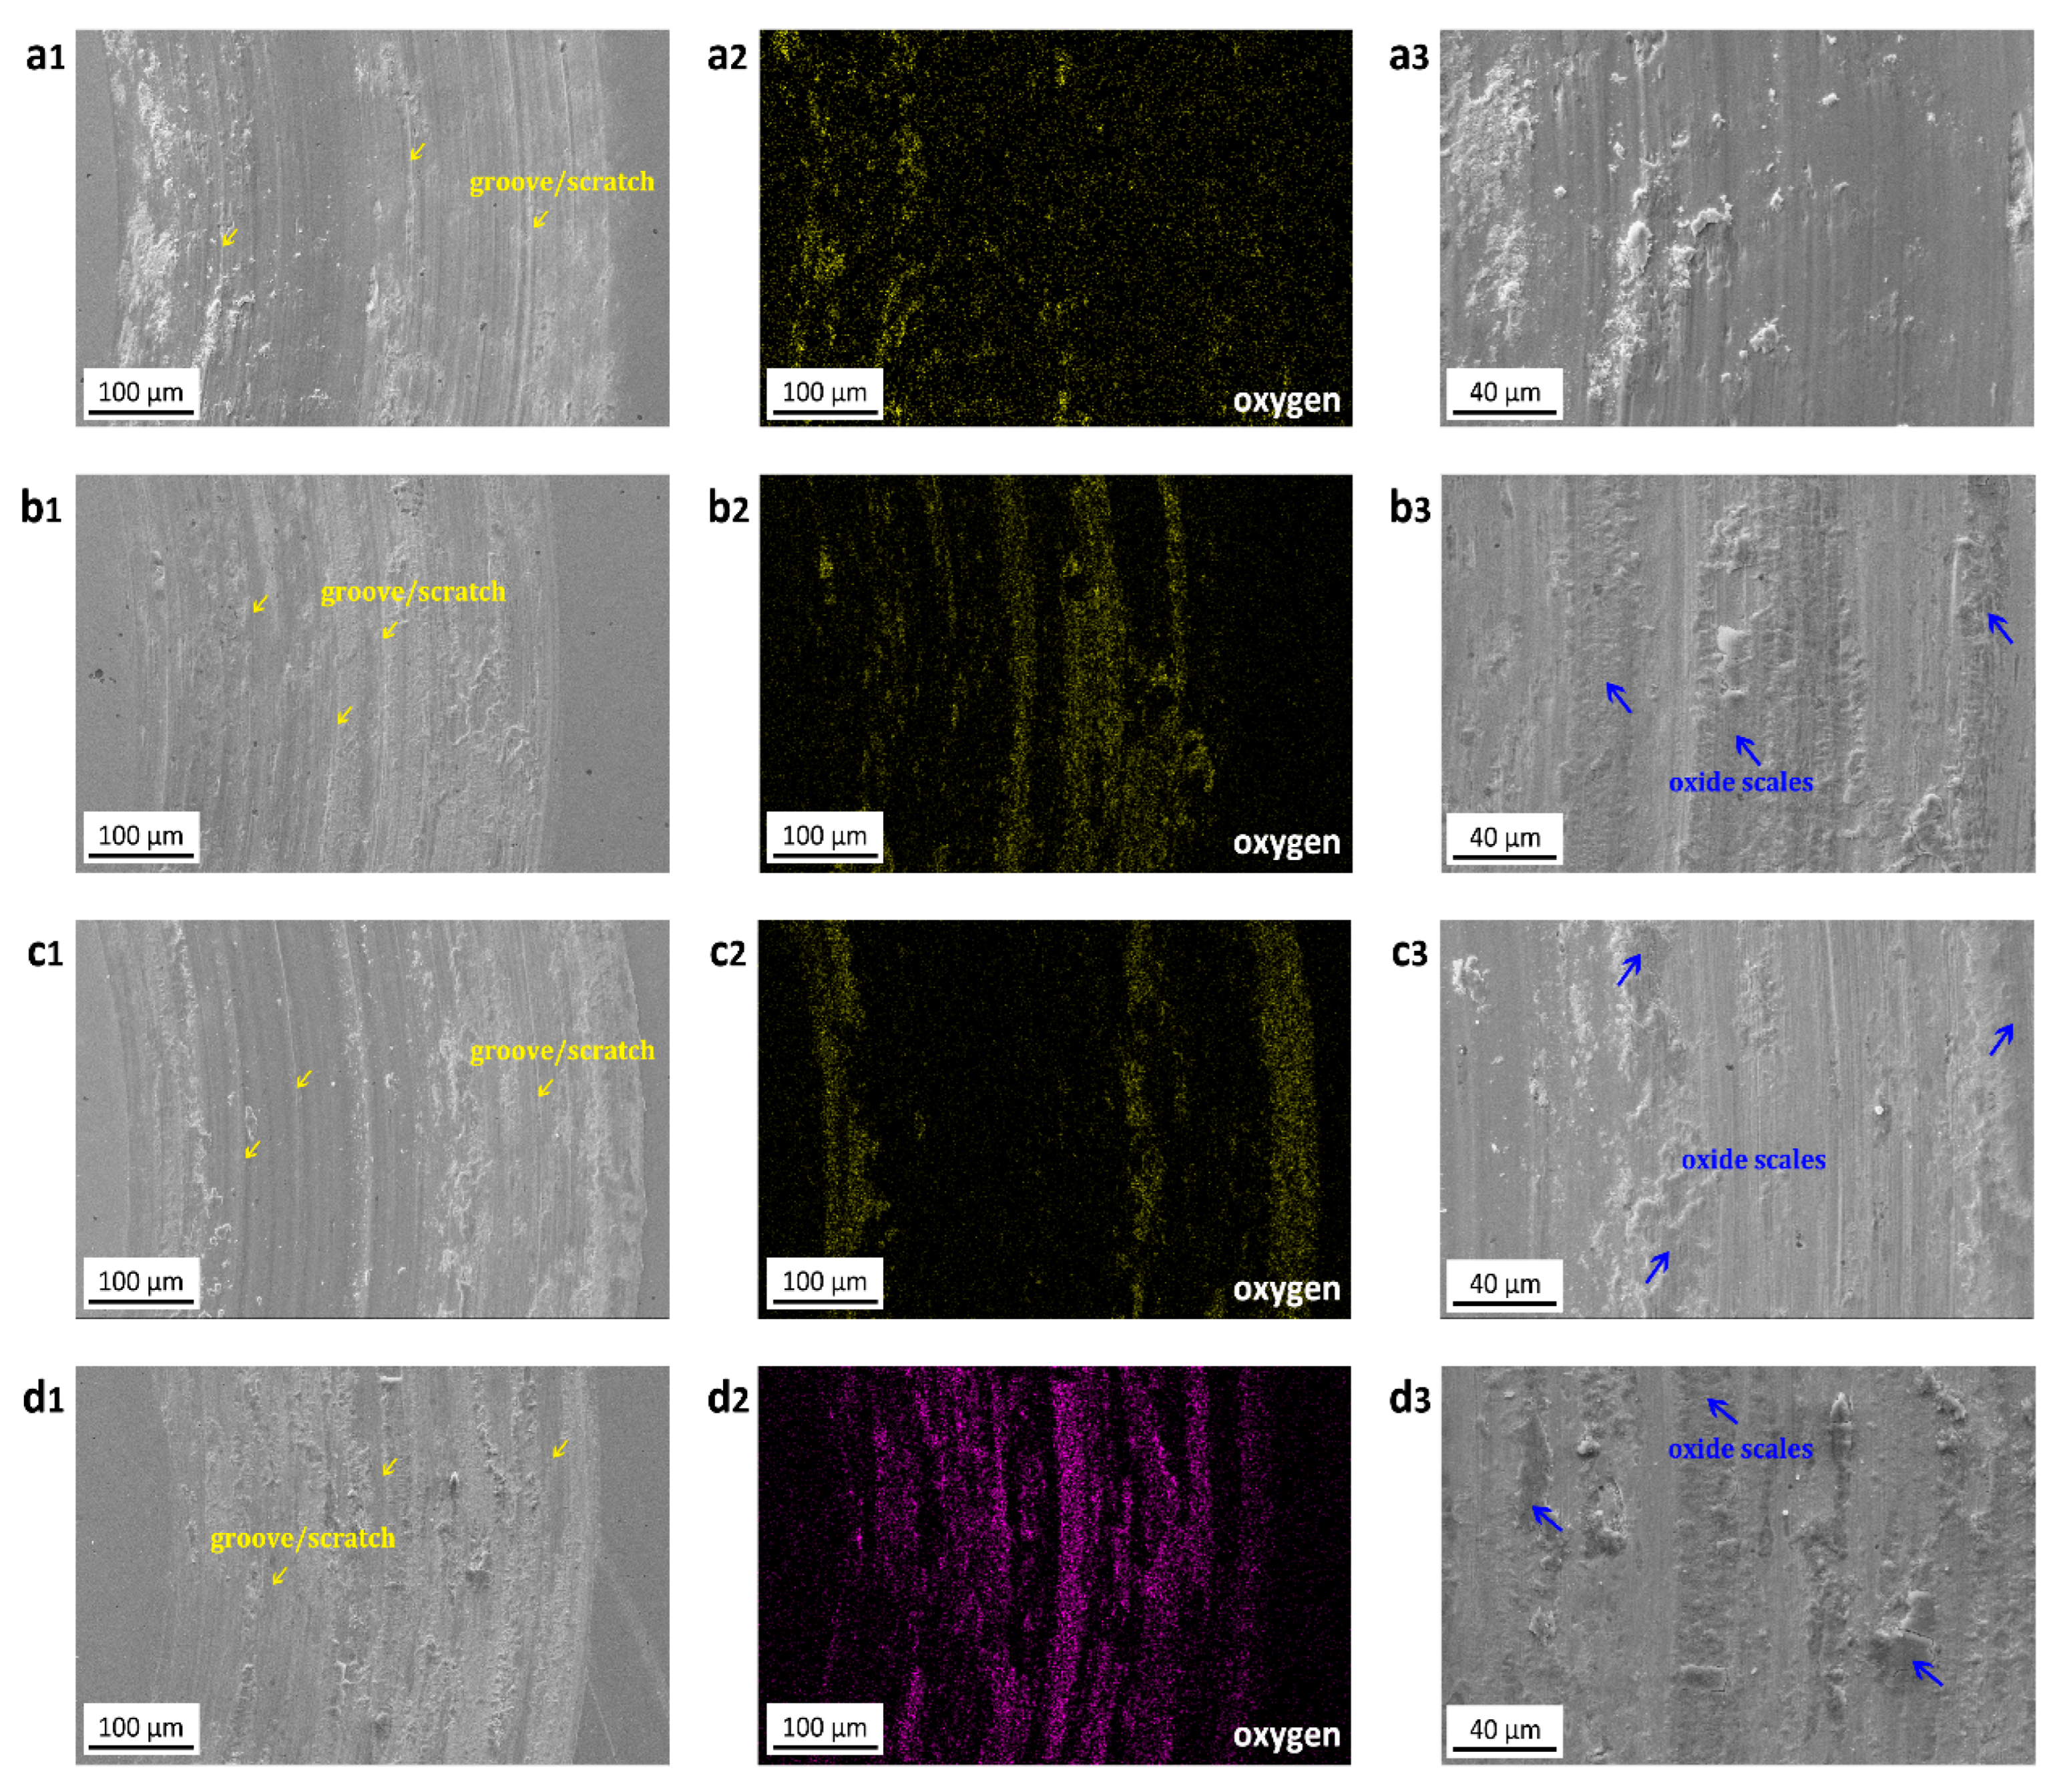
Figure 13 shows worn surface morphologies of representative alloys characterized with SEM and EDS. One may see that all the alloys were subjected to abrasive wear under the present testing conditions, as demonstrated by grooves and scratches, although oxidation or oxidative wear is also involved.
It should be indicated that macro-hardness is of great importance to the wear resistance as the Archard equation expresses. However, other factors, e.g., phase constituents and morphologies as well as the wearing condition, also affect the wear resistance, since the microstructure may change the strength–ductility combination and hardening mechanism. The AlCrFe0Ni alloy shows the greatest hardness due to its highest fraction of the B2 phase among all seven AlCrFexNi alloys. However, since the relatively brittle B2 matrix promotes the crack formation and propagation under applied force during wear, severe abrasive wear features were observed in Figure 13a1. Less oxide scales are retained on the worn surface, as shown in Figure 13a2 and a3. In the AlCrFe0.5Ni alloy, inside grains, the weave-like A2/B2 structure (see Figure 5b2,b4) strengthened and toughened the alloy, compared with the situation of the AlCrFe0Ni alloy (see the compressive stress–strain curves shown in Figure 7 and values in Table 3), which explain why the wear resistance increases as Fe is added. As more Fe is added, the alloy becomes more ductile with a decrease in hardness, leading to more wear, as shown in Figure 11. However, when further increasing the Fe content, the wear deceases again, showing an ‘arched trend’ as Figure 11 illustrates. This may be explained by the measured mechanical properties (Figure 6 and Figure 7 and Table 3). The B2 nanoprecipitates strongly strengthen the alloys with further B2 refinement because of increased barriers to dislocation movement and crack propagation as well, i.e., the finer the precipitates, the greater their benefits, leading to a gradual turn towards increases in hardness and toughness.
It should be noted that the involved oxidation caused by frictional heating may also play a role. Oxidation occurred during the wear tests because of the friction heating, as shown by oxide scales in Figure 13. From the EDS results, the oxygen distribution of representative alloys is displayed in the middle column (Figure 13), and corresponding atomic percentages of oxygen are measured as 6.8%, 15.8%, 15.7%, and 21.5%, respectively. The oxide scales involving the formation, damage, and peel/spall off during wear testing, are influenced by the mismatches in thermal expansion strain and mechanical strain between the oxide scale and the substrate [42,43]. For harder but less ductile alloys such as the AlCrFe0Ni alloy, the oxide scale formed on this alloy substrate may have a larger interfacial mismatch strain, making the oxide less adherent to the substrate. With added Fe, the alloy substrate becomes more flexible (corresponding to a larger fracture strain) while its hardness does not change much (see Table 3). The increased flexibility may help reduce the interfacial stress and retain the oxide scale, thus helping increase the resistance to wear. However, the alloy substrate with lesser hardness may provide insufficient support to the oxide scale, which is more or less harmful to retain the oxide scale. Thus, the tougher AlCrFe1.5Ni alloy does not show more oxide scales due to its reduced hardness in comparison to the AlCrFe0.5Ni alloy. In contrast, the AlCrFe3.0Ni alloy with good hardness and toughness and with finer B2 precipitation, strengthening the A2 matrix, shows the most retained oxide scales as well as the greatest apparent wear resistance.
4. Conclusions
In this study, we demonstrate that the A2/B2 duplex-phase structure can be feasibly modified by changing the Fe content in the AlCrFexNi alloy. Due to more negative mixing enthalpy of the Al-Ni elemental pair, Al and Ni elements form an (Al,Ni)-rich B2 phase, while Cr and Fe elements tend to form an A2 phase. The fractions, shapes, and sizes of the A2 and B2 phase domains vary with respect to the Fe content. The underlying mechanisms of the microstructure evolution, corresponding mechanical properties, and wear behaviors were analyzed. The main conclusions are as follows:
(a) The fraction of the A2 phase increases with increasing Fe content. The AlCrFexNi alloy changes its microstructure containing the B2 matrix embedded with A2 nanoprecipitates to one with a weave-like A2/B2 structure. As the Fe content continuously increases, the microstructure changes to a mixture of BMAP (B2 matrix with A2 precipitates) and AMBP (A2 matrix with B2 precipitates) domains and finally, to a complete AMBP structure.
(b) The addition of Fe slightly decreases the hardness. The compressive yield strength decreases and fracture strain increases with increasing Fe content. The Fe-free alloy (x = 0) exhibits somewhat greater hardness but shows the lowest yield strength and fracture strain due to an intrinsically brittle or less tough B2 matrix.
(c) Cracks tend to propagate along the A2/B2 interfaces, especially along the interfaces in the larger, plate-like A2/B2 structure. The AMBP structure exhibits greater resistance to crack propagation, corresponding to greater toughness, compared to the BMAP structure. Both the AMBP and BMAP structures are strengthened by precipitation strengthening, compared to single A2 and B2 phases without precipitates.
(d) The alloy of x = 0 displays the second-largest wear volume loss, due to the intrinsic brittleness of the B2 matrix. When Fe is added, the wear volume loss decreases considerably but shows a trend of an upward parabola with respect to the Fe content (x = 0.5~3.0). After achieving the highest volume loss at x = 1.5, with a mixture of AMBP and BMAP, the volume loss decreases again. In addition to hardness, the oxide scale, whose adherence to the substrate is affected by the mechanical properties of the substrate, may also play a role in affecting the wear resistance of the alloy.
Author Contributions
G.D.: Investigation, Data curation, Formal analysis, Methodology, Validation, Writing—original draft. M.W.: Investigation, Formal analysis, Validation. A.H.: TEM analysis, Formal analysis, Data curation. Z.X.: Formal analysis, Validation. S.E.M.: Formal analysis, Validation. D.L.: Conceptualization, Methodology, Supervision, Funding acquisition, Resources, Validation, Writing—review & editing. All authors have read and agreed to the published version of the manuscript.
Funding
This research was funded by the Natural Science and Engineering Research Council of Canada (NSERC AMA ALLRP 567506-21 Li), Trimay, and Mitacs (MI MA IT29134 Kumar/Xu/Li).
Data Availability Statement
The paper is self-containing. For additional information or data, please contact the corresponding author.
Conflicts of Interest
The authors declare that they have no known competing financial interests or personal relationships that could have appeared to influence the work reported in this paper.
References
- Li, J.L.; Li, Z.; Wang, Q.; Dong, C.; Liaw, P.K. Phase-field simulation of coherent BCC/B2 microstructures in high entropy alloys. Acta Mater. 2020, 197, 10–19. [Google Scholar] [CrossRef]
- Jin, D.; Wang, Z.; Yuan, J.; Jiang, B.; Yu, F.; Li, J.; Wang, Q. High-strength and energetic Al2Ti6Zr2Nb3Ta3 high entropy alloy containing a cuboidal BCC/B2 coherent microstructure. J. Alloys Compd. 2023, 931, 167546. [Google Scholar] [CrossRef]
- Liu, L.; Zhang, Y.; Han, J.; Wang, X.; Jiang, W.; Liu, C.T.; Zhang, Z.; Liaw, P.K. Nanoprecipitate-Strengthened High-Entropy Alloys. Adv. Sci. 2021, 8, e2100870. [Google Scholar] [CrossRef]
- Wang, X.G.; Liu, J.L.; Jin, T.; Sun, X.F. The effects of ruthenium additions on tensile deformation mechanisms of single crystal superalloys at different temperatures. Mater. Des. 2014, 63, 286–293. [Google Scholar] [CrossRef]
- Li, Z.M.; Li, X.N.; Hu, Y.L.; Zheng, Y.H.; Yang, M.; Li, N.J.; Bi, L.X.; Liu, R.W.; Wang, Q.; Dong, C.; et al. Cuboidal γ’ phase coherent precipitation-strengthened Cu–Ni–Al alloys with high softening temperature. Acta Mater. 2021, 203, 116458. [Google Scholar] [CrossRef]
- Ma, Y.; Hao, J.; Wang, Q.; Zhang, C.; Li, C.; Dong, C. Temperature-affected microstructural stability of coherent cuboidal B2 particles in precipitation-strengthened body-centered-cubic Al0.7CoCr2FeNi high-entropy alloy. J. Mater. Sci. 2019, 54, 8696–8710. [Google Scholar] [CrossRef]
- Thompson, M.E.; Su, C.S.; Voorhees, P.W. The equilibrium shape of a misfitting precipitate. Acta Metall. Mater. 1994, 42, 2107–2122. [Google Scholar] [CrossRef]
- Hou, J.-X.; Cao, B.-X.; Xiao, B.; Jiao, Z.-B.; Yang, T. Compositionally complex coherent precipitation-strengthened high-entropy alloys: A critical review. Rare Met. 2022, 41, 2002–2015. [Google Scholar] [CrossRef]
- Chen, X.; Qi, J.Q.; Sui, Y.W.; He, Y.Z.; Wei, F.X.; Meng, Q.K.; Sun, Z. Effects of aluminum on microstructure and compressive properties of Al-Cr-Fe-Ni eutectic multi-component alloys. Mater. Sci. Eng. A 2017, 681, 25–31. [Google Scholar] [CrossRef]
- Wang, H.; Zhang, W.; Gao, P.; Xiang, Q.; Qu, Y.; Cheng, J.; Ren, Y.; Yu, B.; Qiu, K. AlxCrFeNi medium entropy alloys with high damping capacity. J. Alloys Compd. 2021, 876, 159991. [Google Scholar] [CrossRef]
- Wang, M.; Wen, Z.; Liu, J.; Ma, B.; Wang, M.; Zou, Z.; Zhao, Y. Labyrinthine structure Al CrFeNi (x ≥ 1) eutectic high entropy alloys with duplex reinforced phases. J. Alloys Compd. 2022, 918, 165441. [Google Scholar] [CrossRef]
- Wang, M.; Wen, Z.; Ma, B.; Liu, J.; Zou, Z.; Zhao, Y. Enhancing the strength of AlCrFeNi HEAs via tailoring aluminum content and optimal aging treatment. J. Alloys Compd. 2022, 893, 162242. [Google Scholar] [CrossRef]
- Liu, F.; Song, Q.; Chen, R.; Li, W.; Song, X.; Sun, J.; Wang, C. Effects of Al and Co contents on the microstructure and properties of AlxCoCryFeNi high-entropy alloys. Mater. Charact. 2023, 203, 113108. [Google Scholar] [CrossRef]
- Qin, G.; Xue, W.; Fan, C.; Chen, R.; Wang, L.; Su, Y.; Ding, H.; Guo, J. Effect of Co content on phase formation and mechanical properties of (AlCoCrFeNi)100-xCox high-entropy alloys. Mater. Sci. Eng. A 2018, 710, 200–205. [Google Scholar] [CrossRef]
- Lu, Y.; Gao, X.; Dong, Y.; Wang, T.; Chen, H.L.; Maob, H.; Zhao, Y.; Jiang, H.; Cao, Z.; Li, T.; et al. Preparing bulk ultrafine-microstructure high-entropy alloys via direct solidification. Nanoscale 2018, 10, 1912–1919. [Google Scholar] [CrossRef] [PubMed]
- Jiang, H.; Li, L.; Wang, R.; Han, K.; Wang, Q. Effects of Chromium on the Microstructures and Mechanical Properties of AlCoCrxFeNi2.1 Eutectic High Entropy Alloys. Acta Metall. Sin. Engl. Lett. 2021, 34, 1565–1573. [Google Scholar] [CrossRef]
- Cao, L.; Wang, X.; Wang, Y.; Zhang, L.; Yang, Y.; Liu, F.; Cui, Y. Microstructural evolution, phase formation and mechanical properties of multi-component AlCoCrFeNix alloys. Appl. Phys. A 2019, 125, 699. [Google Scholar] [CrossRef]
- Tian, Q.W.; Zhang, G.J.; Yin, K.X.; Cheng, W.L.; Wang, Y.N.; Huang, J.C. Effect of Ni content on the phase formation, tensile properties and deformation mechanisms of the Ni-rich AlCoCrFeNix (x = 2, 3, 4) high entropy alloys. Mater. Charact. 2021, 176, 111148. [Google Scholar] [CrossRef]
- Takeuchi, A.; Inoue, A. Classification of Bulk Metallic Glasses by Atomic Size Difference, Heat of Mixing and Period of Constituent Elements and Its Application to Characterization of the Main Alloying Element. Mater. Trans. 2005, 46, 2817–2829. [Google Scholar] [CrossRef]
- Xiao, Y.; Chang, X.; Peng, X.; Fu, T. Heterogeneous structure induced excellent mechanical and wear properties in Co-free FeCrAlNi medium-entropy alloys. J. Mater. Res. Technol. 2022, 18, 4169–4180. [Google Scholar] [CrossRef]
- Wu, M.; Yuan, J.; Diao, G.; Li, D. Achieving a Combination of Higher Strength and Higher Ductility for Enhanced Wear Resistance of AlCrFeNiTi0.5 High-Entropy Alloy by Mo Addition. Metals 2022, 12, 1910. [Google Scholar] [CrossRef]
- Oliver, W.C.; Pharr, G.M. An improved technique for determining hardness and elastic modulus using load and displacement sensing indentation experiments. J. Mater. Res. 1992, 7, 1564–1583. [Google Scholar] [CrossRef]
- Shaysultanov, D.G.; Salishchev, G.A.; Ivanisenko, Y.V.; Zherebtsov, S.V.; Tikhonovsky, M.A.; Stepanov, N.D. Novel Fe36Mn21Cr18Ni15Al10 high entropy alloy with bcc/B2 dual-phase structure. J. Alloys Compd. 2017, 705, 756–763. [Google Scholar] [CrossRef]
- Sistla, H.R.; Newkirk, J.W.; Liou, F.F.; Al, E.O. Heat treatment on phase transformations and microstructure of AlxFeCoCrNi2−x (x = 0.3, 1) high entropy alloys. Mater. Des. 2015, 81, 113–121. [Google Scholar] [CrossRef]
- Kao, Y.-F.; Chen, T.-J.; Chen, S.-K.; Yeh, J.-W. Microstructure and mechanical property of as-cast, -homogenized, and -deformed AlxCoCrFeNi (0 ≤ x ≤ 2) high-entropy alloys. J. Alloys Compd. 2009, 488, 57–64. [Google Scholar] [CrossRef]
- Wang, T.; Wu, Y.; Yang, Y.; Tian, S.; Zhang, Y.; Jiang, H. Effect of Al/Ni ratio on phase, microstructure and mechanical properties of the AlxCrFeMnNi2−x high entropy alloys. J. Alloys Compd. 2023, 941, 168760. [Google Scholar] [CrossRef]
- Jiang, H.; Han, K.; Li, D.; Cao, Z. Synthesis and Characterization of AlCoCrFeNiNbx High-Entropy Alloy Coatings by Laser Cladding. Crystals 2019, 9, 56. [Google Scholar] [CrossRef]
- Mishra, K.; Singh, A. Effect of interlamellar spacing on fracture toughness of nano-structured pearlite. Mater. Sci. Eng. A 2017, 706, 22–26. [Google Scholar] [CrossRef]
- Xu, P.; Liang, Y.; Li, J.; Meng, C. Further improvement in ductility induced by the refined hierarchical structures of pearlite. Mater. Sci. Eng. A 2019, 745, 176–184. [Google Scholar] [CrossRef]
- Narayanaswamy, B.; Hodgson, P.; Beladi, H. Comparisons of the two-body abrasive wear behaviour of four different ferrous microstructures with similar hardness levels. Wear 2016, 350–351, 155–165. [Google Scholar] [CrossRef]
- Diao, G.; Yan, Q.; Shi, X.; Zhang, X.; Wen, Z.; Jin, X. Improvement of wear resistance in ferrite-pearlite railway wheel steel via ferrite strengthening and cementite spheroidization. Mater. Res. Express 2019, 6, 106513. [Google Scholar] [CrossRef]
- Xu, X.; Xu, W.; Ederveen, F.H.; Zwaag, S.V.D. Design of low hardness abrasion resistant steels. Wear 2013, 301, 89–93. [Google Scholar] [CrossRef]
- Ma, Y.; Jiang, B.; Li, C.; Wang, Q.; Dong, C.; Liaw, P.K.; Xu, F.; Sun, L. The BCC/B2 morphologies in Al x NiCoFeCr high-entropy alloys. Metals 2017, 7, 57. [Google Scholar] [CrossRef]
- Kloenne, Z.T.; Couzinié, J.-P.; Heczko, M.; Gröger, R.; Viswanathan, G.B.; Clark, W.A.T.; Fraser, H.L. On the bcc/B2 interface structure in a refractory high entropy alloy. Scr. Mater. 2023, 223, 115071. [Google Scholar] [CrossRef]
- Joseph, J.; Stanford, N.; Hodgson, P.; Fabijanic, D.M. Understanding the mechanical behaviour and the large strength/ductility differences between FCC and BCC AlxCoCrFeNi high entropy alloys. J. Alloys Compd. 2017, 726, 885–895. [Google Scholar] [CrossRef]
- Ma, Y.; Wang, Q.; Jiang, B.B.; Li, C.L.; Hao, J.M.; Li, X.N.; Dong, C.; Nieh, T.G. Controlled formation of coherent cuboidal nanoprecipitates in body-centered cubic high-entropy alloys based on Al2(Ni,Co,Fe,Cr)14 compositions. Acta Mater. 2018, 147, 213–225. [Google Scholar] [CrossRef]
- Wang, Z.; Jiang, B.; Liu, H.; Niu, B.; Yu, H.; Wang, Q. Microstructural Stability and Strengthening Mechanism of a Ferritic Fe–Cr–Ni–Al Superalloy Containing Cuboidal B2 Nanoparticles. In TMS Annual Meeting & Exhibition; Springer Nature: Cham, Switzerland, 2023; pp. 469–485. [Google Scholar]
- Marquis, E.A.; Seidman, D.N. Nanoscale structural evolution of Al3Sc precipitates in Al(Sc) alloys. Acta Mater. 2001, 49, 1909–1919. [Google Scholar] [CrossRef]
- He, J.Y.; Liu, W.H.; Wang, H.; Wu, Y.; Liu, X.J.; Nieh, T.G.; Lu, Z.P. Effects of Al addition on structural evolution and tensile properties of the FeCoNiCrMn high-entropy alloy system. Acta Mater. 2014, 62, 105–113. [Google Scholar] [CrossRef]
- Yan, X.; Ju, J.; Zuo, L.; Ma, D.; Hu, J.; Zhang, T. Variation of BCC/B2 coherent microstructure and resultant improvement in strength of Al0.7CrxFe 3−xCoNi high-entropy alloys. Mater. Charact. 2023, 203, 113129. [Google Scholar] [CrossRef]
- Diao, G.; He, A.; Li, D.Y.; Wu, M.; Xu, Z.; Li, W.; Li, Q.Y. Tune a highly ductile AlCrFe2Ni4 alloy by Ti addition for desired high mechanical strength. Mater. Sci. Eng. A 2022, 856, 143910. [Google Scholar] [CrossRef]
- Sehitoglu, Y.K.A. Modeling of thermomechanical fatigue damage in coated alloys. Thermomech. Fatigue Behav. Mater. 1993, 1, 17. [Google Scholar]
- Diao, G.J.; He, A.Q.; Tang, Y.Q.; Wu, M.Y.; Zhang, D.; Chen, W.G.; Chen, D.L.; Li, D.Y. Effects of Al and Ti on microstructure, mechanical properties and wear resistance of TiXCrFe2Ni2 alloys. Mater. Sci. Eng. A 2023, 879, 145242. [Google Scholar] [CrossRef]
Figure 1.
Values of (kJ/mol) for atomic pairs among Al, Cr, Fe, and Ni elements [19].
Figure 1.
Values of (kJ/mol) for atomic pairs among Al, Cr, Fe, and Ni elements [19].

Figure 2.
Equilibrium phase diagrams of AlCrFexNi alloys calculated with Thermo-Calc software using TCHEA6 database. A2 is a disordered BCC structure, and B2 is an ordered BCC structure. (a–g) are in sequence corresponding to x = 0, 0.5, 1.0, 1.5, 2.0, 2.5 and 3.0, respectively.
Figure 2.
Equilibrium phase diagrams of AlCrFexNi alloys calculated with Thermo-Calc software using TCHEA6 database. A2 is a disordered BCC structure, and B2 is an ordered BCC structure. (a–g) are in sequence corresponding to x = 0, 0.5, 1.0, 1.5, 2.0, 2.5 and 3.0, respectively.
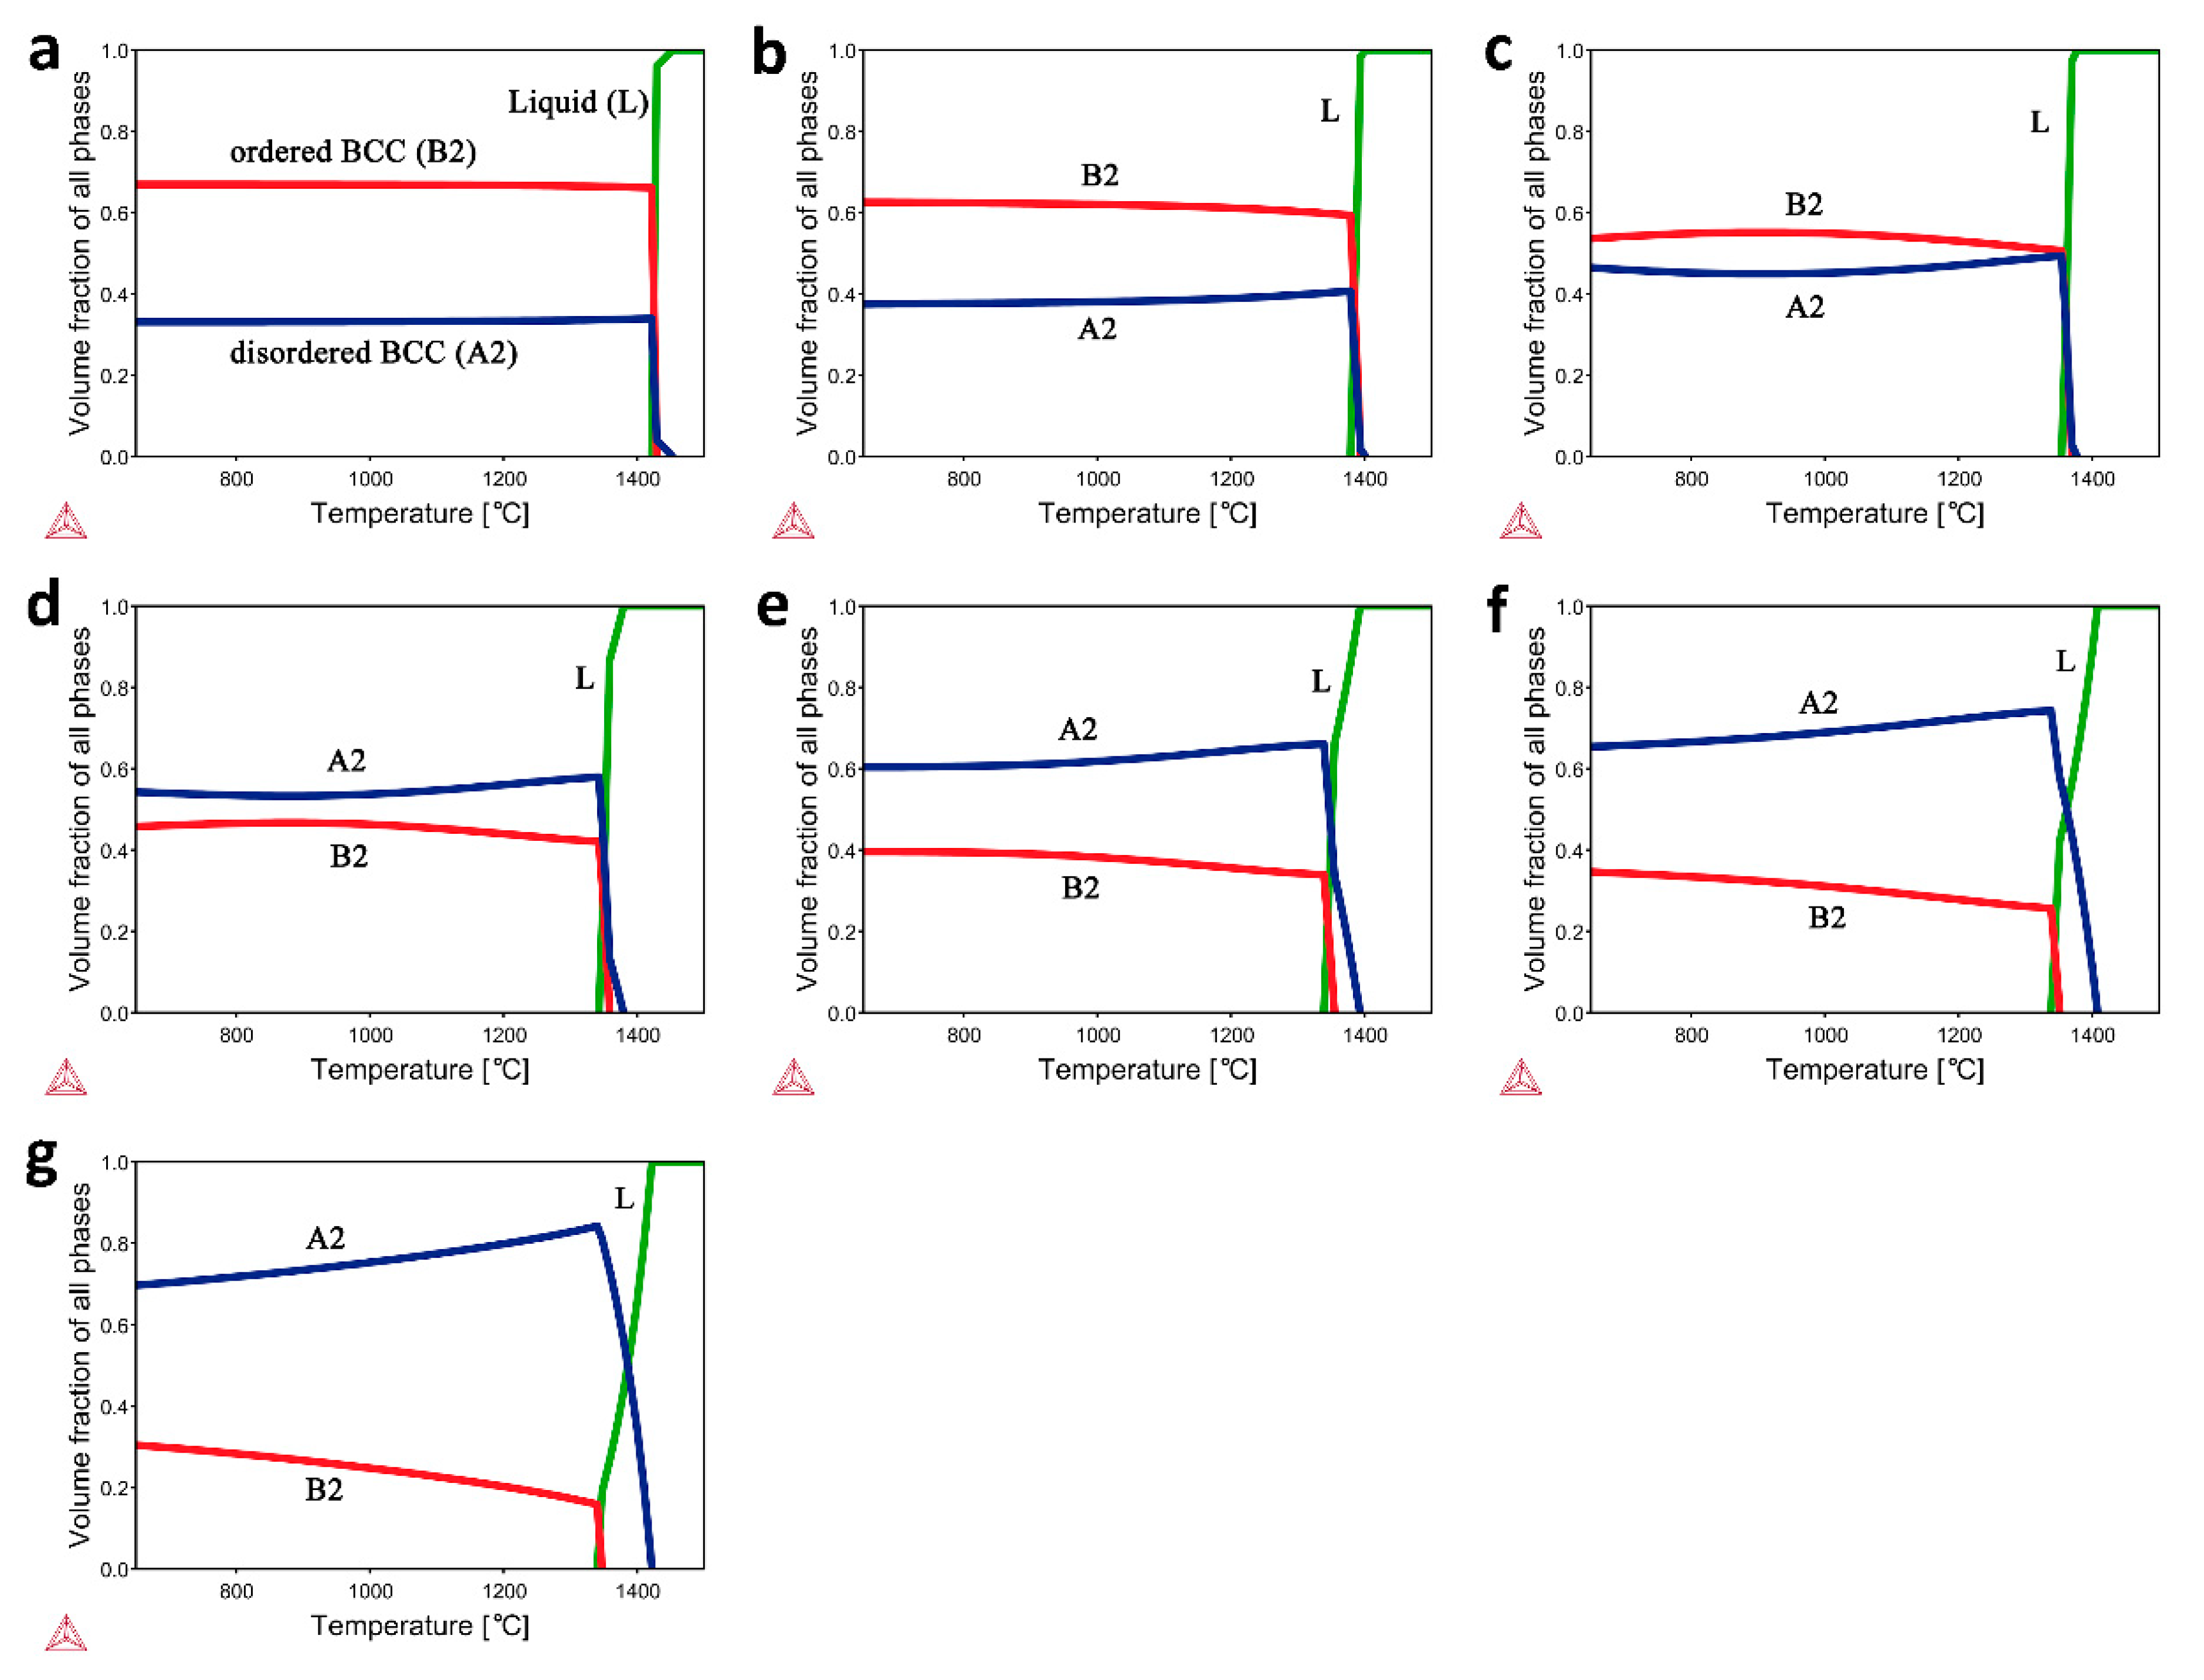
Figure 3.
X-ray diffraction patterns of AlCrFexNi alloys.
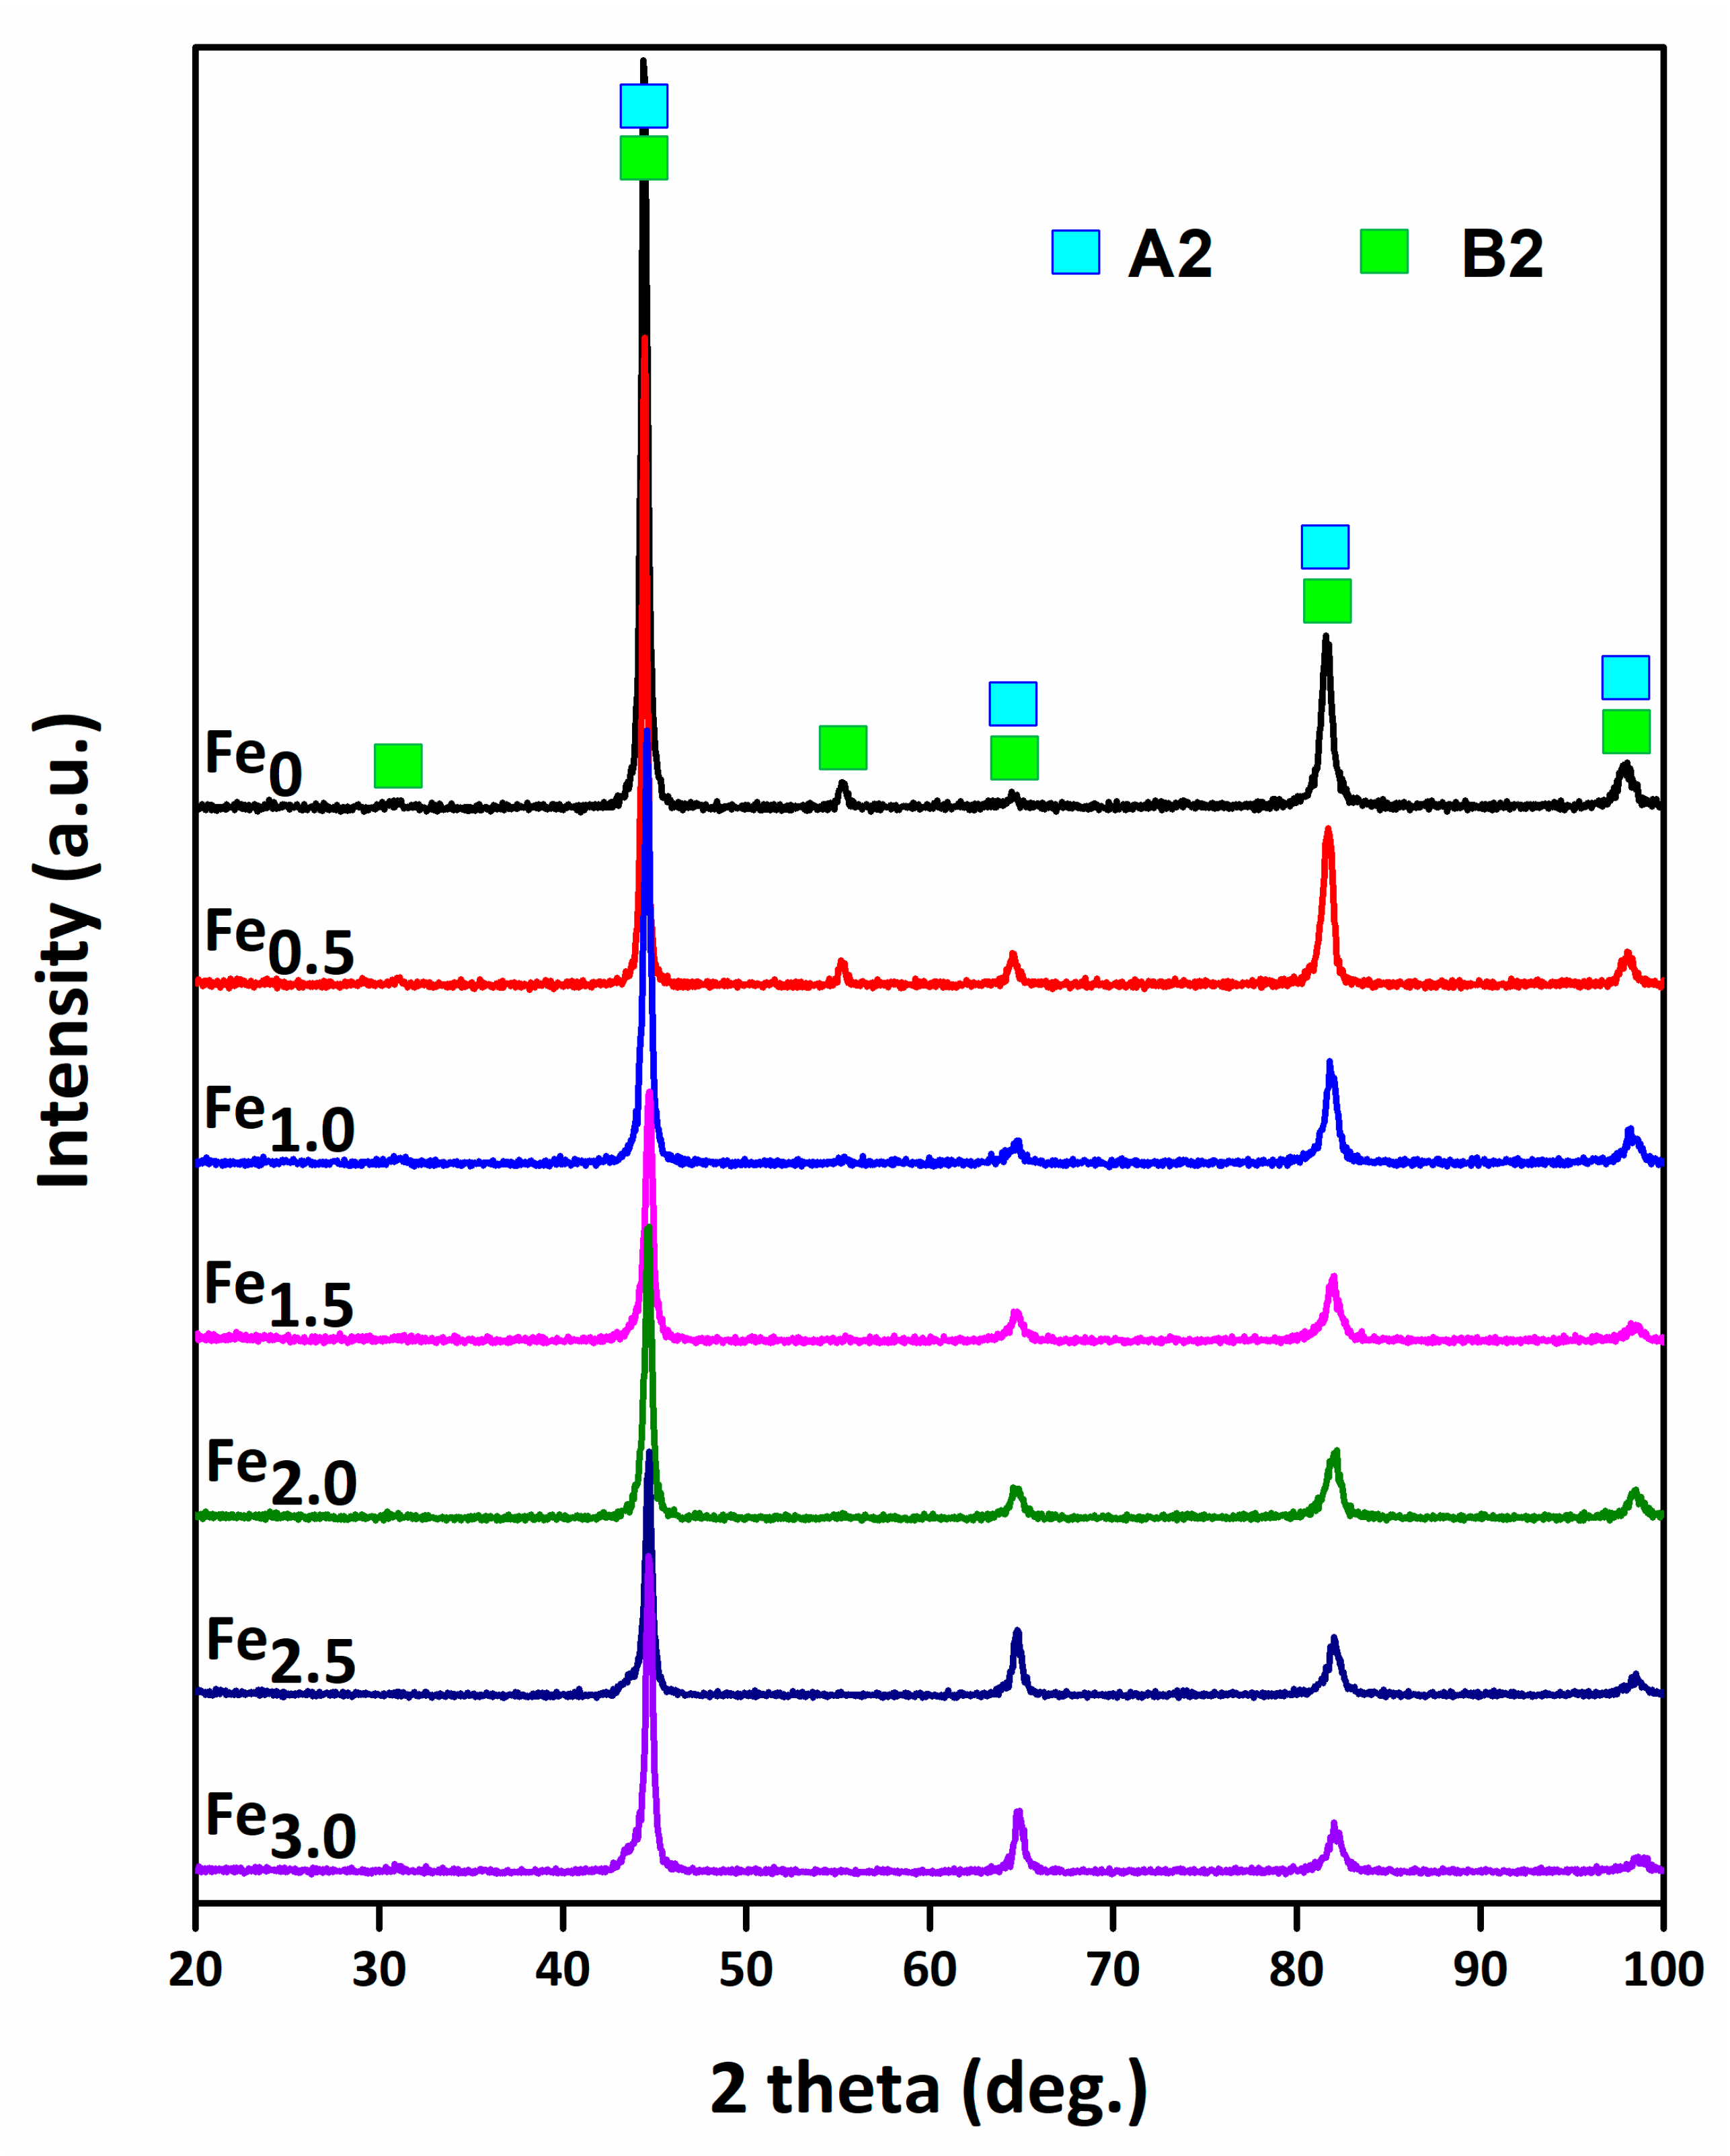
Figure 4.
Results of SEM and TEM analyses for AlCrFe1.0Ni alloy. (a) A SEM BSE image. (b) A TEM bright-field (BF) image. (c,d) Corresponding SAED patterns of A2 and B2 phases. (e) SEM-EDS maps, showing (Fe, Cr)-rich A2 phase and (Al, Ni)-rich B2 phase.
Figure 4.
Results of SEM and TEM analyses for AlCrFe1.0Ni alloy. (a) A SEM BSE image. (b) A TEM bright-field (BF) image. (c,d) Corresponding SAED patterns of A2 and B2 phases. (e) SEM-EDS maps, showing (Fe, Cr)-rich A2 phase and (Al, Ni)-rich B2 phase.

Figure 5.
SEM images of microstructures of AlCrFexNi alloys. Images (a1–a3, b1–b3, c1–c3, d1–d3, e1–e3, f1–f3 and g1–g3) are in sequence taken from the alloys with x = 0, 0.5, 1.0, 1.5, 2.0, 2.5 and 3.0. AMBP represents the domain with B2 nanoparticles distributed in A2 matrix. BMAP represents the domain with A2 particles distributed in B2 matrix.
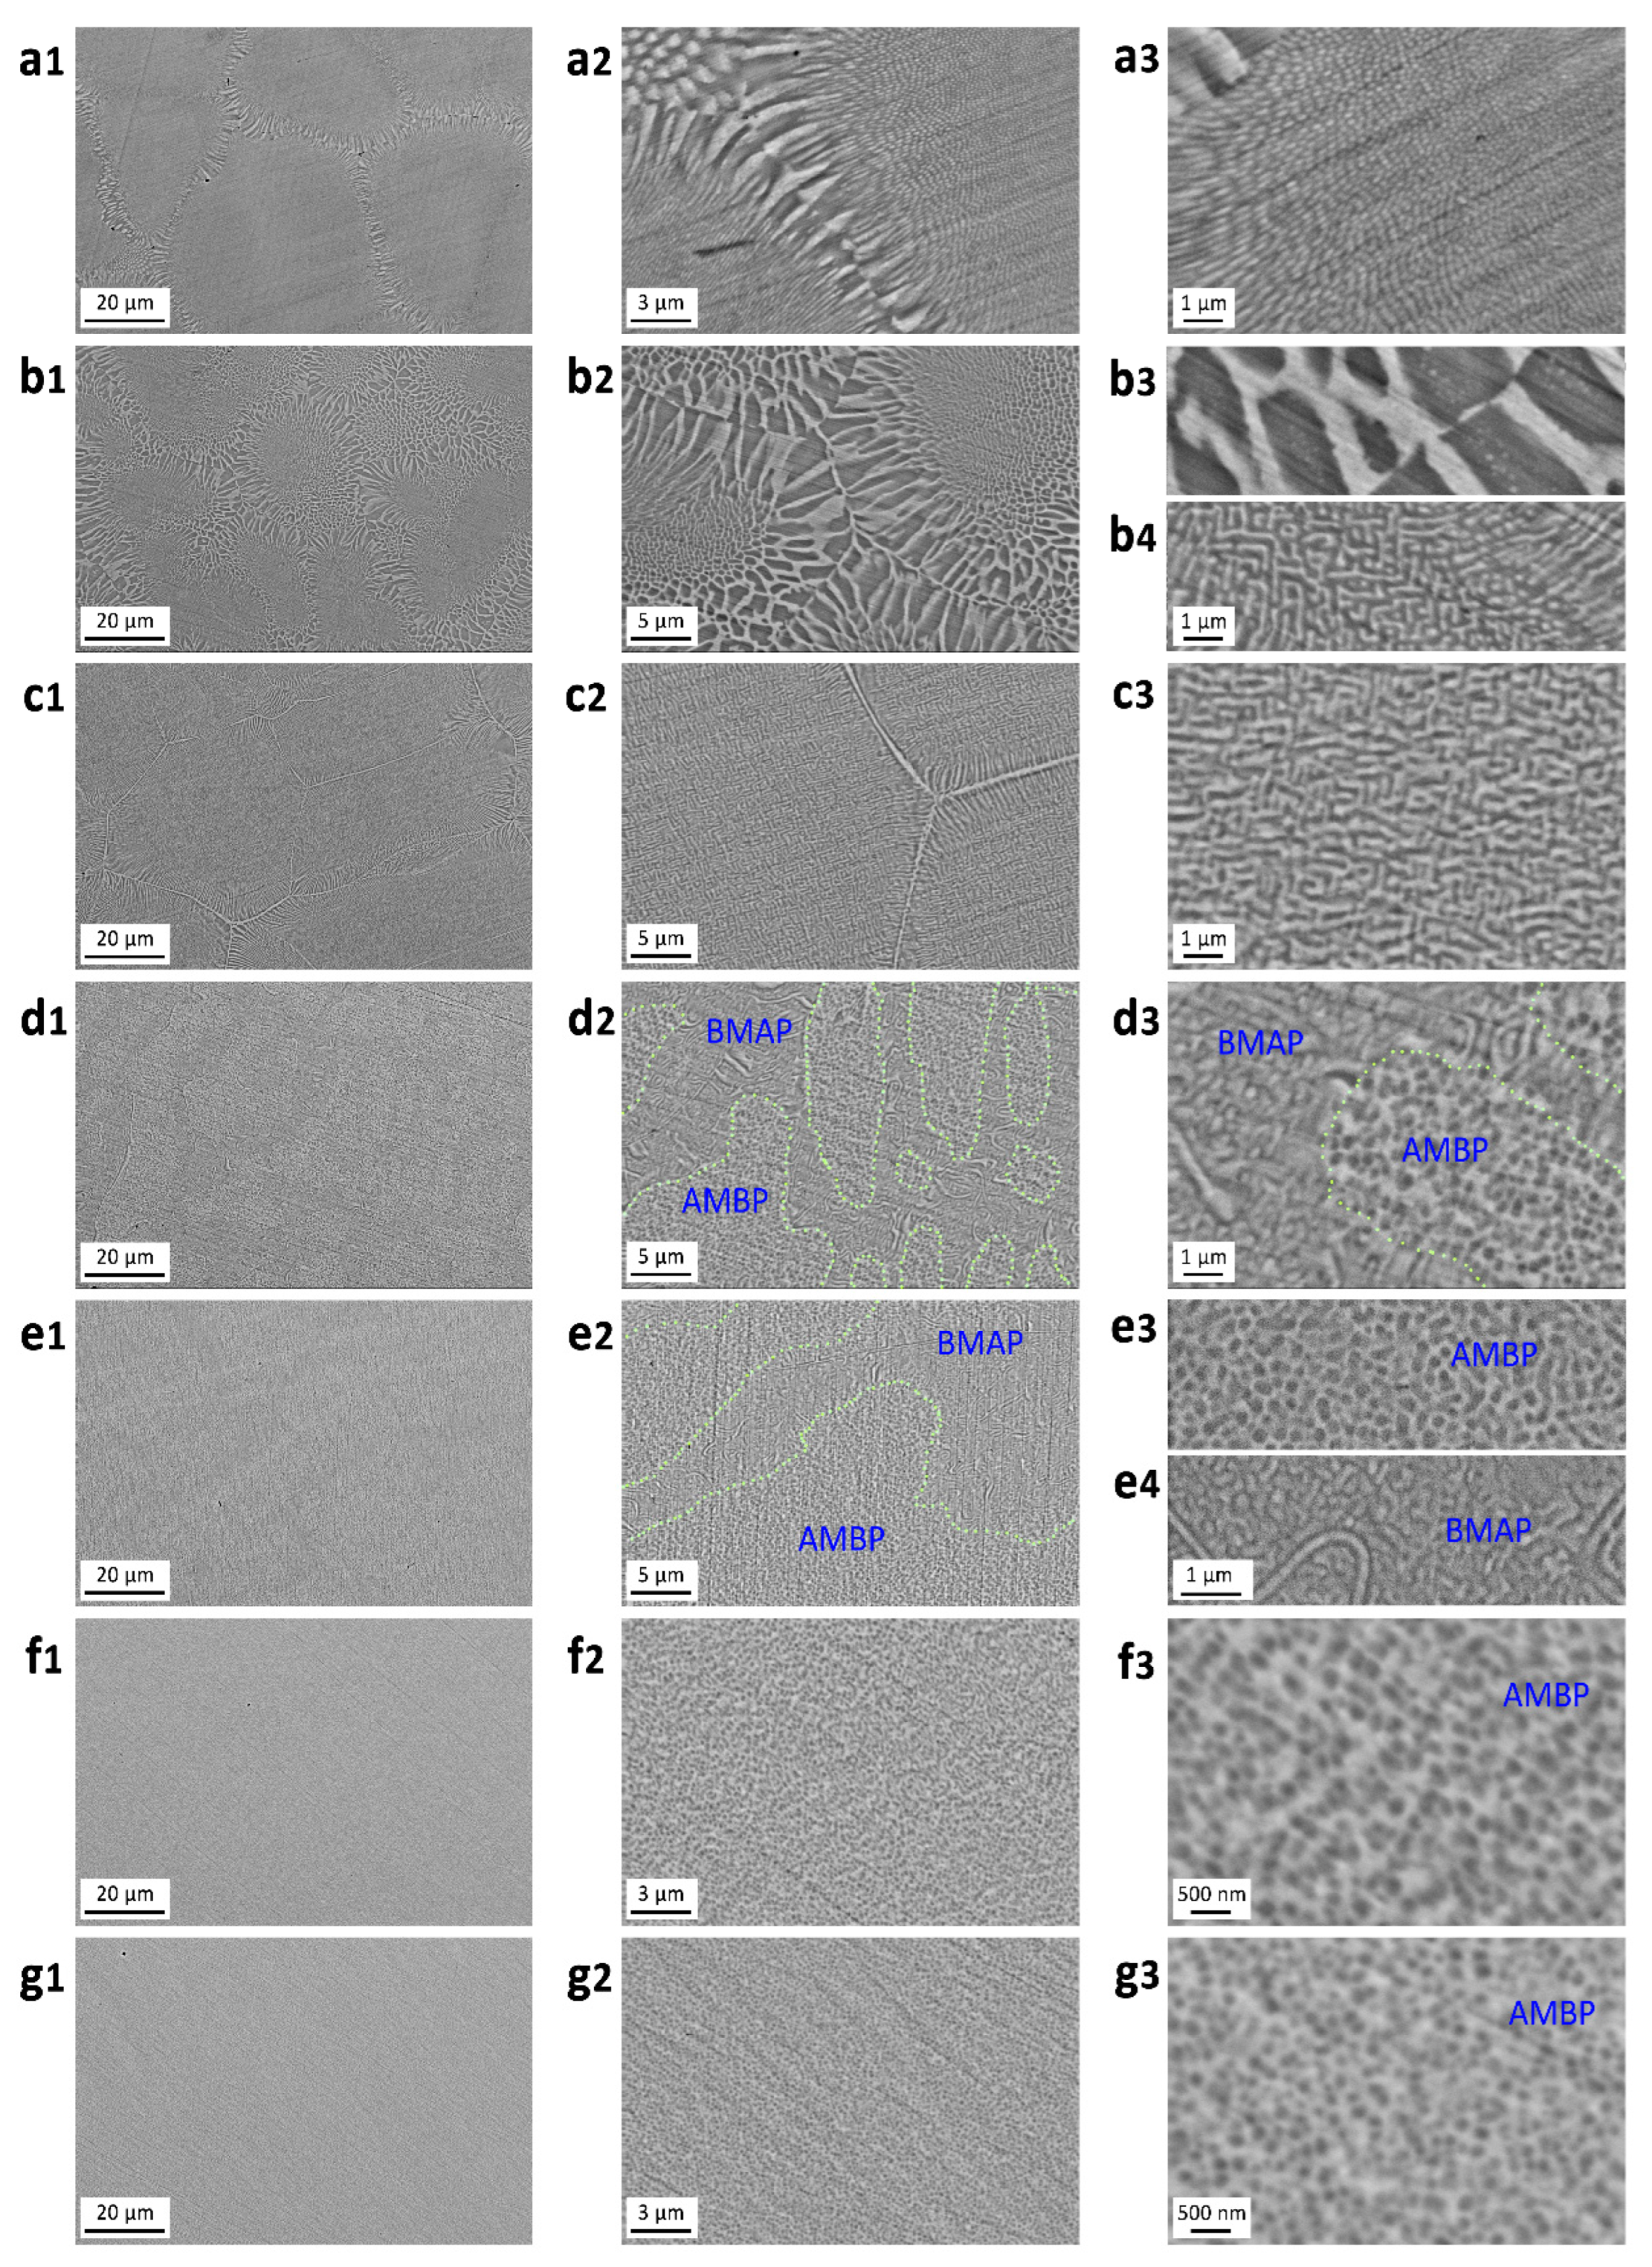
Figure 6.
Macrohardness of the AlCrFexNi alloys.
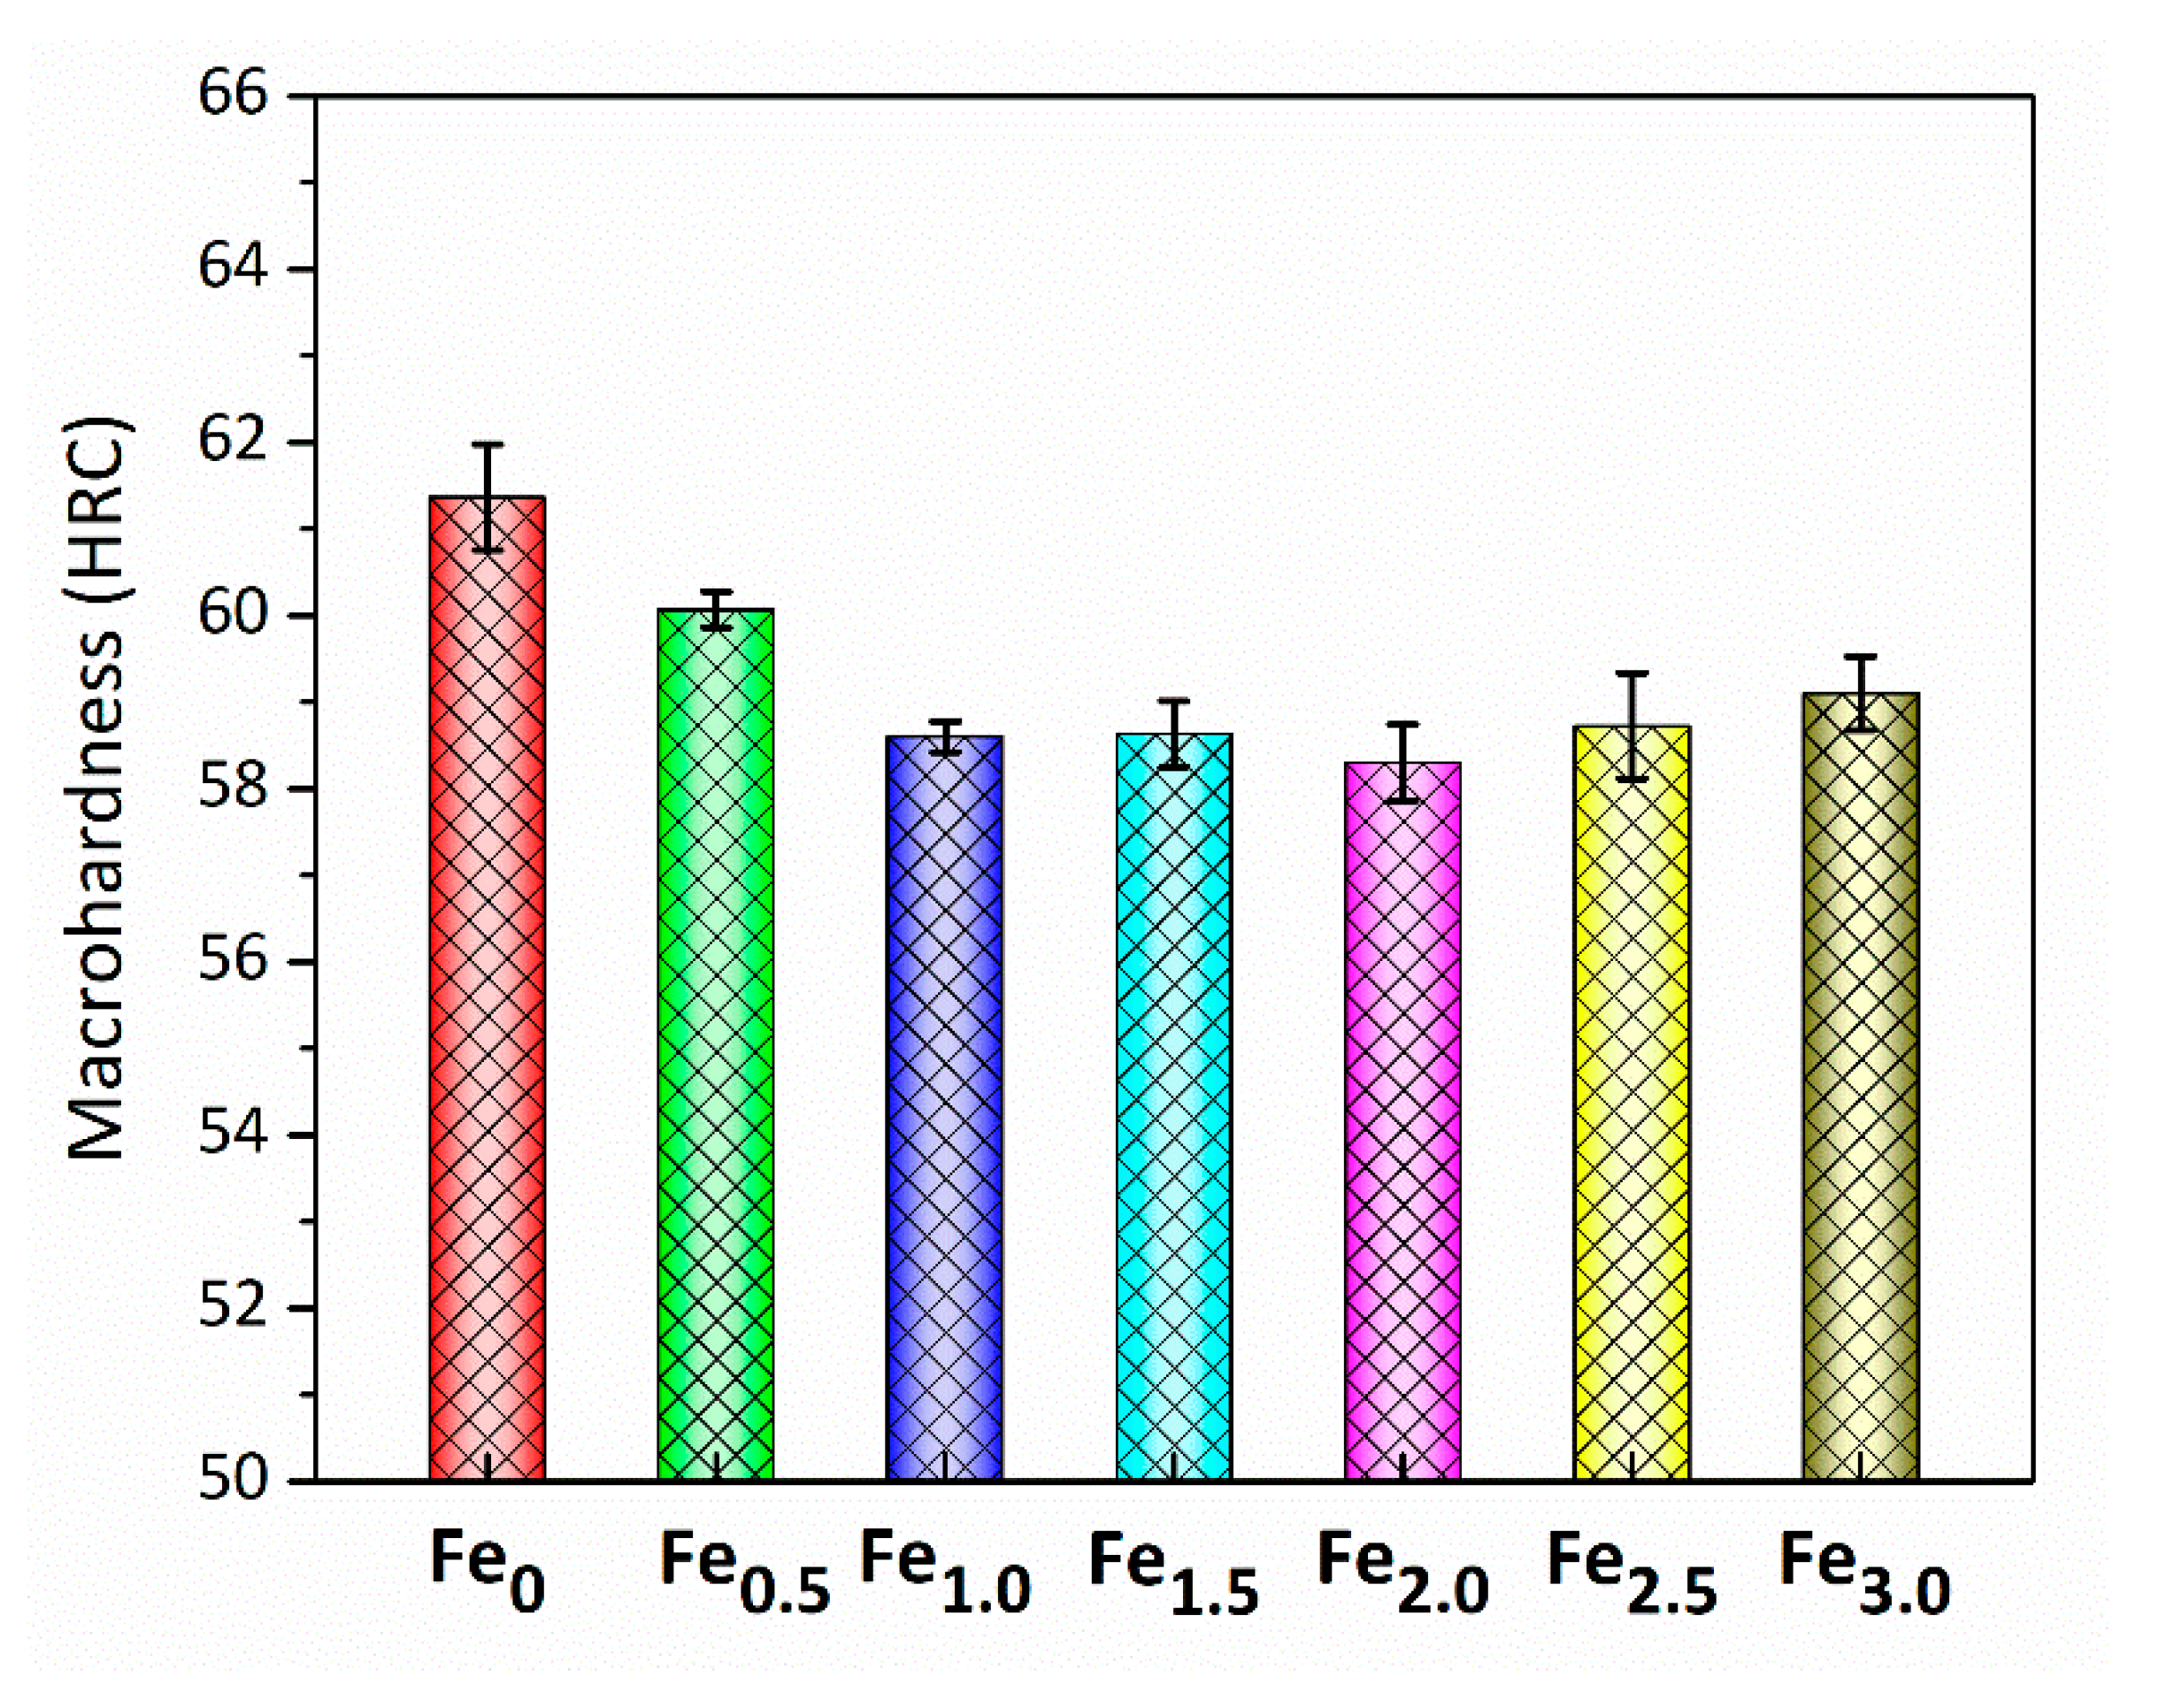
Figure 7.
Compressive properties of AlCrFexNi alloys at room temperature. (a) Engineering stress–strain curves. (b) The yield strength and fracture strain as a function of Fe content (x) in AlCrFexNi alloys.
Figure 7.
Compressive properties of AlCrFexNi alloys at room temperature. (a) Engineering stress–strain curves. (b) The yield strength and fracture strain as a function of Fe content (x) in AlCrFexNi alloys.
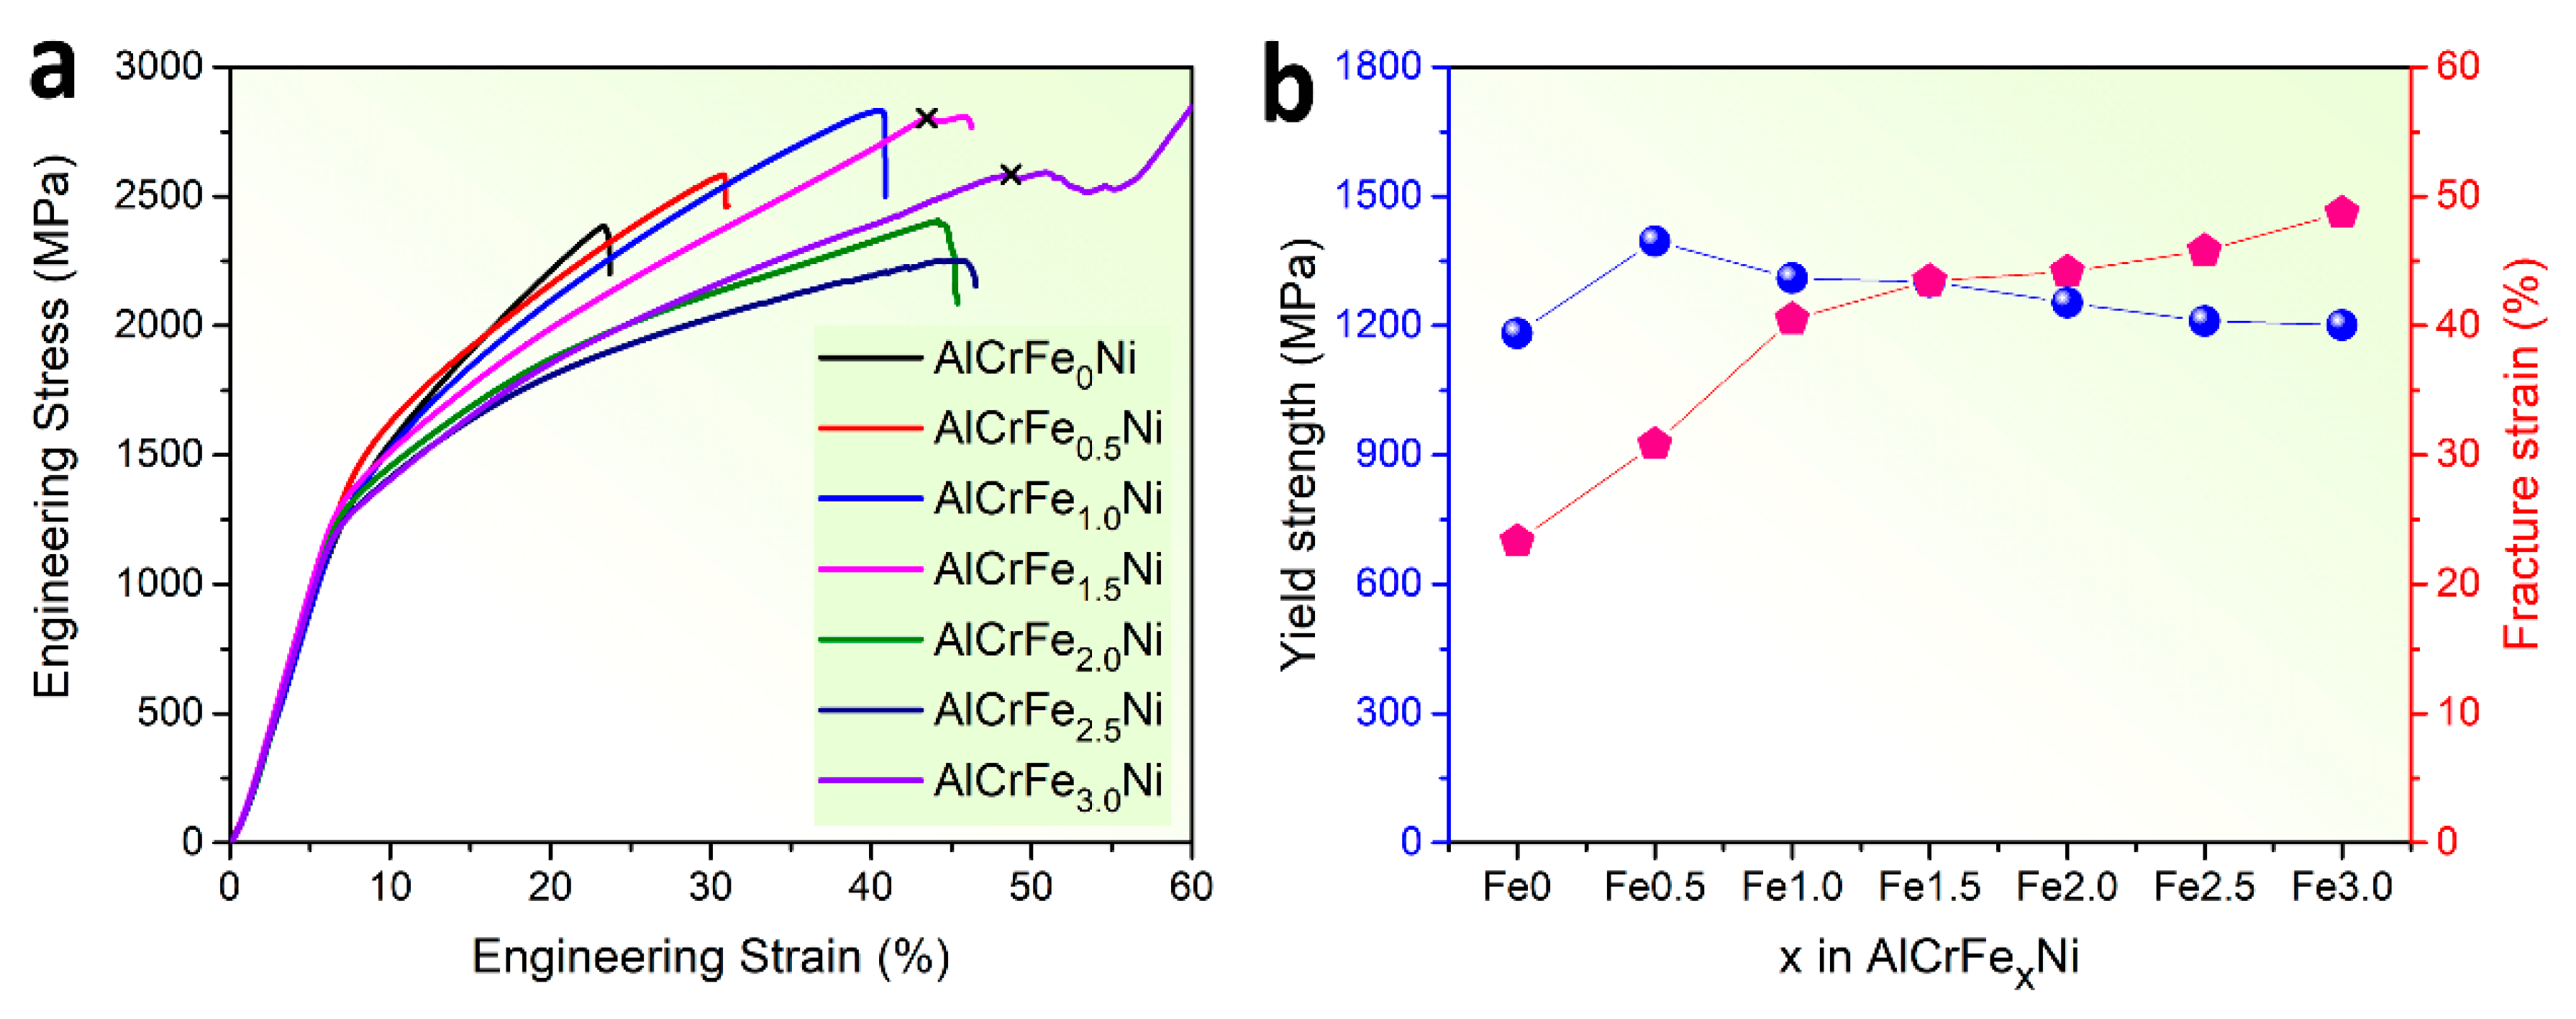
Figure 8.
Cracks propagation in AlCrFe0.5Ni alloy caused by the compressive test. (a) is the initial microstructure before compression. (b–d) display representative crack paths.
Figure 8.
Cracks propagation in AlCrFe0.5Ni alloy caused by the compressive test. (a) is the initial microstructure before compression. (b–d) display representative crack paths.
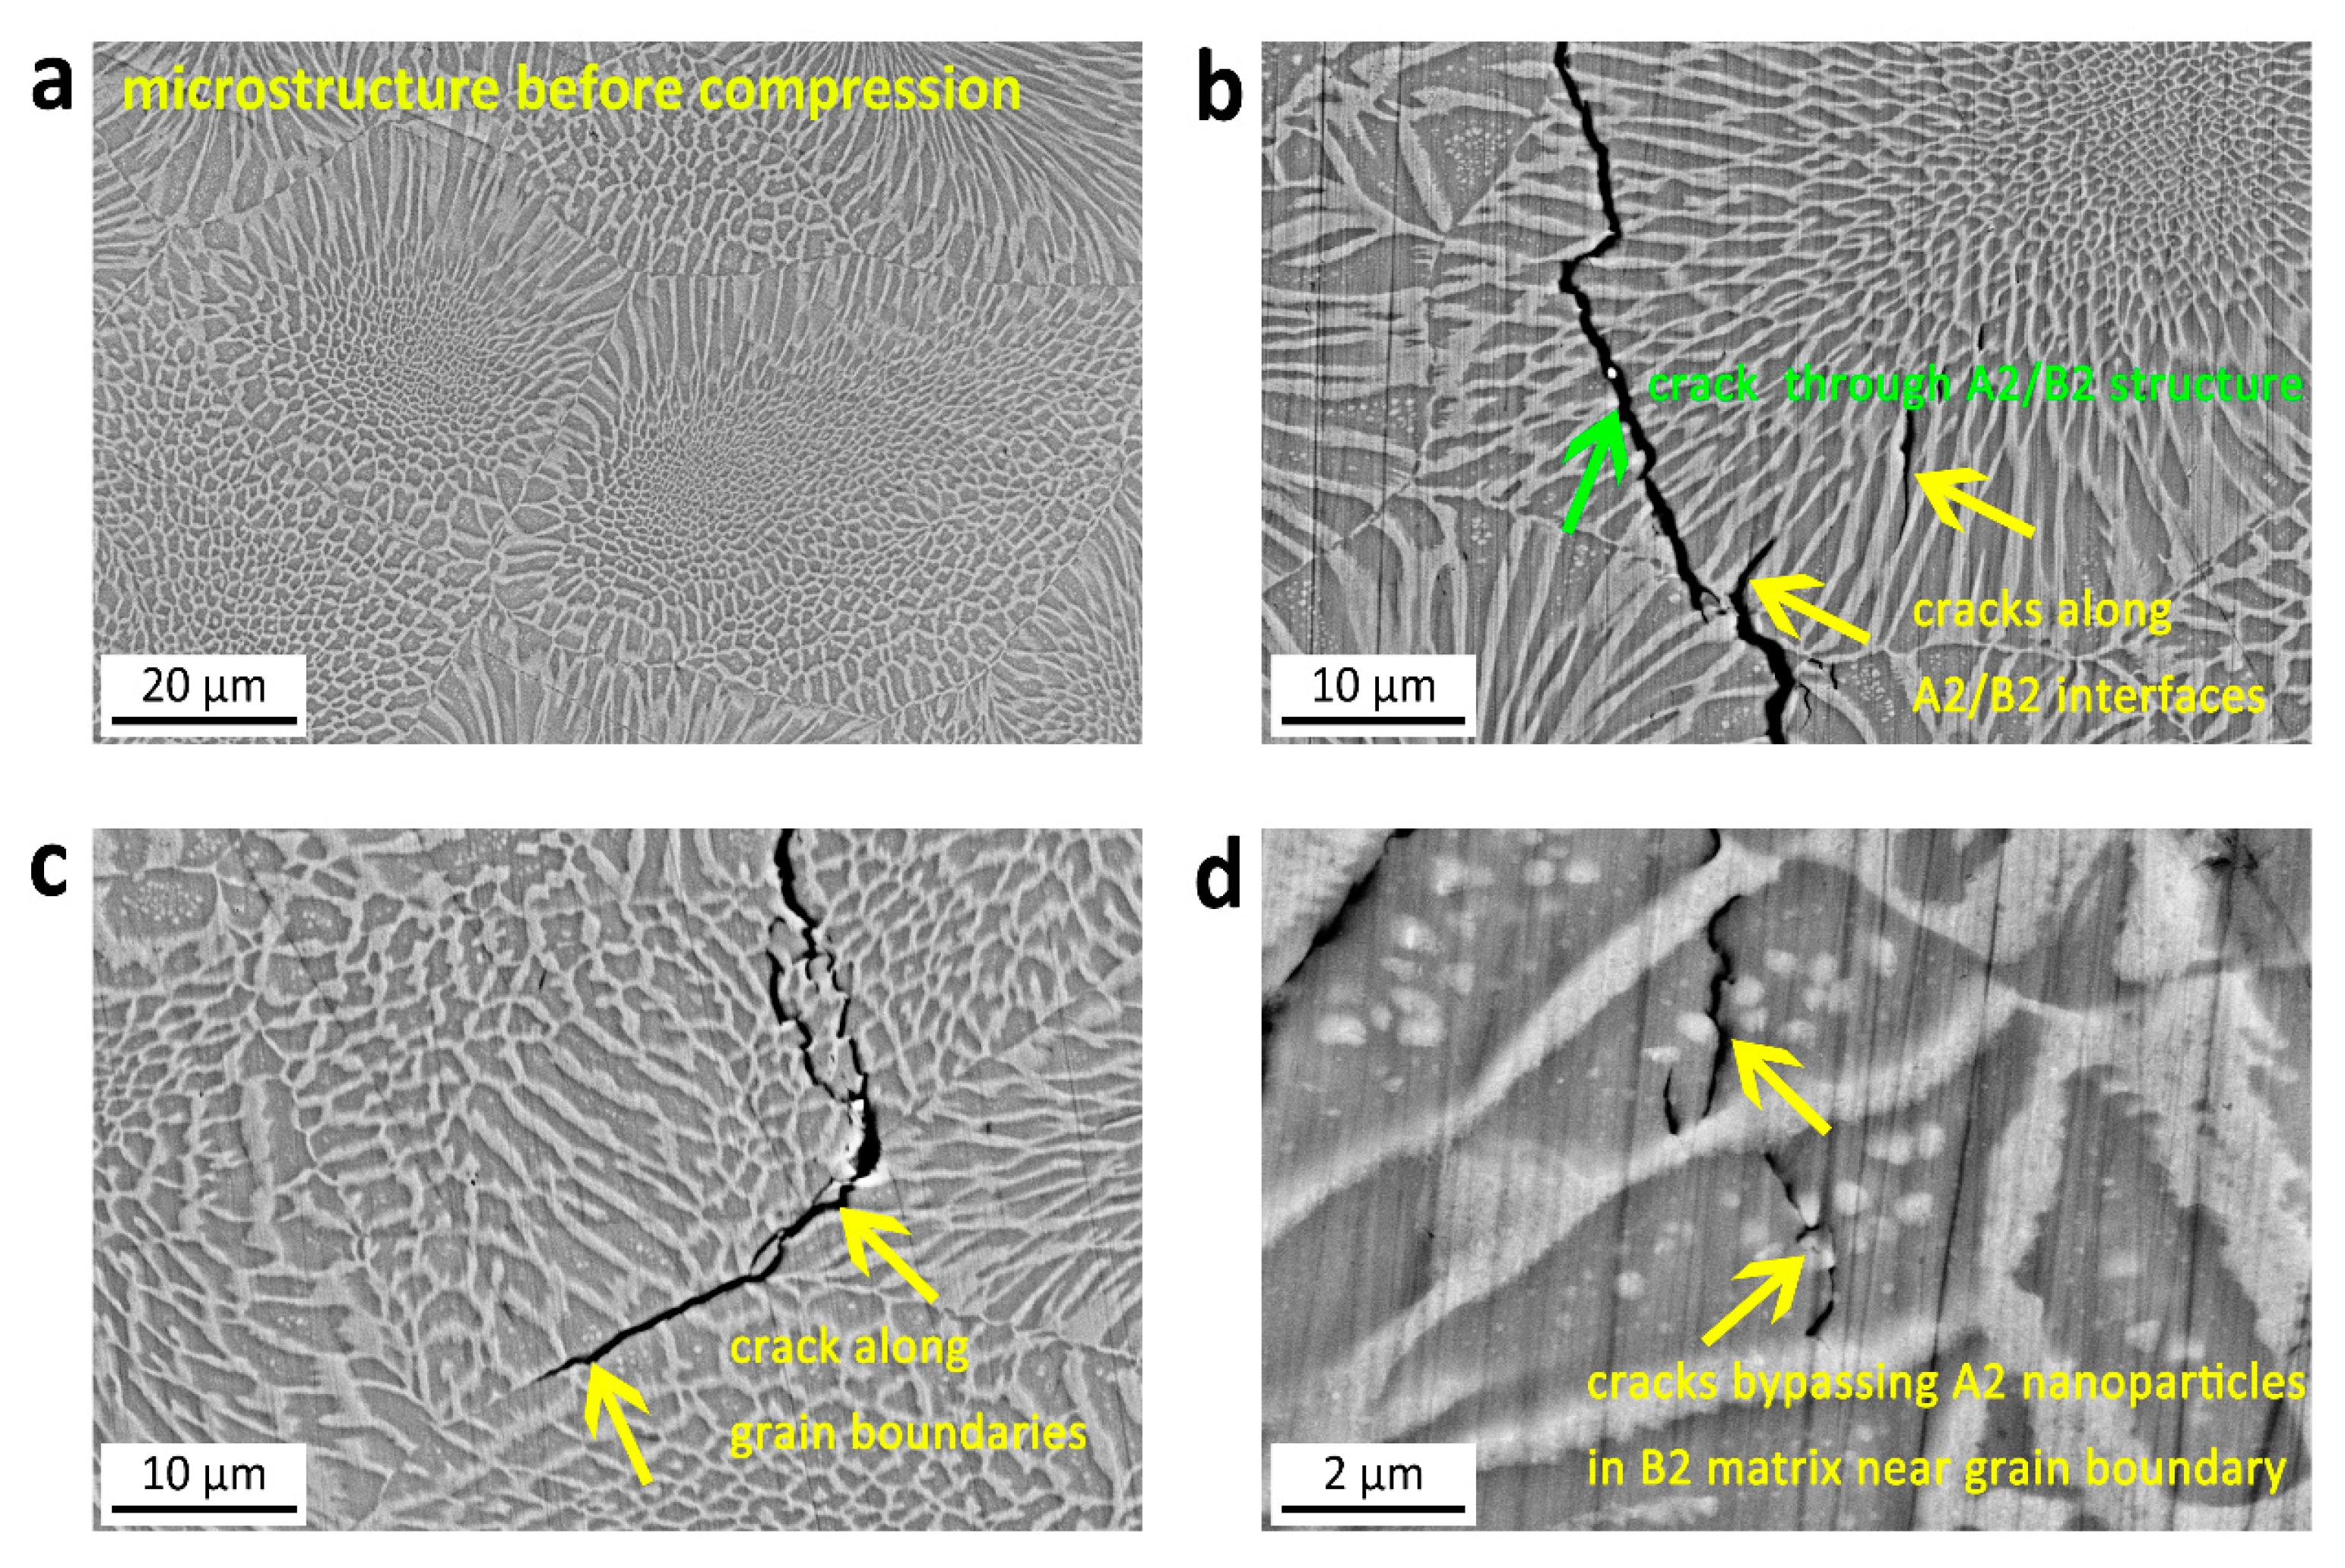
Figure 9.
Characterization of crack propagation in AlCrFe1.5Ni alloys caused by compressive tests. (a) is the initial microstructure before compression. (b–d) display representative crack paths.
Figure 9.
Characterization of crack propagation in AlCrFe1.5Ni alloys caused by compressive tests. (a) is the initial microstructure before compression. (b–d) display representative crack paths.
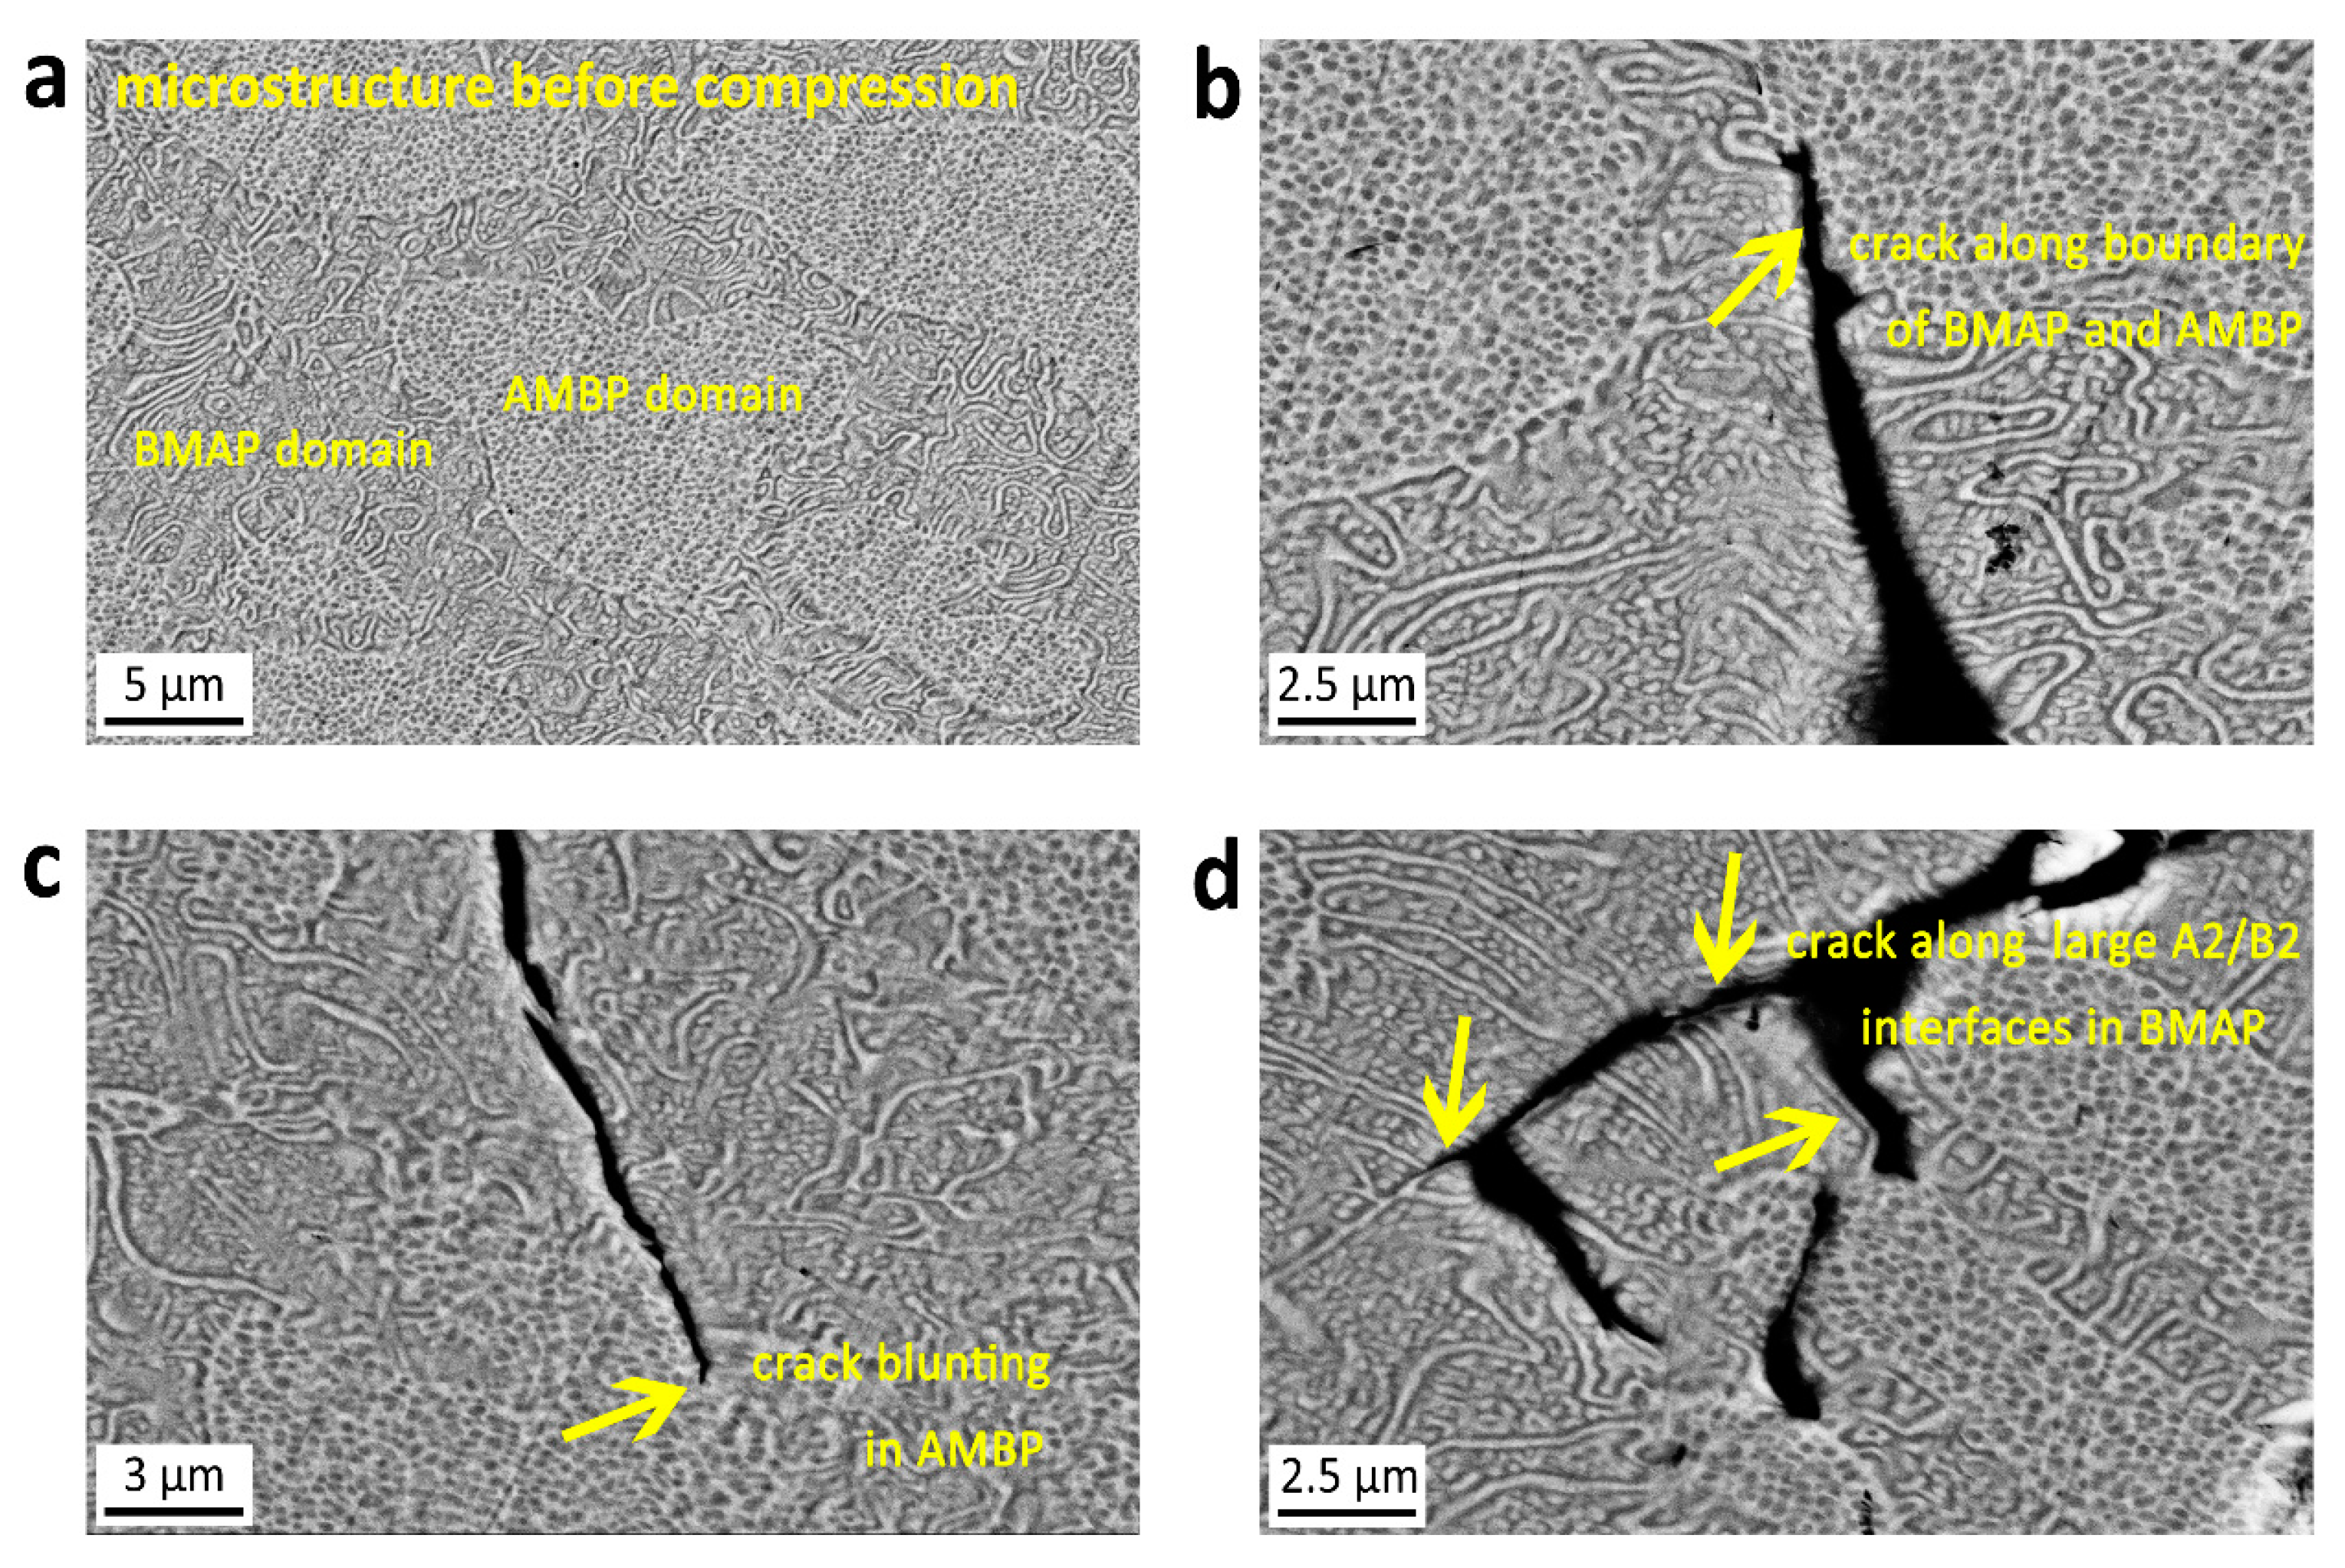
Figure 10.
Indentation tests on the two characteristic domains, AMBP and BMAP, in AlCrFe2.0Ni alloy. (a) Typical indentation marks. (b) Representative load–penetration depth curves of indentation process. (c) Corresponding micro-hardness.
Figure 10.
Indentation tests on the two characteristic domains, AMBP and BMAP, in AlCrFe2.0Ni alloy. (a) Typical indentation marks. (b) Representative load–penetration depth curves of indentation process. (c) Corresponding micro-hardness.

Figure 11.
Volume losses of AlCrFexNi alloys caused by sliding wear.

Figure 12.
Cross-sectional and three-dimensional wear track profiles of AlCrFexNi alloys. (a) shows the cross-sectional wear track profiles of alloys after wear. (b–h) in sequence show three-dimensional wear track morphologies of the alloys under study.
Figure 12.
Cross-sectional and three-dimensional wear track profiles of AlCrFexNi alloys. (a) shows the cross-sectional wear track profiles of alloys after wear. (b–h) in sequence show three-dimensional wear track morphologies of the alloys under study.
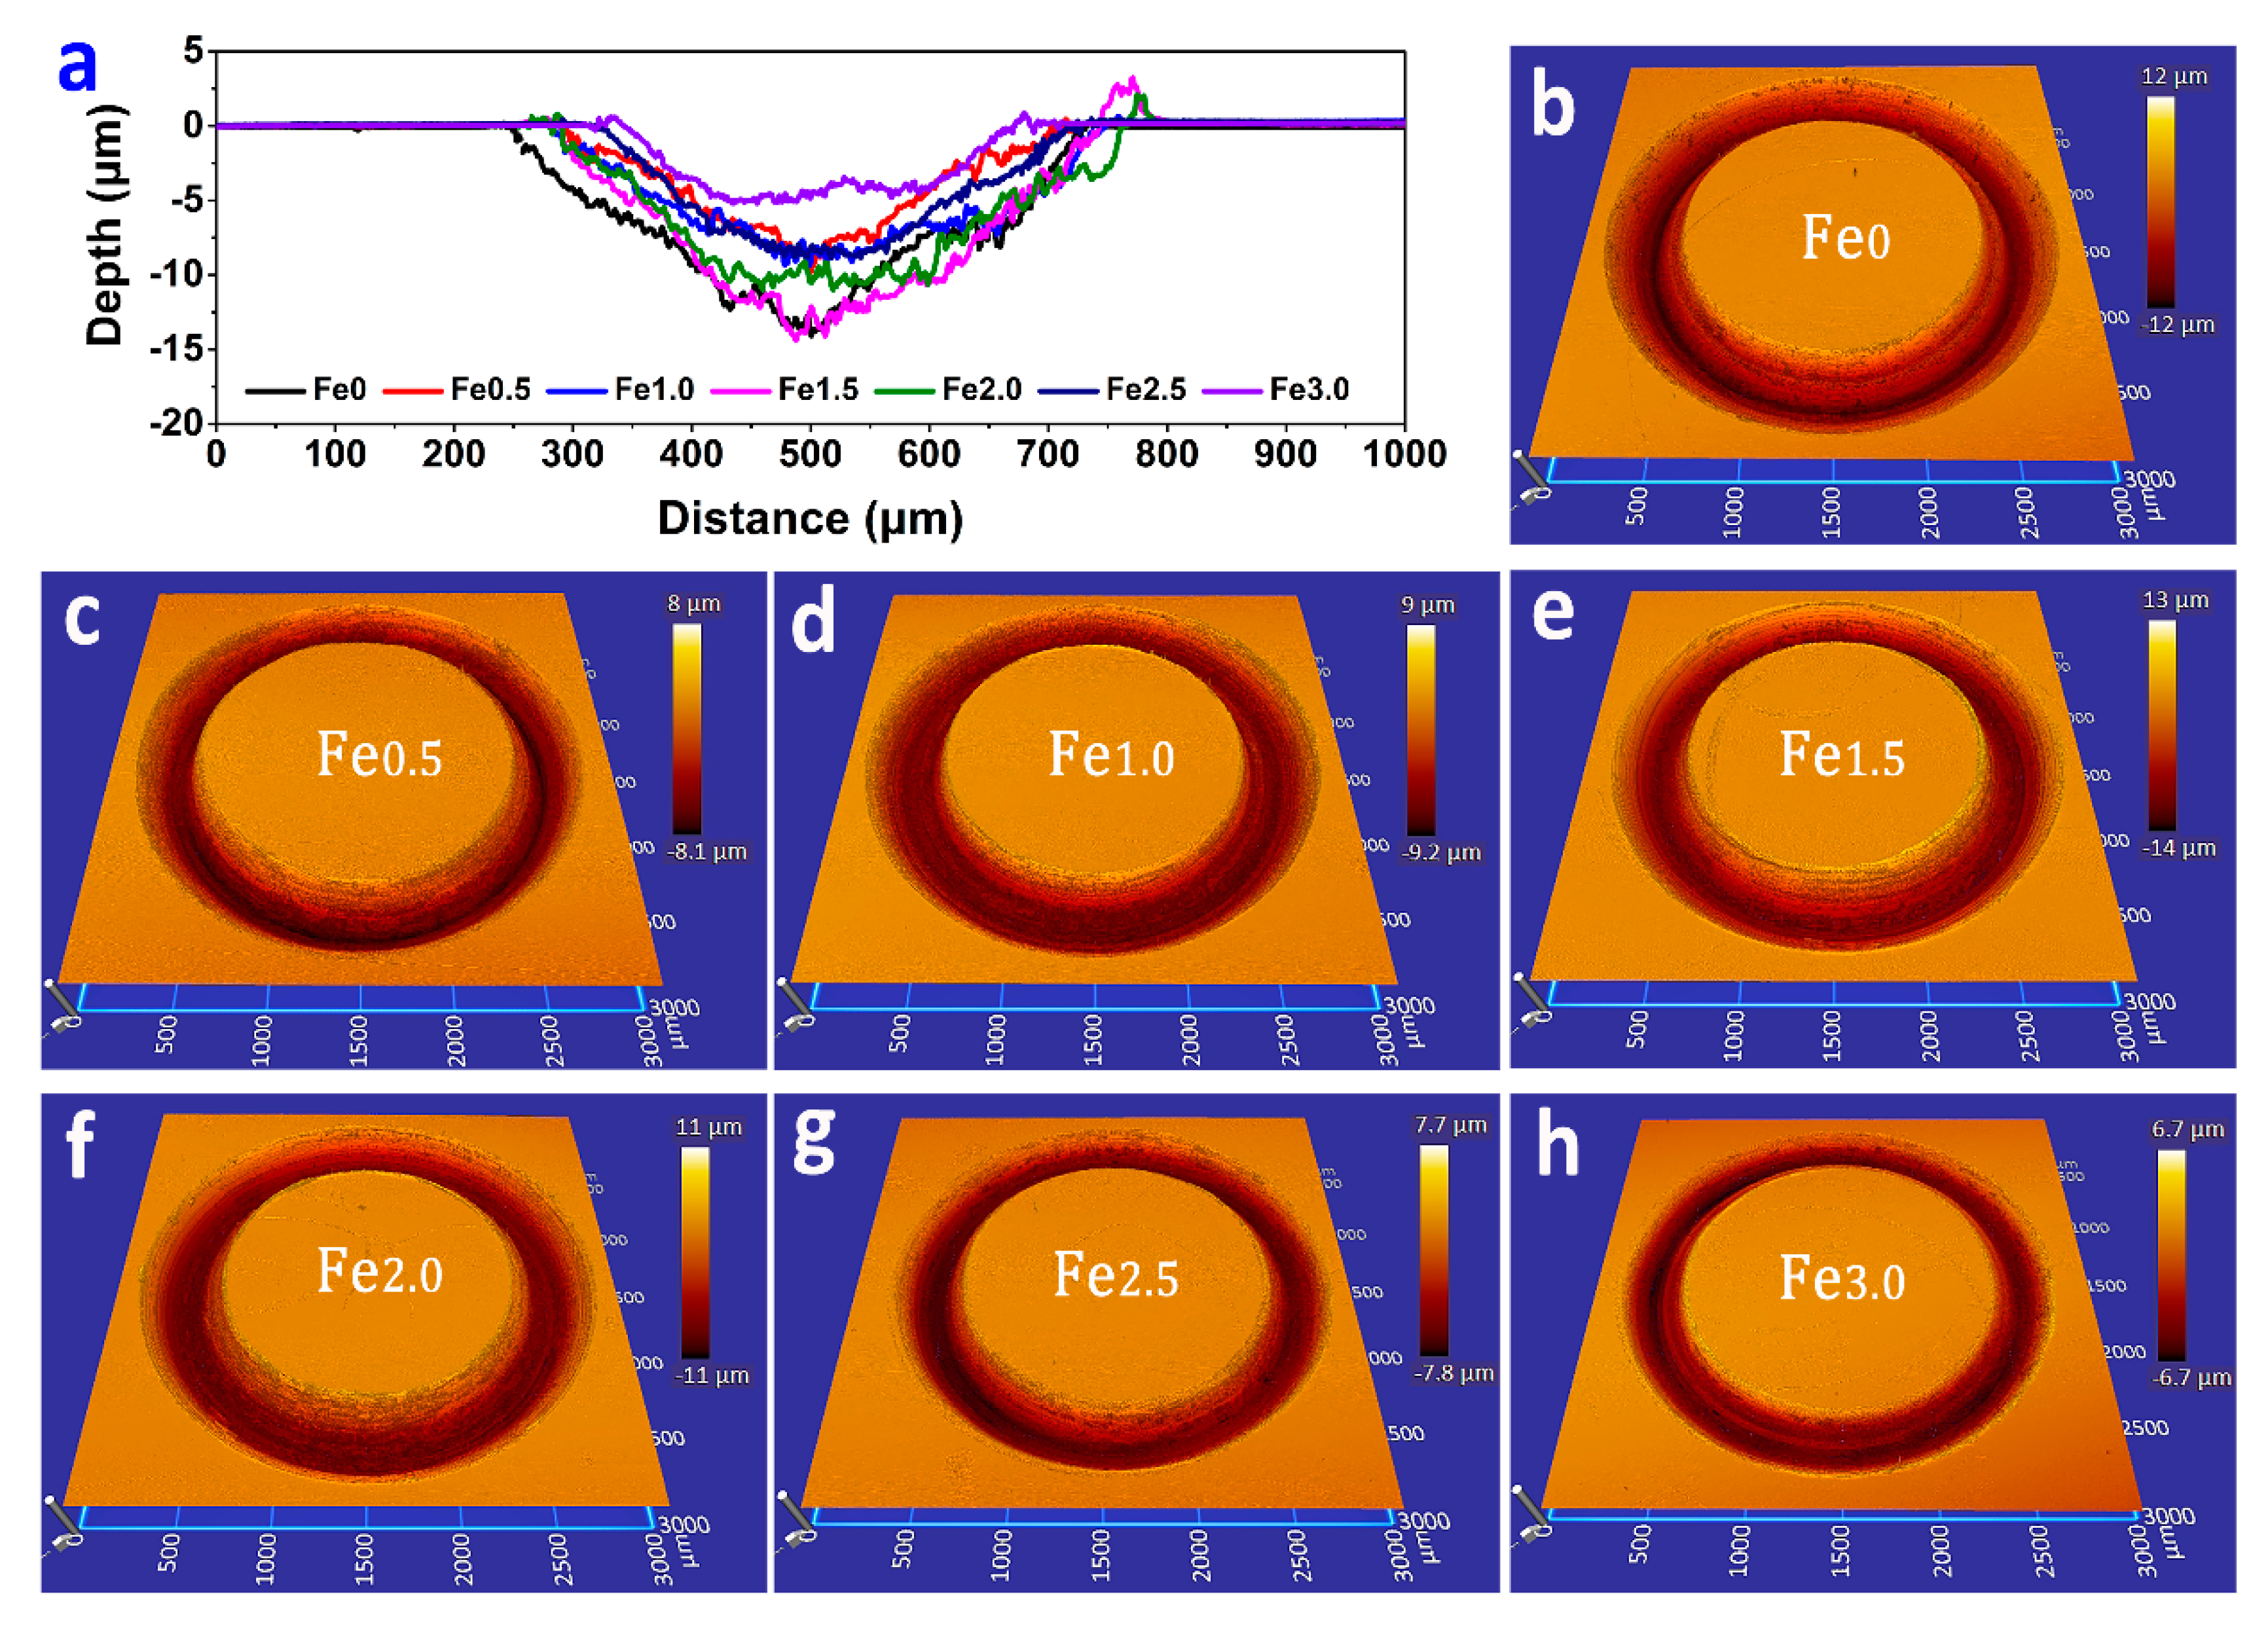
Figure 13.
Worn surface morphologies of AlCrFexNi alloys. (a) AlCrFe0Ni. (b) AlCrFe0.5Ni. (c) AlCrFe1.5Ni. (d) AlCrFe3.0Ni.
Figure 13.
Worn surface morphologies of AlCrFexNi alloys. (a) AlCrFe0Ni. (b) AlCrFe0.5Ni. (c) AlCrFe1.5Ni. (d) AlCrFe3.0Ni.

Table 1.
The nominal composition of AlCrFexNi alloys.
| Alloys | Al (at.%) | Cr (at.%) | Fe (at.%) | Ni (at.%) |
|---|---|---|---|---|
| AlCrFe0Ni | 33.33 | 33.33 | 0 | 33.34 |
| AlCrFe0.5Ni | 28.57 | 28.57 | 14.29 | 28.57 |
| AlCrFe1.0Ni | 25.00 | 25.00 | 25.00 | 25.00 |
| AlCrFe1.5Ni | 22.22 | 22.22 | 33.33 | 33.33 |
| AlCrFe2.0Ni | 20.00 | 20.00 | 40.00 | 20.00 |
| AlCrFe2.5Ni | 18.18 | 18.18 | 45.46 | 18.18 |
| AlCrFe3.0Ni | 16.66 | 16.67 | 50.00 | 16.67 |
Table 2.
Chemical compositions (at.%) of A2 and B2 phases in AlCrFe1.0Ni alloy, corresponding to domains shown in Figure 4.
Table 2.
Chemical compositions (at.%) of A2 and B2 phases in AlCrFe1.0Ni alloy, corresponding to domains shown in Figure 4.
| Phases (Contrast in SEM-BSE Image) | Crystal Structure | Al | Cr | Fe | Ni |
|---|---|---|---|---|---|
| Light phase | A2 | 7.45 | 42.42 | 43.38 | 6.75 |
| Dark phase | B2 | 39.36 | 6.11 | 13.04 | 41.49 |
Table 3.
Compressive properties of AlCrFexNi alloys at room temperature.
| Alloys | Yield Strength (MPa) | Peak Strength (MPa) | Fracture Strain (%) | Hardness/HRC | Strain Hardening Rate (MPa/%) |
|---|---|---|---|---|---|
| AlCrFe0Ni | 1182.1 | 2384.5 | 23.31 | 61.4 ± 0.6 | 54.6 |
| AlCrFe0.5Ni | 1396.1 | 2583.7 | 30.83 | 60.1 ± 0.2 | 38.5 |
| AlCrFe1.0Ni | 1309.8 | 2832.7 | 40.51 | 58.6 ± 0.2 | 37.6 |
| AlCrFe1.5Ni | 1301.2 | 2802.2 | 43.46 | 58.6 ± 0.4 | 34.5 |
| AlCrFe2.0Ni | 1253.4 | 2405.6 | 44.16 | 58.3 ± 0.4 | 26.1 |
| AlCrFe2.5Ni | 1210.6 | 2250.7 | 45.79 | 58.7 ± 0.6 | 22.7 |
| AlCrFe3.0Ni | 1201.3 | 2585.1 | 48.71 | 59.1 ± 0.4 | 24.2 |
Disclaimer/Publisher’s Note: The statements, opinions and data contained in all publications are solely those of the individual author(s) and contributor(s) and not of MDPI and/or the editor(s). MDPI and/or the editor(s) disclaim responsibility for any injury to people or property resulting from any ideas, methods, instructions or products referred to in the content. |
© 2023 by the authors. Licensee MDPI, Basel, Switzerland. This article is an open access article distributed under the terms and conditions of the Creative Commons Attribution (CC BY) license (https://creativecommons.org/licenses/by/4.0/).
Share and Cite
MDPI and ACS Style
Diao, G.; Wu, M.; He, A.; Xu, Z.; Mousavi, S.E.; Li, D. Manipulate A2/B2 Structures in AlCrFexNi Alloys for Improved Mechanical Properties and Wear Resistance. Lubricants 2023, 11, 392. https://doi.org/10.3390/lubricants11090392
AMA Style
Diao G, Wu M, He A, Xu Z, Mousavi SE, Li D. Manipulate A2/B2 Structures in AlCrFexNi Alloys for Improved Mechanical Properties and Wear Resistance. Lubricants. 2023; 11(9):392. https://doi.org/10.3390/lubricants11090392
Chicago/Turabian StyleDiao, Guijiang, Mingyu Wu, Anqiang He, Zhen Xu, Seyed Elias Mousavi, and Dongyang Li. 2023. "Manipulate A2/B2 Structures in AlCrFexNi Alloys for Improved Mechanical Properties and Wear Resistance" Lubricants 11, no. 9: 392. https://doi.org/10.3390/lubricants11090392
Note that from the first issue of 2016, this journal uses article numbers instead of page numbers. See further details here.