Article

Numerical Analysis of Double Riveted Lap Joints

Department of Engineering, University of Ferrara, Via Saragat 1, 44122 Ferrara, Italy
Lubricants 2023, 11(9), 396; https://doi.org/10.3390/lubricants11090396
Submission received: 4 August 2023 / Revised: 28 August 2023 / Accepted: 5 September 2023 / Published: 12 September 2023
(This article belongs to the Special Issue Fretting Fatigue in Mechanical Joints)

Abstract

:
In a previous work, the fatigue behaviour of different hot riveted joints under fatigue loadings were experimentally calculated. In particular, the experimental data showed a Wöhler curve slope close to five against the slope of three proposed by Eurocode 3. However, two series of shear splice riveted joints showed, at two million cycles, a stress range very close to the value suggested by Eurocode for shear splices that use non-preloaded high-strength bolts. In order to clarify the fatigue behaviour of riveted joints at high- and medium-fatigue regimes, this paper presents a preliminary three-dimensional non-linear FE analysis of a double-riveted lap joint previously analysed experimentally. Different friction coefficients and rivet clamping stress have been taken Into account, as well as the elastoplastic behaviours of the main plate subjected to tensile loadings. The numerical analysis shows that the friction force tends to reduce the range of stresses at the net section during fatigue loadings, and the force distribution or the stress concentration on the rivets is always critical for the external rivet, which is also the case regarding the non-linear behaviour of the material.

1. Introduction

The fatigue behaviour of riveted components is a matter of interest for steel bridges built in recent decades [1,2,3]. The work of DiBattista et al. [4] compared the fatigue behaviour of many riveted joints with representative international standards [5,6,7,8]. They emphasised the fact that new riveted steel structures have not been constructed in North America for several decades, so their fatigue life behaviour has received less attention than structures with fastening elements like bolts and welds. On the other hand, they also emphasised that the behaviour of riveted components remains a matter of considerable economic importance to owners and regulatory authorities. It is obvious, in fact, that the life of the large stock of riveted bridges that still exist must be extended, while maintaining a satisfactory level of safety [9,10,11,12,13].
In a previous paper [14], three series of steel riveted joints were experimentally analysed in order to obtain the fatigue behaviour of new riveted connections. In particular, two curves refer to symmetric double-riveted joints (splice joints), and the third curve refers to a partially joined connection, where the main plates are joined together by means of two L-shaped angles. For symmetric double joints, the slope of the Wöhler curve k was around 5.0, against the k = 3.0 value of Eurocode 3. This is probably mainly due to the prevailing incidence of the fatigue crack initiation phase with respect to the fatigue crack propagation phase. In all experimental tests, failure always occurs in the main plate at the external rivet, and the crack path agrees with the net section of the plate subjected to nominal tensile loadings. In fact, this behaviour agrees with the experimental evidence underlined by DiBattista et al. [4] that most fatigue failures are related to the connected material and not to the rivet itself. Thus, the designer must consider the size of the hole relative to the main plate width, the technological details of the forming of the hole, and the clamping force provided by the rivets.
Recently, de Jesus et al. [15] and Maljaars et al. [16] presented a model based on a two-stage fatigue strength prediction for hot riveted double-covered butt joints. For crack initiation, they used the concept of low-cycle fatigue, such as the Basquin–Coffin–Manson strain–life curve with mean stress correction according to Morrow, and for following the crack growth phase, they considered the classic linear elastic fracture mechanics [17,18,19]. The Wöhler curve is predicted numerically and takes into account the clamping stresses and friction. However, more generally, the fatigue behaviour of the joints could be evaluated by means of so-called local approaches such as the Theory of the Critical Distances [20,21], the Strain Energy Density Method [22,23,24,25], or the Implicit Gradient approach [26,27]. These approaches require the stress state and its gradient to be known in order to perform a fatigue assessment of the specimens or the components, provided that the initiation phase is predominant with respect to the fatigue crack growth phase.
In the case of an aircraft skin structure made of 2024-T3 Alclad sheets, Skorupa et al. [28] analysed experimentally and numerically a triple-row riveted lap joint. The fatigue initiation may occur in a different place: the edge of the rivet hole on the faying surface; the sheet surface below the rivet driven head; and the faying surface at a distance from the hole and bore of the hole. A major conclusion of their works was to underline that for extremely complex determinants of a frictional load transfer, their effect on the fatigue behaviour of riveted joints can only be predicted using a semi-empirical approach. In this context, the simplified model proposed in references [29,30,31] allows us to simulate the stiffness of a riveted junction in a simplified way and then predict the fatigue life.
This paper focuses on a double-cover riveted joint subjected to fatigue tensile loading that has previously undergone experimental analysis. A preliminary stress analysis was performed by means of the three-dimensional FE code in order to quantify the effect of friction, clamping stress, and nominal tensile stress on the stresses and force balance of the main plate at high- and medium-fatigue regimes.
The remainder of this paper is organised as follows: in Section 2, the geometry of previously investigated symmetric double-riveted lap joints is taken into account as well as the type of fatigue test; in Section 3, the fatigue life of the joints is discussed; and in Section 4, the numerical analysis and the related results are presented.

2. Geometry of the Riveted Joints and Fatigue Test

Figure 1 shows the geometries of the double symmetric lap joint considered in this numerical analysis (for more details, see ref. [14]). The main plate thickness was 15 mm with a width of 60 mm. The main plate and the cover were made of structural steel S355, having, according to EN 10025 [32], a minimum yield stress of 355 MPa and ultimate stress ranging from 490 to 630 MPa, respectively.
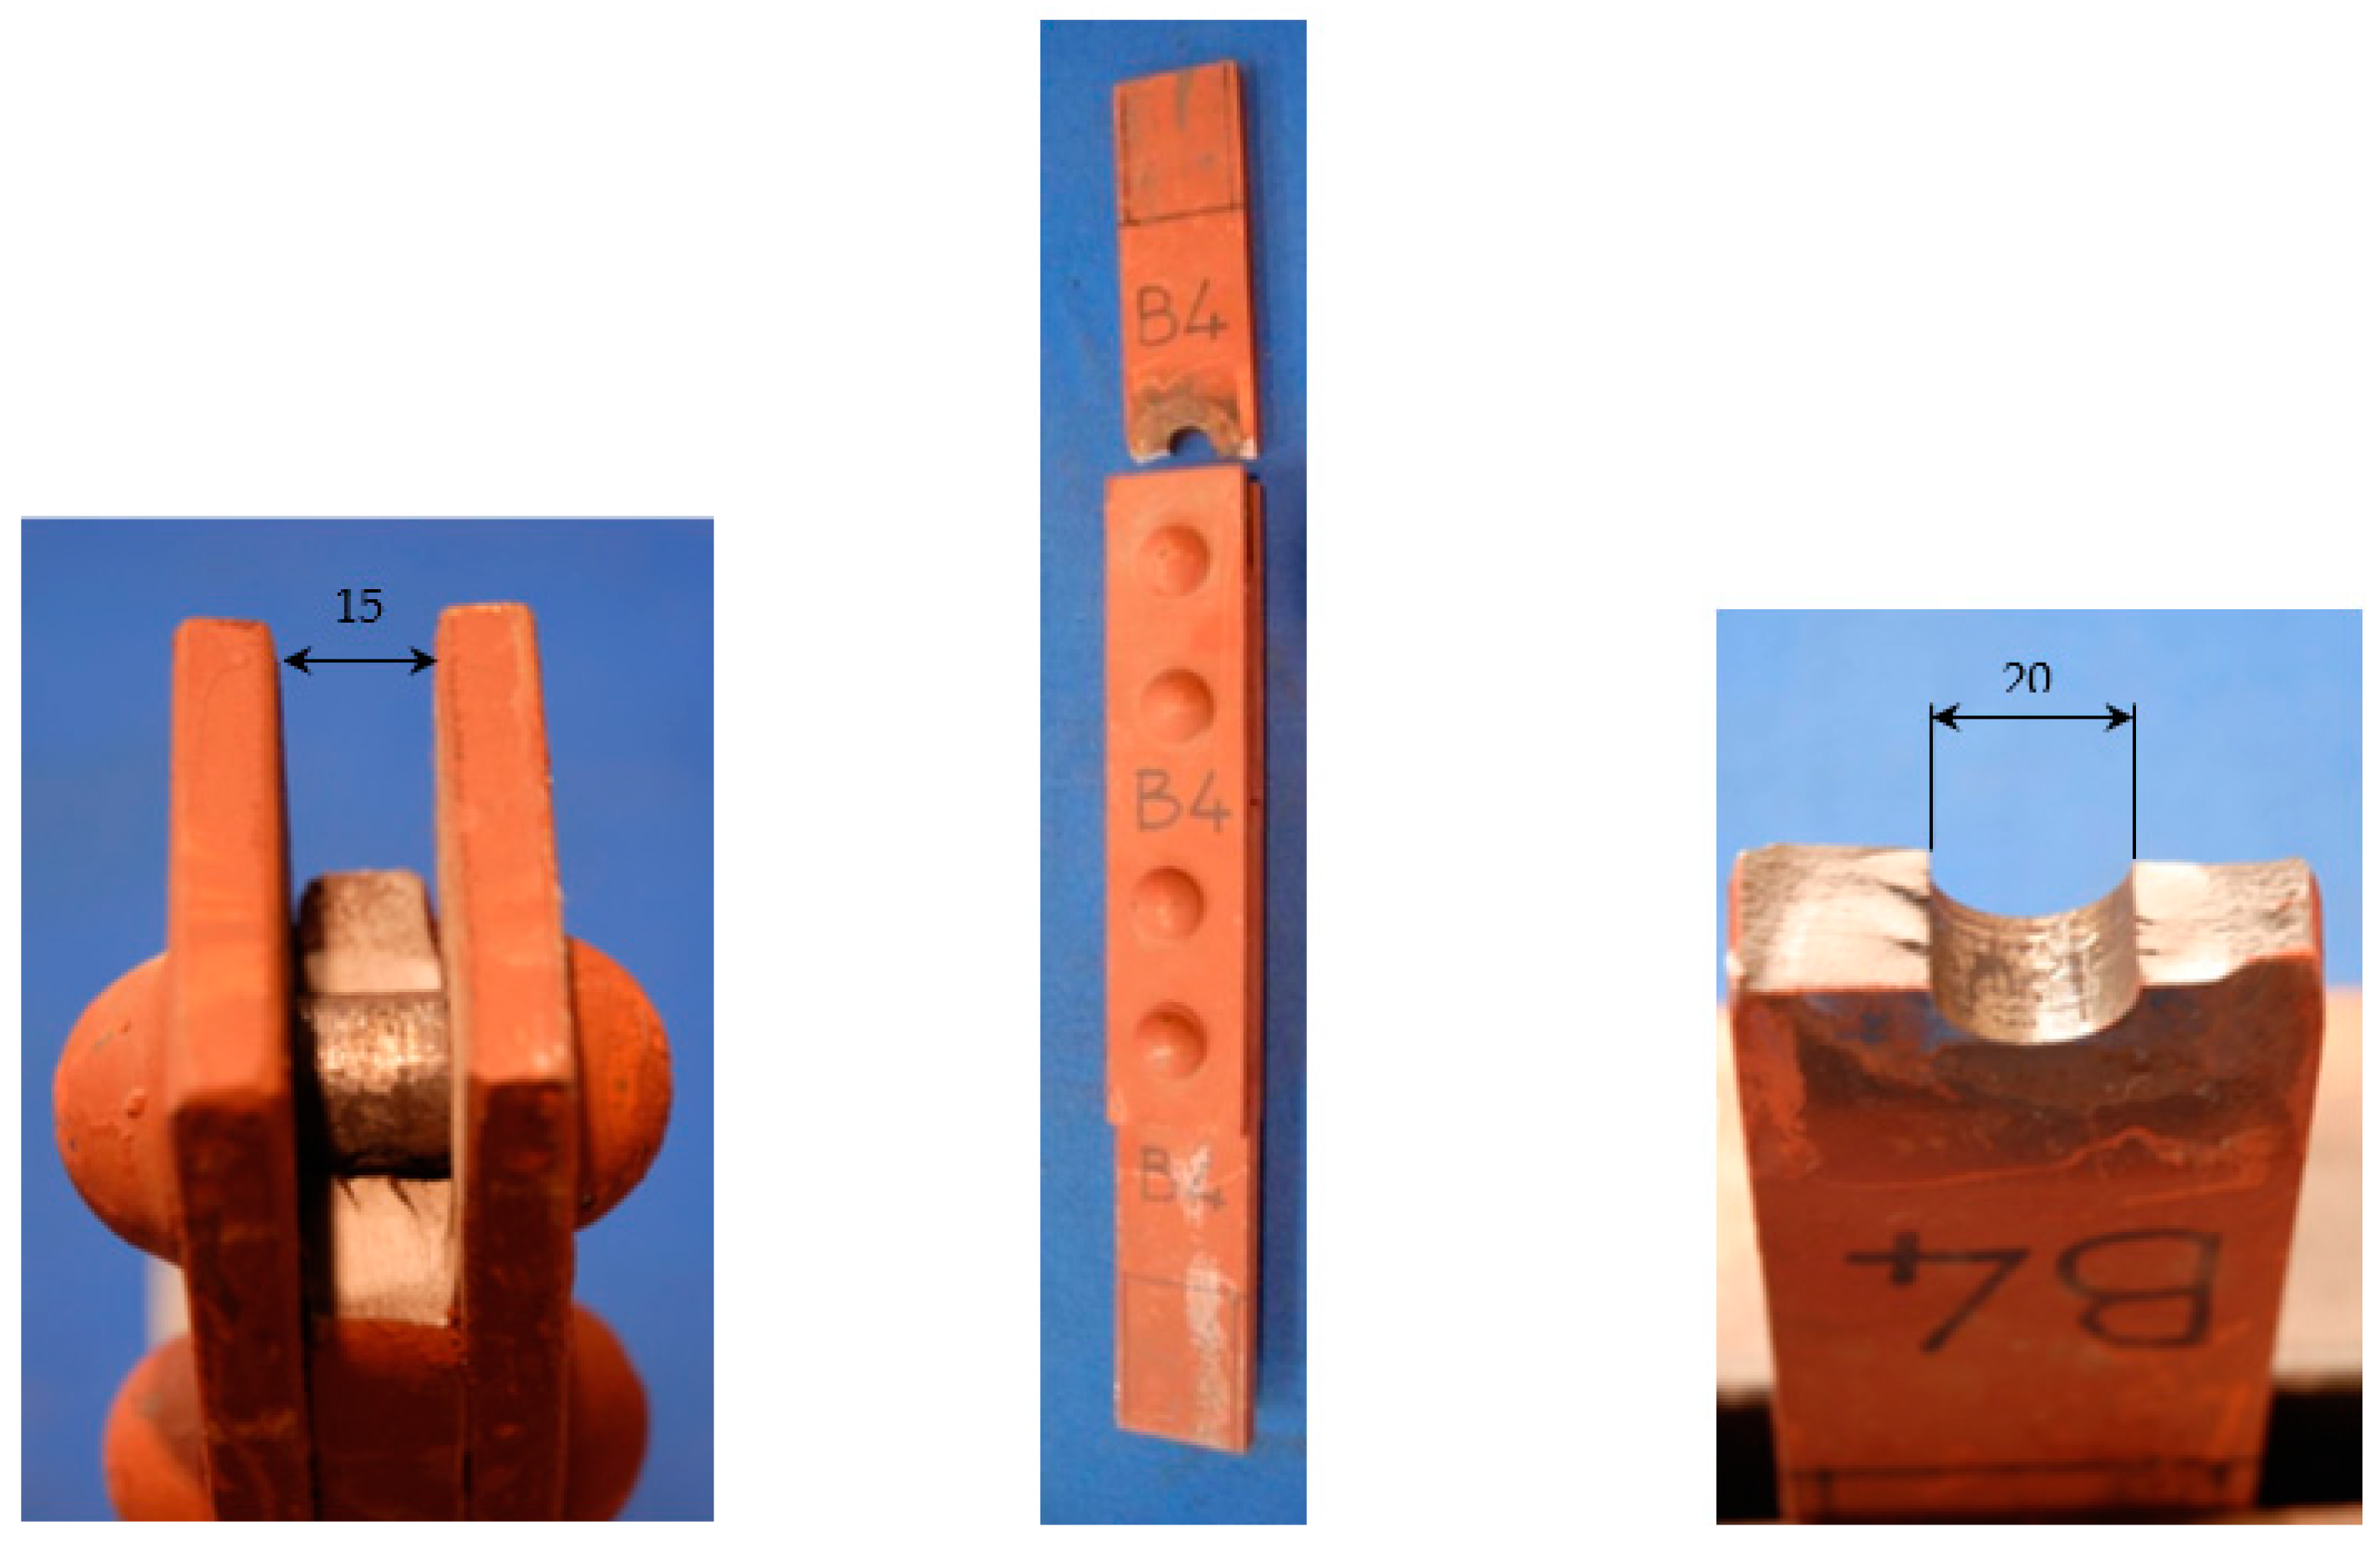
A standard procedure was used for the finishing of the surface. This consisted of the preliminary degreasing and sand blasting of the surfaces. After that, a uniform coating was applied against corrosion. Then, the holes were drilled. By imposing a sinusoidal wave shape and a nominal load ratio of R = 0, the fatigue test was performed for a nominal tensile load at a constant amplitude. The tests ended when the connected parts completely separated. Figure 2 shows the typically failure of the specimen under fatigue loading. All failures were located at the external riveted edge regardless of the load level. The crack propagates perpendicular to the longitudinal axis of the joints. During the test, the maximum and minimum displacements were registered so that the stiffness was monitored during the tests. Regarding the crack propagation phase, crack nucleation life prevailed in all instances because the stiffness was clearly variable only in the last phase of the test.

3. Fatigue Life of the Joints

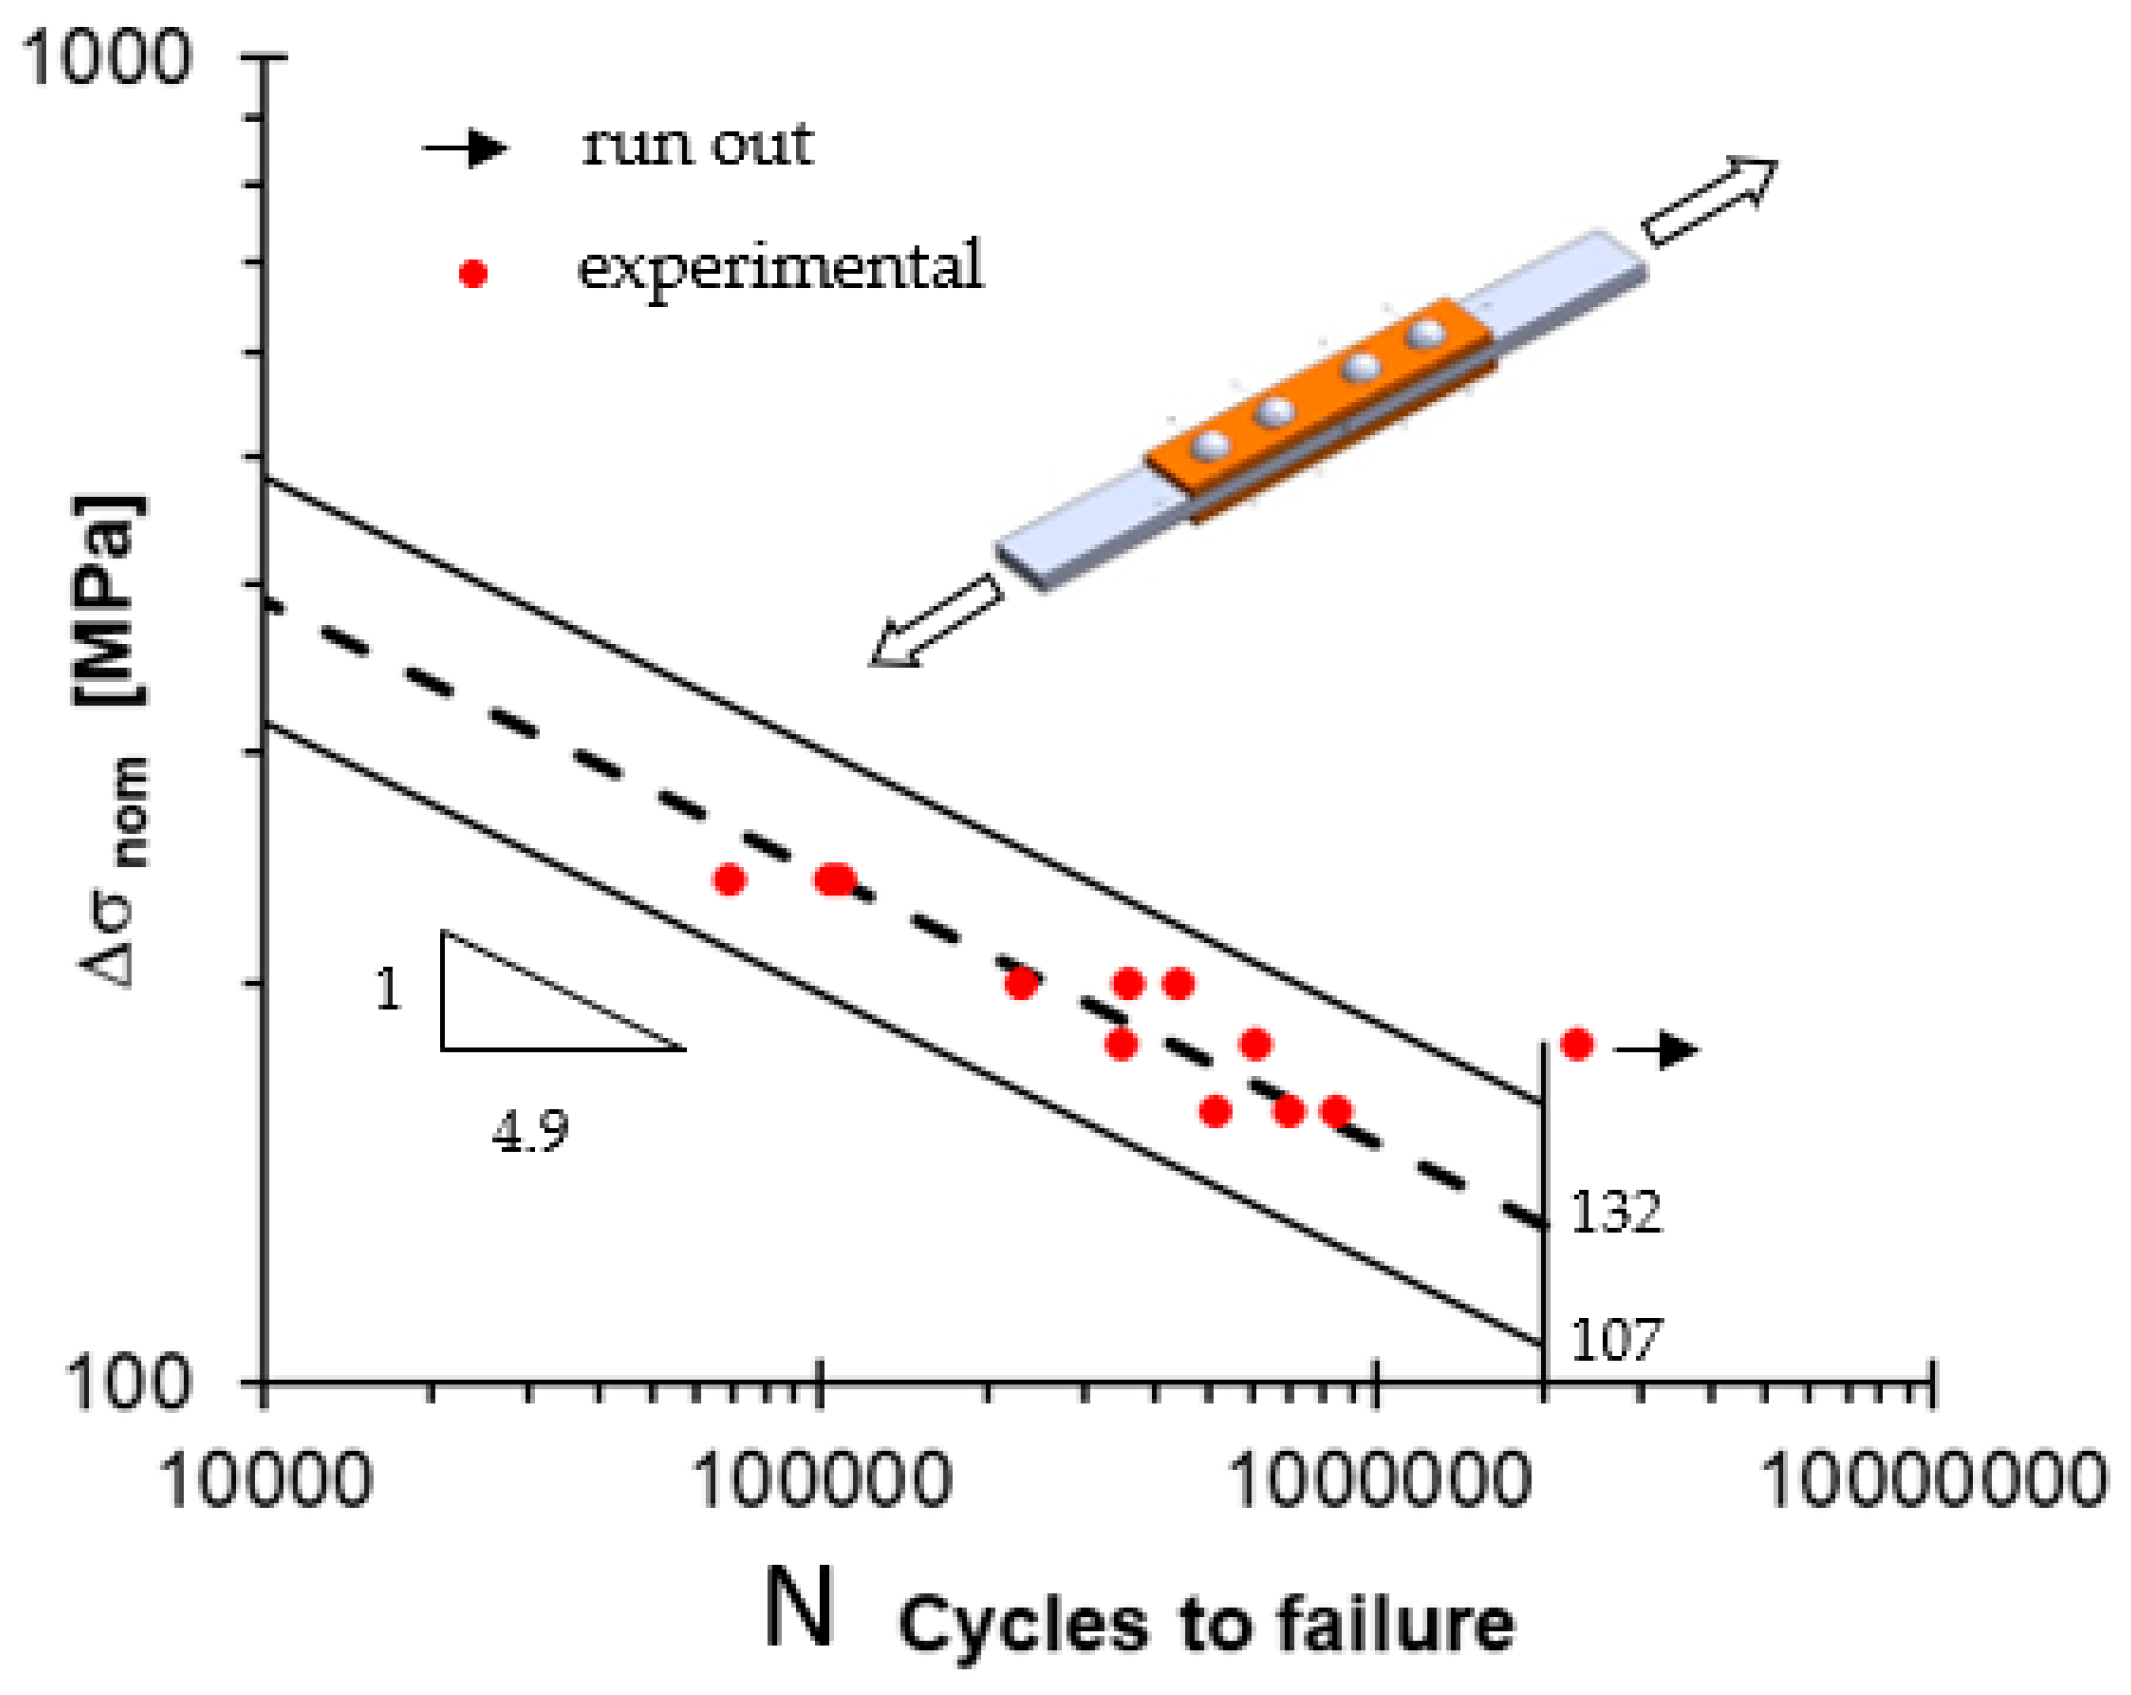
Table 1 summarises the fatigue results relating to the constant amplitude axial loading of the joints in Figure 1. The statistical analyses of the experimental data are given in terms of the stress amplitude, and Δσnom,50% (50% survival probability) and Δσnom,97.7% (97.7% survival probability) referred to the net area of the section. Slope k of the Wöhler curves and the statistical parameter Tσ are also shown. Tσ represents the ratio σnom,10% and σnom,97.7% and gives the scattering of the experimental data. The Tσ value is very close to 1.50 of the Haibach unified scatter band for steel-welded joints. Figure 3 reports the Wöhler curve of the specimens.
The fatigue strength values analysed under the hypothesis of the log-normal distribution of the number of cycles to failure are shown in Figure 3, where the fatigue strength value at 2 × 10⁶ cycles and the exponent k of the Wöhler curve are also reported.

4. Numerical Analysis

4.1. The FE Model

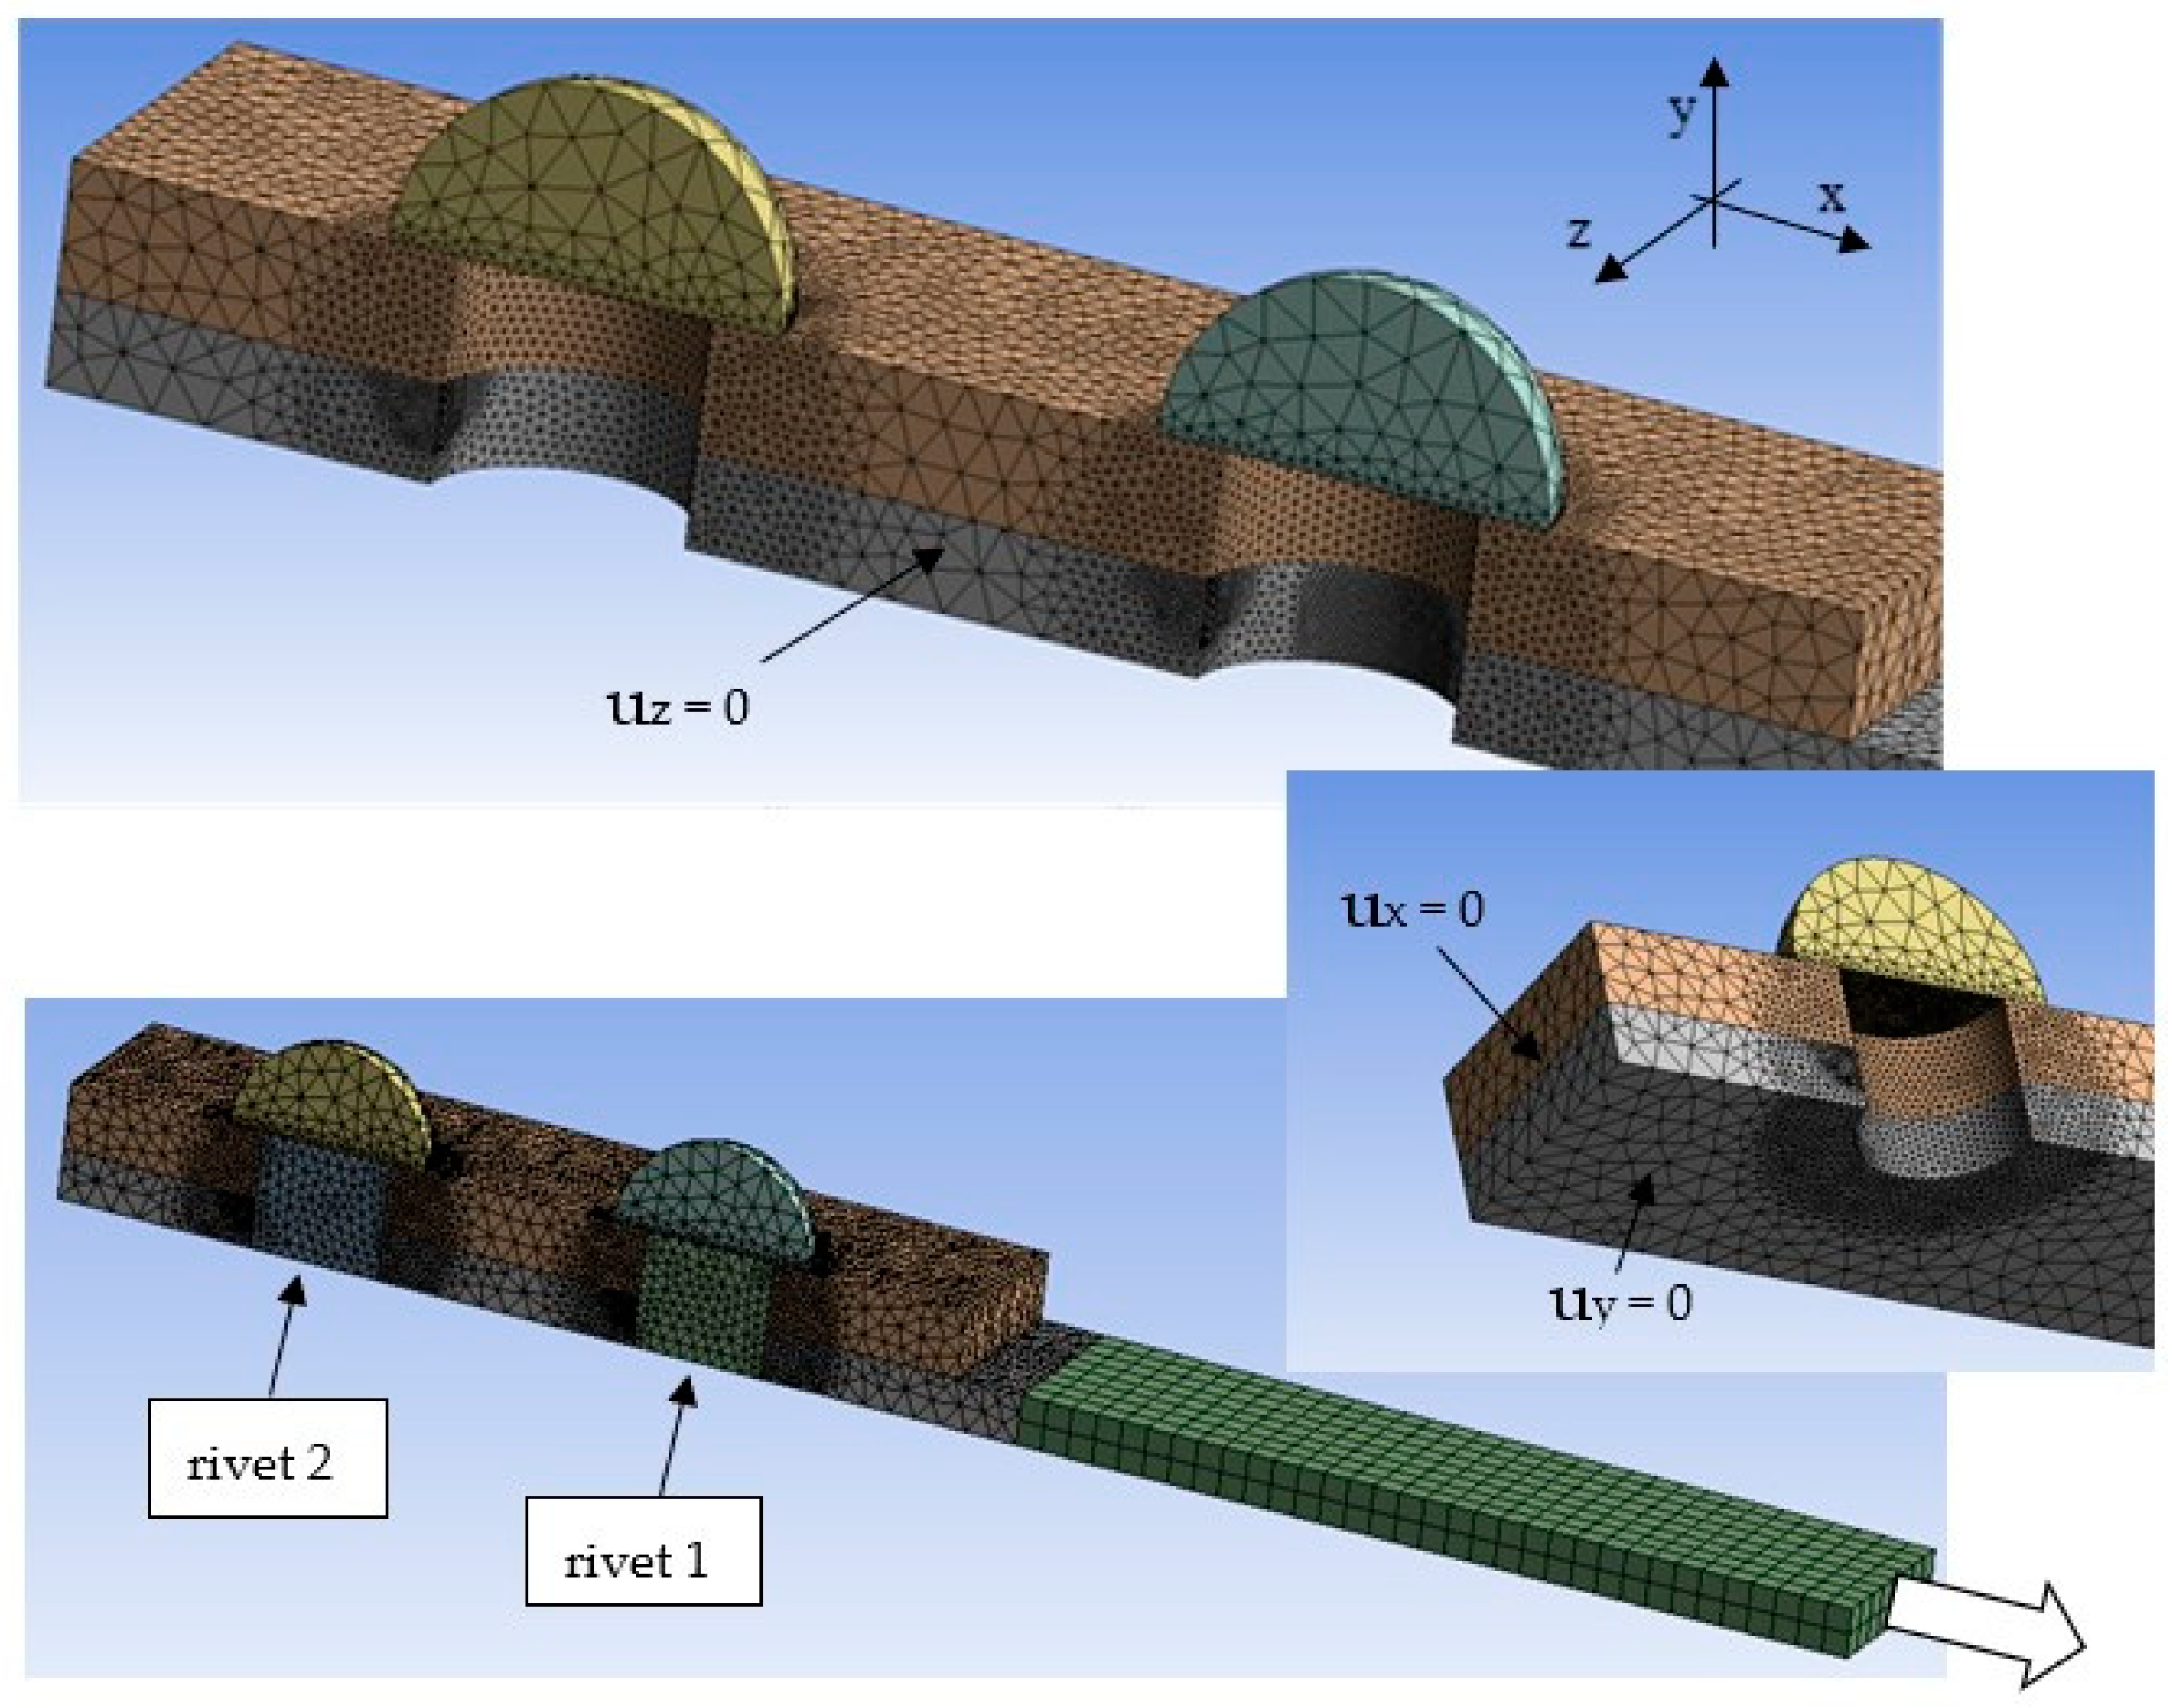
In order to understand the role of stress and force in the rivetted joint in Figure 1, an accurate three-dimensional FE analysis has been conducted. Due to the symmetry, only one eighth of the riveted joint was considered in the numerical analysis. Figure 4 shows the three-dimensional model used. The size of the element in the zone with a high stress gradient was around 0.5 millimetres. This value was assumed after a convergence analysis on the peak stresses in the net section, on the rivet forces, and on the force due to the shear stress on the contact surface between the plate and the cover. The forces and the peak stresses were substantially constant for a mesh size ranging between 0.25 and 2 mm. Contact elements were used to simulate the contact between the rivet and the plates as well as the contact between the main plate and the cover. When friction was considered in the analysis, only the contact between the heat of the rivet and the cover, including the plate-cover contact, had a friction coefficient different from zero. The clamping force was introduced by imposing a range of temperatures on the two rivets, and the temperature was adjusted to obtain a tensile stress of about 50 MPa or 100 MPa in the net sections of the plate. A thermal expansion coefficient of 1.2·10−5 °C−1 was assumed. The riveted connection is modelled with a radial gap of 0.01 mm between the rivet shank and the hole of the main plate or the cover.
The first analysis considers a linear elastic material. For this reason, the nominal stress in the gross section was considered to be 90 MPa. This value imposes a nominal stress in the net section of 135 MPa close to the fatigue strength Δσnom,50% of the joints at 2 × 10⁶ cycles. As reported in Figure 5, the time history simulates the fatigue of the first two cycles: the first loading and unloading as well as the second loading. The stress was analysed at the second loading (time 3), and the stress range was evaluated between the second loading and the following unloading.
Table 2 resumes the parameters used in the FE analysis.

4.2. Results

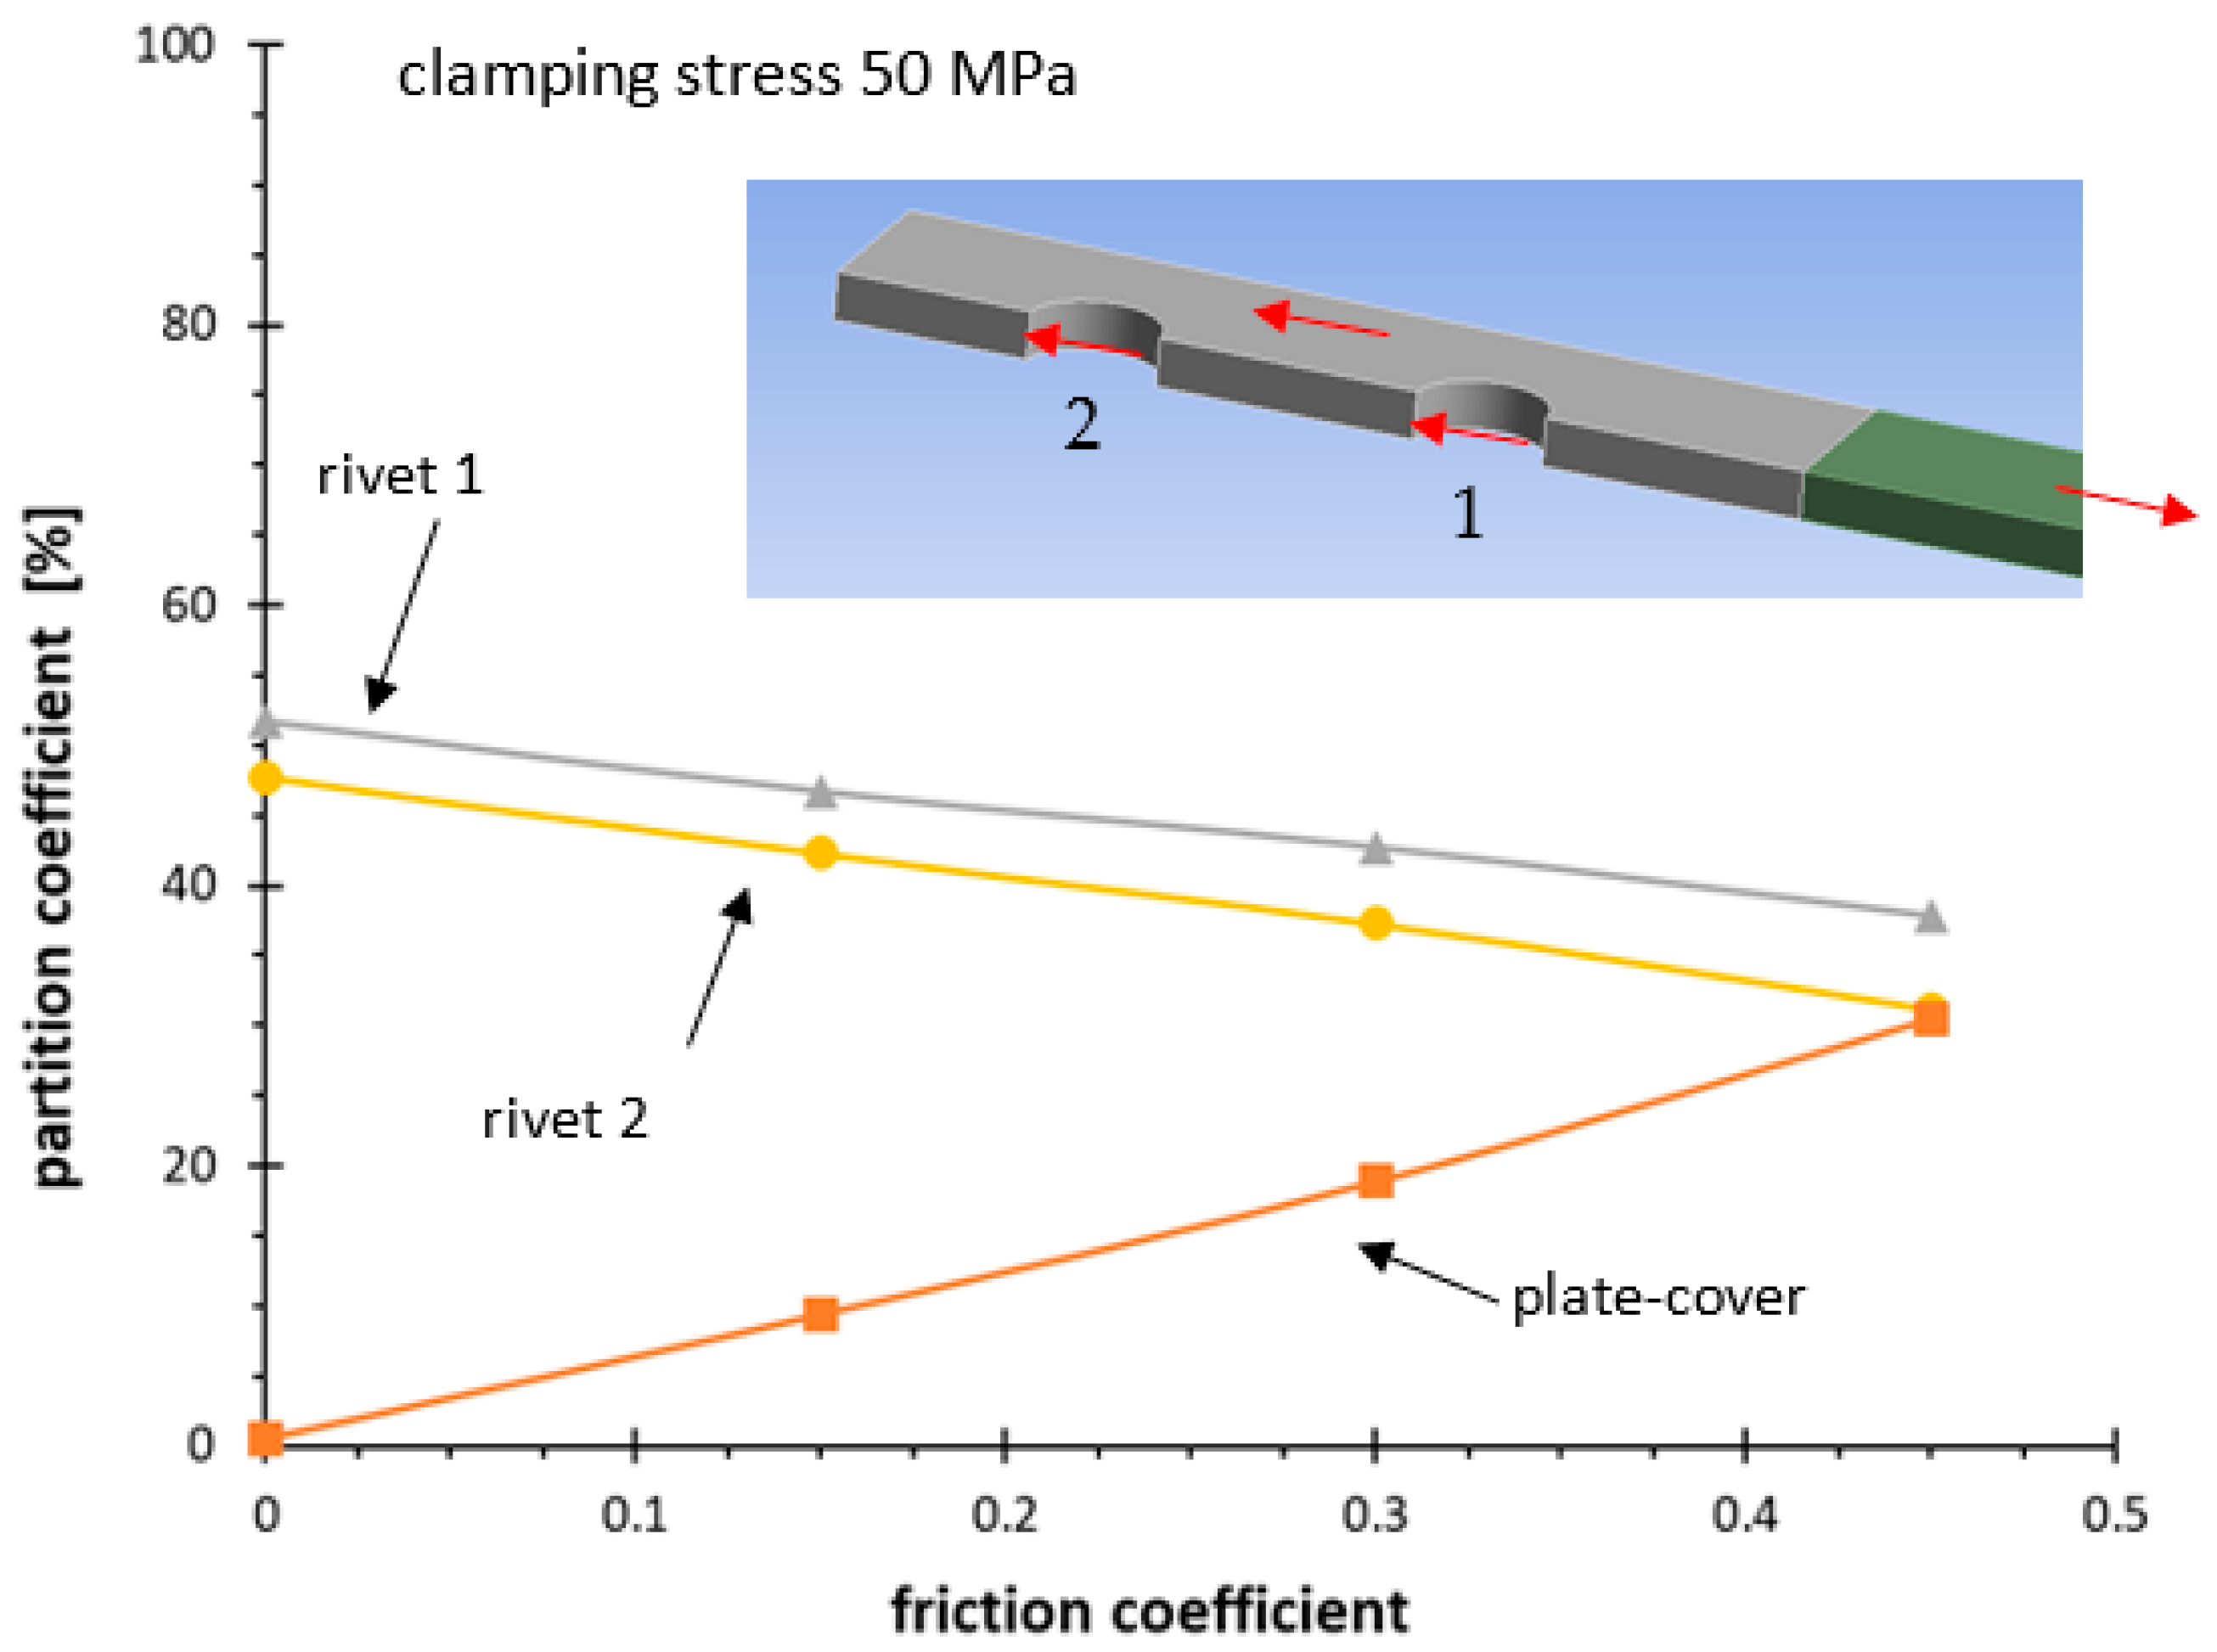
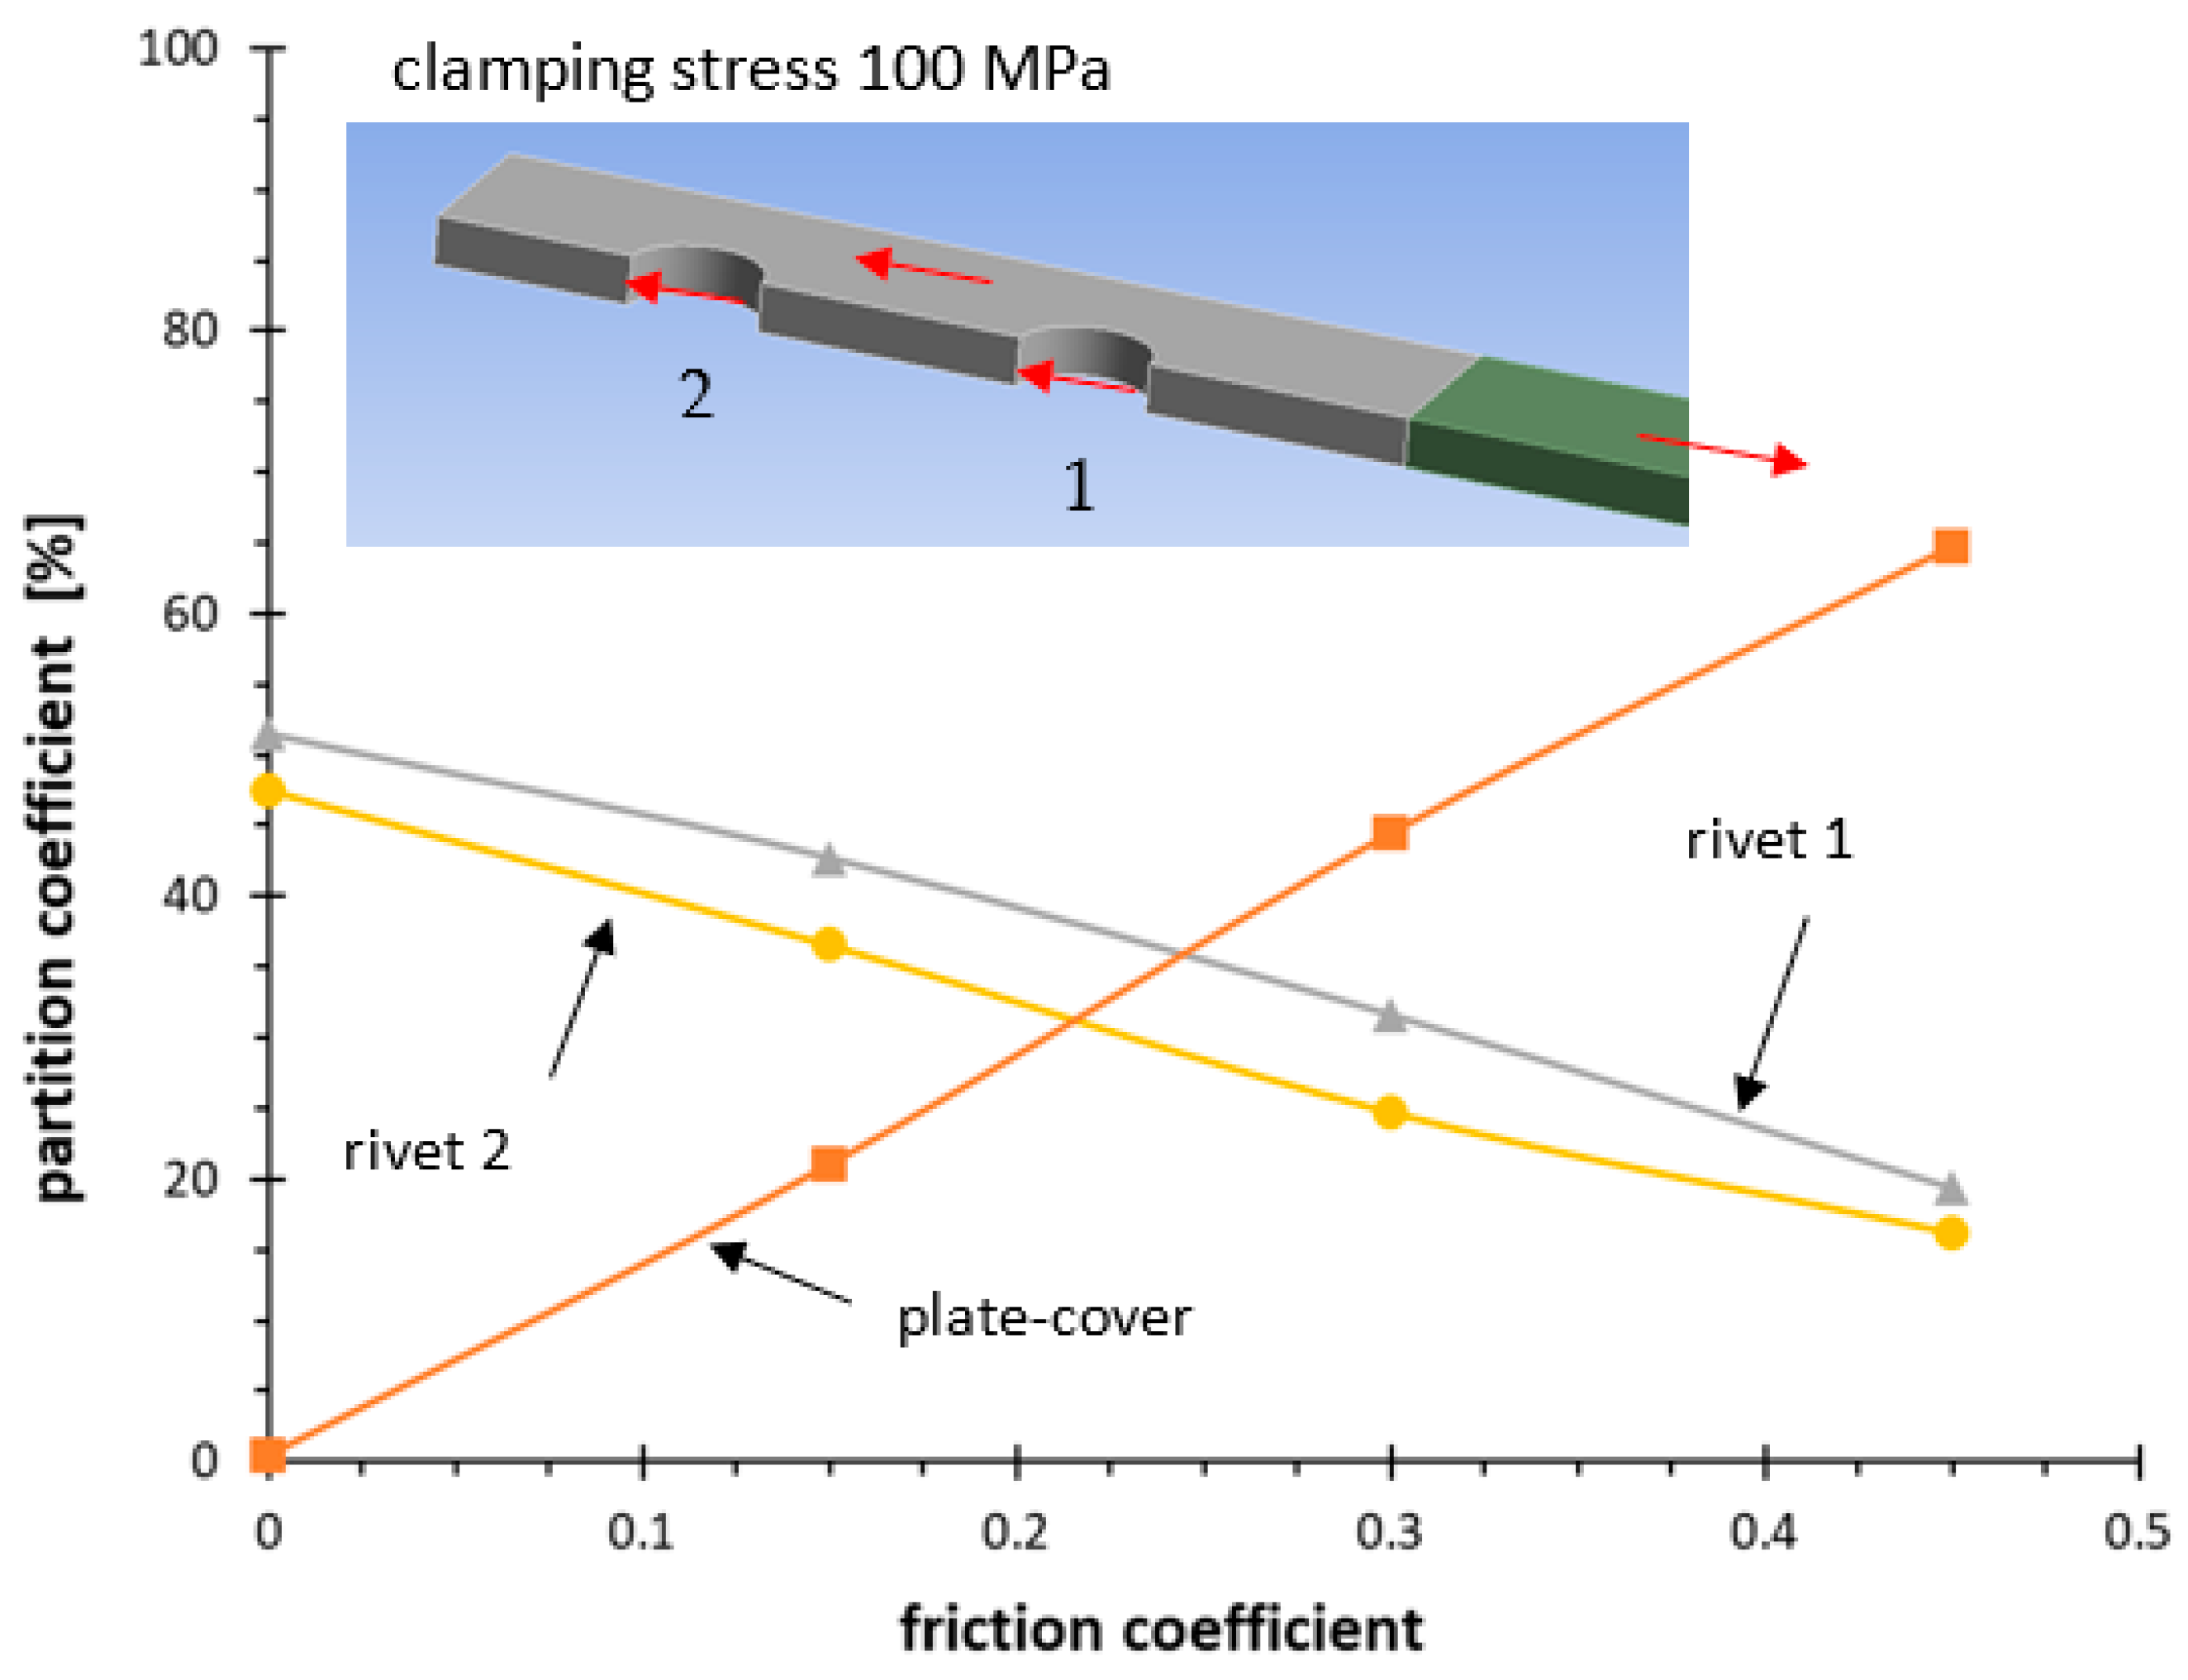
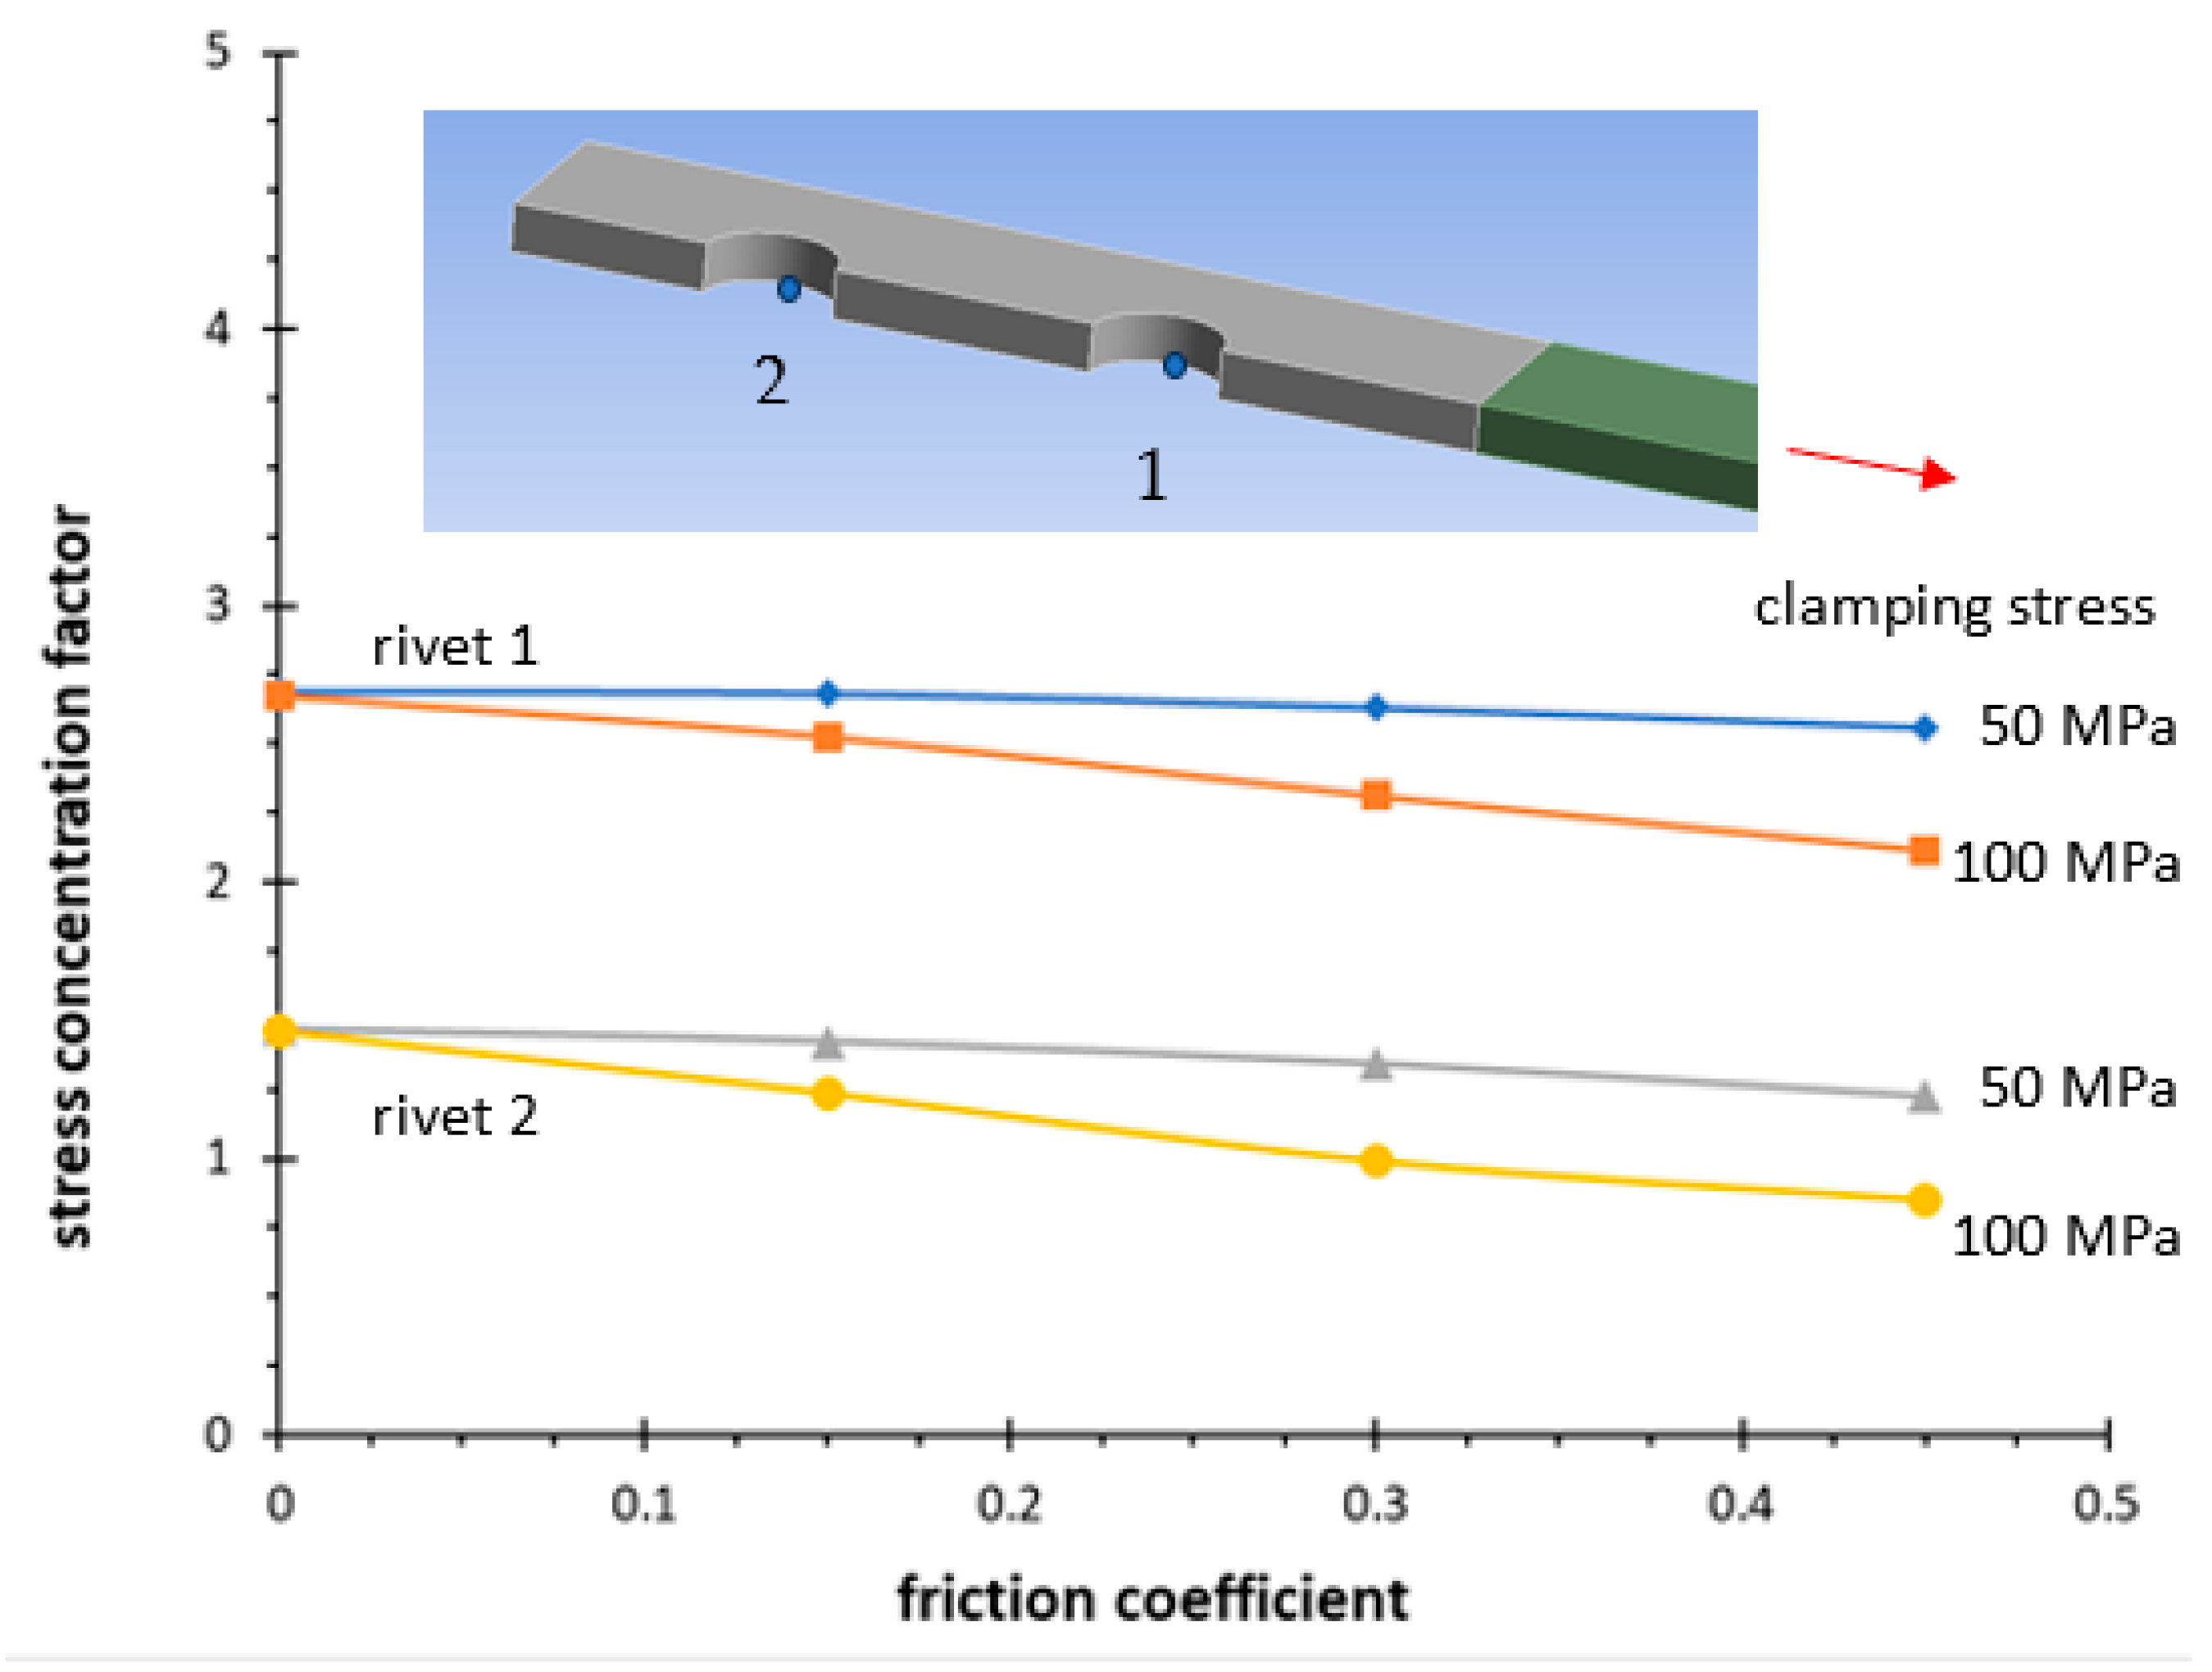
Figure 6 repots a typical result of stress for a tensile stress of 135 MPa in the net section. The longitudinal stress σx is higher at the external rivet, while the contact pressure has a similar trend on the two holes but with a higher average value at the external rivet. In fact, Figure 7 and Figure 8 report the partition coefficient of the forces evaluated for a tensile stress of 135 MPa in the net section. This coefficient is defined as the percentage of the force with respect to that applied in the gross section. The forces are calculated by means of an integral of the FE data. The integral was evaluated for the contact pressure between the shank rivet and the main plate as well as for the shear stress on the surface between the plate and the cover. The friction coefficient and the clamping force strongly influence the distribution of the acting forces on the main plate. Concerning the stress concentration factors of the longitudinal stress σx, Figure 9 shows its trend as a function of the friction coefficient. As the friction force on the contact surface increases, the stress concentration on the two holes decreases.
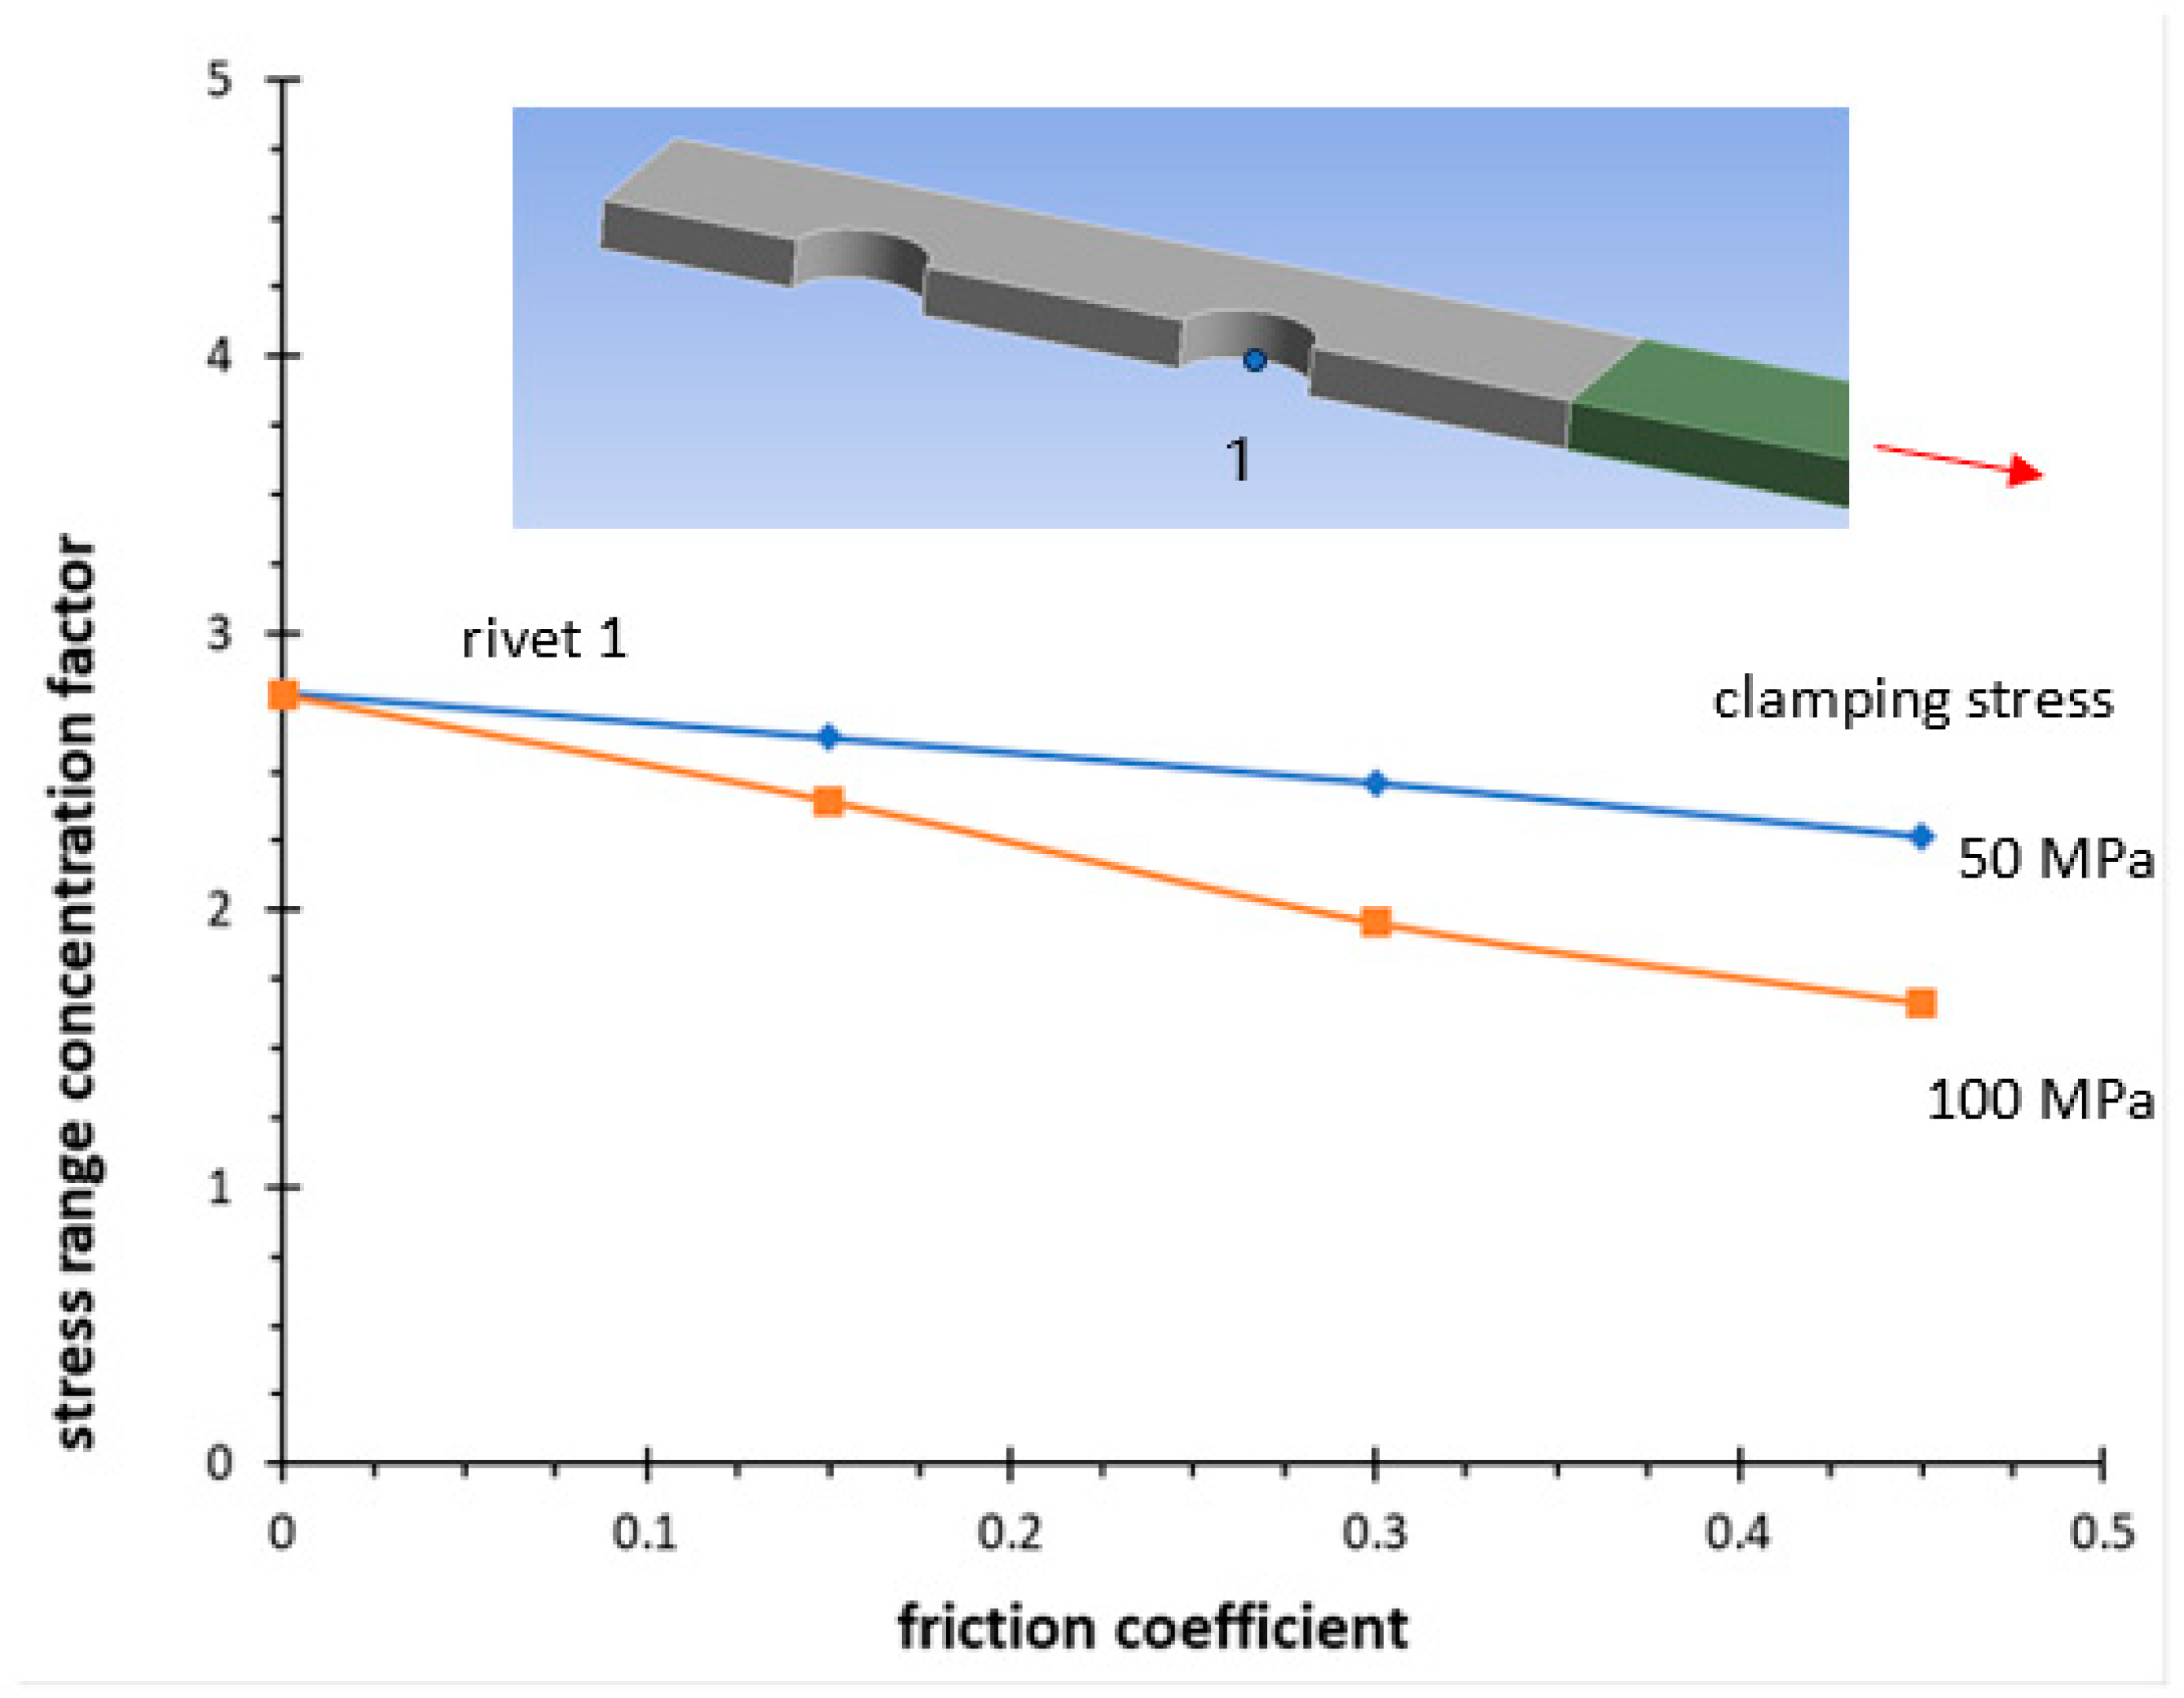
The frictional force also influences the range of stress σx evaluated between time 3 and 4 by considering a nominal stress range in the net section of 135 MPa (see Figure 10). So that the friction stress influences the local average stress during the fatigue loading and the local stress ratio is different from the nominal one.
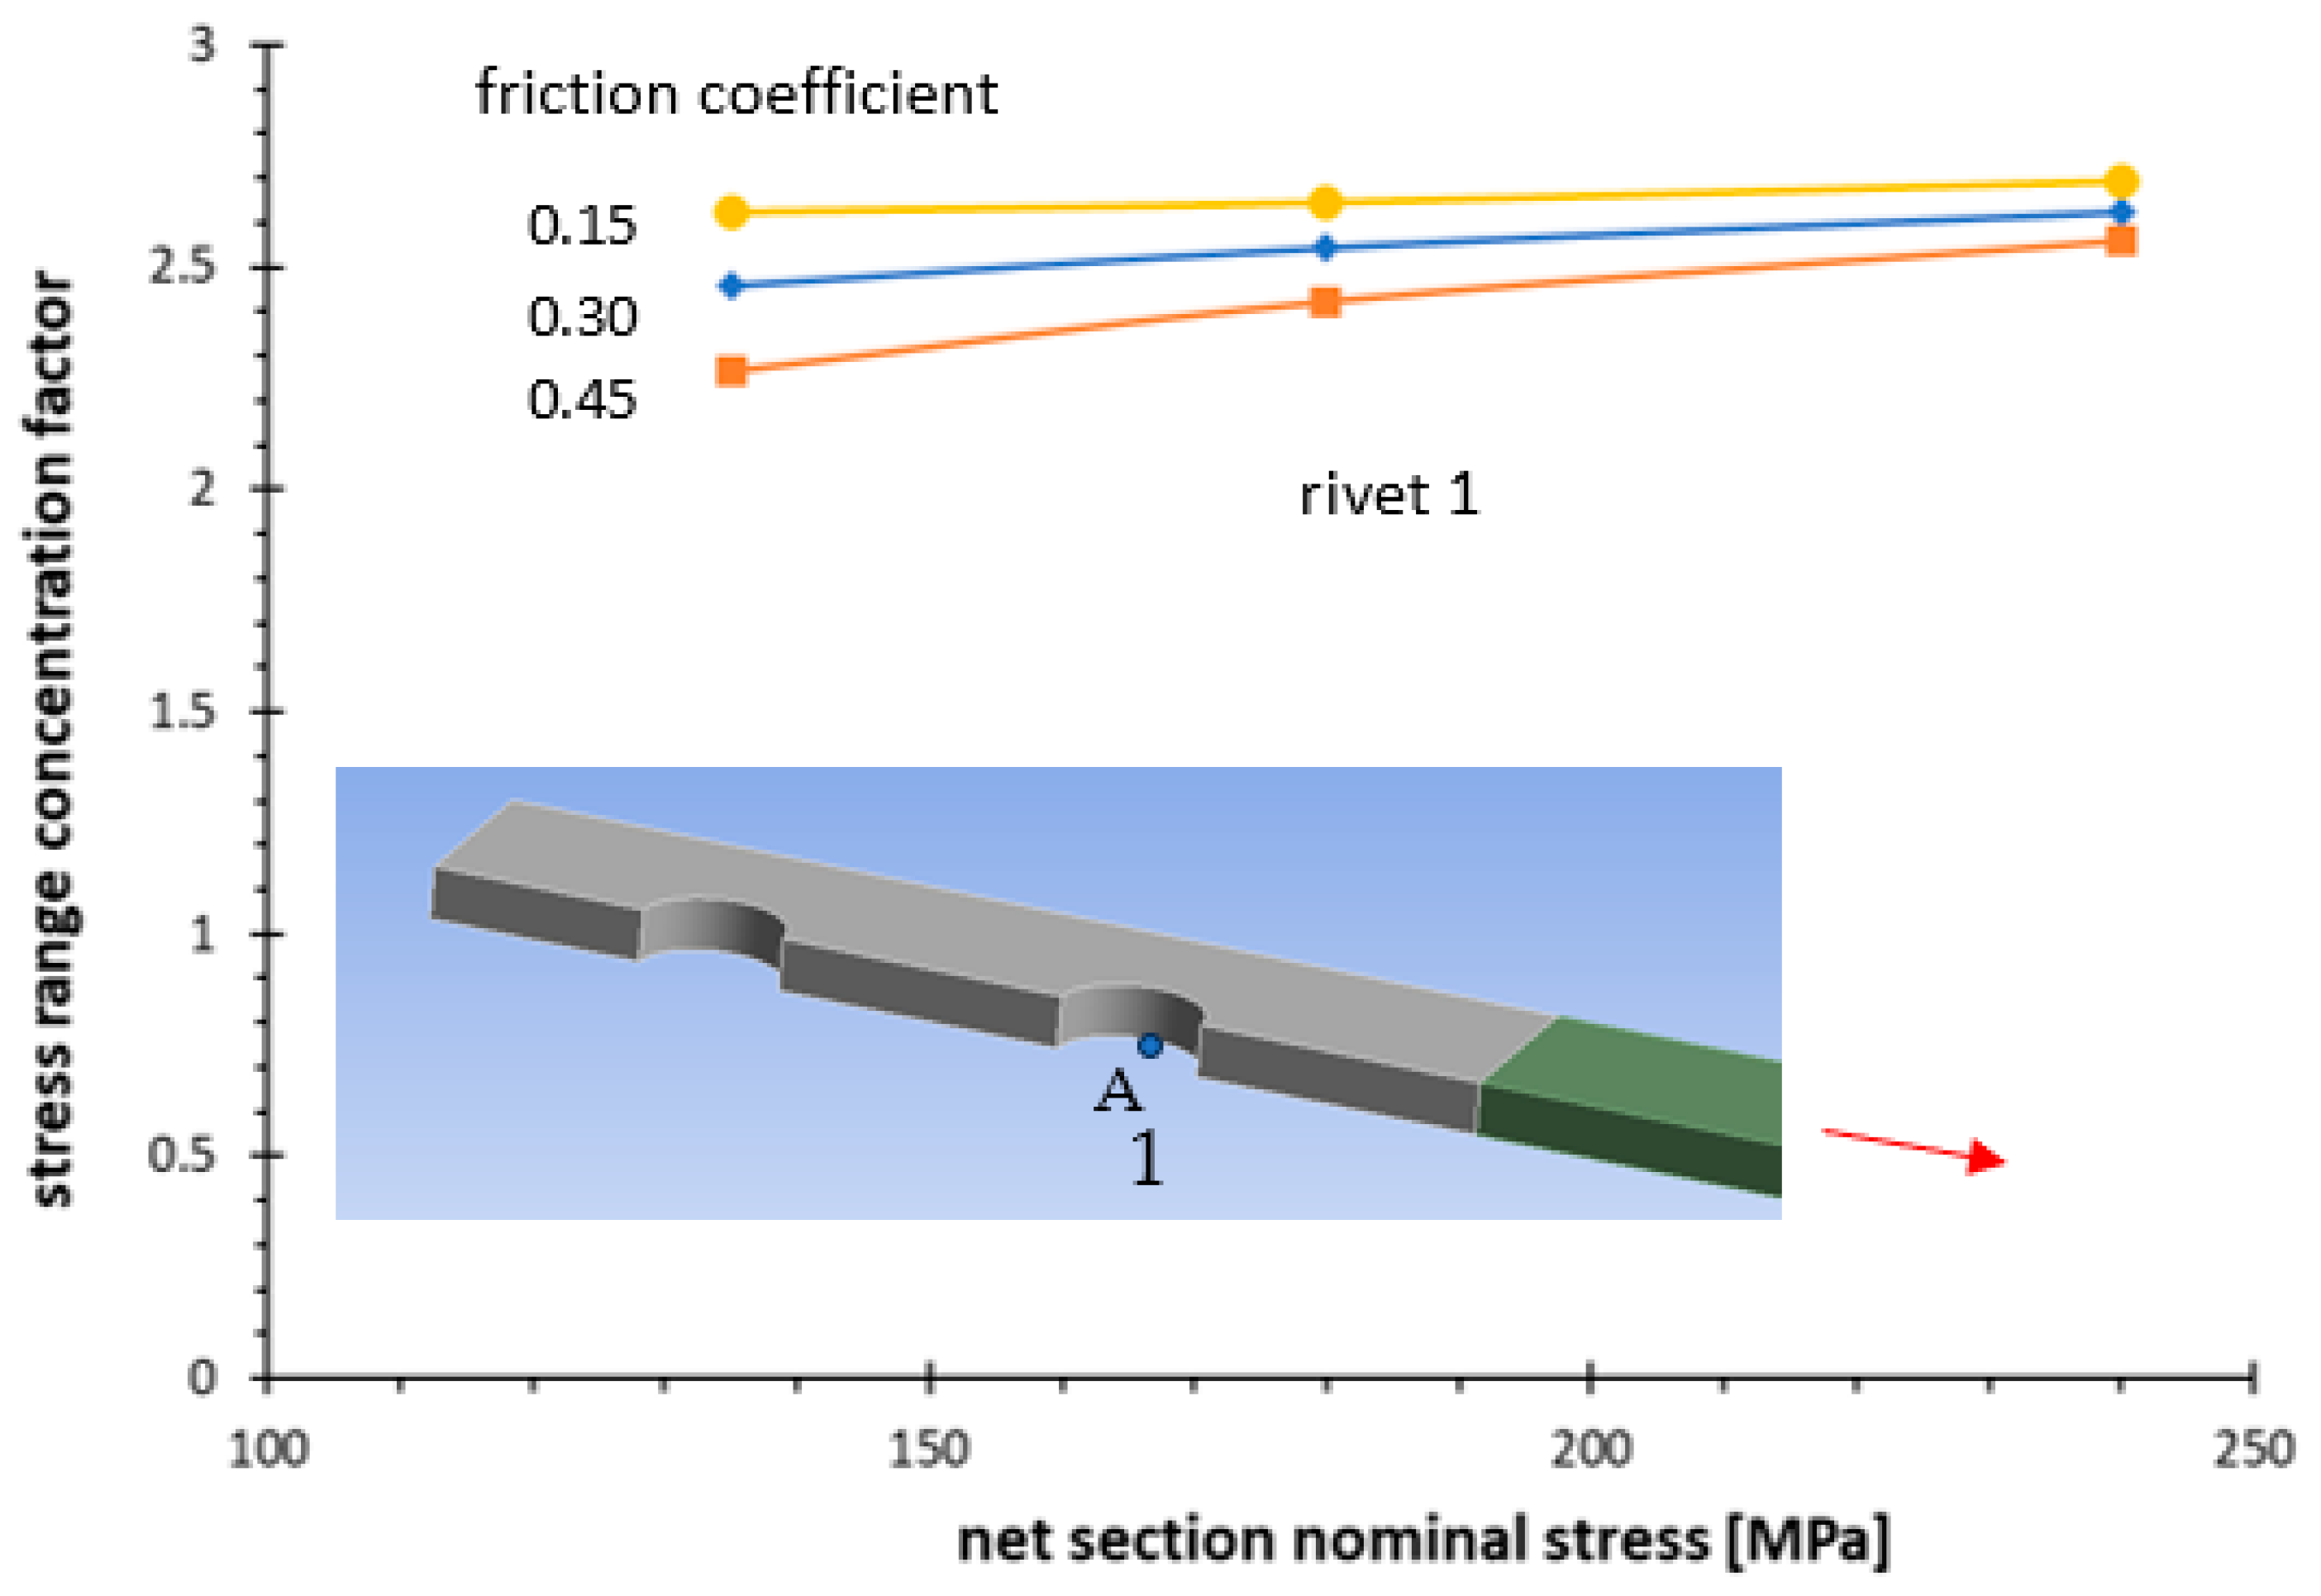
Finally, the non-linear behaviour of the material is considered in Figure 11. An elastic–perfectly plastic material was taken into account with von Mises yield criterion. The nominal stress in the net section is incremented up to the maximum value imposed in the experimental analysis (240 MPa in the net section, see Figure 3). In the case of linear elastic material, the maximum stress range at point A is conditioned by friction force; however, for non-linear material, when the nominal stress increases, the effects of friction are partially removed by the non-linear behaviour of the material. In the unloading phase, a linear elastic behaviour is shown by the material, and the stress range tends to the theoretical value that could be obtained without considering the friction effects. This effect depends on the level of maximum nominal stress in the net section. In other words, the friction influences the stress range to a greater extent at high-cycle fatigue than at low-cycle fatigue.

5. Conclusions

In this paper, on the basis of three-dimensional numerical analysis, it can be concluded that the force distribution or the stress concentration on the rivets is always critical for the external rivet. This is also confirmed in the case of the non-linear behaviour of the material. Furthermore, the friction coefficient influences the maximum stress as well as the range of stress in the main plate. However, the effect of the friction force tends to reduce the range of stresses at the net section during fatigue loadings, while the non-linear behaviour of the material tends to reduce this effect when the nominal stress increases.

Funding

This research received no external funding.

Data Availability Statement

The author does not have permission to share data.

Conflicts of Interest

The author declare no conflict of interest.

Nomenclature

Eelastic modulus
kslope of the Wöhler curve
Ncycles to failure
νPoisson’s ratio
σnomnominal stress
σYyield stress
Δrange
σstress component
Tσscatter index
udisplacement

References

  1. Brühwiler, E.; Smith, I.F.C.; Hirt, M.A. Fatigue and fracture of riveted bridge members. ASCE J. Struct. Eng. 1990, 116, 199–214. [Google Scholar] [CrossRef]
  2. Kulak, G.L. Fatigue strength of riveted connections. Stahlbau 1996, 65, 445–451. [Google Scholar]
  3. Bassetti, A.; Liechti, P.; Nussbaumer, A. Fatigue Design and Reliability; ESIS Publication 23; Marquis, G., Solin, J., Eds.; Elsevier: Amsterdam, The Netherlands, 1999; pp. 207–218. [Google Scholar]
  4. DiBattista, J.D.; Adamson, E.J.; Kulak, G.L. Fatigue strength of riveted connections. ASCE. J. Struct. Eng. 1998, 124, 792–797. [Google Scholar] [CrossRef]
  5. American Railway Engineering Association (AREA). Steel Structures; Chapter 15, Manual for Railway Engineering; American Railway Engineering Association: Lanham, MD, USA, 1996. [Google Scholar]
  6. American Association of State Highway and Transportation Officials. ASHTO LRFD Bridge Design Specifications. S/Units, 1st ed.; American Association of State Highway and Transportation Officials: Washington, DC, USA, 1994. [Google Scholar]
  7. Design of Steel Structures Part 1, General Rules for Buildings; Eurocode No. 3; 1993.
  8. Taras, A.; Greiner, R. Development and Application of a Fatigue Class Catalogue for Riveted Bridge Components. Struct. Eng. Int. 2010, 20, 91–103. [Google Scholar] [CrossRef]
  9. Kühn, B.; Lukic, B.; Nussbaumer, A.; Günther, H.P.; Helmerich, R.; Herion, S.; Kolstein, M.H.; Walbridge, S.; Androic, B.; Dijkstra, O.; et al. Assessment of Existing Steel Structures: Recommendations for Estimation of Remaining Fatigue Life, 1st ed.; JRC Scientific and Technical Reports, Joint Report Prepared under the JRC—ECCS Cooperation Agreement for the Evolution of Eurocode 3; Joint Research Center: Karlsruhe, Germany, 2008. [Google Scholar]
  10. Pedrosa, B.; Correia, J.A.; Rebelo, C.; Lesiuk, G.; De Jesus, A.M.; Fernandes, A.A.; Duda, M.; Calçada, R.; Veljkovic, M. Fatigue resistance curves for single and double shear riveted joints from old Portuguese metallic bridges. Eng. Fail. Anal. 2019, 96, 255–273. [Google Scholar] [CrossRef]
  11. Reemsnyder, H.S. Fatigue life extension of riveted connections. J. Struct. Div. ASCE 1975, 101, 2591–2607. [Google Scholar] [CrossRef]
  12. DiBattista, J.D.; Adamson, D.E.J.; Kulak, G.L. Evaluation of remaining fatigue life for riveted truss bridges. Can. J. Civ. Eng. 1998, 25, 678–691. [Google Scholar] [CrossRef]
  13. Pipinato, A.; Molinari, M.; Pellegrino, C.; Bursi, O.S.; Modena, C. Fatigue tests on riveted steel elements taken from a railway bridge. Struct. Infrastruct. Eng. 2011, 7, 907–920. [Google Scholar] [CrossRef]
  14. Livieri, P.; Lazzarin, P.; Mutignani, F.; Tisalvi, M. Fatigue tests on riveted connections. In Proceedings of the 9th Nordic Steel Construction Conference, Helsinki, Finland, 18–20 June 2001; pp. 599–606. [Google Scholar]
  15. de Jesus, A.M.P.; da Silva, A.L.L.; Correia, J.A.F.O. Fatigue of riveted and bolted joints made of puddle iron—A numerical approach. J. Constr. Steel Res. 2014, 102, 164–177. [Google Scholar] [CrossRef]
  16. Maljaars, J.; Leonetti, D.; Maas, C. Fatigue life prediction of hot riveted double covered butt joints. Int. J. Fatigue 2019, 124, 99–112. [Google Scholar] [CrossRef]
  17. Manson, S.S. Fatigue: A complex subject—Some simple approximations. Exp. Mech. 1965, 5, 193–226. [Google Scholar] [CrossRef]
  18. Morrow, J. Fatigue Properties of Metals. In Fatigue Design Handbook; Graham, J.A., Millan, J.F., Appl, F.J., Eds.; SAE: Warrendale, PA, USA, 1968; pp. 21–29. [Google Scholar]
  19. Ramberg, W.; Osgood, W.R. Description of Stress-Strain Curves by Three Parameters; Technical Note 902; NASA: Washington, DC, USA, 1943.
  20. Taylor, D. The theory of critical distances. Eng. Fract. Mech. 2007, 75, 1696–1705. [Google Scholar] [CrossRef]
  21. Susmel, L.; Taylor, D. The theory of critical distances to estimate lifetime of notched components subjected to variable amplitude uniaxial fatigue loading. Int. J. Fatigue 2011, 33, 900–911. [Google Scholar] [CrossRef]
  22. Lazzarin, P.; Zambardi, R. A finite-volume-energy based approach to predict the static and fatigue behavior of components with sharp V-shaped notches. Int. J. Fract. 2001, 112, 275–298. [Google Scholar] [CrossRef]
  23. Lazzarin, P.; Berto, F. Some expressions for the strain energy in a finite volume surrounding the root of blunt V-notches. Int. J. Fract. 2005, 135, 161–185. [Google Scholar] [CrossRef]
  24. Livieri, P.; Lazzarin, P. Fatigue strength of steel and aluminium welded joints based on generalised stress intensity factors and local strain energy values. Int. J. Fract. 2005, 133, 247–276. [Google Scholar] [CrossRef]
  25. Berto, F.; Lazzarin, P.; Yates, J.R. Multiaxial fatigue of V-notched steel specimens: A non-conventional application of the local energy method. Fatigue Fract. Eng. Mater. Struct. 2021, 34, 921–943. [Google Scholar] [CrossRef]
  26. Livieri, P.; Tovo, R. Fatigue strength of aluminium welded joints by a non-local approach. Int. J. Fatigue 2021, 143, 106000. [Google Scholar] [CrossRef]
  27. Livieri, P.; Tovo, R. Actual weld profile fatigue performance by digital prototyping of defected and un-defected joints. Fatigue Fract. Eng. Mater. Struct. 2022, 45, 3436–3446. [Google Scholar] [CrossRef]
  28. Skorupa, M.; Machniewicz, T.; Skorupa, A.; Korbel, A. Effect of load transfer by friction on the fatigue behaviour of riveted lap joints. Int. J. Fatigue 2016, 90, 1–11. [Google Scholar] [CrossRef]
  29. Vivio, F. A new theoretical approach for structural modelling of riveted and spot welded multi-spot structures. Int. J. Solids Struct. 2009, 46, 4006–4024. [Google Scholar] [CrossRef]
  30. Di Cicco, F.; Fanelli, P.; Vivio, F. Fatigue reliability evaluation of riveted lap joints using a new rivet element and DFR. Int. J. Fatigue 2017, 101, 430–438. [Google Scholar] [CrossRef]
  31. Jia, D.; Zhang, Q.; Xiong, L.; Li, J.; Bu, Y.; Bao, Y. A unified evaluation method for fatigue resistance of riveted joints based on structural stress approach. Int. J. Fatigue 2022, 160, 106871. [Google Scholar] [CrossRef]
  32. EN 10025; Hot Rolled Products of Non-Alloy Structural Steels—Technical Delivery Conditions. 1995.
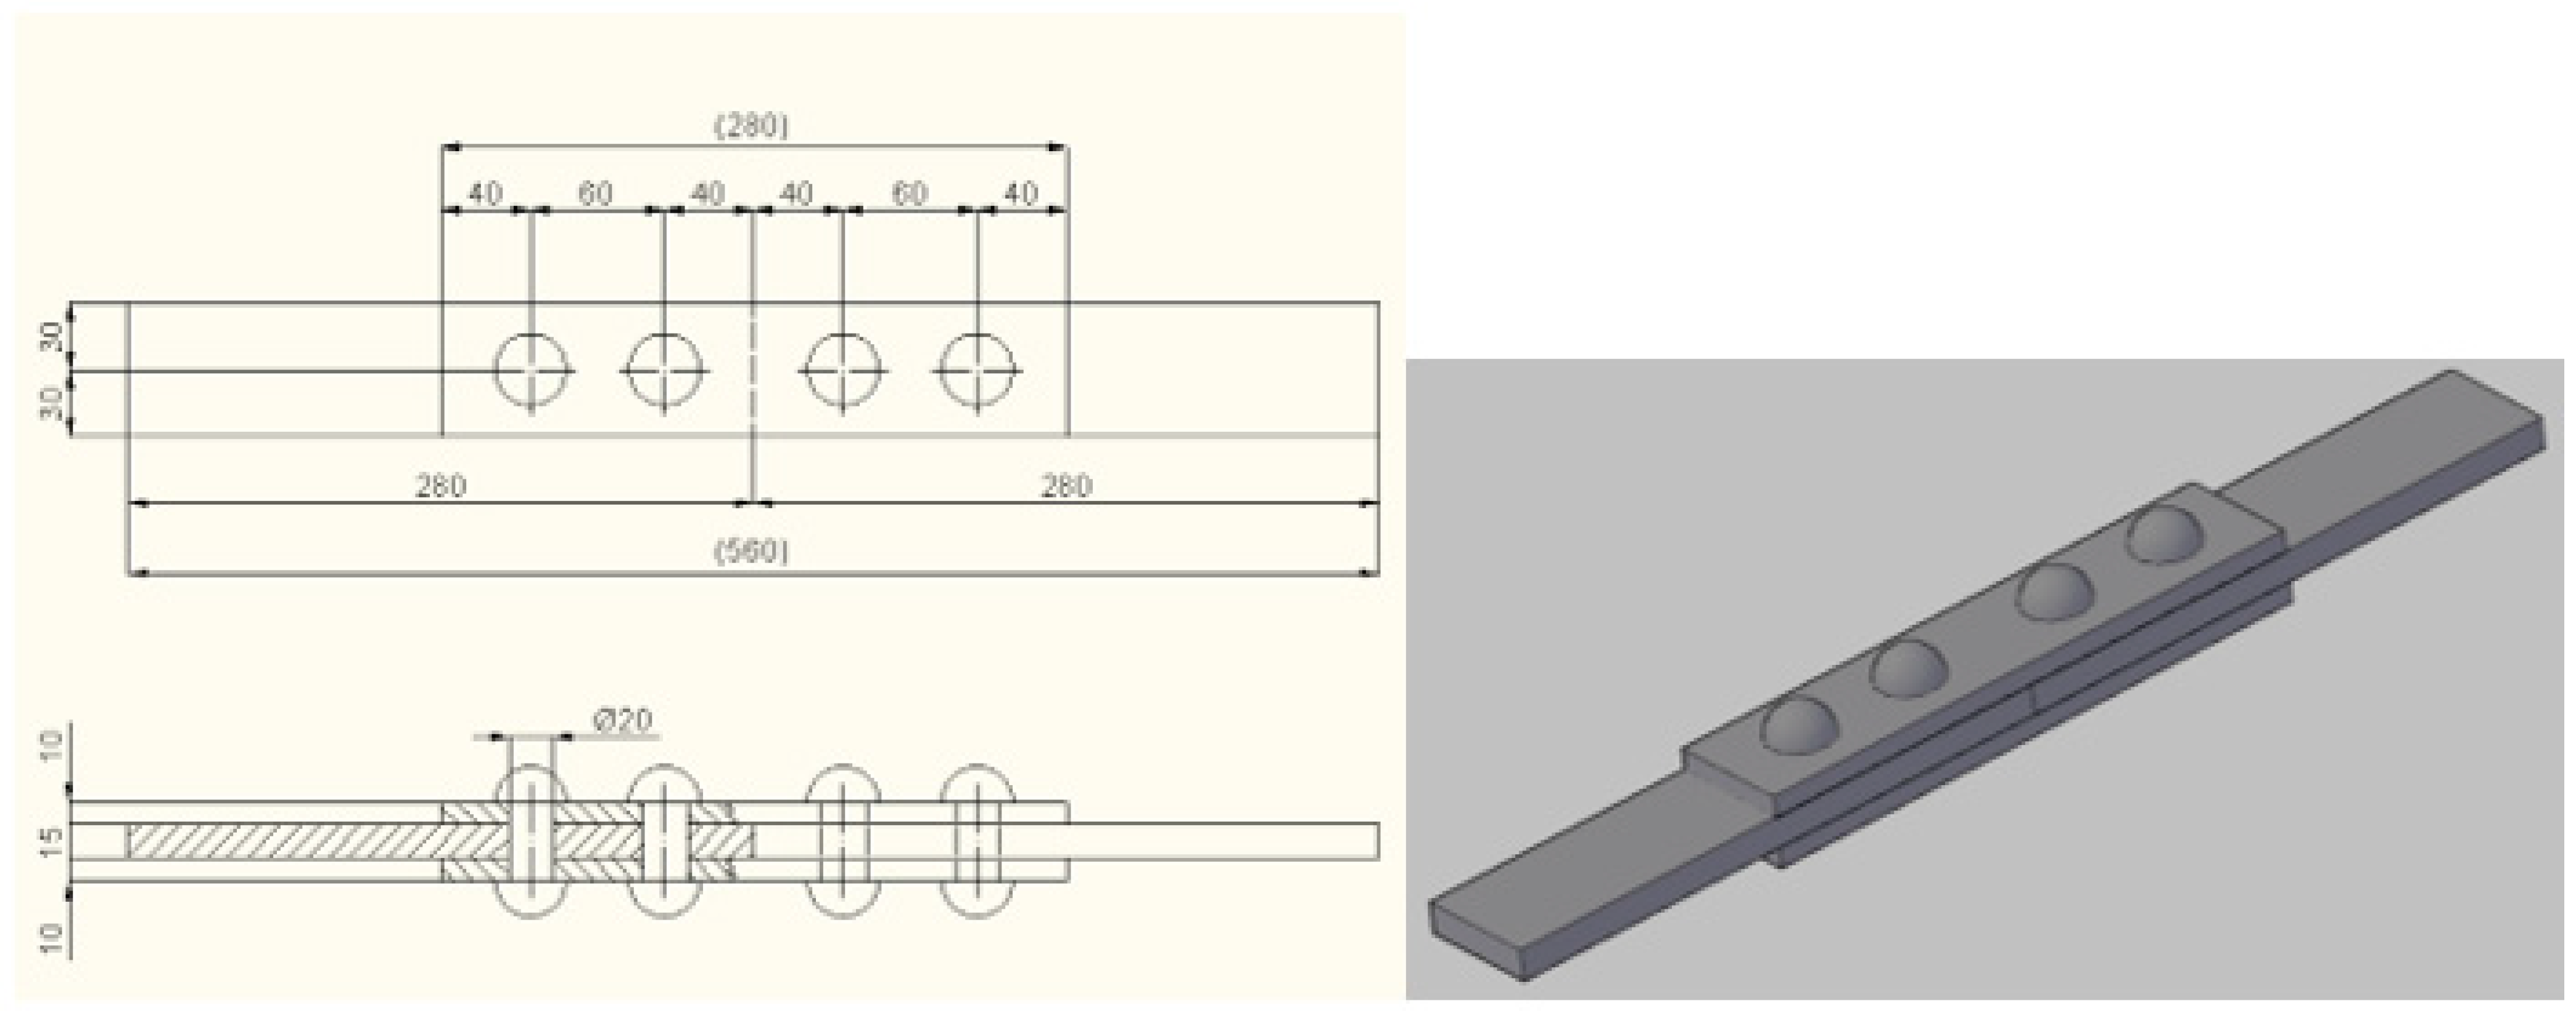
Figure 1. Geometry of the symmetric double-riveted lap joints (size in millimetres).
Lubricants 11 00396 g001
Figure 2. Typical failures on the joint net sections (nominal tensile stress range in the net Section 240 MPa; cycles to failure 109,000, size in millimetres).
Lubricants 11 00396 g002
Figure 3. Fatigue test results [14] (Δσnom: nominal stress range in the net section).
Lubricants 11 00396 g003
Figure 4. Mesh and boundary conditions in FE analysis (u displacement).
Lubricants 11 00396 g004
Figure 5. Nominal load history at the gross section.
Lubricants 11 00396 g005
Figure 6. Longitudinal stress σx (a) and contact pressure (b) for a nominal stress in the net section of 135 MPa (time 3, linear elastic material).
Lubricants 11 00396 g006
Figure 7. Force on the main plate in terms of the partition coefficient on the main plane (nominal stress in the net Section 135 MPa, linear elastic material).
Lubricants 11 00396 g007
Figure 8. Force on the main plate in terms of the partition coefficient (nominal stress in the net Section 135 MPa, linear elastic material).
Lubricants 11 00396 g008
Figure 9. Stress concentration factor for σx on the main plate evaluated for nominal stress in the net Section 135 MPa (linear elastic material).
Lubricants 11 00396 g009
Figure 10. Stress range concentration factor for σx on the main plate for the external rivet evaluated for nominal stress of 135 MPa in the net section (linear elastic material).
Lubricants 11 00396 g010
Figure 11. Stress range concentration factor for σx evaluated for clamping stress of 50 MPa on the main plate in the external rivet (non-linear material; A in the net section).
Lubricants 11 00396 g011
Table 1. Fatigue strength data, all referred to the main plate net section.
SeriesΔσnom,50%
N = 2 × 10⁶
kTσ
B131.74.91.53
Table 2. Parameters used in the FE analysis.
E [MPa]206,000
ν0.3
σY [MPa]355
Friction coefficient0.15; 0.3; 0.45
Clamping stress [MPa]50; 100
σnom [MPa]135 ÷ 240
Element typeIn large part 3D quadratic elements with 10 nodes and 3D quadratic elements with 20 nodes
Number of nodes~350,000
Number of solid elements~240,000
Number of contact elements~47,000
Disclaimer/Publisher’s Note: The statements, opinions and data contained in all publications are solely those of the individual author(s) and contributor(s) and not of MDPI and/or the editor(s). MDPI and/or the editor(s) disclaim responsibility for any injury to people or property resulting from any ideas, methods, instructions or products referred to in the content.