Abstract
The purpose of this study is to generate some experimental data associated with the thermal heat exchange between an oil jet flow and a rotating gear. To this end, a specific test bench was designed. The principle of this test bench is to inject oil heated to a temperature of about 80 °C onto a rotating test sample at ambient temperature. Temperature measurements of the oil via injection nozzles and the rotating component allow the determination of the heat flow between these elements using a numerical method developed to this end. This test rig enables the study of the parameters that may affect heat exchange, such as oil flow rate and injection temperature, nozzle geometry and position, gear rotational speed and tooth geometry, or oil characteristics. In this study, three of these parameters were investigated, namely the test sample rotational speed, the oil flow rate, and the oil jet velocity. The experiments were conducted on an aluminum disc and spur gear. Subsequently, the experimental results were compared with existing models that represent the convective exchanges between oil and a gear. Some discrepancies between existing models and experimental results appear at high rotational speeds, underlining that the convective heat transfer does not always increase with this parameter.
1. Introduction
The European Commission has set a target of reducing the greenhouse gas (GHG) emissions of the European Union by over 90% by 2050, compared to the 2000 levels []. For the aerospace industry, this objective translates into a drastic reduction in sector emissions by 2030, reaching carbon neutrality in 2050, and reducing Nitrogen Oxide (NOx) emissions by 90% compared to those of 2000. In the context of increasing air traffic, this commitment requires the aerospace industry to adapt and propose innovative and ambitious solutions to meet environmental challenges while ensuring flight safety, complying with emission noise standards, and ensuring its economic sustainability.
When it comes to technology, the lubrication of power transmissions is one of the technological elements that is subject to risk assessments while contributing to the overall efficiency of mechanical transmissions. While a small amount of oil is sufficient to form a film that ensures contact surface separation between moving mechanical parts, a much larger amount is necessary for cooling these components. In aerospace mechanical transmissions subject to high rotational speeds, several studies have shown that losses generated by the interaction of oil and rotating components constitute a major source of dissipation []. As these losses increase with the amount of lubricant used, this quantity must be adjusted to avoid degrading the efficiency of the transmission under consideration [,].
Gears are a priority as they convey the majority of the power and must therefore be properly cooled from the lubricant. Blok [] defines a convective exchange on the tooth of a gear based on fling-off cooling. This result has been used in several studies to estimate an average convective heat transfer coefficient which can be employed as a boundary condition in finite element models. As an example: (i) Patir N. and Cheng H.S. [] proposed a model to predict the overall temperature of a mechanical transmission; (ii) Long [] simulated the temperature of gear teeth at high speeds, taking into account the effects of gear geometry, rotational speed, and lubrication conditions; (iii) Townsend et al. [] developed a computer program for predicting gear-tooth temperatures and the importance of oil jet cooling in preventing scoring, with the need for an experimental determination of heat-transfer coefficients. In addition to the above-mentioned studies, the works of Xing C. [], G. Niemann [], Peng Jie [], and Duan Yang [] showed that for gears operating under high speeds, a pressurized oil jet is required to provide adequate cooling and prevent gear failure caused by high bulk temperatures.
In order to optimize gear lubrification, several studies have developed numerical approaches to investigate this question: Xiaozhou H. [] simulated the oil jet lubrication of meshing spur gears with computational fluid dynamics (CFD) simulations based on the Boltzmann lattice method (LBM). The results show that lubrication performance is improved by adjusting the injection parameters and that the LBM method can be used to further investigate the effects of heat in gears. The volume of fluid (VOF) method can be used to model immiscible multiphase fluid systems at the interface scale and was used by Fondelli T. [,], Dai Y. [,,], and Wang J. [,,]. The works of Keller M. [], Liu H. [], and Ji Z. [] on Smoothed Particle Hydrodynamics (SPH) can also be mentioned. The finite volume (FV) method is another way of representing partial differential equations in the form of algebraic equations. This method is based on the work of Concli F. [] and Fondelli T. [].
Studies from the literature have concluded that the accurate prediction of the gear bulk temperature using numerical methods is possible, despite difficulties in obtaining accurate values of frictional heat flux and heat transfer coefficients. In an attempt to study a distribution of the convective exchange coefficient along the gear, Von Plehwe et al. [] developed a new approach based on a comparison between a specific test rig and finite element model. However, all the cases assumed that this exchange occurs over the entire tooth. This is not necessarily the case, as suggested by the work of Akin []. His study shows that the industrial standard nozzle orientation can cause incipient gearing failure in high-speed drives due to the deprivation of primary impingement on the gear. It also suggests that a minimum jet velocity is necessary to lubricate the gear teeth, and a minimum offset is required to guarantee impingement on the gear under certain operating conditions. The maximum impingement depth is not more than 10% of the tooth profile depth.
Based on previous studies, it appears that experimental data on the thermal heat exchange between a rotating gear and an oil jet flow are relatively scarce. To overcome this lack, a new test rig has been designed to directly study the above-mentioned thermal resistance without making assumptions about surfaces in convective exchange with oil. The proposed test bench allows to simulate real operating conditions and measure the performance of gear oil heat exchanges under controlled conditions. With this test bench, it is possible to study in-depth the various lubrication parameters, such as nozzle geometry, injection speed, and oil flow rate, and their influence on gear performance. The aim of this paper is to present the experimental procedure which was developed to determine the thermal resistance of convection between oil flow and a rotating sample. To illustrate this procedure, this work focuses on studying the thermal resistance of two types of test samples, namely a disc and a spur gear, by varying a parameter (oil jet velocity, oil flow rate, or rotational speed) in each experiment. First, the test bench is presented, then the operating procedure and the related assumptions are explained. Finally, the experimental results are compared with existing models and discussed.
2. Test Equipment
2.1. Injection Test Rig
Figure 1 shows a schematic top view of the injection test bench. In this paper, the test sample is a disc or a gear. The rotation of the test sample is imposed by an electric motor and transmitted by a belt to the shaft. One or several nozzles can be positioned in the housing with 5 degrees of freedom except for the roll. A type K thermocouple with a ±0.5 °C precision allows the measurement of the injected oil temperature and bulk temperature of the test sample (Figure 2) using the same technique as that of Issac et al. [] and Navet et al. [], which validates the experimental approach.
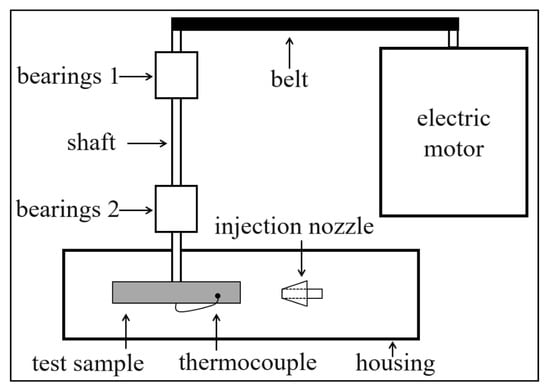
Figure 1.
Principle diagram of the injection test bench.
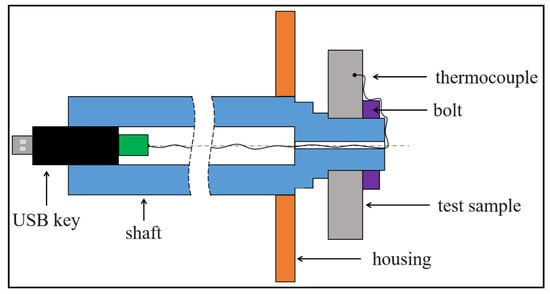
Figure 2.
Thermocouple diagram on the test sample.
The lubrication system consists of two independent circuits (Figure 3), each composed of a pump, a filter, and a flowmeter (with ±1% accuracy). The pumps deliver a maximum flow rate of 14 L/min with a 12 mm nozzle diameter. These circuits allow for the homogeneous circulation of oil in an oil tank. It is equipped with a heating element and thermocouples for oil temperature control. A 3-way valve enables switching from a closed circuit (oil heating) to injection to the test mobile.
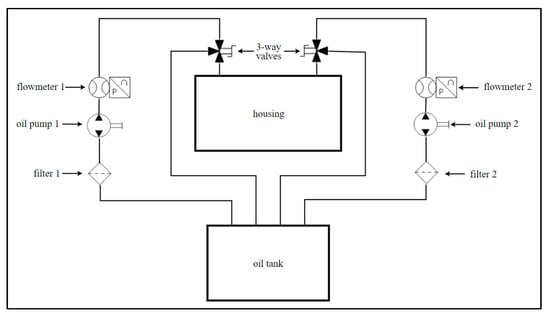
Figure 3.
Hydraulic scheme of the test rig.
The thermocouple which allows to measure the temperature of the test sample can be placed at several locations in the test sample studied: holes visible in Figure 4.
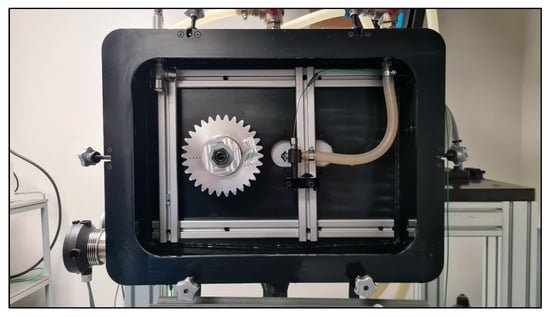
Figure 4.
Front view of the injection test rig.
The operating range of the injection test bench is given in Table 1. A second gear can be positioned to have a pinion-gear pair but is not used in this paper.

Table 1.
Maximum operating range of the injection bench.
A plexiglass front panel is used to visualize the oil flow impacting the rotating test sample. There are two phenomena to observe (Figure 5): first, the penetration of the jet into the space between the teeth in the axis of the nozzle and then the oil removal from the tooth faces by a centrifugal fling-off, studied by Blok [], during the rotation of the gear.
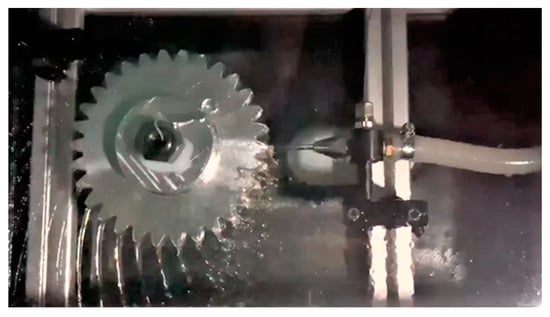
Figure 5.
Photograph of the oil injection on a gear.
2.2. Test Samples
Both a disc and a spur gear were studied; their geometries are defined in Table 2. The test samples already studied on this modular test bench were a disc and a spur gear (Figure 6). The test specimens are defined in Table 2. The lubricant properties are given in Table 3.

Table 2.
Characteristics of the disc and spur gear.
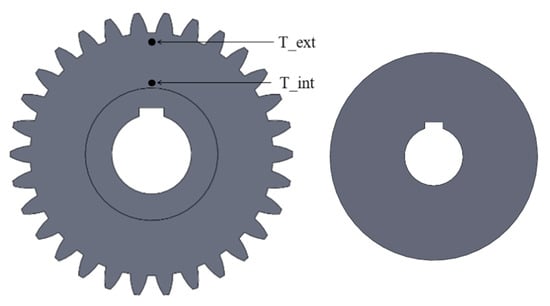
Figure 6.
Gear and disc test samples.

Table 3.
Oil properties.
The test samples were made of aluminum 2017 A (AU4G) to have low Biot numbers with the stated goal to consider them as isothermal while offering high thermal conductivity (150 W/mK). In order to verify this assumption, the same experiments were conducted by measuring the temperature at different locations. Figure 7 shows the temperature evolution of the gear with one position of the thermocouple toward the shaft and the other position toward the tooth (visible in Figure 6). The characteristics of this test are given in Table 4. The average temperature difference between the two tests was 0.42 °C. The nozzle–mobile distance was 35 mm to ensure that the oil jet reached the test sample for all ranges of oil injection parameters.
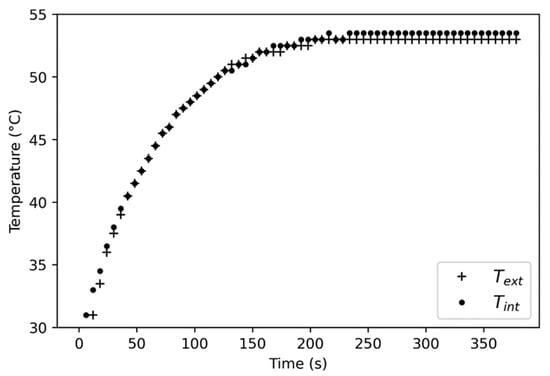
Figure 7.
Temperature evolution according to the thermocouple position.

Table 4.
Isothermal test conditions on the gear test sample.
3. Experimental Approach
3.1. Protocol
After positioning the test sample and the injection nozzle with the associated type K thermocouples, the oil tank heaters and pumps must be activated. Once the oil has reached the desired temperature, the test sample is set into rotation, and the valve is opened. Upon completion of the test, the valve is closed, and the test sample is stopped.
The data collected include the temperature measurements from the thermocouples and experimental constants such as flow rate, rotational speed, geometry, and positioning of the nozzle(s) and the test sample. After the data have been collected, they are processed to determine the time constant and calculate thermal coefficients such as (hS) product or thermal resistance. These results are then analyzed.
3.2. Temperature Measurement
The gear, oil, and housing air temperatures obtained from the test are shown in Figure 8. Oil corresponds to the temperature of the oil at the nozzle outlet, Air corresponds to the temperature of the air inside the housing, and Gear represents the bulk temperature of the gear. The characteristics of this test are given in Table 5.
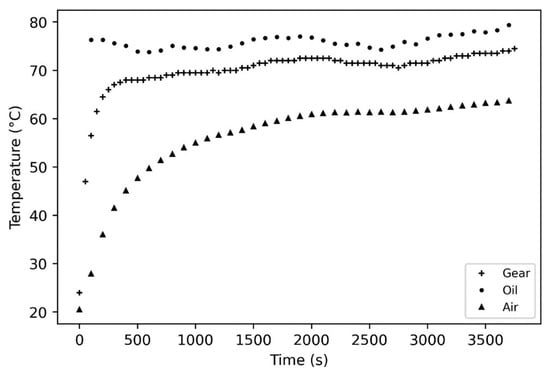
Figure 8.
Temperatures as a function of time during an experiment with spur gear.

Table 5.
Example of experimental parameters.
Figure 8 highlights the different temperatures associated with the studied gear, including heat exchanges with the oil and the air. The temperatures show that there is a thermal equilibrium at a temperature different from the injection one. Therefore, there is a need to construct a thermal model to correctly identify and quantify the two phenomena in order to isolate the convection between the oil and the gear.
3.3. Time Constant Determination
The data retrieved from the experiment are used to specify a test duration for the test, which starts when the injection valve is opened, i.e., when oil is injected onto the test sample.
It is considered that the test sample is impacted by both oil and air. By assuming an isothermal test sample (as shown by previous results), the first law of thermodynamics leads to the following equation:
where , are thermal resistance (K/W) between oil (and air, respectively) and the test sample, and (J/K) is the thermal inertia of the test sample.
Then:
The use of the implicit Euler [] method results in the following system formulation:
where i is the index corresponding to a time step, (°C) is the temperature of the moving device at time step i, (°C) is the temperature of the oil at time step i + 1, and (°C) is the temperature of the air heat exchange at time step i + 1.
The thermal time constant τ (s) of a system corresponds to the time required by this system to reach approximately 63.2% of its equilibrium temperature after a sudden change in its operating conditions. Here, the thermal time constants associated with oil and air heat exchanges are defined by:
The theoretical temperature of the test sample is calculated with curve fitting, which estimates the temperature from two parameters, and , to be optimized. This method uses the minimization of the differences between the experimental values and the calculated ones:
In this case, the curve-fitting algorithm can be decomposed as follows:
- Initialization with the experimental test sample temperature:
- Recursive algorithm using the curve-fitting method of (5) to determine the variables and in (3).
Because of this calculation, it is possible to plot the simulated temperature of the test sample (Figure 9). The curve fitting corresponds to the temperature measurements of the test sample, and the residual error of Equation (5) between the two curves is 0.4 °C over almost 400 measuring points.
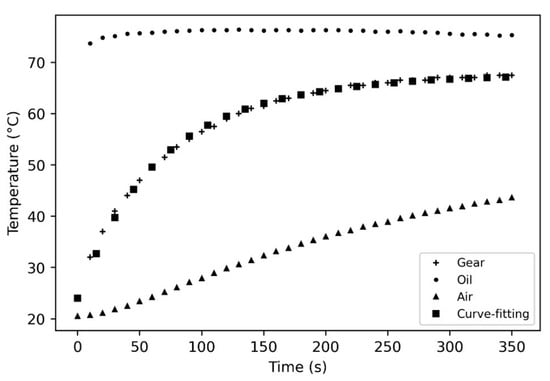
Figure 9.
Curve fitting for the temperature of the gear.
3.4. Convective Thermal Resistance
Once the time constant is determined, the thermal resistance (K/W) or product (W/K) between oil and the test sample is directly obtained by:
Experiments on the repeatability of the injection test bench measurements were carried out. These experiments were essential to ensure the validity and reliability of the obtained results, as well as to improve the performance of the method by identifying potential sources of error.
3.5. Measurement Error and Uncertainty
The error is calculated using the uncertainty range for type K thermocouples, i.e., ±0.5 °C. Once a test and its post-processing have been carried out, it is possible to determine the error induced on the product. By varying the temperature data by ±0.5 °C, the error which is induced on the product is very small: relative error less than 1%. Over several tests, an average of 0.8% relative error on the product was found with this experimental protocol, this post-processing, and this numerical curve-fitting method.
4. Results
4.1. Disc
4.1.1. Rotational Speed and Oil Flow Rate
Several experiments were conducted on the disc presented in Table 2 to investigate the influence of rotational speed and oil flow rate on heat exchange.
The characteristics of the test are shown in Table 6. As far as lubrication parameters are concerned, they were chosen to be in accordance with experiments conducted on a twin-disc machine []. A diagram to better understand the location of elements in the test bench can be seen in Figure 10. The nozzle is positioned at a distance L from the outer surface of the disc (or gear) and in the horizontal axis of the test sample center.

Table 6.
Experimental conditions of the oil flow (Disc).
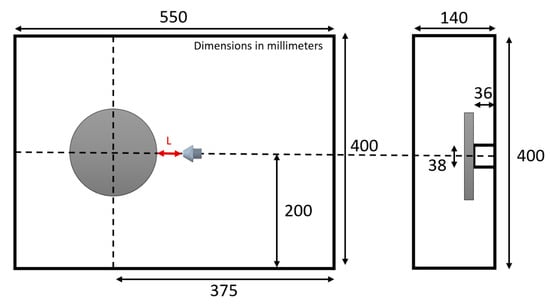
Figure 10.
Diagram of components location on the injection housing.
It is well known that convection heat transfer increases with turbulence. So, one can suppose that convection between oil flow and a rotating disc (in other words, product) will increase with oil jet flow and the rotational speed. It can be pointed out from Figure 11 that this behavior is confirmed with the injection rate, especially at higher speeds. As far as the rotational speed is concerned, an increase appears for limited values of N, whereas a small decrease/consistency is obtained from 1500 to 3000 rpm.
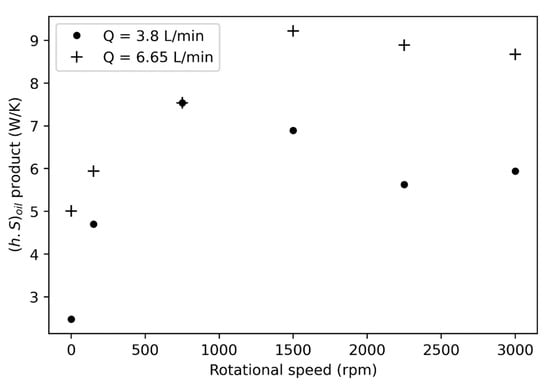
Figure 11.
Influence of disc rotational speed and oil flow rate on the thermal behavior.
4.1.2. Oil Jet Velocity
A second study investigated the impact of oil jet velocity on heat exchange. It was conducted by varying the nozzle diameter at a constant oil flow rate. The test characteristics are shown in Table 7.

Table 7.
Experimental conditions of the oil injection velocity study (disc).
In this test (Figure 12), the product increases with the oil injection speed, from 4.8 W/K for 1.0 m/s to 7.6 W/K for 16 m/s, which confirms that heat transfer increases with turbulence associated with oil jet flow. Nevertheless, a strong reduction in this slope is visible between 4 and 16 m/s.
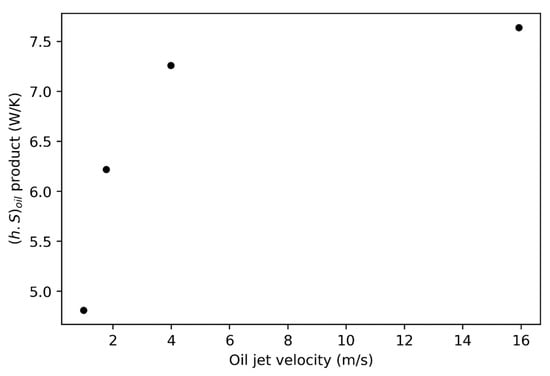
Figure 12.
Influence of oil jet velocity on the thermal behavior of a rotating disc.
It can be noted that when the oil jet is greater than the disc peripheral velocity, then the exchange is stagnated (the slope decreases).
4.2. Spur Gear
4.2.1. Rotational Speed and Oil Flow Rate
Similar to the disc, a gear was studied whose characteristics are given in Table 2.
The purpose of the test was to determine the impact of the oil injection flow rate at a constant oil flow rate and the gear rotational speed on its thermal behavior. The test parameters are presented in Table 8. As far as the gear is concerned, values were chosen to be in accordance with aeronautical applications [].

Table 8.
Experimental conditions of the oil flow (gear).
The post-processing of the different experiments allows Figure 13 to be plotted, which represents the product as a function of the gear rotational speed ranging from 150 to 5000 rpm.
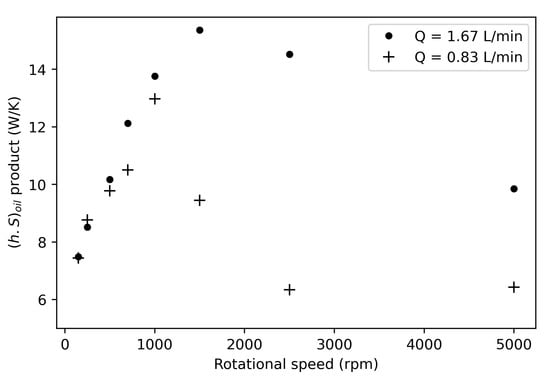
Figure 13.
Impact of oil injection rate and gear rotational speed.
In both flow rates (0.83 and 1.67 L/min), the same trend is observed. A first phase of increase in the product at low gear rotational speeds is seen for both oil injection rates. A second phase of stagnation and subsequent decrease in the product occurs beyond a certain gear rotational speed. The transition between these two phases occurs at different speeds depending on the oil flow rate (1000 rpm for 0.83 L/min and 1500 rpm for 1.67 L/min). At an oil flow rate of 0.83 L/min, the reduction is significant, from 13 W/K to 6 W/K. For an oil flow rate of 1.67 L/min, the reduction is equivalent, from a maximum of almost 15 W/k to 10 W/K. Similar to the results of the disc tests, these results confirm that oil convection heat transfer does not always increase with turbulence associated with gear rotation.
4.2.2. Oil Jet Velocity
A second study was conducted to investigate the impact of the oil jet velocity by varying the nozzle diameter at a constant flow rate (the oil jet velocity decreases as the nozzle diameter increases). The test characteristics are shown in Table 9. The results are shown in Figure 14.

Table 9.
Experimental conditions of the oil injection velocity study (Gear).
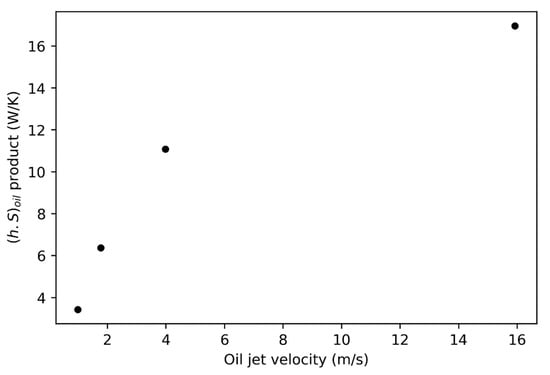
Figure 14.
Influence of oil jet velocity on the thermal behavior of a rotating gear.
Similar to the disc experiments, increasing the oil jet velocity at a constant flow rate increases the product.
4.3. Comparison with Existing Model (Gear)
The work of Blok [] provides a formulation of convection coefficient between oil and a rotating solid of the following form:
with Q = 0.8, a dimensionless coefficient corresponding to the amount of energy accumulated in the oil film in contact with a gear tooth and per unit width of that tooth given by Blok [].
The oil-wetted surface area on the gear is supposed to be the entire tooth profile except for the tooth flanks, as assumed by Von Plehwe et al. []. The contact surface area is obtained as follows:
with:
b: Tooth/gear width (m)
l: Length of the tooth head (m)
e: Length of the inter-tooth space at root circle (m)
: Height of the tooth (m)
Z: Number of teeth of the gear
The Blok model from Equations (8) and (9)) can be compared to the series of tests presented in Figure 13. It correlates with the experimental values (Figure 15) until at the second phase, with a decrease in the product occurring above (1000 rpm for 0.83 L/min and up to 1500 rpm for 1.67 L/min).
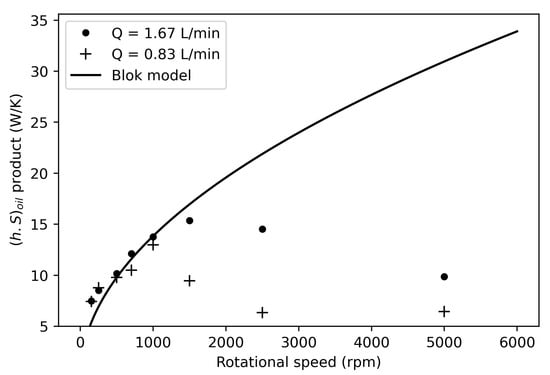
Figure 15.
Experimental values and Blok model [].
The experimental result corresponds to the trend of the Blok model with an increase in the product (i.e., an increase in the convection coefficient h because Blok’s formulation (8) does not consider any change in the exchange surface when the rotational speed is changed). The correlation between the experimental data and this model continues upward to about 1000 rpm for tests with an injection rate of 0.83 L/min and 1500 rpm for an oil injection rate of 1.67 L/min. Test results at higher rotational speeds are very distant from those of the model used.
This difference in the product in the second phase can be due to several explanations. In fact, considering the speed ratio between the rotational speed of the gear to the oil injection velocity, it may modify the surface wetted by the oil on the test sample.
A possible modification of the heat-exchange surface area can be analyzed through disc experiments. Indeed, a theoretical value of the convective heat transfer coefficient with oil can be calculated from the following relationship []:
Then, the theoretical value of the exchange surface can be found using this relationship:
This analysis confirms that the heat-exchange surface area S decreases with the test sample rotational speed: it is reduced by 35% when the disc rotational speed evolves from 1500 to 3500 rpm.
As far as gear is concerned, Akin [] highlights that the velocity ratio (12) can be used to characterize the oil penetration rate between two teeth and thus provide an estimate of the oil-wetted surface area between the oil and the gear. The higher the oil jet velocity against that of the gear (teeth), the more the oil penetrates the inter-tooth space and encounters the test sample surface. This depth of impact is also the cause of a certain amount of oil that remains trapped in the space between teeth, which is visible in Figure 5 both toward the injection zone and on the whole gear circumference, with projections and films of oil also visible on the left side of the picture.
The oil penetration rate between two teeth can be mitigated by the gear windage effect which increases with gear rotational speed []. Moreover, Dawsen [] and Pallas et al. [] found that it is more significant on the spur gear than on the disc because the windage phenomenon depends on the volumetric flow rate expelled by the teeth. Optimal parameters were identified, but no unique formulation was valid for all sample geometries. Further investigations must be conducted to study the influence of the windage effect.
5. Conclusions
A test bench was developed to investigate oil injection lubrication in mechanical transmissions. This injection bench enables the study of various types of gears at different rotational speeds, and the positioning of one or more oil-injection nozzles at different locations. Experiments were conducted on a rotating disk and a spur gear. The initial results obtained from this test bench allowed for the identification of influential parameters on the thermal resistance between oil and the test sample, such as injection flow rate, sample rotational speed, and injection nozzle diameter. These experiments highlighted that existing models which can be found in the literature can be consistent within certain operating conditions, but some discrepancies also exist due to the lack of consideration of all parameters in the analytical formulations. Indeed, at high rotational speeds, the convective heat transfer does not always increase with this parameter. Further investigations into the influence of multiple parameters and underlying models could help to control and understand the various phenomena (thermal losses and transfers) that occur during injection lubrication.
Author Contributions
Writing—original draft, T.T. (Thibaut Torres); Writing—review & editing, C.C., T.T. (Thomas Touret) and B.G. All authors have read and agreed to the published version of the manuscript.
Funding
This research was funded by the Direction Générale de l’Aviation Civile (DGAC), grant number 2022-42.
Data Availability Statement
Not applicable.
Acknowledgments
We would like to express our thanks to the anonymous reviewers for their work in processing this article.
Conflicts of Interest
The authors declare no conflict of interest.
Nomenclature
| thermal diffusivity [m2/s] | |
| b | width of the tooth [m] |
| heat capacity [J/kg·K] | |
| diameter [m] | |
| length of the inter-tooth space at root circle [m] | |
| convective exchange coefficient [W/m2·K] | |
| tooth height [m] | |
| l | length of the tooth head [m] |
| L | nozzle–mobile distance [mm] |
| mass of the test sample [kg] | |
| rotational speed [rpm] | |
| amount of energy accumulated in the oil film [-] | |
| radius [m] | |
| thermal resistance [K/W] | |
| heat exchange surface area [m2] | |
| temperature [°C] | |
| injection velocity [m/s] | |
| Z | number of gear teeth |
| thermal conductivity [W/m·K] | |
| kinematic viscosity [m2/s] | |
| time constant [s] | |
| angular speed of the gear [rad/s] | |
| thermal effusivity [N/ms1/2°C] | |
| Subscripts | |
| refers to air inside the housing | |
| disc | refers to aluminum disc |
| refers to the time in seconds from the beginning of the oil injection | |
| nozzle | refers to the injection nozzle |
| refers to oil injected into the housing | |
| refers to the theoretical calculation |
References
- Directorate-General for Mobility and Transport (European Commission); Directorate-General for Research and Innovation (European Commission). Flightpath 2050: Europe’s Vision for Aviation: Maintaining Global Leadership and Serving Society’s Needs; Publications Office: Copenhagen, Denmark, 2011. [CrossRef]
- Handschuh, R.F.; Kilmain, C.J. Preliminary Comparison of Experimental and Analytical Efficiency Results of High-Speed Helical Gear Trains. In Volume 4: 9th International Power Transmission and Gearing Conference, Parts A and B, Chicago, IL, USA, 2–6 September 2003; ASMEDC: New York, NY, USA, 2003; pp. 949–955. [Google Scholar] [CrossRef]
- Changenet, C.; Ville, F.; Velex, P. Thermal Behavior of a High-Speed Gear Unit. Gear Technol. 2016, 33, 38–41. [Google Scholar]
- DeWinter, A.; Blok, H. Fling-Off Cooling of Gear Teeth. J. Eng. Ind. 1974, 96, 60–70. [Google Scholar] [CrossRef]
- Patir, N.; Cheng, H.S. Prediction of the Bulk Temperature in Spur Gears Based on Finite Element Temperature Analysis. Asle Trans. 1979, 22, 25–36. [Google Scholar] [CrossRef]
- Long, H.; A Lord, A.; Gethin, D.T.; Roylance, B.J. Operating temperatures of oil-lubricated medium-speed gears: Numerical models and experimental results. Proc. Inst. Mech. Eng. Part G J. Aerosp. Eng. 2003, 217, 87–106. [Google Scholar] [CrossRef]
- Townsend, D.P.; Akin, L.S. Gear Lubrication and Cooling Experiment and Analysis. Previously Publ. J. Mech. Des. 1981, 103, 219–226. [Google Scholar]
- Xing, C.; Shaojun, L. Analysis of Bulk Temperature in High-Speed Gears Based on Finite Element Method. In Proceedings of the 2013 Fourth International Conference on Digital Manufacturing & Automation, Qindao, China, 29–30 June 2013; pp. 202–206. [Google Scholar] [CrossRef]
- Niemann, G.; Lechner, G. The Measurement of Surface Temperatures on Gear Teeth. J. Basic Eng. 1965, 87, 641–651. [Google Scholar] [CrossRef]
- Peng, J.; Liu, S.; Hu, X. The Bulk Temperature Analysis of the Involute Spur Gear Based on Parameterized Modeling of APDL. In Proceedings of the 2013 Fifth International Conference on Measuring Technology and Mechatronics Automation, Hong Kong, China, 16–17 January 2013; pp. 1146–1149. [Google Scholar] [CrossRef]
- Yang, D.; Liu, H.; Zhong, J.; Zhu, X.; Dai, Y. Influence of Nozzle Layouts on the Heat-Flow Coupled Characteristics for Oil-Jet Lubricated Spur Gears. Lubricants 2023, 11, 25. [Google Scholar] [CrossRef]
- Hu, X.; Li, P.; Quan, C.; Wang, J. CFD Investigation on Oil Injection Lubrication of Meshing Spur Gears via Lattice Boltzmann Method. Lubricants 2022, 10, 184. [Google Scholar] [CrossRef]
- Fondelli, T.; Andreini, A.; Da Soghe, R.; Facchini, B.; Cipolla, L. Volume of Fluid (VOF) Analysis of Oil-Jet Lubrication for High-Speed Spur Gears Using an Adaptive Meshing Approach. In Volume 7A: Structures and Dynamics; American Society of Mechanical Engineers: New York, NY, USA, 2015. [Google Scholar] [CrossRef]
- Fondelli, T.; Andreini, A.; Da Soghe, R.; Facchini, B.; Cipolla, L. Numerical Simulation of Oil Jet Lubrication for High Speed Gears. Int. J. Aerosp. Eng. 2015, 2015, 752457. [Google Scholar] [CrossRef]
- Dai, Y.; Ma, F.; Zhu, X.; Su, Q.; Hu, X. Evaluation and Optimization of the Oil Jet Lubrication Performance for Orthogonal Face Gear Drive: Modelling, Simulation and Experimental Validation. Energies 2019, 12, 1935. [Google Scholar] [CrossRef]
- Dai, Y.; Wu, W.; Zhou, H.B.; Zhang, J.; Ma, F.Y. Numerical Simulation and Optimization of Oil Jet Lubrication for Rotorcraft Meshing Gears. Int. J. Simul. Model. 2018, 17, 318–326. [Google Scholar] [CrossRef]
- Dai, Y.; Jia, J.; Ouyang, B.; Bian, J. Determination of an Optimal Oil Jet Nozzle Layout for Helical Gear Lubrication: Mathematical Modeling, Numerical Simulation, and Experimental Validation. Complexity 2020, 2020, 2187027. [Google Scholar] [CrossRef]
- Wang, Y.; Niu, W.; Wei, S.; Song, G. Influence of spin flow on lubricating oil jet—Design method of oil spray parameters to high speed spur gears. Tribol. Int. 2015, 92, 290–300. [Google Scholar] [CrossRef]
- Wang, Y.; Song, G.; Niu, W.; Chen, Y. Optimized design of spray parameters of oil jet lubricated spur gears. Tribol. Int. 2018, 120, 149–158. [Google Scholar] [CrossRef]
- Wang, Y.; Song, G.; Niu, W.; Chen, Y. Influence of oil injection methods on the lubrication process of high speed spur gears. Tribol. Int. 2018, 121, 180–189. [Google Scholar] [CrossRef]
- Keller, M.C.; Braun, S.; Wieth, L.; Chaussonnet, G.; Dauch, T.; Koch, R.; Hofler, C.; Bauer, H.J. Numerical Modeling of Oil-Jet Lubrication for Spur Gears using Smoothed Particle Hydrodynamics. In Proceedings of the 11th International SPHERIC Workshop, Munich, Germany, 14–16 June 2016; pp. 14–16. [Google Scholar]
- Liu, H.; Arfaoui, G.; Stanic, M.; Montigny, L.; Jurkschat, T.; Lohner, T.; Stahl, K. Numerical modelling of oil distribution and churning gear power losses of gearboxes by smoothed particle hydrodynamics. Proc. Inst. Mech. Eng. Part J J. Eng. Tribol. 2018, 233, 74–86. [Google Scholar] [CrossRef]
- Ji, Z.; Stanic, M.; Hartono, E.A.; Chernoray, V. Numerical simulations of oil flow inside a gearbox by Smoothed Particle Hydrodynamics (SPH) method. Tribol. Int. 2018, 127, 47–58. [Google Scholar] [CrossRef]
- Concli, F.; Gorla, C. A CFD analysis of the oil squeezing power losses of a gear pair. Int. J. Comput. Methods Exp. Meas. 2014, 2, 157–167. [Google Scholar] [CrossRef]
- Burberi, E.; Fondelli, T.; Andreini, A.; Facchini, B.; Cipolla, L. CFD Simulations of a Meshing Gear Pair. In Volume 5A: Heat Transfer; American Society of Mechanical Engineers: New York, NY, USA, 2016. [Google Scholar] [CrossRef]
- Von Plehwe, F.C.; Schwitzke, C.; Bauer, H.-J. Heat Transfer Coefficient Distribution on Oil Injection Cooled Gears: Experimental Method, Uncertainty, and Results. J. Tribol. 2021, 143, 091201. [Google Scholar] [CrossRef]
- Akin, L.S.; Townsend, D.P.; Mross, J.J. Study of lubricant jet flow phenomena in spur gears. In Proceedings of the ASME Lubrication Conference, Montreal, QC, Canada, 8–10 October 1974; p. 26. [Google Scholar] [CrossRef]
- Isaac, G.; Changenet, C.; Ville, F.; Cavoret, J.; Becquerelle, S. Thermal analysis of twin-disc machine for traction tests and scuffing experiments. Proc. Inst. Mech. Eng. Part J J. Eng. Tribol. 2018, 232, 1548–1560. [Google Scholar] [CrossRef]
- Navet, P.; Changenet, C.; Ville, F.; Ghribi, D.; Cavoret, J. Thermal Modeling of the FZG Test Rig: Application to Starved Lubrication Conditions. Tribol. Trans. 2020, 63, 1135–1146. [Google Scholar] [CrossRef]
- De Gevigney, J.D.; Changenet, C.; Ville, F.; Velex, P.; Becquerelle, S. Analysis of no-load dependent power losses in a planetary gear train by using thermal network method. In Proceedings of the International Gear Conference 2014, Lyon, France, 26–28 August 2014; Elsevier: Amsterdam, The Netherlands, 2014; pp. 615–624. [Google Scholar] [CrossRef]
- Diab, Y.; Ville, F.; Velex, P.; Changenet, C. Windage Losses in High Speed Gears—Preliminary Experimental and Theoretical Results. J. Mech. Des. 2004, 126, 903–908. [Google Scholar] [CrossRef]
- Dawson, P.H. Windage Loss in Larger High-Speed Gears. Proc. Inst. Mech. Eng. Part A Power Process. Eng. 1984, 198, 51–59. [Google Scholar] [CrossRef]
- Pallas, S.; Marchesse, Y.; Changenet, C.; Ville, F.; Velex, P. Application and validation of a simplified numerical approach for the estimation of windage power losses in spur gears. Comput. Fluids 2013, 84, 39–45. [Google Scholar] [CrossRef]
Disclaimer/Publisher’s Note: The statements, opinions and data contained in all publications are solely those of the individual author(s) and contributor(s) and not of MDPI and/or the editor(s). MDPI and/or the editor(s) disclaim responsibility for any injury to people or property resulting from any ideas, methods, instructions or products referred to in the content. |
© 2023 by the authors. Licensee MDPI, Basel, Switzerland. This article is an open access article distributed under the terms and conditions of the Creative Commons Attribution (CC BY) license (https://creativecommons.org/licenses/by/4.0/).