Article

Investigating the Performance of Glass Fibre-Reinforced Polymer (GFRP) in the Marine Environment for Tidal Energy: Velocity, Particle Size, Impact Angle and Exposure Time Effects

by
Talal F. Algaddaime
1,*,
Emadelddin Hassan
2 and
Margaret M. Stack
1
1
Department of Mechanical and Aerospace Engineering, University of Strathclyde, Glasgow G1 1XQ, UK
2
Agilent Technologies UK Ltd., Shropshire SY7 8NR, UK
*
Author to whom correspondence should be addressed.
Lubricants 2024, 12(11), 375; https://doi.org/10.3390/lubricants12110375
Submission received: 14 August 2024 / Revised: 22 October 2024 / Accepted: 26 October 2024 / Published: 30 October 2024

Abstract

:
Tidal energy, with its potential to provide a consistent energy output and reduce carbon emissions, has garnered significant interest. This study, which evaluates the performance of tidal turbine blades in seawater conditions and with sand particles, presents a novel approach. A slurry rig was developed to examine composite materials, and a glass fibre-reinforcement polymeric material was tested over a range of particle sizes, velocities, and impact angles. In addition, this paper used a new test protocol with 14 days (336 h) and 91 days (2184 h) of pre-exposure time of materials before testing. The results, which show significant changes in the erosive mechanisms of GFRP in short- and long-term pre-exposure time as a function of these variables, have profound implications for the design and performance of tidal turbine blades. The study also utilised scanning electron microscopy (SEM), depth profiling analysis, and erosion mapping techniques to compare the erosion behaviours of GFRP. These tools can be used to optimise such materials in tidal turbine conditions.

1. Introduction

Tidal stream energy has been recognised as a critical element in the European Union’s efforts to diversify its energy supply by shifting towards clean, low-carbon renewable sources and reducing reliance on fossil fuels [1,2]. According to the European Technology & Innovation Platform for Ocean Energy (ETIP Ocean) report, Europe could have a 100 GW wave and tidal energy capacity by 2050 [1]. This would fulfil 10% of Europe’s current electricity requirements. The UK has substantial tidal resources, and the effective and extensive utilisation of tidal energy has the potential to supply power to millions of households [1]. However, transforming energy generated from tidal currents into a viable and economically sustainable source of electricity presents numerous challenges, particularly in reducing device weight and capital expenditure.
Moreover, marine energy has notable benefits compared to other existing renewable energy sources. The predictability of marine tidal energy makes it highly reliable, and its development can be achieved without causing harm to natural ecosystems [3]. Tidal energy is an environmentally friendly source that harnesses the kinetic energy present in ocean currents. Tidal turbine blades generate power through the rotational motion caused by tidal currents [3]. Additionally, due to the greater density of seawater (813 times that of air), tidal turbines can generate significantly more power than wind turbines of the same size operating at identical impact velocities [4].
Despite tidal turbine devices providing clean, reliably forecasted renewable electricity with an anticipated operational lifespan of 20 years, turbine blades remain the most structurally critical elements of tidal turbine systems. Enhancing blade dimensions to augment energy efficiency or fortifying critically stressed blade parts to extend blade lifespan are both of paramount significance in the tidal energy industry [5].
The increasing use of composite materials can achieve these goals; however, a challenge remains in producing materials robust enough to withstand the harsh in-sea environmental conditions [6]. Additionally, before such technologies can be deployed globally, the tidal power sector still faces several challenges. These challenges can be categorised as operational, design, cost, reliability, materials, technical, and maintenance issues [7]. This underscores the importance of continued research and study into tidal energy, which is a valuable addition to renewable energy resources.
Polymer-based composites are widely used in various industrial and aerospace applications due to their low density, unique modulus of elasticity, and high specific impact strength [8,9,10,11]. Furthermore, the increasing demand for coastal infrastructure and the broader use of saltwater and sea sand, driven by the scarcity of freshwater and river sand resources, has intensified interest in these materials [12]. Fibre-reinforced polymer (FRP) composites have emerged as promising materials for coastal engineering, seawater, and sea sand concrete structures due to their advantageous properties, including being lightweight, their high strength, ease of installation, ultraviolet resistance, and especially their corrosion resistance [12]. FRP composites are produced in several forms, sheets, laminates, and bars, and typically consist of one of three fibre types: basalt, carbon, or glass, resulting in BFRP, CFRP, and GFRP, respectively [13].
Erosive wear is the term used to describe the removal of materials from a surface caused by the impact of particles. Multiple parameters influence impact erosion and involve various wear mechanisms [14]. Many studies have investigated and quantified the impact of various parameters on solid particle slurry erosion. These parameters can be categorised into slurry characteristics, target material properties, solid particle properties and impingement conditions [15]. The size, shape, and hardness of the eroding particles, as well as the impact velocity and impact angle of the erodent particles, are the main variables influencing the rate of material erosion [16,17,18,19].
As commonly found in the literature, solid particle erosion of materials distinguishes between brittle and ductile erosion [20]. Ductile erosion refers to material removal caused by cutting and ploughing, whereas brittle erosion occurs when material is removed due to crack formation. In polymer composite materials, it is commonly observed that their behaviour falls between two extremes: ductile matrix and brittle reinforcement. The specific behaviour of the material depends on factors such as the manufacturing process, the properties of the composite, and the level of erosion caused by impacting particles [21,22].
This paper examines the erosion performance of uncoated GFRP as used in tidal turbine blades. The innovation in this study was the testing around a range of variables, including impact angle, velocity and particle size and the development of erosion maps to forecast and understand the rate of erosion based on seawater-specific criteria. A new test protocol was employed, incorporating pre-exposure times of 14 days (336 h) and 91 days (2184 h). Erosion studies were conducted using irregular silica sand (SiC) particles in different size ranges (0–50 µm, 50–100 µm, and 100–150 µm) as the erosion agent, following a study of the components of UK coastal waters. The erosion damage was assessed at various impingement angles (15°, 30°, 45°, 60°, 75°, and 90°), representing the range of angles encountered by tidal turbine blades, along with varying impact velocities of 6.425 ms−1, 9.914 ms−1, and 12.5 ms−1, reflecting the typical velocities at the leading edge of the blade. SEM and depth profiling were used to reveal the morphology of the eroded specimens, and the resulting damage mechanisms are discussed.

2. Methodology

2.1. Slurry Erosion Impingement Rig

In this study, a slurry erosion rig was designed and developed at the University of Strathclyde in the tribology laboratory to simulate the conditions faced by tidal turbine blades, enabling the examination of composite materials and achieving the experiment’s aim of investigating erosion in harsh marine environments. The main components of the rig are as follows: a water tank container with two outlets at the bottom, one connected to the pump to deliver the solution to the specimen, and the other for cleaning the container after the test. A velocity control converter was integrated into the water pump to regulate velocities via frequency (Hz). Additionally, a dual impeller system was installed at the top to mix the sand and salt with the water during the test. To maintain a stable container temperature, an immersion cooler with a sensor was added, ensuring the temperature remained at 10 ± 1 °C. Figure 1 displays a photograph of the slurry erosion impingement rig.
The variables in this study include the effects of velocity and variations in the impact angle, ranging from 15° to 90°, to investigate the erosion mechanism. Additionally, the study examines ageing methods, with the material’s pre-exposure to an aqueous environment for 14 days (336 h) and 91 days (2184 h), respectively, to observe erosion from an ageing perspective. These ageing methods were selected based on an experimental study that demonstrated the impact of seawater absorption on the mechanical properties of GFRP [23]. Table 1 below presents the experimental parameters used in this study.

2.2. Material Selection

The GFRP-FR4 material manufactured by Holbourne Industrial Plastics selected in the experiment as a specimen is constructed from a woven glass fabric combined with a high-strength epoxy resin [24]. When selecting a material for a specific application, its characteristics must align with the requirements of the component’s purpose, the conditions in which it will be used, or the intended structure. Several factors influence the choice of materials for tidal current turbines, including component shape, required dimensional tolerance, and mechanical properties such as strength, stiffness, hardness, and fatigue resistance. Additionally, chemical properties, particularly those affecting corrosion resistance, and physical properties such as density, must also be considered. Life cycle costs, including ease of manufacture, material costs, maintenance, and ease of installation and removal, are equally important factors in the decision-making process [3].
GFRP is commonly used in the construction of turbine blades due to its ability to provide the necessary structural stiffness for large constructions, while maintaining the lightweight properties required for complex geometries. As indicated in the datasheet shown in Table 2 [24], the material is designed to offer favourable mechanical strength and excellent electrical properties, combined with high impact and humidity resistance at operating temperatures of up to 130 °C. Table 2 below presents the technical data and the mechanical and electrical properties of GFRP-FR4.

2.3. Experiment Approach

The specimen dimensions used in this study were 26 × 36 × 5 mm, cut from an FR4 epoxy glass laminate sheet using a waterjet cutting machine. The edges of the specimens were polished using 1200-grit silicon carbide (SiC) paper to achieve a high-quality surface finish and mitigate the risk of erosion, as these areas were not the focus of the testing. All specimens were then cleaned with tap water to remove any impurities and sediments, and the surfaces were subsequently dried with a hygienic flat-sheet paper towel to eliminate dust. This process was carried out meticulously to prevent the formation of scratches on the surfaces. Each test was carried out three times to ensure accurate reproducibility of results. Finally, the mass of the specimens was measured three times, using BM252 micro-analytical balances, with a repeatability (standard deviation) of approximately 0.03 mg (for 100 g). The impingement velocity of the specimens was calibrated five times using the following equation.
Q = A V
where:
Q : refers to the liquid flow rate measured as L s ; A : refers to the area of the pipe or channels in m 2 ; V : refers to the velocity of the liquid in m s .
Figure 2 below shows some images of the specimens after the test for 14 days (336 h) pre-exposure.

3. Results

3.1. Mass Loss Measurement for 14 Days (336 h) Pre-Exposure

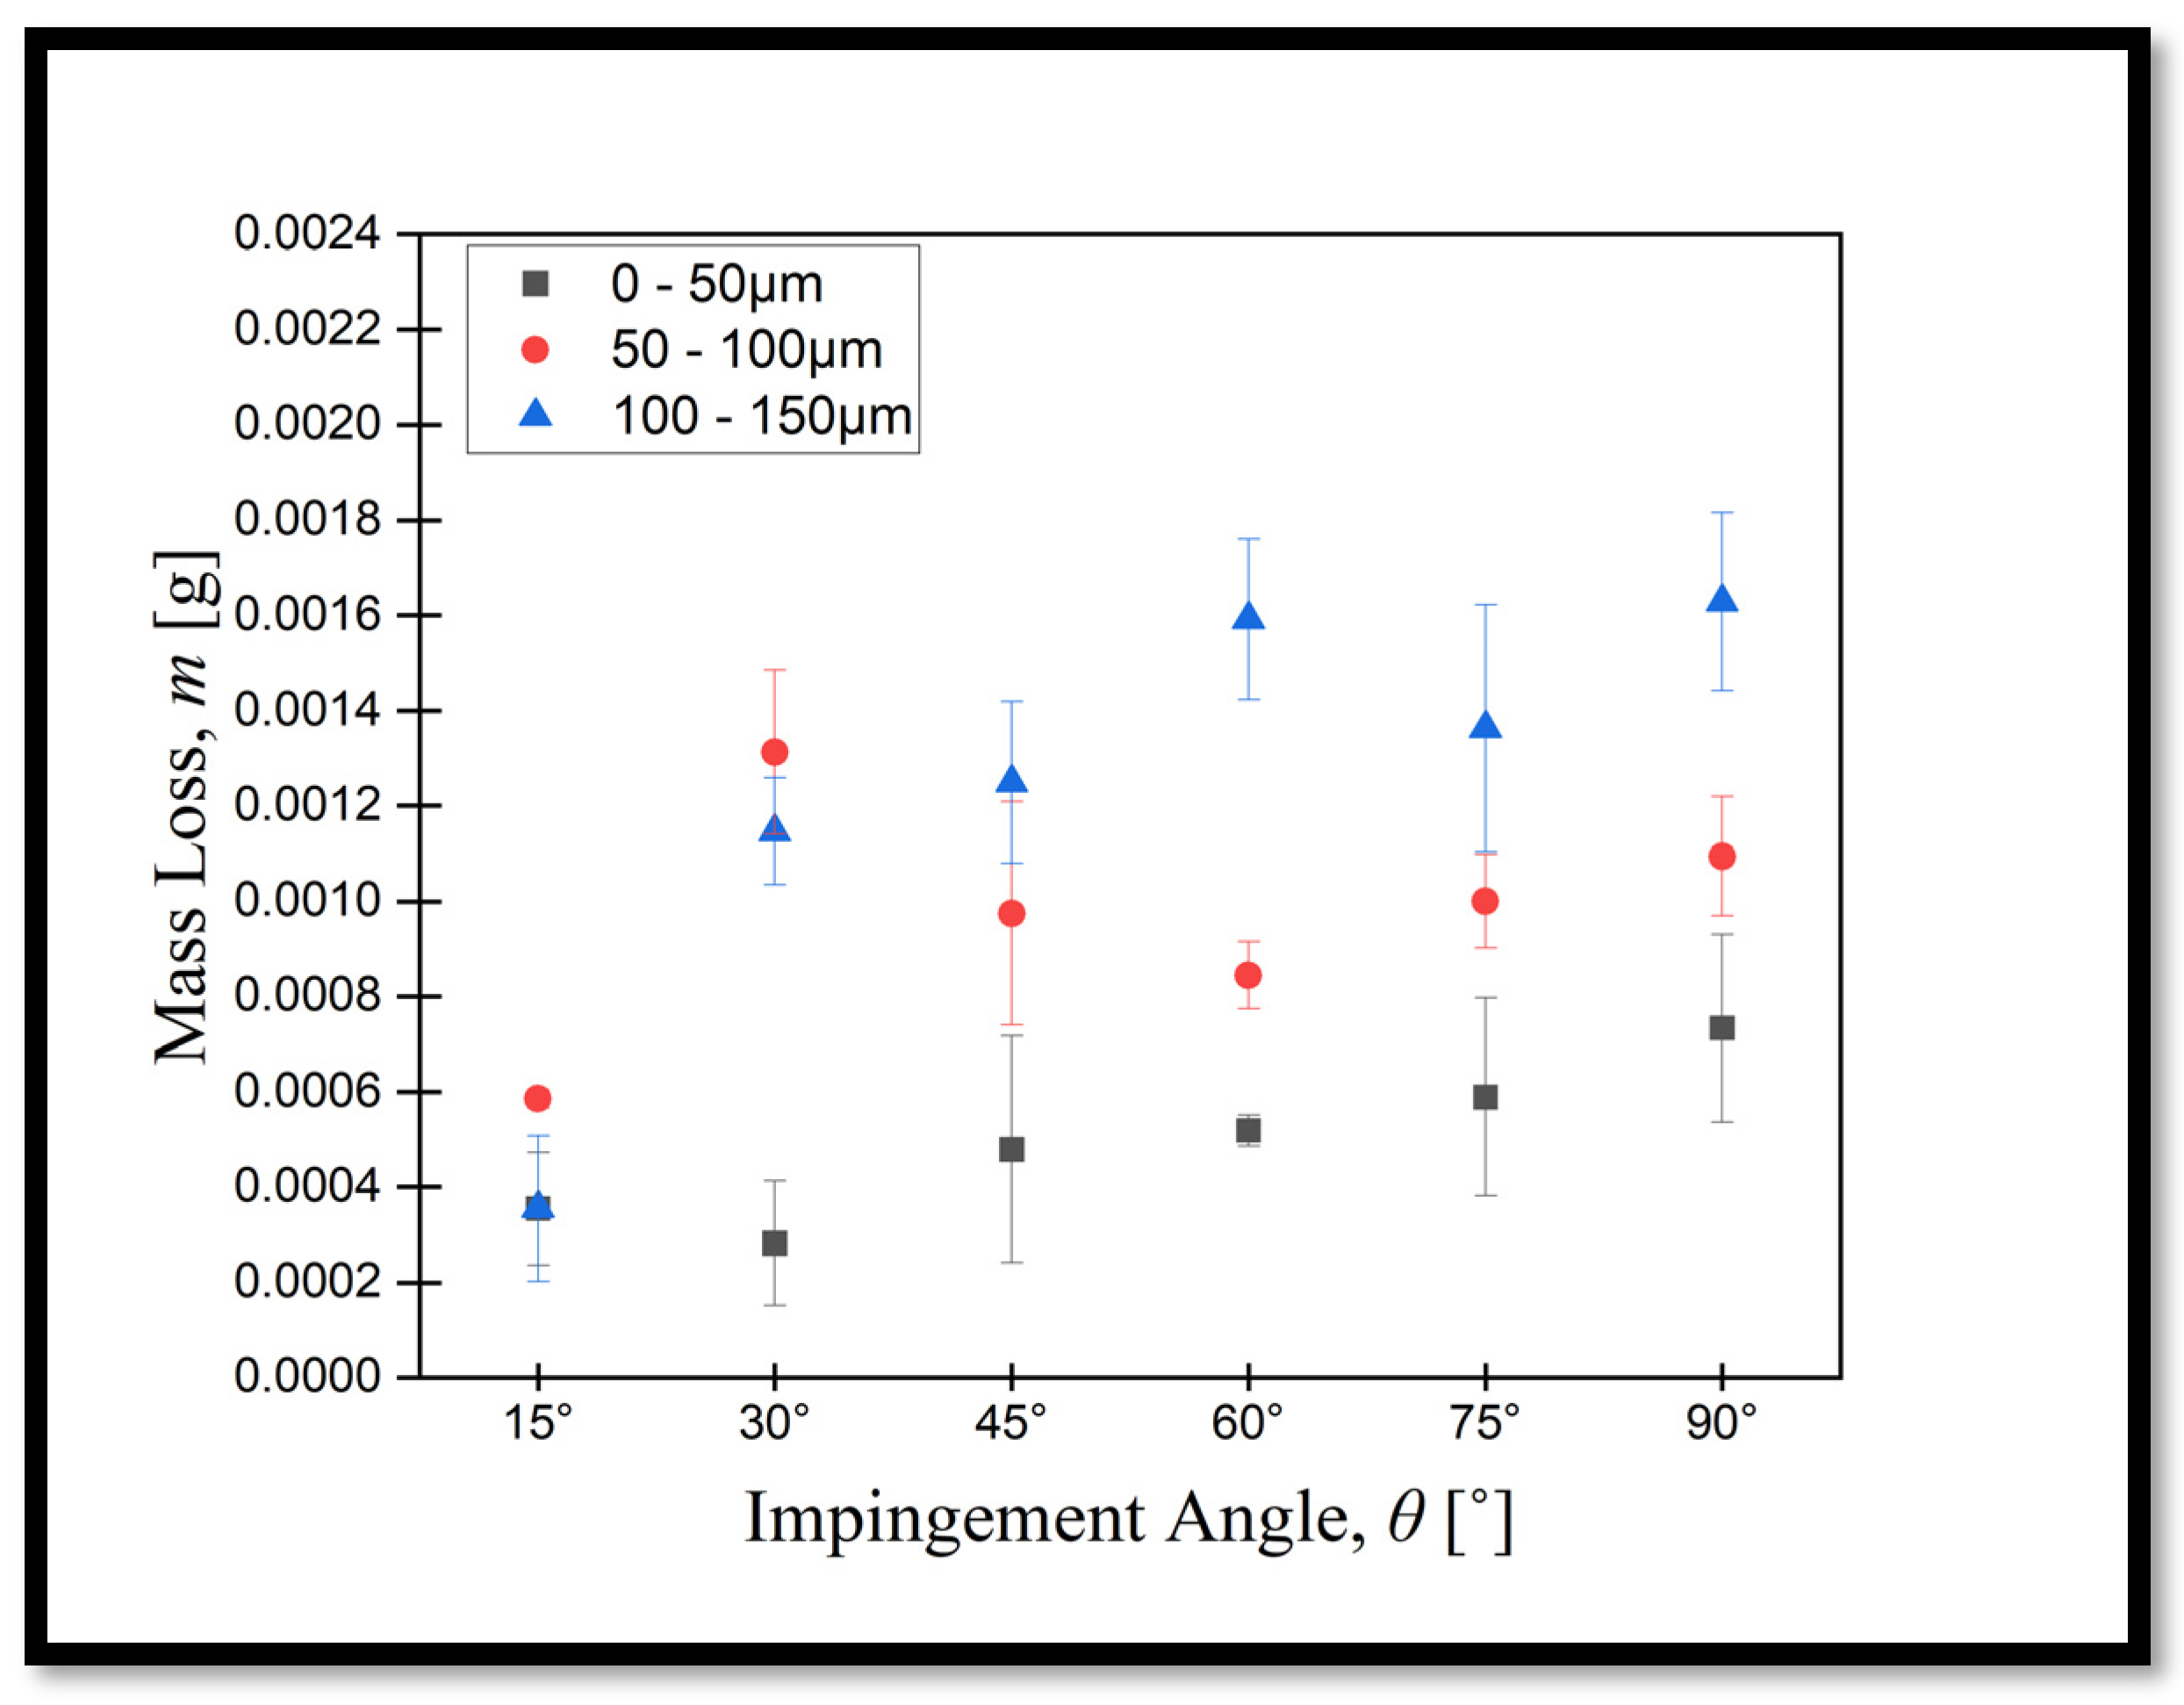
Figure 3, Figure 4 and Figure 5 illustrate the mass loss per gram of abrasive particle for GFRP specimens after a 14-day pre-exposure duration. The pattern of erosion with impact angle is depicted in Figure 3; specifically, within the sand particle size range of 100–150 µm and a velocity of 6.425 ms−1, the maximum erosion rate occurred at a 90° angle of attack, with the lowest erosion observed at 15°. In the meantime, in the 50–100 µm sand particle size range at the same velocity, the highest erosion rate was recorded at a 30° angle of attack as a consequence of erosive wear of the specimen. Notably, for the 0–50 µm range, a higher erosion rate was evident at 90°, contrasting with a lower erosion rate at 30°.
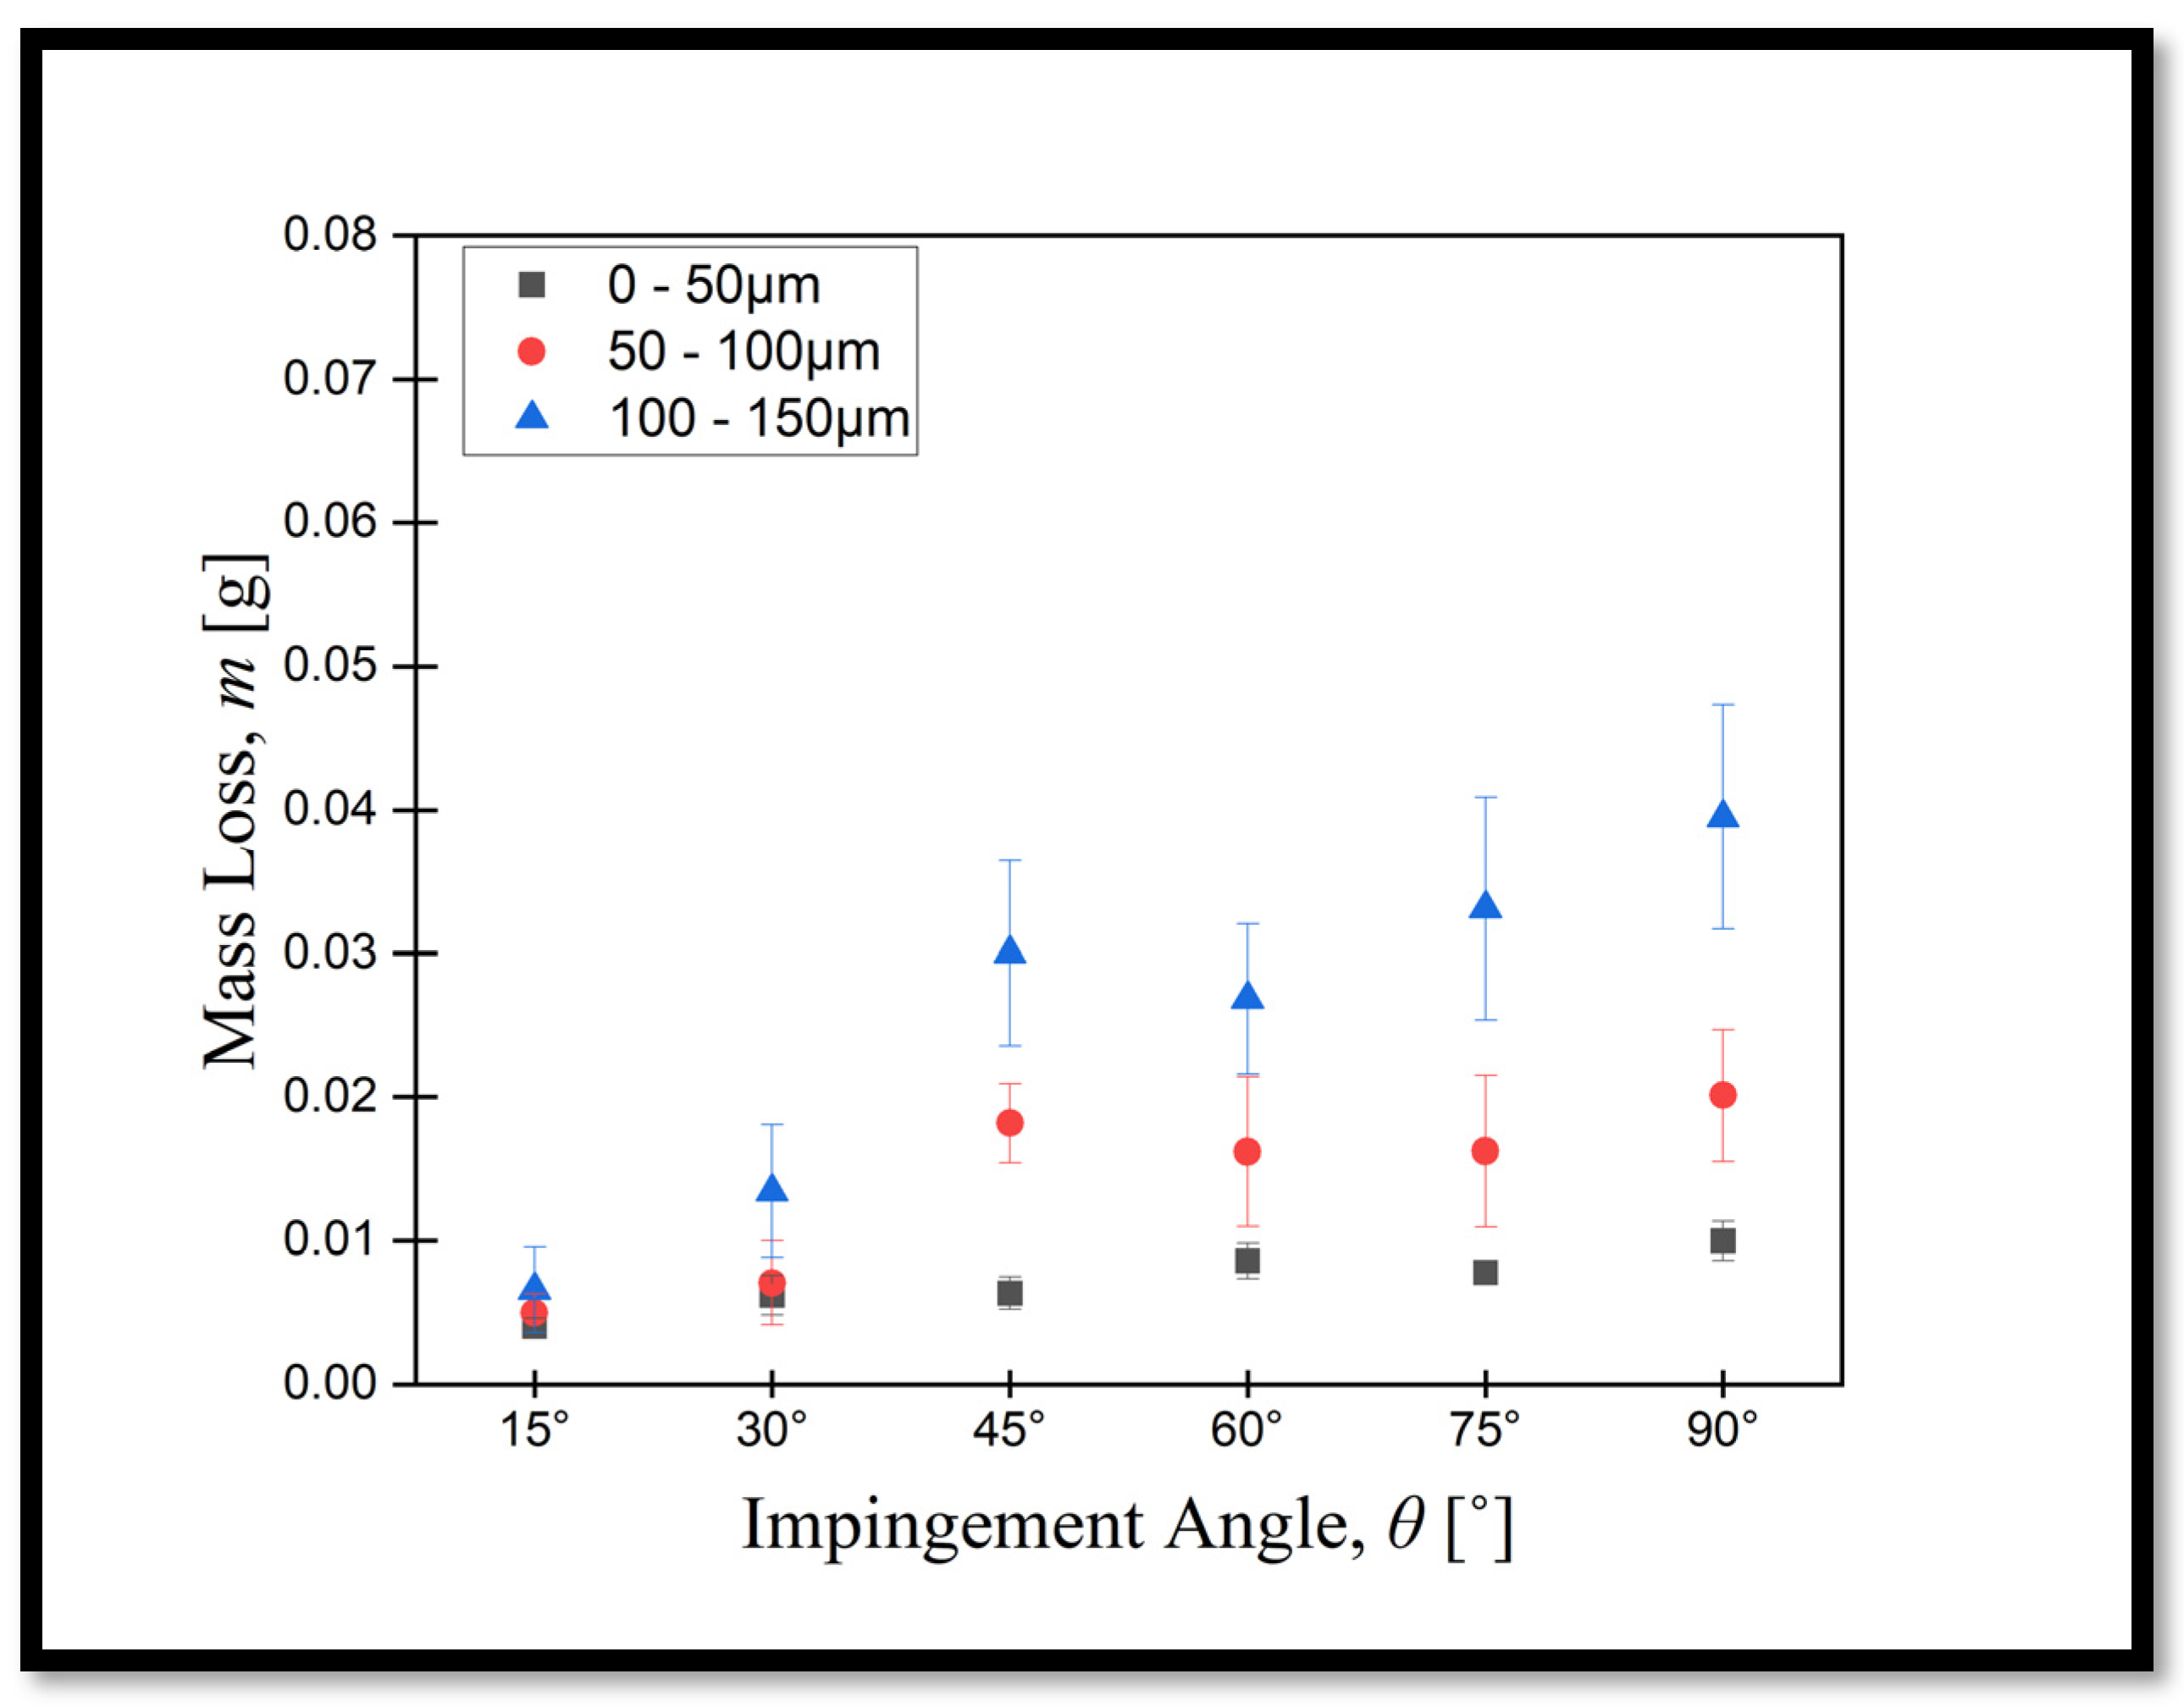
Figure 4 shows a distinct shift in the erosion mechanism compared to Figure 3. It is evident that within the sand particle size ranges of 100–150 µm, 50–100 µm, and 0–50 µm with a velocity of 9.914 ms−1, the peak erosion occurs at a 90° angle of attack. On the other hand, the lowest erosion rates are observed at 15° for all sand size ranges. In addition, although three different sizes of sand were used in the test, at 45°, the erosive wear remained the same. The material exhibits a transition between ductile and brittle erosion processes at average angles. At 45°, both ductile cutting and brittle cracking may occur at the same time. The particles impact the surface with sufficient force to create fractures (brittle erosion), while in parallel sliding over the surface to facilitate material removal by ploughing or cutting (ductile erosion). This amalgamation of both processes leads to increased erosion rates relative to lower angles; however, these are not as severe as that observed at the 90° impact angles when brittle fracture prevails [27].
In Figure 5, the trend at a velocity of 12.5 ms−1 is shown alongside varying sand particle sizes in the ranges of 100–150 µm, 50–100 µm, and 0–50 µm. When comparing Figure 3 and Figure 4, the highest erosion rate consistently occurs at a 90° impingement angle, indicating no significant changes in this regard. However, there are notable differences in the lowest erosion rates, where, for all sand particle size ranges, the angle associated with the lowest erosion is consistently recorded at 15°. All examined samples exhibit a predominantly brittle response, with maximum erosion rates observed at angles from 75° to 90°.

3.2. Mass Loss Measurement for 91 Days (2184 h) Pre-Exposure

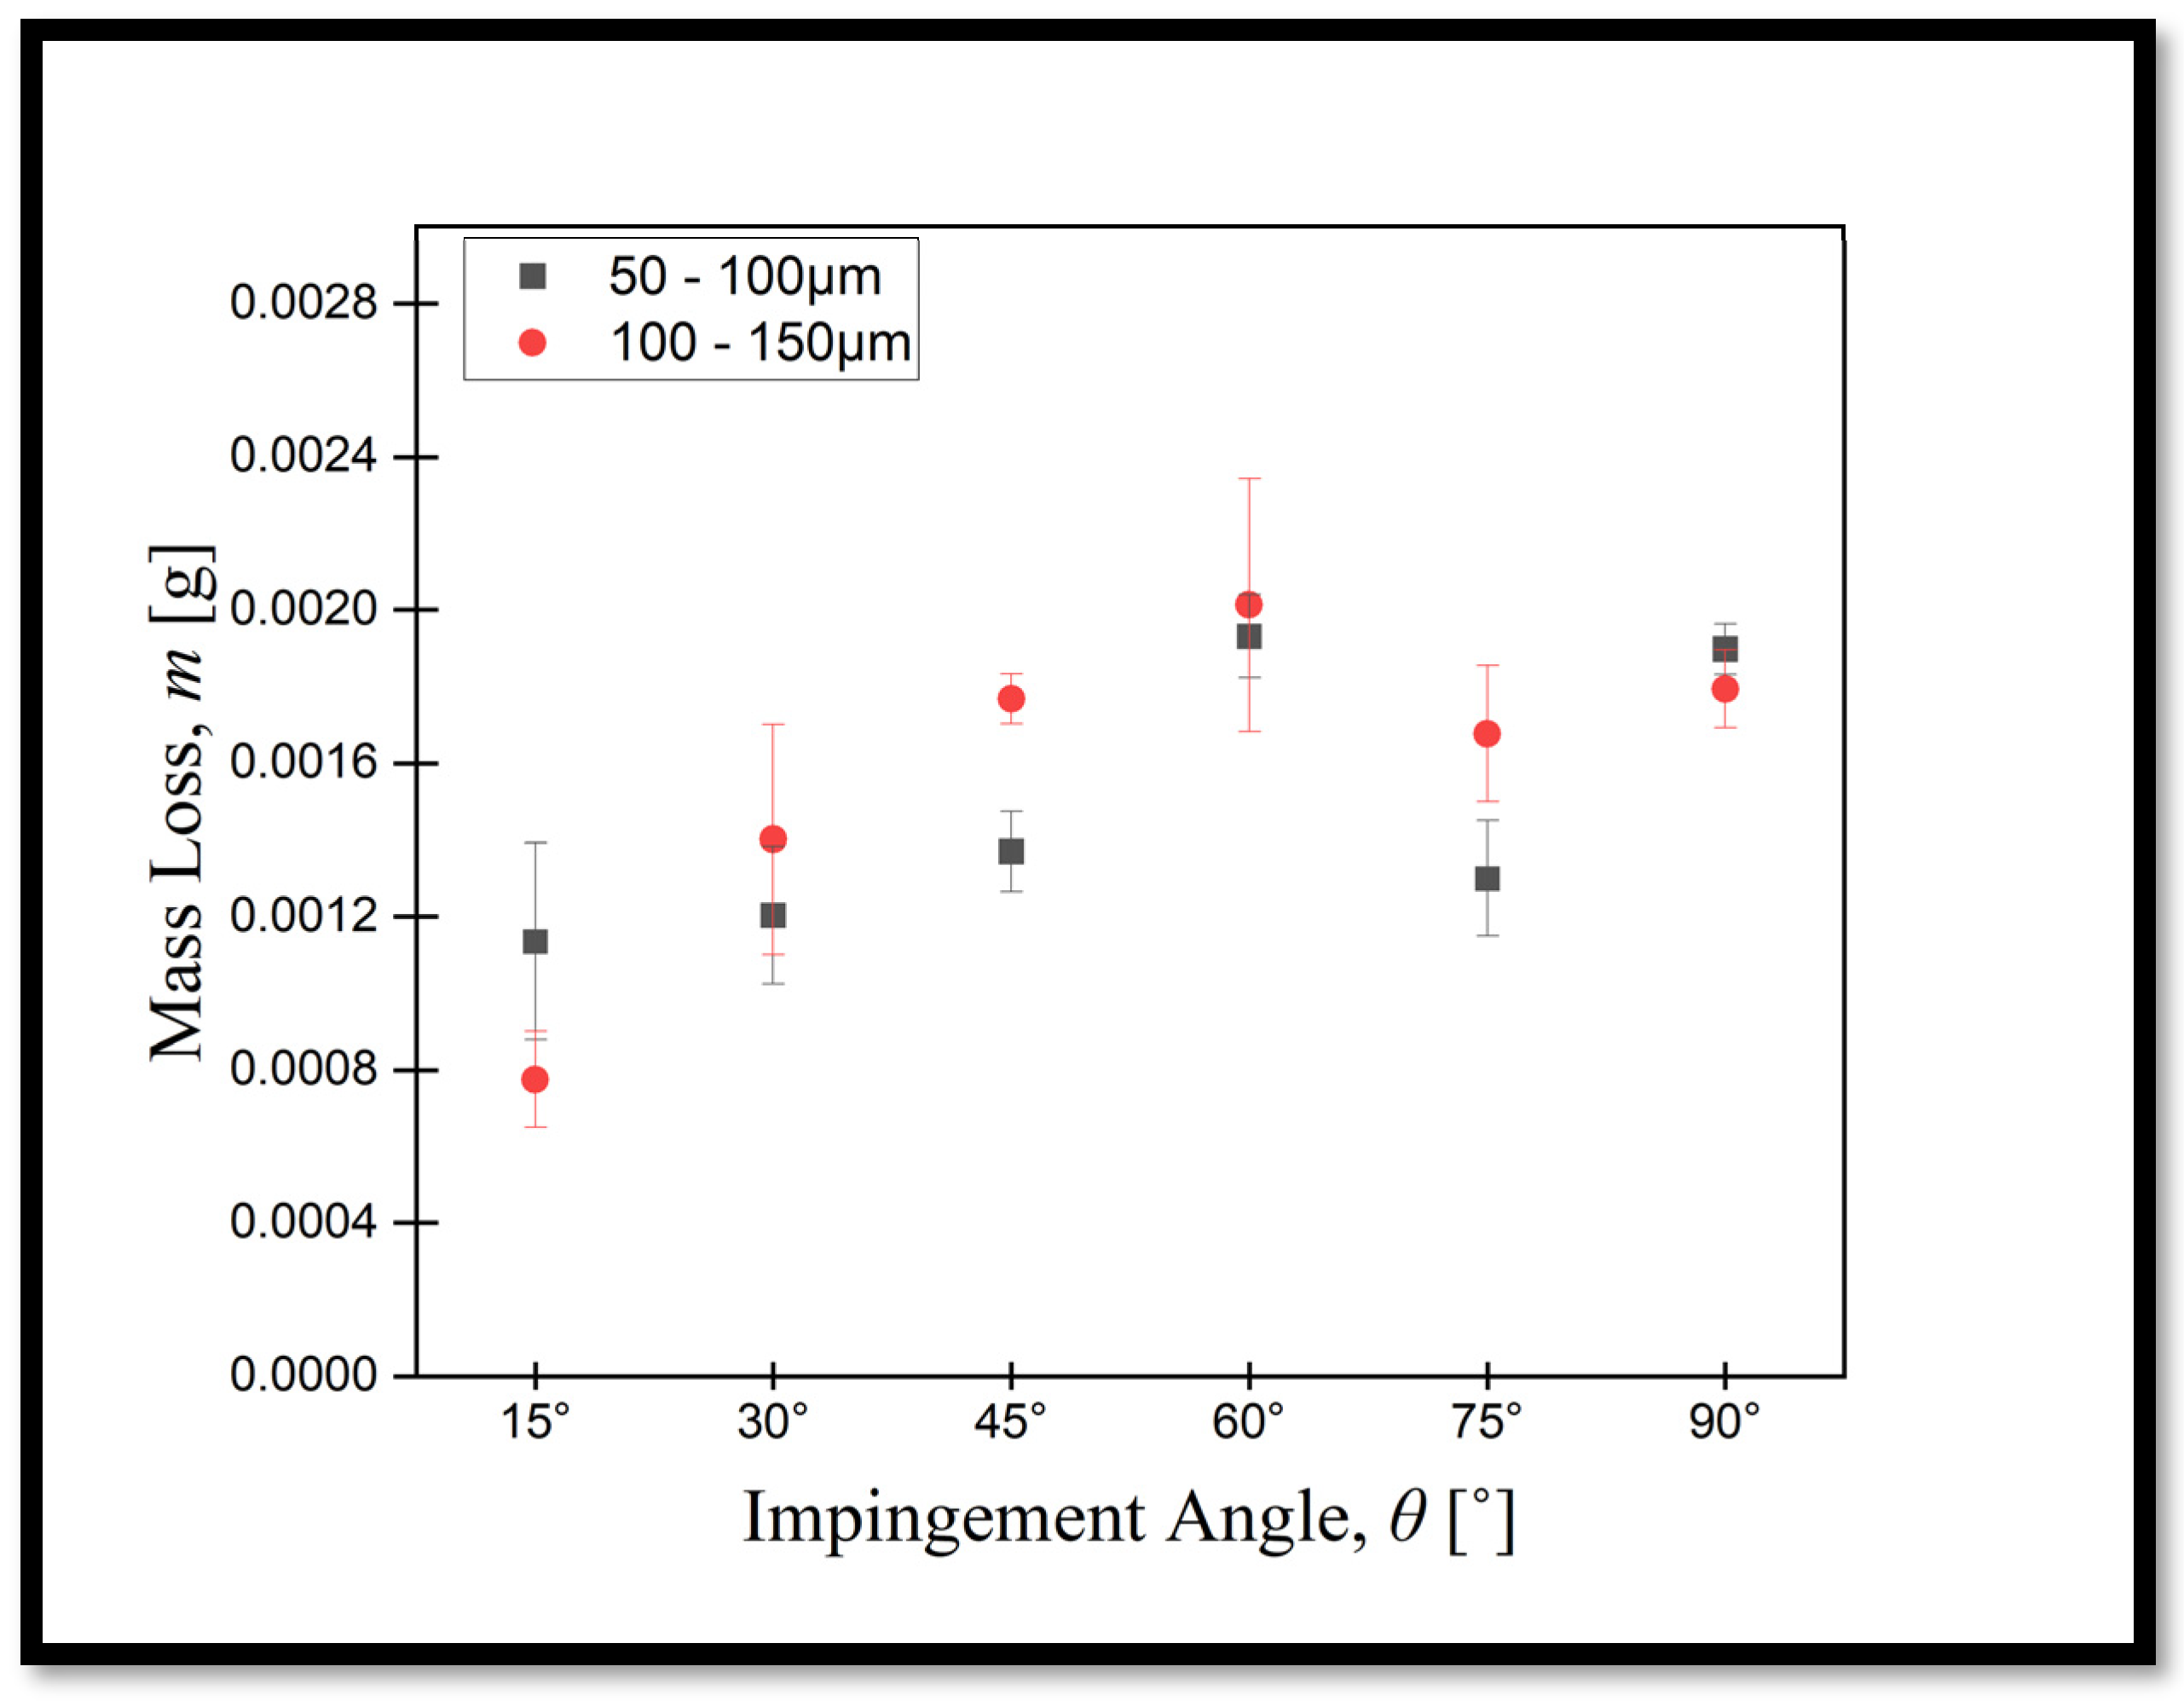
During the second stage, the GFRP specimens were also examined and tested after being immersed in water for 91 days (2184 h). The same test parameters from the first stage 14 days (336 h) were applied, but only two sand particle sizes, 50–100 µm and 100–150 µm, were used instead of three. In addition, two velocities, 6.425 ms−1 and 9.914 ms−1, were employed instead of three. Figure 6 and Figure 7 display the results for mass measurements, impact angles, and mass loss.
Figure 6 displays an atypical pattern in mass loss at a velocity of 6.425 ms−1: the largest point of mass loss occurred for sand particles measuring 100–150 µm at an angle of 60°. Nevertheless, when the impact angle was at 15°, the reduction in mass was at its minimum and was lower than that observed for sand particles measuring 50–100 µm. Moreover, there is a reduction in the mass loss as the impact angle changes from 60° to 75°. Figure 7 illustrates the reduction in mass when moving at a velocity of 9.914 ms−1, using sand particles ranging in size from 50–100 µm and 100–150 µm. Despite the sand particle size of 100–150 µm being higher than the sand particle size range of 50–100 µm, there is a lower mass loss when the impact angles range from 15° to 30°. Furthermore, when the impact angle reaches 75°, the mass loss is considered at its peak at both sand sizes.

3.3. Scanning Electron Microscope (SEM) and Depth Profiling Analysis

Mass loss measurements can be used to estimate the extent of erosion. The specimens were further examined to gain a better understanding of the observations made throughout the experiment. A scanning electron microscope (SEM) (Hitachi S-3700) was used for optical surface analysis, while the Keyence VHX7000 was used for depth profiling. Figure 8 and Figure 9 present images from the SEM and depth profiling analyses after the 14-day (336 h) pre-exposure stage.
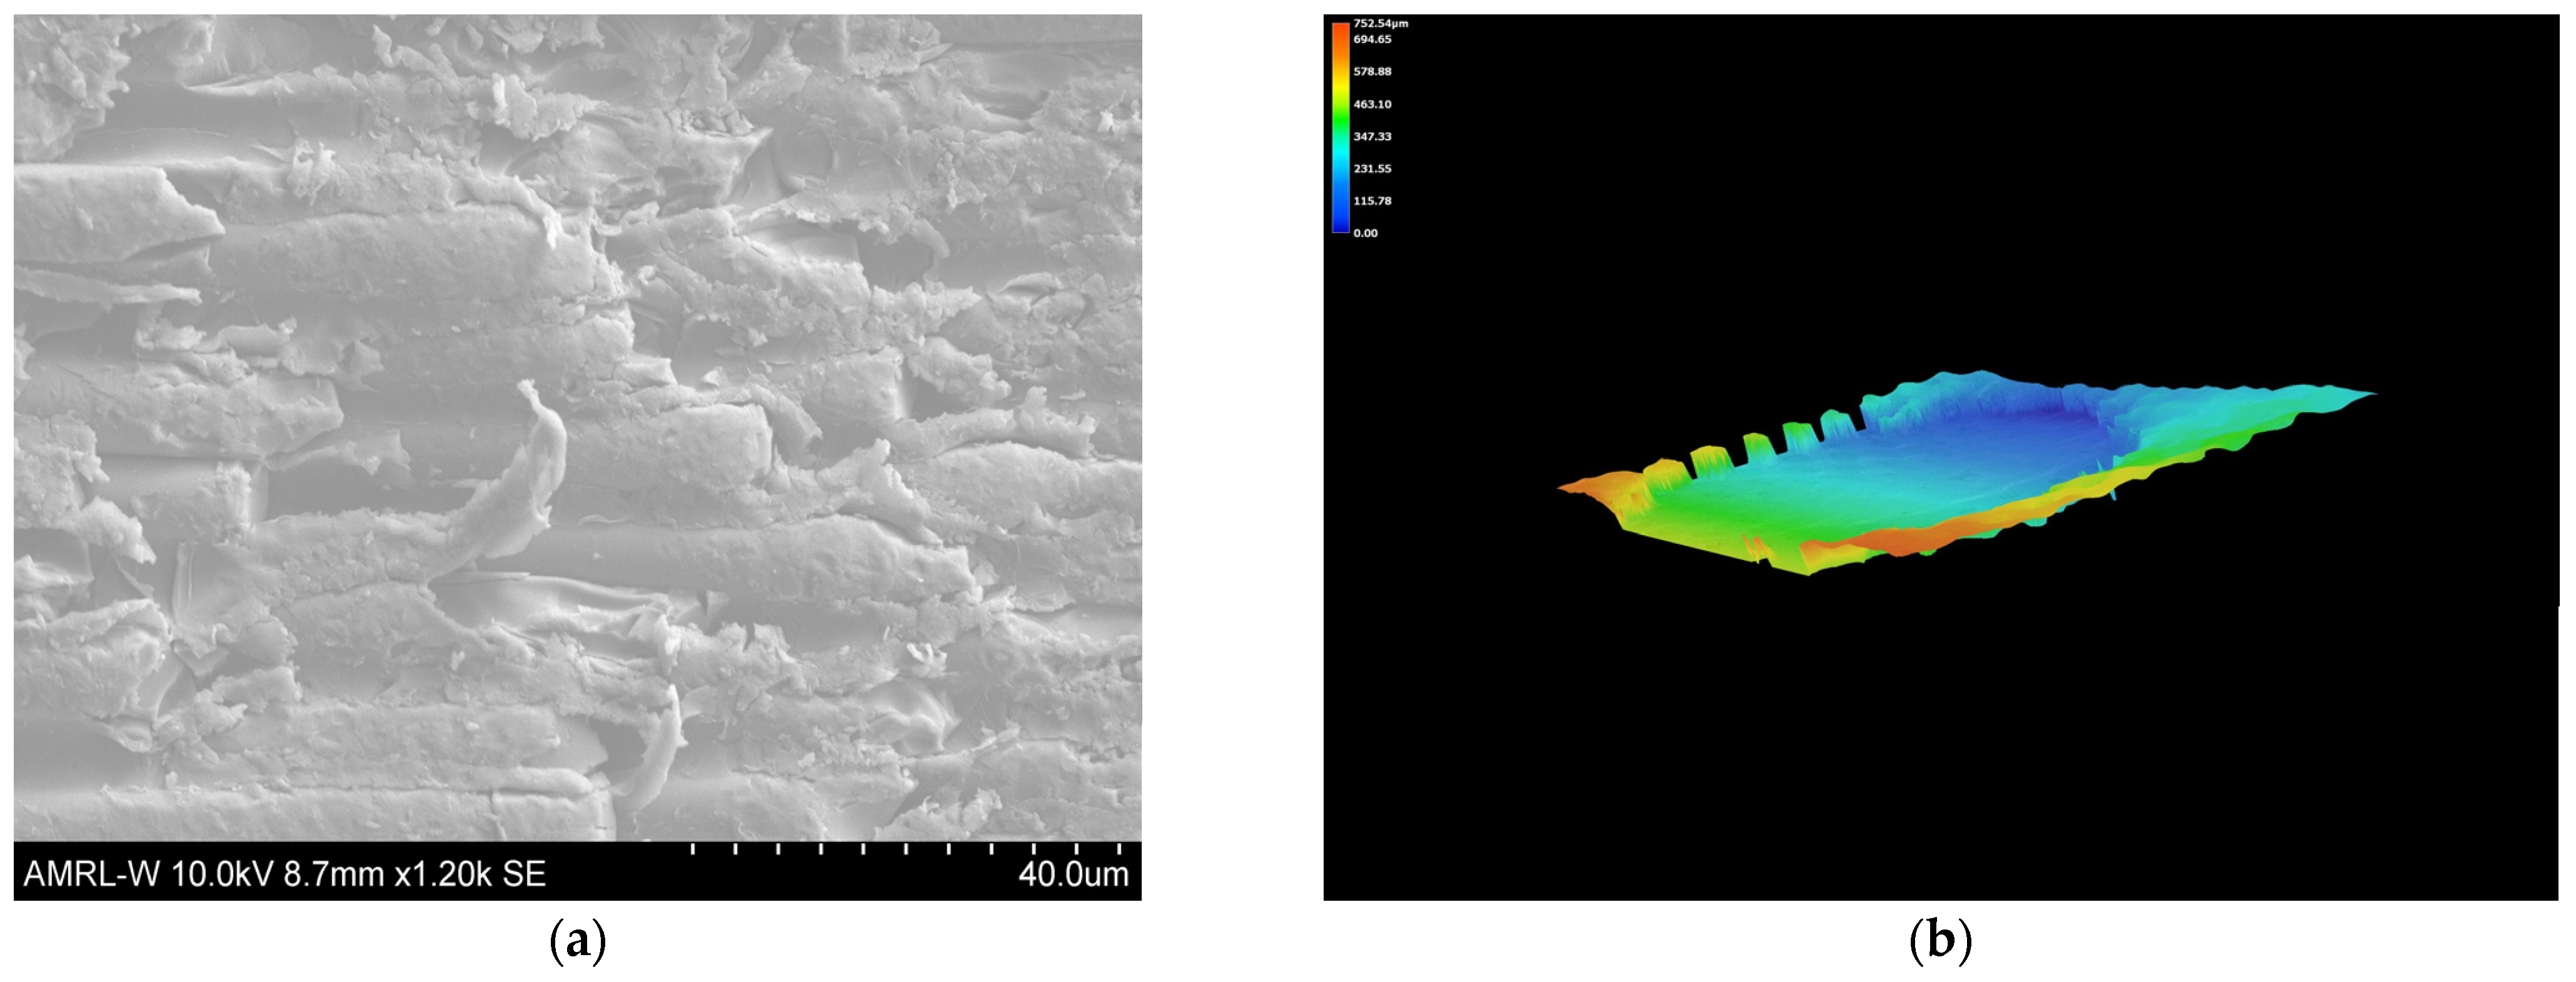
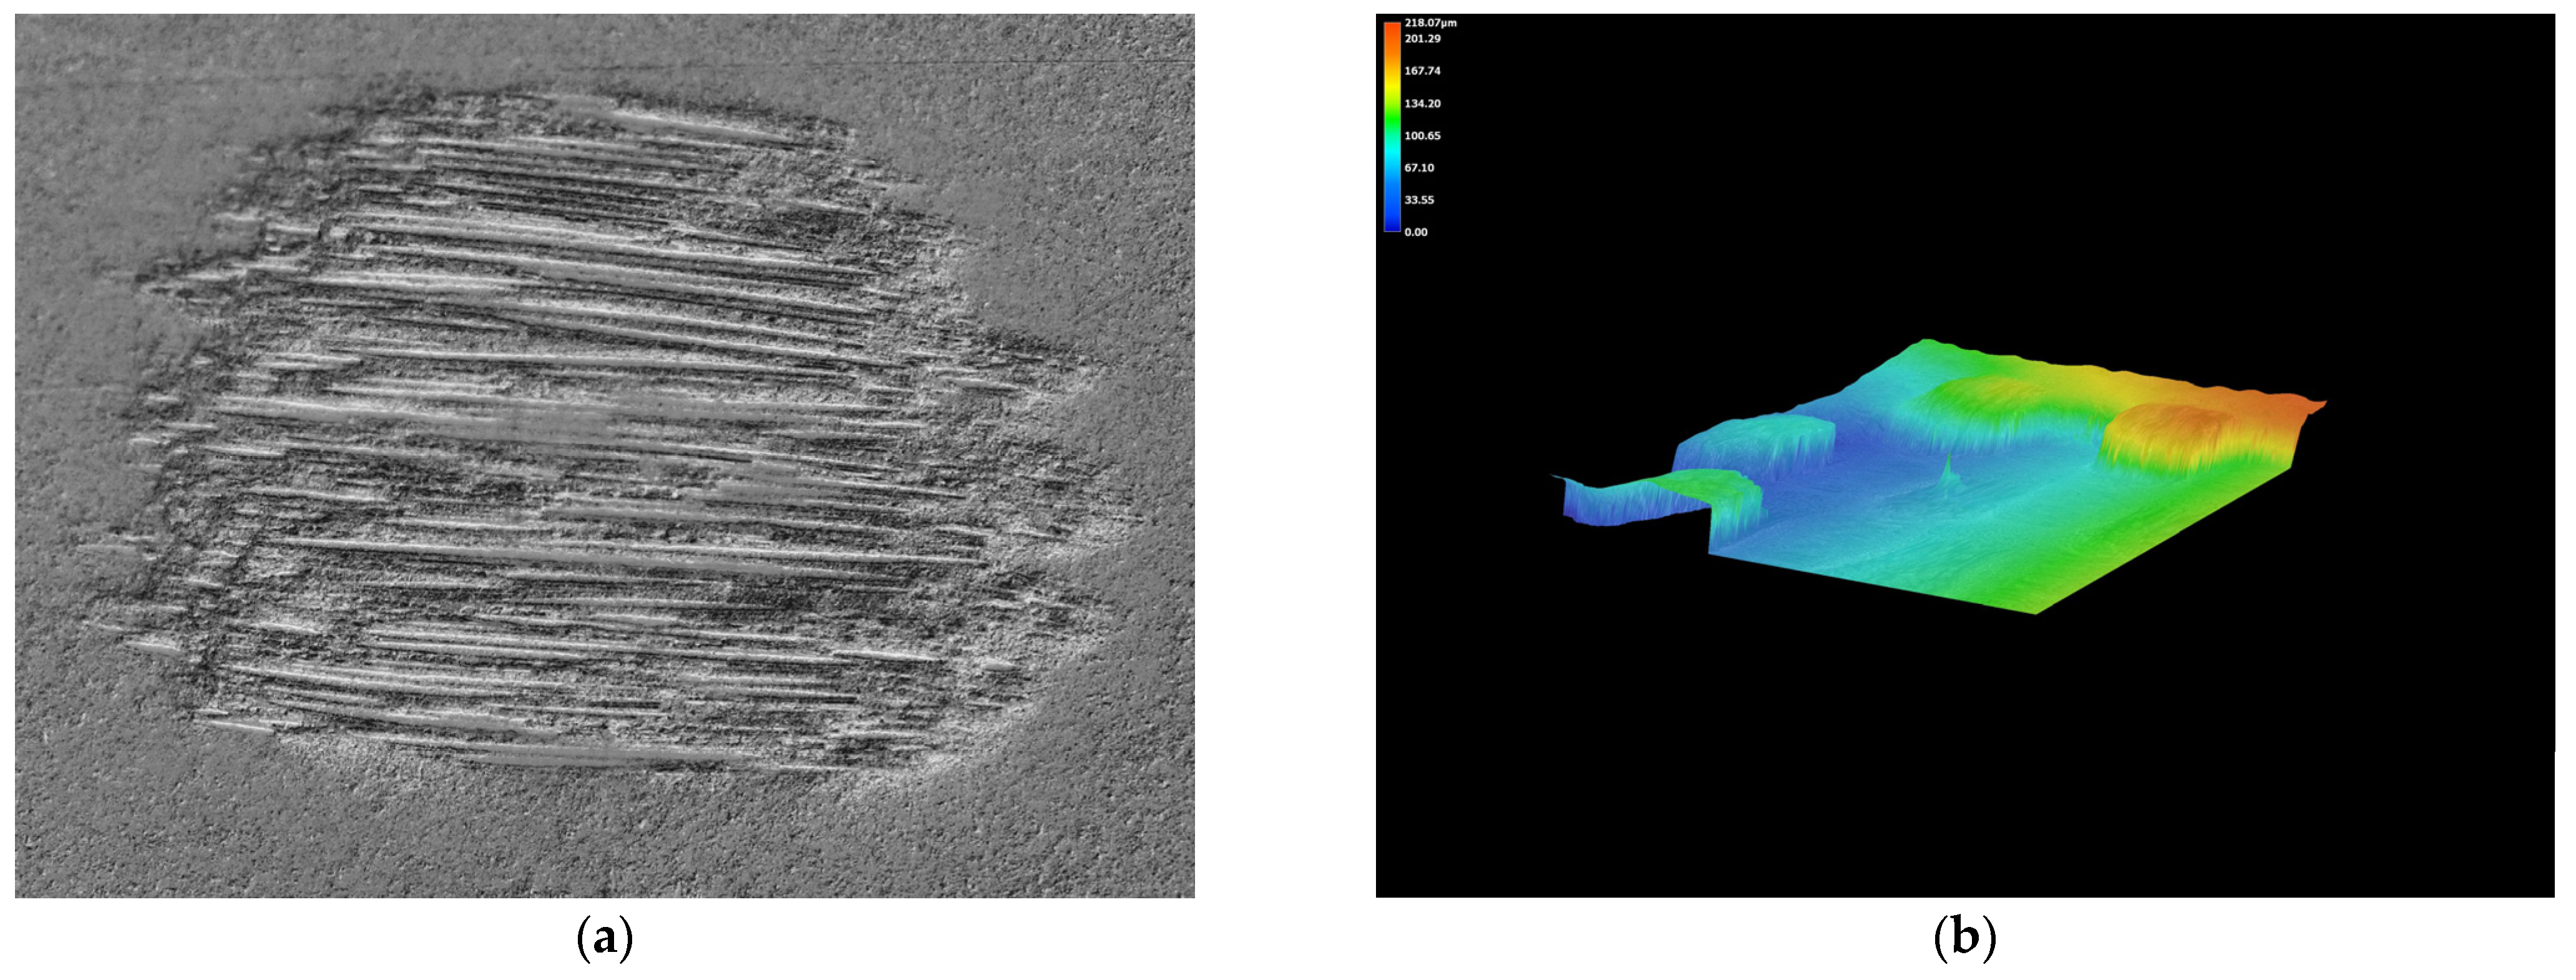
Figure 10 below illustrates the harsh cutting action of the erodent. Additionally, the severe brittle fractures are a result of this cutting action. Figure 11 below shows images of the specimen after depth profiling. The aggressive marine environment at a 75° angle altered the specimen shape, making the erodent cutting action more apparent.

3.4. Erosion Wastage Maps

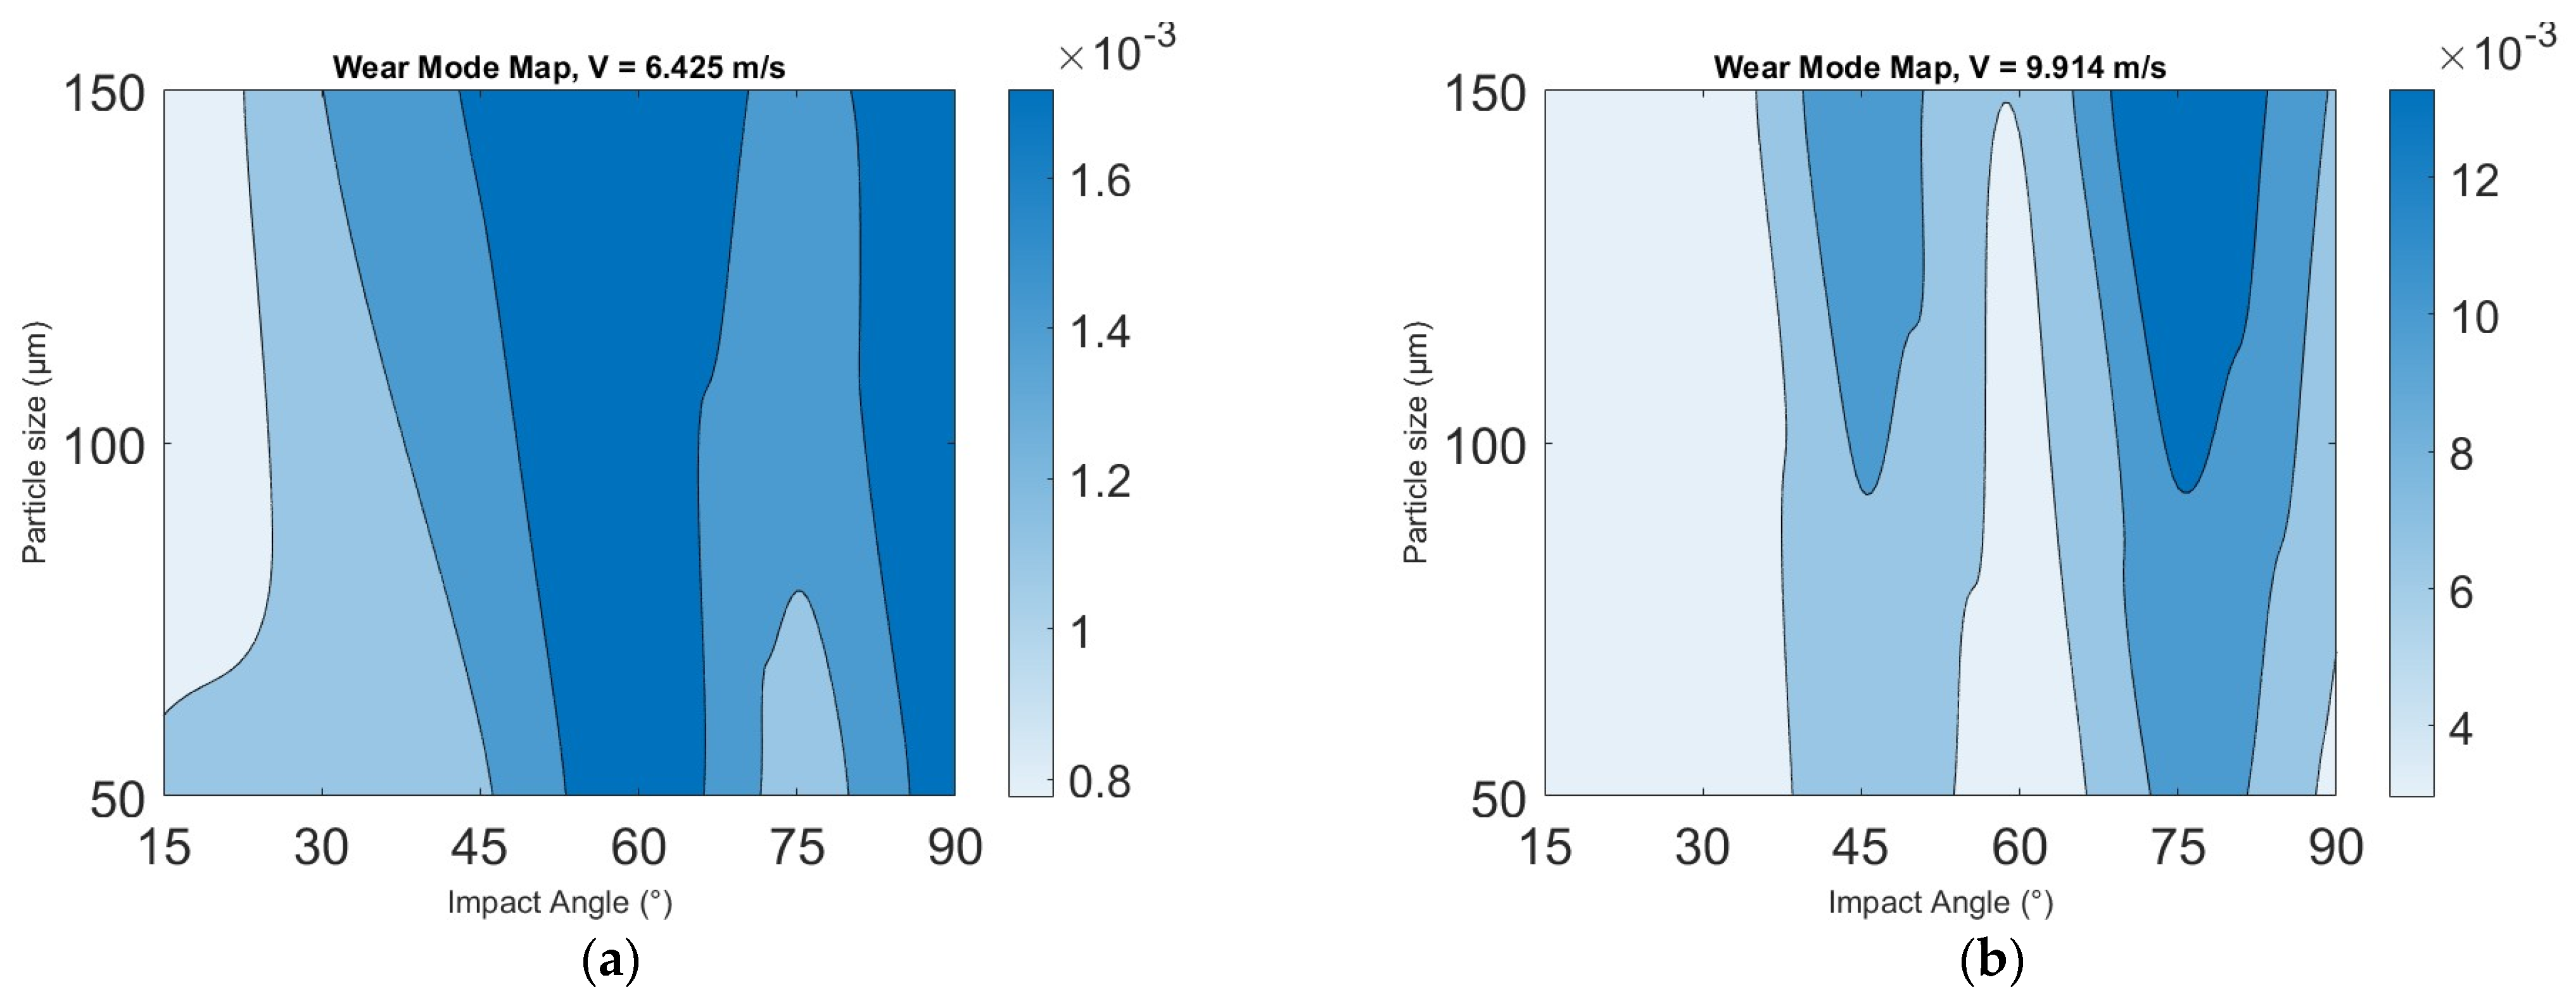
Wear maps demonstrate the mechanistic transformation occurring on the deteriorated surfaces of specimens under several operating conditions [28]. The authors Rasool et al. outline the construction of these maps and the procedures followed in the study [29]. This visualisation technique enables operators to forecast the safety level during tidal turbine blade operation. Figure 12 below shows the erosion maps of impact angles from the range of 0° to 90° and sand particle sizes of 0–50 µm, 50–100 µm and 100–150 µm. In addition, each map shows the impact velocities of 6.425 ms−1, 9.914 ms−1, and 12.5 ms−1, which were used on the test for 14 days (336 h) of submersion duration.
Moreover, the 91 days (2184 h) pre-exposure erosion wastage maps were found at velocities of 6.425 ms−1 and 9.914 ms−1 for sand particle sizes of 50–100 µm and 100–150 µm, as shown in Figure 13a,b.

4. Discussion

4.1. Trends on the Effect of Particle Size, Velocity, Impact Angle and Exposure Time

While considering these parameters, this paper additionally considered specimen exposure time, as Rasool et al. recommended [6]. Diagrams 3, 4, and 5 show mass loss as a function of impact angle for three different velocities under three conditions of sand particle size, with an exposure time of 14 days (336 h). The data indicate that all the specimens lost weight after the test on all impact angles from 15° to 90°.
In Figure 3, the mass loss increases with particle size from 45° to 90°; the relationship at this range is more likely to be a liner. Otherwise, at 30°, the mass loss for particle sizes 50–100 µm was higher than that for the 100–150 µm range. A possible explanation for this might be that the particle slides on the surface at the lower impact angles and particle velocities. In addition, this phenomenon is commonly found in ductile materials, which leads to cutting and ploughing. Similarly, researchers indicate that the erosion rates of ductile materials generally peak at impact angles of 30–50° as a consequence of micro-cutting. On the other hand, in Figure 4 and Figure 5, the mass loss was higher at a 90° impingement angle under this condition, which is a high impact angle and low particle velocity. The primary erosion mechanism is the flattening of ridges and plastic deformation, as seen in Figure 9.
As mentioned in the literature review, the harsh marine environment significantly influences variables such as erodent particle, impact velocity, and impact angle, resulting in maximum mass loss at intermediate impact angles [27,30].
Figure 6 and Figure 7 show the mass loss after 91 days (2184 h) of pre-exposure using the same 14 days (336 h) pre-exposure time parameters with changed erosion transactions. For example, in Figure 7, the peak of mass loss was at a 75° impact angle, while in Figure 4, it was higher at a 90° impact angle. The change in erosion transaction may be because the glass fibre material typically comprises various very slight glass fibres. Additionally, the impact angle, also known as the impingement angle, between the material surface and the particle’s trajectory at 75° is regarded as a higher angle. Impacts at higher angles transfer the most energy to the materials [31].

4.2. Microscopy Analysis of Erosion Mechanisms

The surface morphology of eroded surfaces shows the specific types of erosive wear on the test specimens. Therefore, this study uses two types of analysis, depth profiling and SEM, to determine the wear mechanism impingement angles from 15° to 90°, as shown in Figure 8, Figure 9, Figure 10 and Figure 11. The figures prove that some exposed fibres, blisters, damaged surfaces, and fractured fibres were caused by the rodent’s cutting and impact.
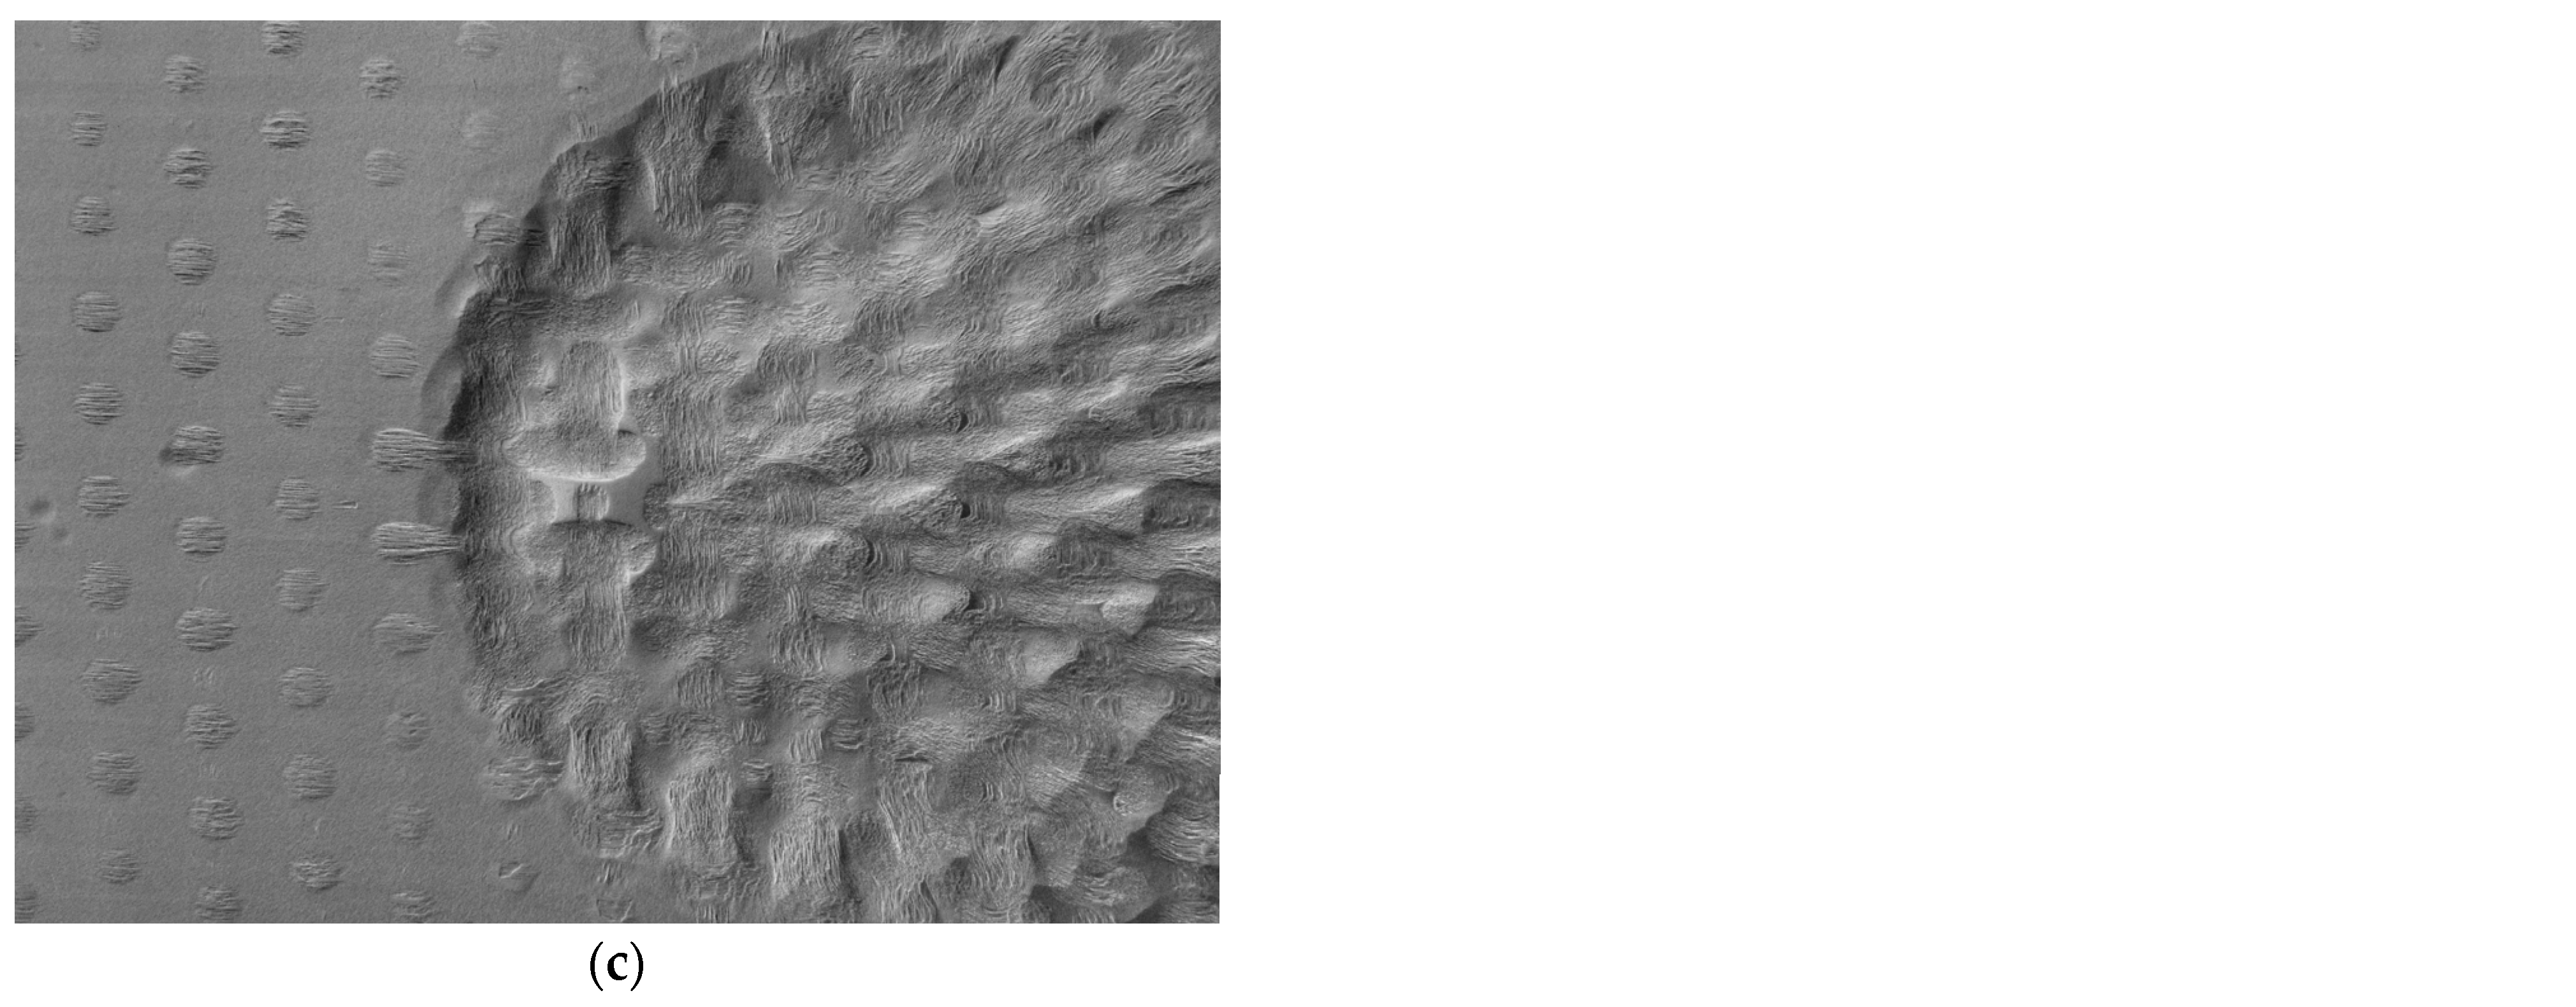
Figure 8 shows the surface morphology of the specimen using the scanning electron microscope (SEM) of pre-exposure time for 14 days (336 h) at a fixed 60° impact angle with a slurry velocity of 12.5 m/s. The type of defect in the specimen can be summarised into melting and surface degradations, as the SEM shows a rough surface, suggesting localised heating and softening from the particle impact. The depth profiling analysis was used to understand the mechanisms better, as shown in Figure 8b,c. The depth profiling establishes that the material removal in the composite is approximately in the range of 752 µm in depth. This technique indicates a sizeable crater-shaped cavity, caused by repeated high-energy impacts, resulting in significant localised material removal.
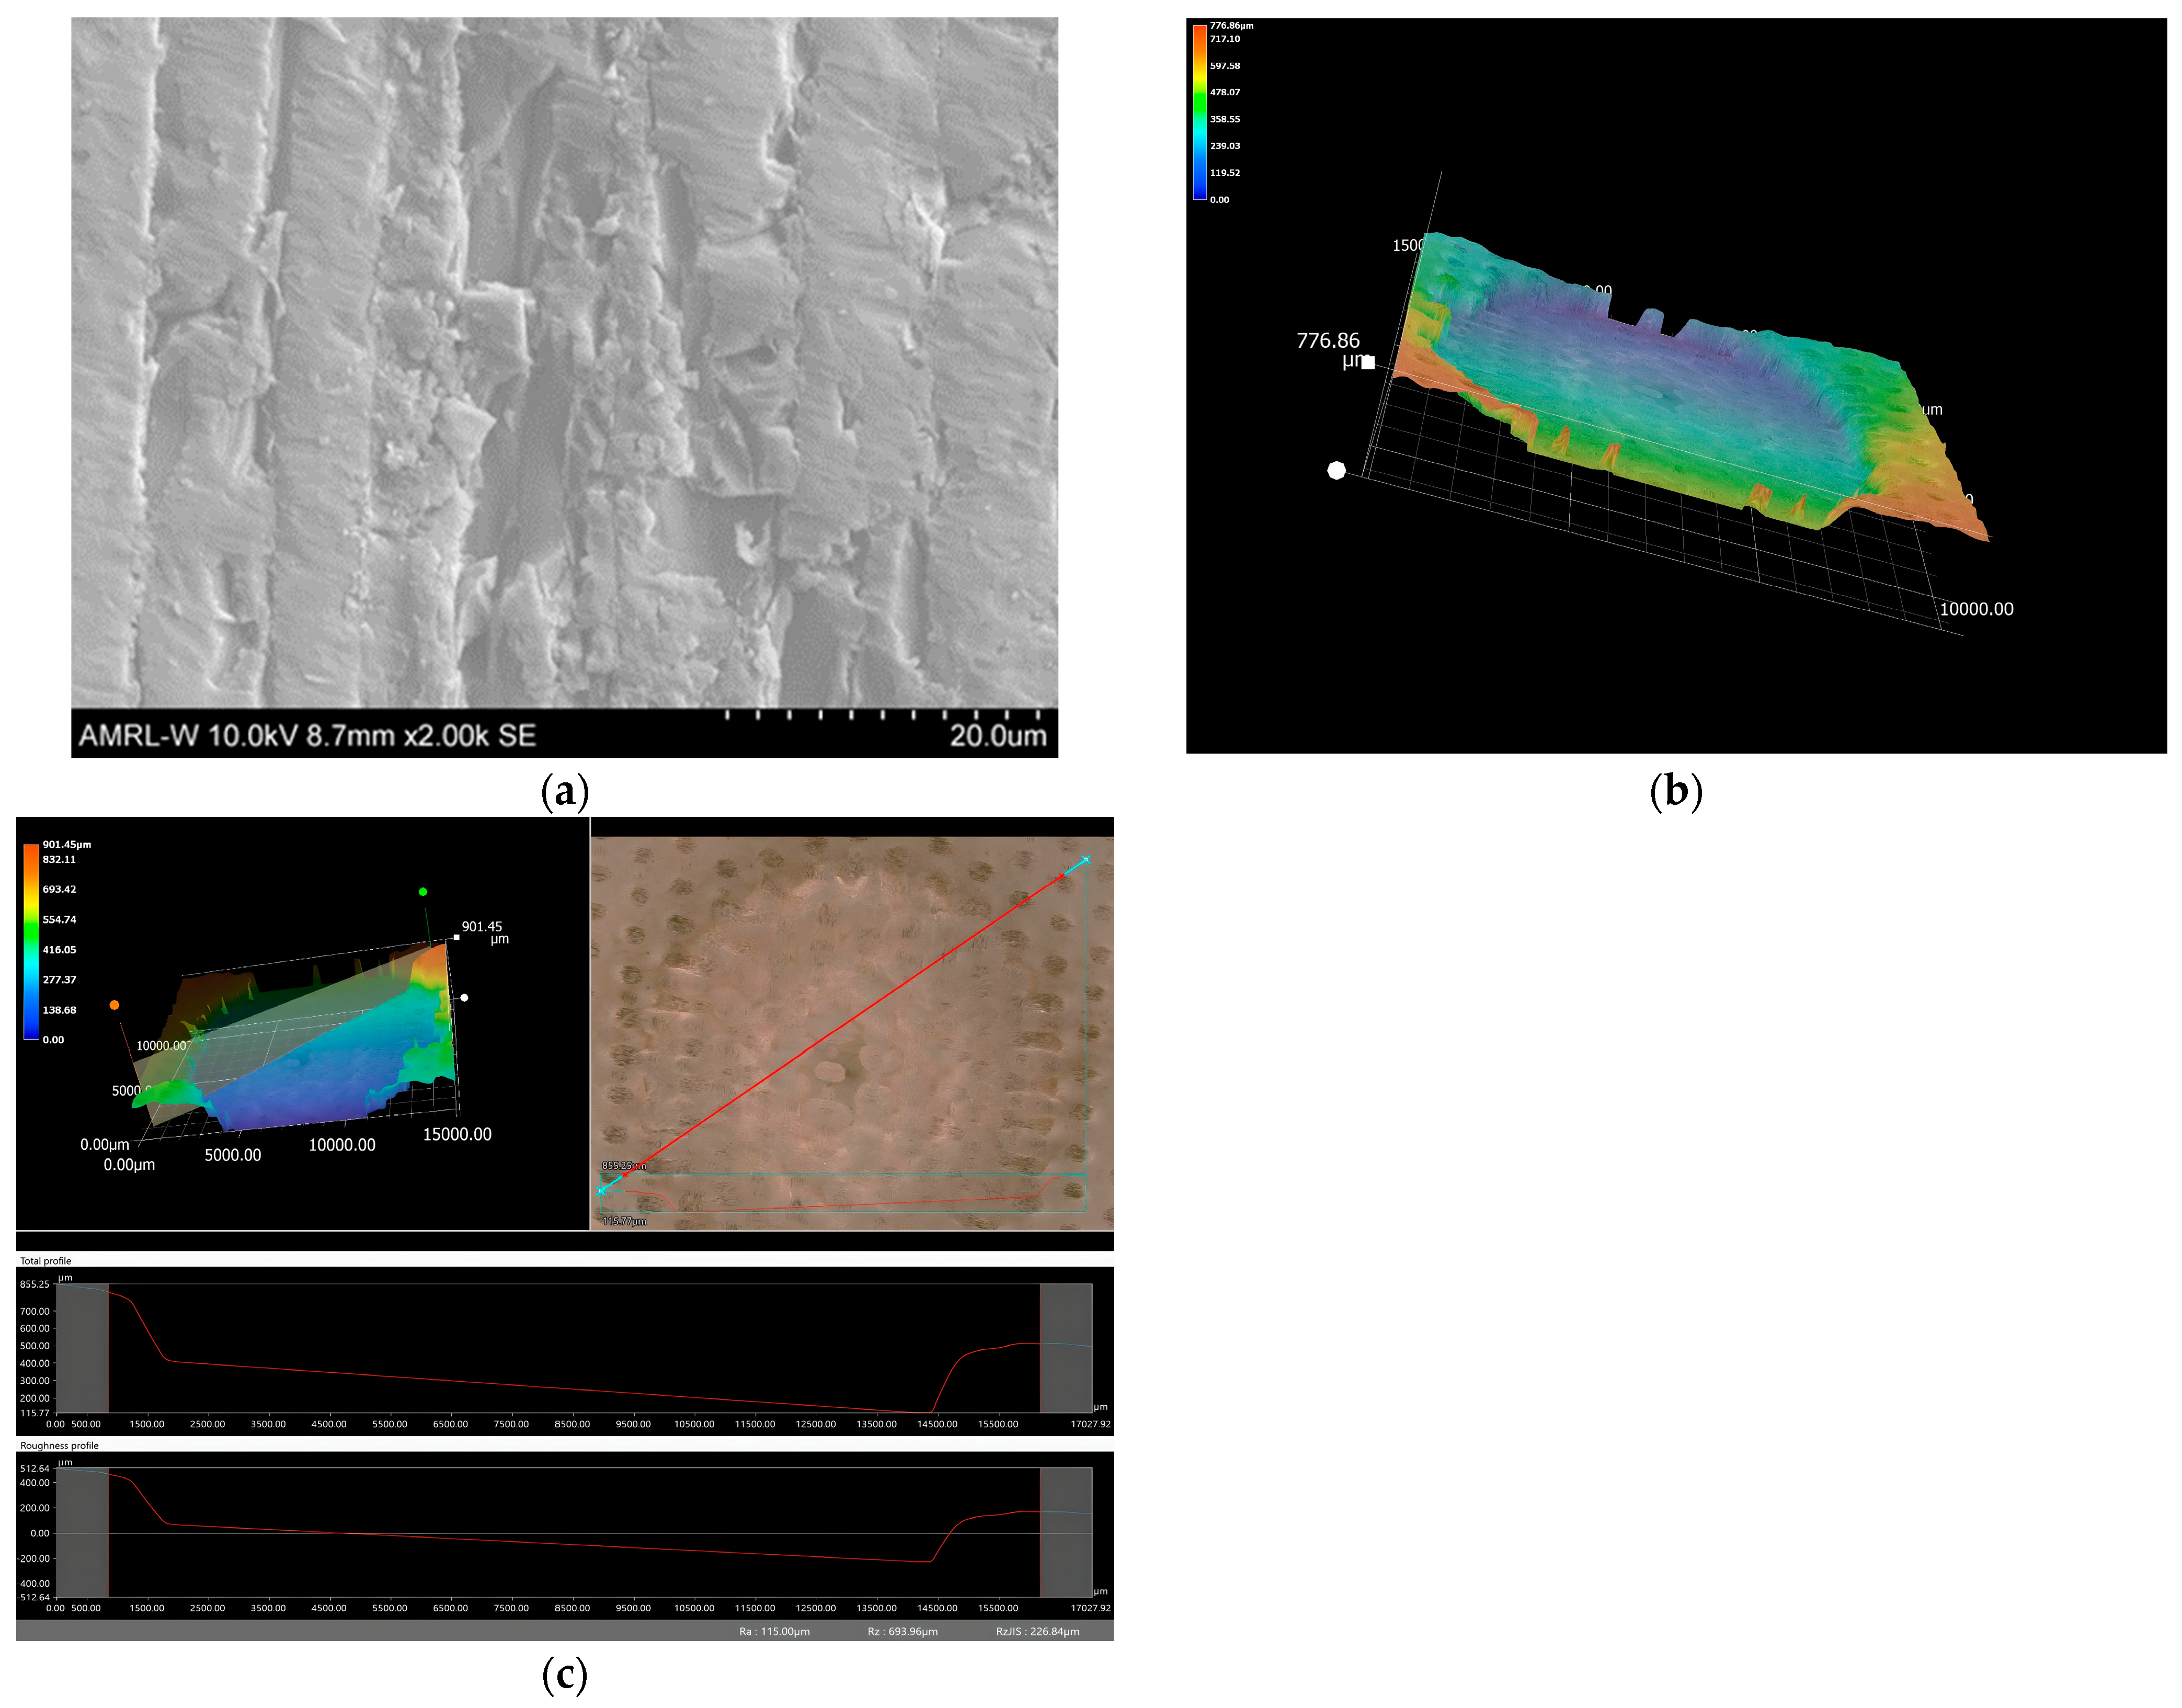
A similar analysis was taken at 90°, as shown in Figure 9a–c. The sample failure could be summarised into two main points: the failure of the matrix, which in this case is epoxy, and the failure of the fibre reinforcement, causing fractures. This matrix separation exposes the underlying fibres, signifying the beginning of the erosion process. The exposure of fibres clearly shows the incapacity of the matrix to resist the erosive stresses, which will finally cause failure in the composite structure [31]. In addition, the depth profile appears to be deeper at 90° when recorded at a value of 776 µm.
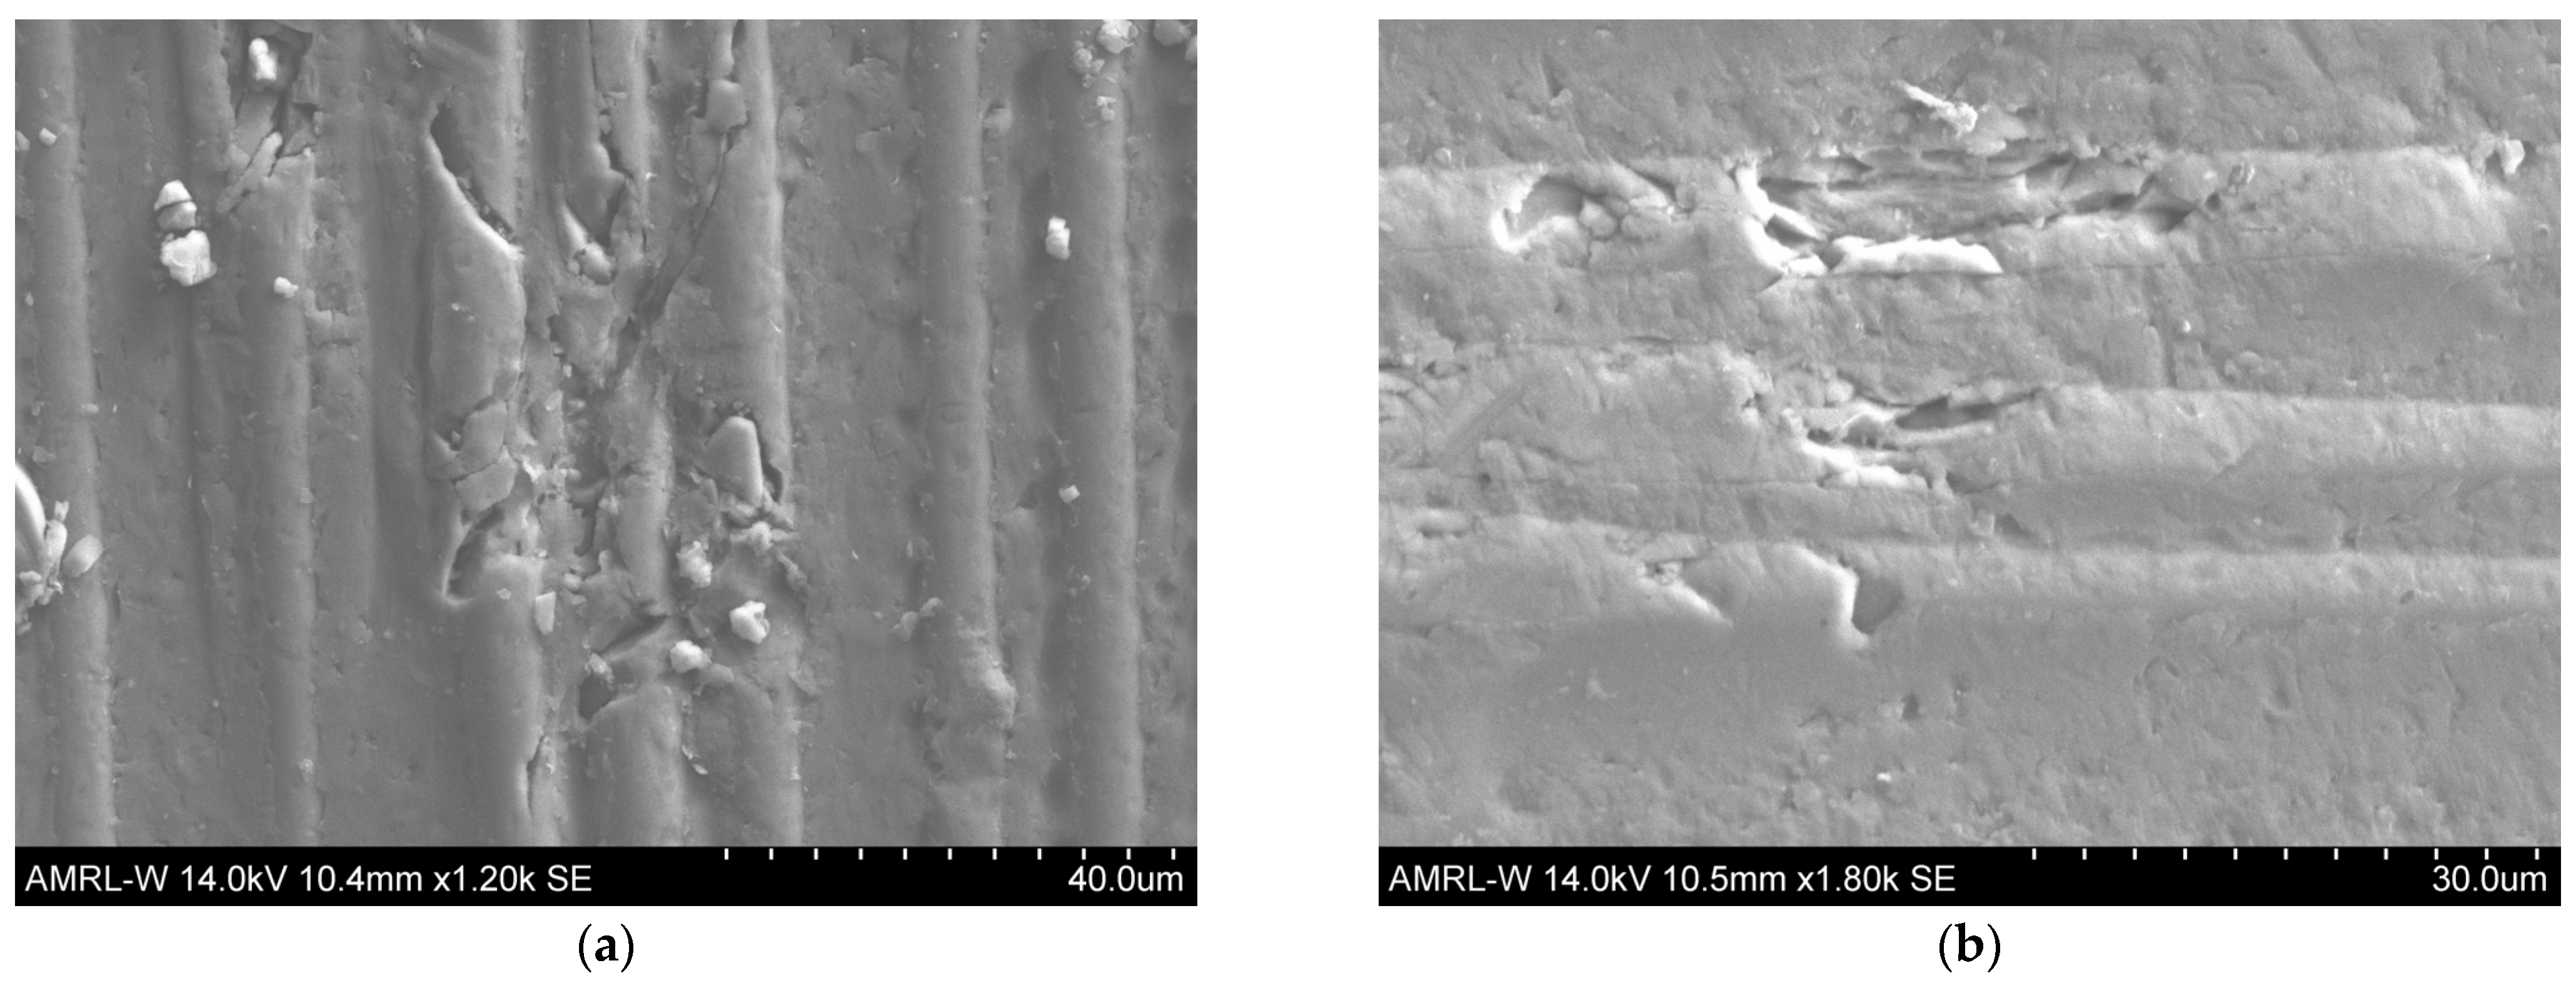
Figure 10a,b, and Figure 11a,b present the erodent that occurs on the specimens after a pre-exposure time of 91 days (2184 h). At this phase, matrix degradation occurs on the surface of specimens. Fibre/matrix debonding undermines the structural integrity of the composite, resulting in reduced mechanical characteristics and heightened vulnerability to more erosive degradation. In addition, subsequent particle impact may result in fibre fragmentation, characterised by cracking and numerous fractures of the fibres [31].
These findings reflect those of Rajendran et al., who also found that the results indicated that the alteration in the mass of glass fibre-reinforced unsaturated composites upon exposure was attributable to two factors: water absorption and the extraction of soluble particles [31].

4.3. Erosion Maps and Potential Applications

Wear and erosion maps illustrate the mechanistic alterations occurring on the worn surfaces of the test samples in various operation situations [2,28,32,33]. Constructing wear mode maps aids in comprehending the mechanisms of material deterioration and the chemical degradation of the surface. Wear mode maps clearly represent the rates at which materials undergo mass loss and also indicate the optimal operating parameters for the chosen material. Figure 12 and Figure 13 suggest that these maps can ease the interpretation of the multi-variable interactions involved in the process. Such maps are essential for optimising tidal energy material degradation due to erosion parameters.

5. Conclusions

This investigation aimed to examine the erosion of tidal turbine blades in harsh marine environments. Uncoated GFRP materials were selected as specimens and tested under seawater conditions, varying velocity, particle size, and impact angle. Additionally, the study considered the pre-exposure of GFRP over two durations: 14 days (336 h) and 91 days (2184 h). The results demonstrated that these variables significantly influenced material behaviour. Peaks in erosion rates were observed at intermediate impact angles for many of the conditions tested, and in some cases, double peaks were observed, with peaks at both 90° and between 30° and 60°. In a minority of cases, peaks in erosion at 90° were observed. This indicated transitions between erosion regimes as a function of the impact angle and particle properties such as size and velocity. In particular, exposure time played a critical role in modifying the observed trends. Ninety-one days (2184 h) of pre-exposure times markedly increased crack initiation and propagation within the composite material, thereby influencing its degradation mechanisms and providing insight into its response under different conditions. These findings suggest that such insights can help optimise these materials for tidal turbine applications. Future work is required to shed light on the understanding of the erosion mechanisms with pre-exposure time and to evaluate coated GFRP compared with uncoated substrates.

Author Contributions

Conceptualization, T.F.A.; Methodology, T.F.A.; Software, T.F.A. and E.H. Validation, T.F.A.; Formal analysis, T.F.A.; Investigation, T.F.A.; Resources, M.M.S.; Data curation, E.H.; Writing—original draft, T.F.A.; Writing—review & editing, E.H. and M.M.S.; Visualization, T.F.A. and E.H.; Supervision, E.H. and M.M.S.; Project administration, M.M.S.; Funding acquisition, M.M.S. All authors have read and agreed to the published version of the manuscript.

Funding

The authors would like to acknowledge the support of the Interreg (Northern Ireland—Ireland—Scotland) Special EU Programmers Grant No SPIRE2_INT–VA–049 “Storage Platform for the Integration of Renewable Energy (SPIRE 2)”. In addition, TA wishes to acknowledge the Libyan Cultural Affairs Department, Libyan Embassy London, for PhD funding.

Data Availability Statement

The data is available upon request.

Conflicts of Interest

Author Emadelddin Hassan was employed by Agilent Technologies UK Ltd. The remaining authors declare that the research was conducted in the absence of any commercial or financial relationships that could be construed as a potential conflict of interest.

References

  1. Cagney, D.; Gruet, R.; Europe, O.E. Powering Homes Today, Powering Nations Tomorrow. ETIP Ocean. 2019. Available online: https://www.oceanenergy-europe.eu/wp-content/uploads/2019/04/ETIP-Ocean-Integrated-Strategy-2019-LR.pdf (accessed on 25 October 2024).
  2. Hassan, E.; Zekos, I.; Jansson, P.; Pečur, T.; Floreani, C.; Robert, C.; O’Bradaigh, C.; Stack, M. Erosion Mapping of Through-Thickness Toughened Powder Epoxy Gradient Glass-Fiber-Reinforced Polymer (GFRP) Plates for Tidal Turbine Blades. Lubricants 2021, 9, 22. [Google Scholar] [CrossRef]
  3. Shiekh Elsouk, M.; Santa Cruz, A.; Guillou, S. Review on the characterization and selection of the advanced materials for tidal turbine blades. In Proceedings of the 7th International Conference on Ocean Energy, Normandy, France, 12–13 June 2018; pp. 12–14. [Google Scholar]
  4. Grogan, D.M.; Leen, S.B.; Kennedy, C.R.; Brádaigh, C.Ó. Design of composite tidal turbine blades. Renew Energy 2013, 57, 151–162. [Google Scholar] [CrossRef]
  5. Alam, P.; Robert, C.; Brádaigh, C.M.Ó. Tidal turbine blade composites-A review on the effects of hygrothermal aging on the properties of CFRP. Compos. Part B Eng. 2018, 149, 248–259. [Google Scholar] [CrossRef]
  6. Rasool, G.; Johnstone, C.; Stack, M.M. Tribology of tidal turbine blades: Impact angle effects on erosion of polymeric coatings in sea water conditions. In Proceedings of the 2016: Asian Wave and Tidal Energy Conference (AWTEC), Singapore, 25–27 October 2016. [Google Scholar]
  7. McEwen, L.N.; Evans, R.; Meunier, M. Cost-effective tidal turbine blades. In Proceedings of the 4th International Conference on Ocean Energy, Dublin, Ireland, 17–19 October 2012; Volume17. [Google Scholar]
  8. Fukushima, K.; Cai, H.; Nakada, M.; Miyano, Y. Determination of time-temperature shift factor for long-term life prediction of polymer composites. In Proceedings of the ICCM 2009, Manchester, UK, 24–26 July 2009; Volume 17. [Google Scholar]
  9. Plota, A.; Masek, A. Lifetime prediction methods for degradable polymeric materials—A short review. Materials 2020, 13, 4507. [Google Scholar] [CrossRef] [PubMed]
  10. Abdellah, M.Y. Comparative study on prediction of fracture toughness of CFRP laminates from size effect law of open hole specimen using cohesive zone model. Eng. Fract. Mech. 2018, 191, 277–285. [Google Scholar] [CrossRef]
  11. Hassan, M.K.; Redhwi, A.M.N.; Mohamed, A.F.; Backar, A.H.; Abdellah, M.Y. Investigation of Erosion/Corrosion Behavior of GRP under Harsh Operating Conditions. Polymers 2022, 14, 5388. [Google Scholar] [CrossRef]
  12. Zhang, X.; Deng, Z. Effects of Seawater Environment on the Degradation of GFRP Composites by Molecular Dynamics Method. Polymers 2022, 14, 2804. [Google Scholar] [CrossRef]
  13. Wu, G.; Wang, X.; Wu, Z.; Dong, Z.; Zhang, G. Durability of basalt fibers and composites in corrosive environments. J. Compos. Mater. 2015, 49, 873–887. [Google Scholar] [CrossRef]
  14. Ediriweera, M.; Chladek, J.; Ratnayake, C. Effect of impact angle, exposure time, and particle size on impact erosion. Part. Sci. Technol. 2021, 39, 10–18. [Google Scholar] [CrossRef]
  15. Javaheri, V.; Porter, D.; Kuokkala, V.-T. Slurry erosion of steel–Review of tests, mechanisms and materials. Wear 2018, 408, 248–273. [Google Scholar] [CrossRef]
  16. Tsai, W.; Humphrey, J.; Cornet, I.; Levy, A. Experimental measurement of accelerated erosion in a slurry pot tester. Wear 1981, 68, 289–303. [Google Scholar] [CrossRef]
  17. Lindgren, M.; Perolainen, J. Slurry pot investigation of the influence of erodent characteristics on the erosion resistance of austenitic and duplex stainless steel grades. Wear 2014, 319, 38–48. [Google Scholar] [CrossRef]
  18. Bhushan, B. Principles and Applications of Tribology; John Wiley & Sons: Hoboken, NJ, USA, 2013. [Google Scholar]
  19. Salik, J.; Buckley, D.H. Effects of Erodant Particle Shape and Various Heat Treatments on Erosion Resistance of Plain Carbon Steel; No. E-326; NASA: Washington, DC, USA, 1981.
  20. Hutchings, I.; Shipway, P. Tribology: Friction and Wear of Engineering Materials; Butterworth-Heinemann: Oxford, UK, 1995. [Google Scholar]
  21. Arjula, S.; Harsha, A. Study of erosion efficiency of polymers and polymer composites. Polym. Test. 2006, 25, 188–196. [Google Scholar] [CrossRef]
  22. Patnaik, A.; Biswas, S.; Kaundal, R.; Satapathy, A. Damage assessment of short glass fiber reinforced polyester composites: A comparative study. In Nanocomposites with Unique Properties and Applications in Medicine and Industry; IntechOpen: London, UK, 2011. [Google Scholar]
  23. Bhat, R.; Mohan, N.; Sharma, S.; Rao, S. Influence of seawater absorption on the hardness of glass fiber/polyester composite. J. Comput. Mech. Manag 2022, 1, 1–11. [Google Scholar] [CrossRef]
  24. Holbourne Industrial Plastics. Industrial Laminates & Industrial Engineering Plastics|Holbourne. Holbourne Industrial Plastics|Suppliers of Engineering Plastics to the UK, Europe, USA and Asia, 6 March 2012. Available online: https://www.holbourne.co.uk/ (accessed on 25 October 2024).
  25. The International Organization for Standardization. Available online: https://www.iso.org/home.html (accessed on 25 October 2024).
  26. International Electrotechnical Commission (IEC). Available online: https://webstore.iec.ch/en/ (accessed on 25 October 2024).
  27. Wensink, H.; Elwenspoek, M.C. A closer look at the ductile–brittle transition in solid particle erosion. Wear 2002, 253, 1035–1043. [Google Scholar] [CrossRef]
  28. Lim, S. Recent developments in wear-mechanism maps. Tribol. Int. 1998, 31, 87–97. [Google Scholar] [CrossRef]
  29. Rasool, G.; Stack, M.M. Some views on the mapping of erosion of coated composites in tidal turbine simulated conditions. Tribol. Trans. 2019, 62, 512–523. [Google Scholar] [CrossRef]
  30. Sparks, A.; Hutchings, I. Transitions in the erosive wear behaviour of a glass ceramic. Wear 1991, 149, 99–110. [Google Scholar] [CrossRef]
  31. Rajendran, S.; Palani, G.; Karthik Babu, N.; Veerasimman, A.P.; Yang, Y.-L.; Shanmugam, V. Solid particle erosion in fibre composites: A review. J. Reinf. Plast. Compos. 2024, 07316844241255007. [Google Scholar] [CrossRef]
  32. Macdonald, J.; Stack, M.M. Generating composite material maps from numerical simulation of hailstone impact. J. Bio-Tribo-Corros. 2024, 10, 57. [Google Scholar] [CrossRef]
  33. Ritchie, F.; Jana, B.; Zekos, I.; Stack, M. On the construction methodology of microabrasion-corrosion maps using theoretical approaches. J. Bio-Tribo-Corros. 2024, 10, 18. [Google Scholar] [CrossRef]
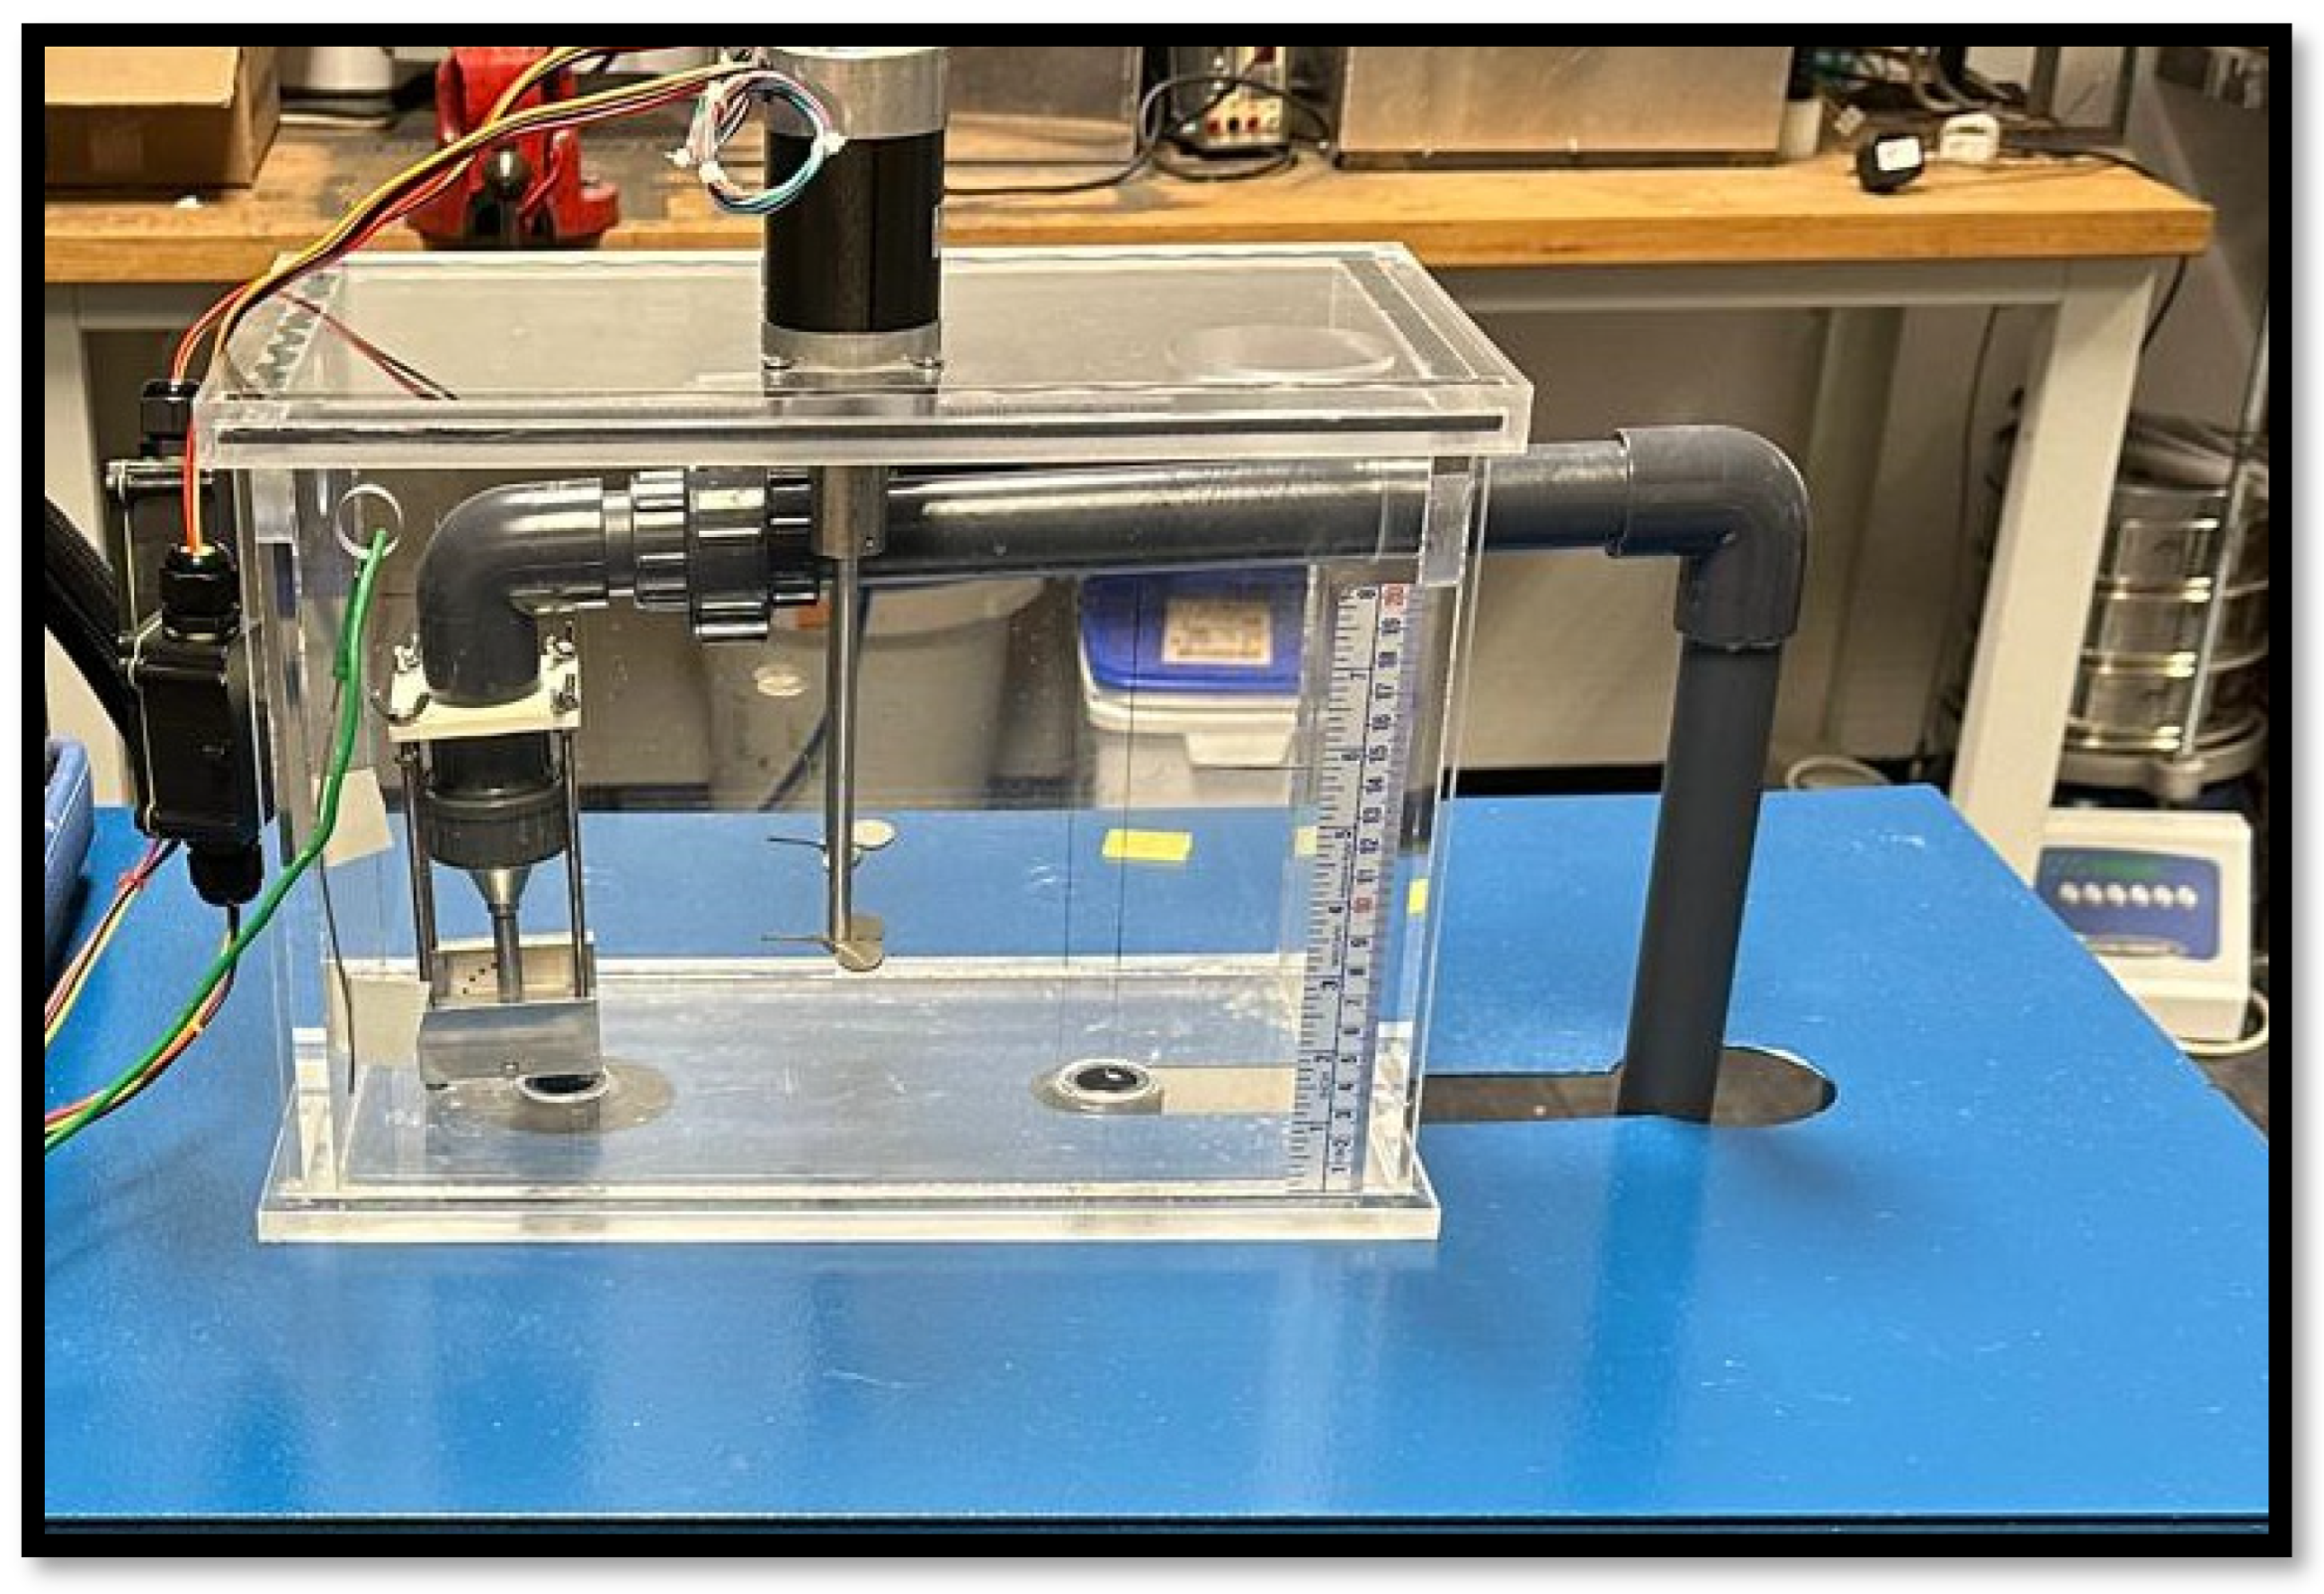
Figure 1. Slurry Erosion Impingement Rig.
Lubricants 12 00375 g001
Figure 2. Images of test specimens of GFRP after 14 days (336 h) of pre-exposure at a velocity of 12.5 ms−1 and sand size of 100–150 µm.
Lubricants 12 00375 g002
Figure 3. Mass loss (g) of GFRP after 14 days (336 h) pre-exposure at a velocity of 6.425 ms−1 and sand size of 0–50 µm, 50–100 µm, 100–150 µm.
Lubricants 12 00375 g003
Figure 4. Mass loss (g) of GFRP after 14 days (336 h) pre-exposure at a velocity of 9.914 ms−1 and sand size of 0–50 µm, 50–100 µm, 100–150 µm.
Lubricants 12 00375 g004
Figure 5. Mass loss (g) of GFRP after 14 days (336 h) of pre-exposure at a velocity of 12.5 ms−1 and sand size of 0–50 µm, 50–100 µm, 100–150 µm.
Lubricants 12 00375 g005
Figure 6. Mass loss (g) of GFRP after 91 days (2184 h) pre-exposure at a velocity of 6.425 ms−1 and sand size of 50–100 µm, 100–150 µm.
Lubricants 12 00375 g006
Figure 7. Mass loss (g) of GFRP after 91 days (2184 h) pre-exposure at a velocity of 9.914 ms−1 and sand size of 50–100 µm, 100–150 µm.
Lubricants 12 00375 g007
Figure 8. (a) SEM microphotograph of GFRP specimen surface for 14-day (336 h) pre-exposure at 100–150 µm sand particle size velocity of 12.5 ms−1 and impact angle of 60°. (b,c) Views of depth profiling analysis.
Lubricants 12 00375 g008aLubricants 12 00375 g008b
Figure 9. (a) SEM microphotograph of GFRP specimen surface for 14-day (336 h) pre-exposure at sand particle size of 100–150 µm, velocity of 12.5 ms−1 and impact angle of 90°. (b,c) Views of depth profiling analysis showing the depth of GFRP for the 60 min test.
Lubricants 12 00375 g009
Figure 10. (a) SEM micrograph of GFRP specimen surface for 91 days (2184 h) pre-exposure at sand particle size of 100–150 µm, velocity of 6.425 ms−1 and impact angle of 60°. (b) SEM for sand particle size of 50–100 µm, velocity of 6.425 ms−1 and impact angle of 60°.
Lubricants 12 00375 g010
Figure 11. (a,b) Depth profiling of the specimen surface for 91 days (2184 h) pre-exposure at 100–150 µm sand particle size, velocity of 9.914 ms−1, and impact angle of 75°.
Lubricants 12 00375 g011
Figure 12. Erosion wastage maps of mass loss (g) of GFRP specimens for 14 days (336 h) pre-exposure in aqueous media (a) 6.425 ms−1 (b) 9.914 ms−1 (c) 12.5 ms−1.
Lubricants 12 00375 g012
Figure 13. Erosion wastage maps of mass loss (g) GFRP specimens for 91 days (2184 h) pre-exposure in aqueous media (a) 6.425 ms−1 (b) 9.914 ms−1.
Lubricants 12 00375 g013
Table 1. Erosion test parameters.
ParameterValue
Impingement Angle15°, 30°, 45°, 60°, 75°, 90°
SolutionWater, Salt, and Sand
Water Tank Capacity (Litre)13
Salinity (wt %)3.5
Sand Concentration (wt%)3
Test Duration (min)60
Ageing Duration (Days)14 (336 h) & 91 (2184 h)
Temperature (°C)10 ± 1
Sand Particle Size (µm)0–50, 50–100, 100–150
Impact Velocity (ms−1)6.425, 9.914, 12.5
Table 2. Technical data, mechanical and electrical properties of GFRP-FR4.
Technical DataUnitsTest MethodValues
Colour--Light Green
Specific Gravityg/cm3ISO 1183 [25]1.95
Water AbsorptionmgISO 62 [25]5.5
Temperature Index°CIEC 60216 [26]130
Mechanical Properties
Flexural StrengthMPaISO 178 [25]500
Compressive StrengthMPaISO 604 [25]-
Impact Strength CharpykJ/M 2ISO 179 [25]60
Tensile StrengthMPaISO 527 [25]450
Electrical Properties
Insulation ResistanceMΩIEC 60893 [26]1.0 × 10⁹
Breakdown VoltagekVIEC 60243 [26]42
Dielectric StrengthkV/mmIEC 60243 [26]24
Disclaimer/Publisher’s Note: The statements, opinions and data contained in all publications are solely those of the individual author(s) and contributor(s) and not of MDPI and/or the editor(s). MDPI and/or the editor(s) disclaim responsibility for any injury to people or property resulting from any ideas, methods, instructions or products referred to in the content.