Article

Measurement and Dynamic Analysis of the Centroid Trajectories of Angular-Contact Ball Bearing Cages

1
School of Mechatronics Engineering, Henan University of Science and Technology, Luoyang 471003, China
2
Longmen Laboratory, Luoyang 471003, China
3
National Joint Engineering Research Center for Abrasion Control and Molding of Metal Materials, Luoyang 471003, China
*
Author to whom correspondence should be addressed.
Lubricants 2024, 12(11), 379; https://doi.org/10.3390/lubricants12110379
Submission received: 22 September 2024 / Revised: 21 October 2024 / Accepted: 28 October 2024 / Published: 31 October 2024

Abstract

:
When a high-speed rolling bearing cage comes into contact with rollers, it experiences random movement due to friction and collision, which significantly impacts the overall performance of the bearing. To further investigate the motion law of cages, a test bench for a 7010C angular-contact bearing cage was constructed. This setup utilized laser sensors to obtain changes in attitude and displacement during operation. After analyzing how cage deflection errors influenced trajectory measurements, corrections were applied to the measurement results. Additionally, an investigation was conducted into the effects of varying rotational speeds on the dynamic performance of the cage. Simulations were performed using ADAMS software, which verified both the effectiveness of the measuring method and the testing results. The findings indicated that within the tested range of rotational speeds, the centroid trajectory stability of the cage gradually improved as rotational speed increased and then began to show a tendency to deteriorate. Furthermore, there existed a negative correlation between the deflection error of the cage and the centroid trajectory stability.

1. Introduction

Rolling bearings serve as critical supporting components in mechanical equipment, and their performance directly affects the operating efficiency and stability of the entire machine. As modern industry increasingly demands higher production efficiency, more stringent requirements have been put forward for the working performance and service life of high-speed rolling bearings. An important component of the rolling bearing, the bearing cage is responsible for separating, guiding, and correcting the motion of the rollers on a raceway [1]. In high-speed operation, frequent friction and collisions between the cage and the roller lead to wear over time, resulting in various degrees of fracture and deformation during prolonged operation. Such degradation is one of the important causes of failure in high-speed rolling bearings, which has a great impact on both the performance and safety of the equipment of which the bearings are components [2,3,4]. Therefore, it is necessary to analyze the dynamic characteristics of high-speed rolling bearing cages and to comprehend their motion law [5].
The centroid trajectory of the cage provides an intuitive representation of the motion law and change trend of the bearing during operation, providing important data for analyzing the dynamic performance of the bearing. Gupta et al. [6] employed eddy current sensors to measure the three-dimensional motion trajectory of a cage within both the radial plane and the axial direction and verified the critical vortex velocity of the centroid predicted by the simulation model; however, this measuring method is reliable only at low speeds. Schwarz et al. [7] developed a machine learning model by training with more than 4000 sets of simulated bearing dynamics results under different working conditions; the model was capable of predicting the correlation between the load and the cage’s motion trajectory. The predictive method was validated using a high-speed camera. Yeteng Li et al. [8] developed a dynamic model of a four-point contact ball bearing using ADAMS software and collected the vibration signals of the cage with two laser profilometers. The study investigated the effects of rotational speed and load on the velocity deviation ratio and radius ratio of the cage’s centroid vortex velocity. Yang et al. [9] employed a high-speed camera to track the marker points on a cage, thereby capturing the radial vibration of the cage at different rotational speeds by plotting its motion trajectory. However, this method requires high accuracy in drawing the marker points. Huang [10] measured the radial vibration of a microbearing cage by installing two laser sensors positioned on the machining groove of the outer ring to capture its centroid trajectory. The study also discussed the influence of axial load and loading mode on the centroid trajectory. Liu Yilin et al. [11] used an edge-detection algorithm to obtain the centroid trajectory of a cage, enhancing detection accuracy through subpixel image processing without changing the hardware conditions.
Because of the structural limitations inherent in rolling bearings and cages, there are great difficulties and challenges in conducting motion test of cages. In the above research, a variety of measurement solutions have been employed to evaluate the dynamic characteristics of bearings. Notably, the method based on machine vision has garnered considerable attention in recent years because of its minimal impact on the original structure of the bearing. However, this method is limited by the lack of texture on the cage, which makes it difficult to identify depth information and faces challenges in measuring the three-dimensional motion of the cage. Additionally, measurement solutions based on eddy current sensors require the measured cage to be of metallic material because of the sensors’ own working principle, thereby limiting their applicability across a broader range of scenarios.
To address the requirements of measuring the spatial motion of bearing cages, this study employed a bearing cage slightly wider than the rings as the measuring object. Two laser sensors, positioned perpendicularly to each other in the radial plane, allowed for detection of the radial vibration of the cage. Additionally, three laser sensors were installed in the axial direction perpendicular to the end face of the cage, enabling measurements of both the deflection angle and axial vibration of the cage. The above sensor arrangement ensured a comprehensive test of the spatial motion of the cage. Ultimately, by comparing the cage’s centroid trajectory between the tests and simulations conducted under the same working conditions, the accuracy of the measurement method was verified.

2. Measurement Solution for Cage Centroid Trajectory

2.1. Measurement Solution

Cage centroid trajectory measurement was realized by indirectly detecting the motion position and vibration of the cage during operation. A 7010C angular-contact ball bearing cage motion trajectory measurement test bench was built, as shown in Figure 1. The test bed was composed of a motorized spindle, a test bearing, a loading device, and laser sensors. The type of laser displacement sensor was KEYENCE LK-H020 (KEYENCE Corporation, Osaka, Japan), with a measurement range of 20 ± 3 mm and a repeatability accuracy of 0.02 μm, which could effectively perform noncontact measurement and ensure the accuracy of cage motion detection.
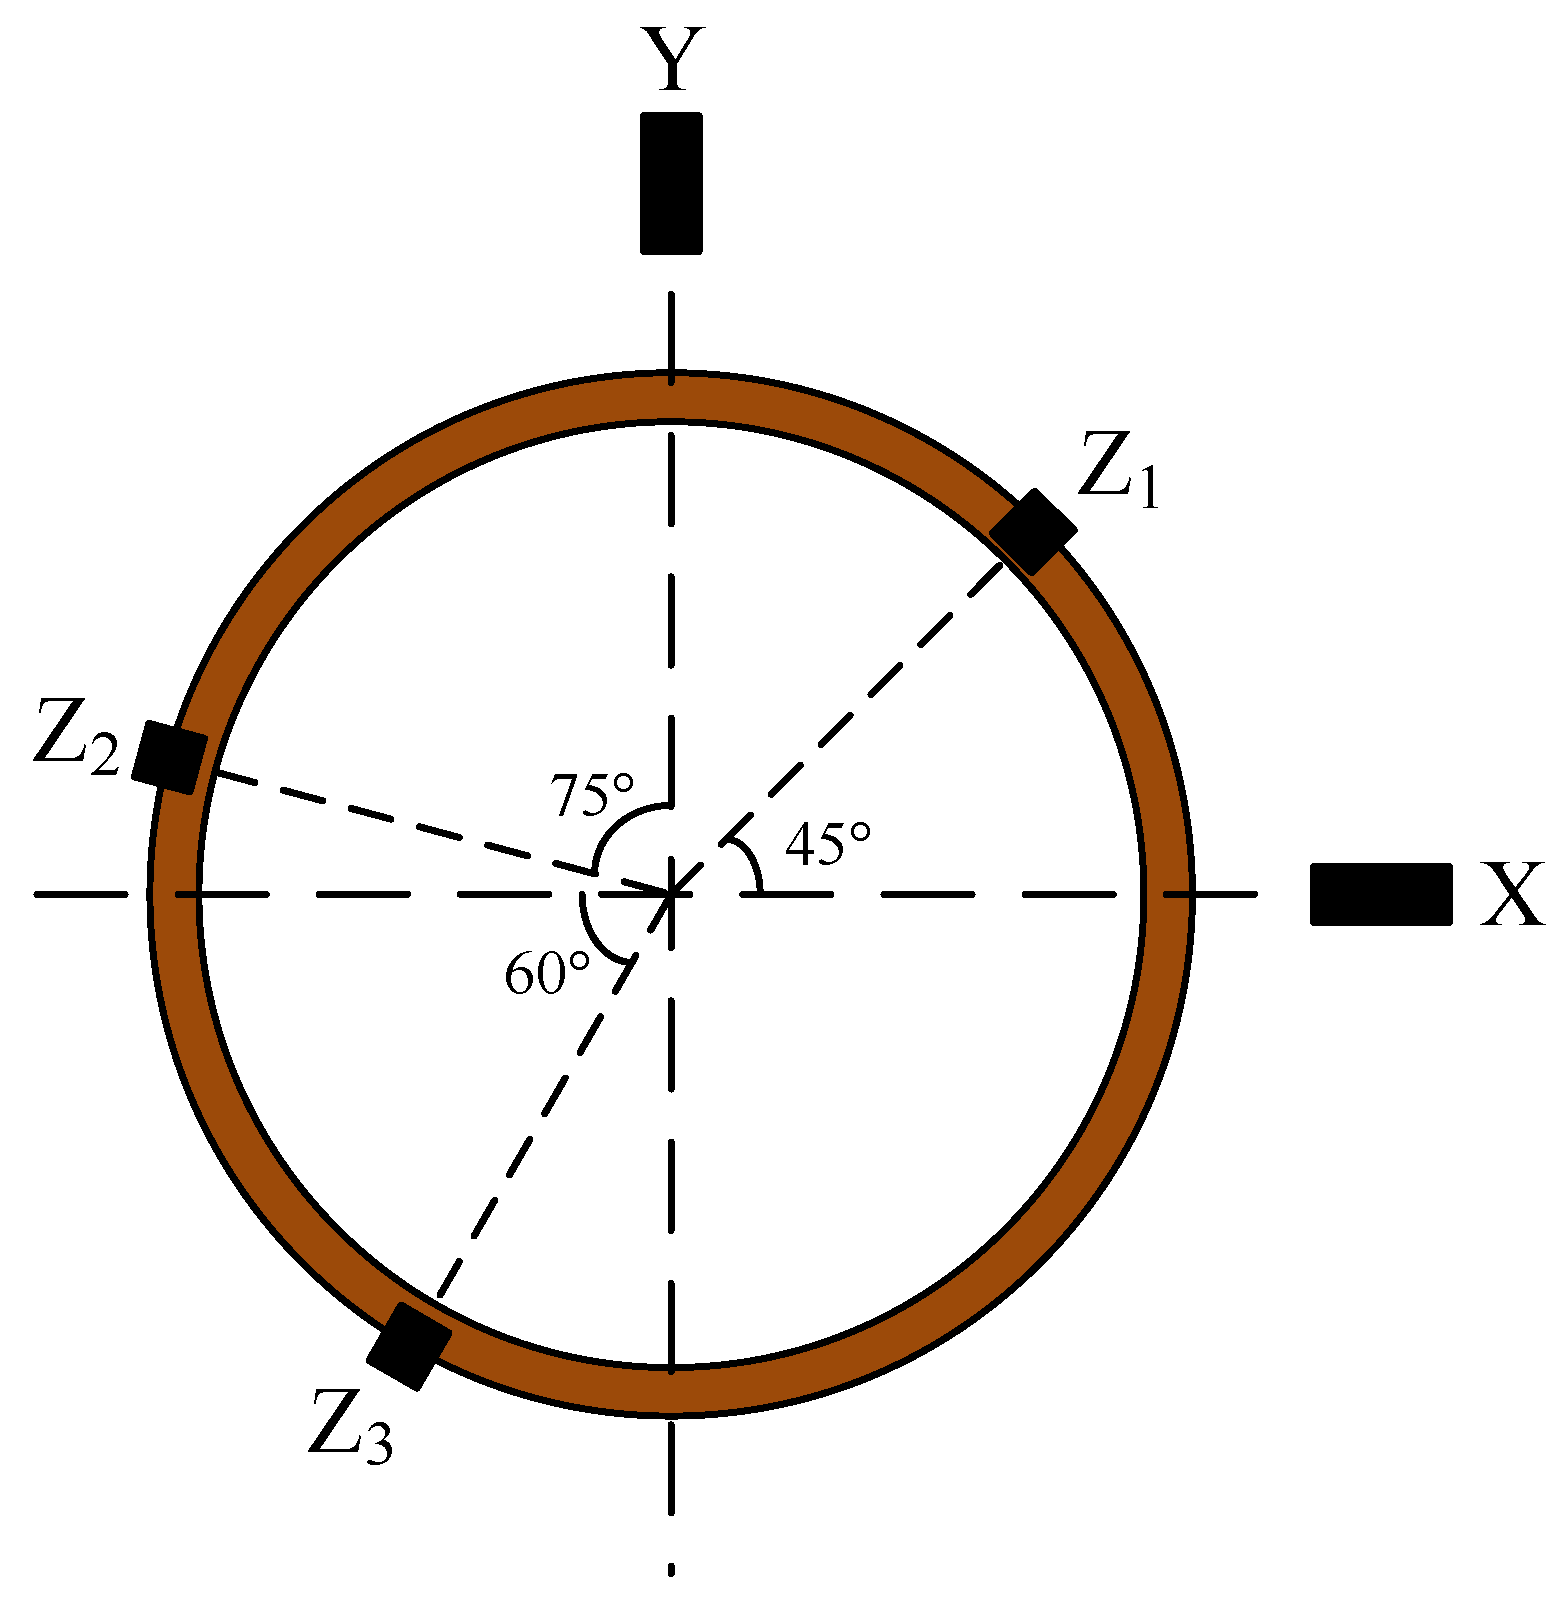
Since the bearing cage was located between the bearing rings, in order to satisfy the measurement of the radial motion of the bearing cage, the cage was designed to be slightly wider than the bearing ring to lead it out of the narrow space inside the bearing. Two laser sensors positioned perpendicularly to each other in the same radial plane measured the vibration of the cage in the radial direction. Three sensors were arranged in the axial direction parallel to the shaft line, and the deflection angle and axial vibration of the cage were determined based on the measuring results from these sensors. The concrete arrangement of the sensors, which could fully detect the five-degree-of-freedom motion of the cage in three-dimensional space, is shown in Figure 2.
In the measurement process, because of the influence of the structure and the installation position of the cage, the sensors cannot directly measure the position of the centroid. To overcome this issue, the centroid is usually measured at a point along the axial and radial extension lines to reflect the motion state of the centroid. However, there is a problem with this indirect measuring method; namely, when the cage undergoes displacement and attitude deflection during operation, the relative position of the measuring point to the centroid also change. Consequently, measurements obtained by the sensors include not only the displacement of the cage in the corresponding direction but the error disturbance caused by the change in the cage’s attitude and thus cannot reflect the real trajectory of the centroid [12]. Therefore, when analyzing the measured data, the influence of the cage attitude change on the measuring results should be taken into account and compensated for accordingly to ensure the accuracy of the final test data [13].

2.2. Cage Centroid Trajectory Solution

2.2.1. Cage Deflection Angle Solution

Within the measurement range of the sensor, the deflection angle of the cage end face is determined only by its own attitude, which is independent of the position change of the cage in space. Therefore, the relative position of the three axial measuring points on the cage in space can be determined by the measuring results of the three axial sensors, and the deflection angle of the cage can be solved.
With the intersection point of the measuring line of the two radial sensors and the shaft line of the bearing as the origin point O, a measuring coordinate system is set up. Based on the arrangement position of the three axial sensors and the measured distances Z1, Z2, and Z3, the spatial coordinates (x1, y1, z1), (x2, y2, z2), and (x3, y3, z3) of the three axial measuring points can be obtained, and then the normal vector of the cage end face can be solved:
n = i j k x 2 x 1 y 2 y 1 z 2 z 1 x 3 x 1 y 3 y 1 z 3 z 1
The components of the normal vector A, B, and C are calculated:
A = y 2 y 1 z 3 z 1 y 3 y 1 z 2 z 1
B = z 2 z 1 x 3 x 1 z 3 z 1 x 2 x 1
C = x 2 x 1 y 3 y 1 x 3 x 1 y 2 y 1
Solving the equations, the plane equation of the cage end face is Ax + By + Cz + D = 0, and the normal vector is (a, b, c). The components of the deflection angle along the X and Y axes are calculated by the inverse cosine function:
θ x = arctan A C
θ y = arctan B C
where θx and θy are the deflection angles of the cage along the X and Y axes, respectively.

2.2.2. Cage Centroid Radial Vibration Solution

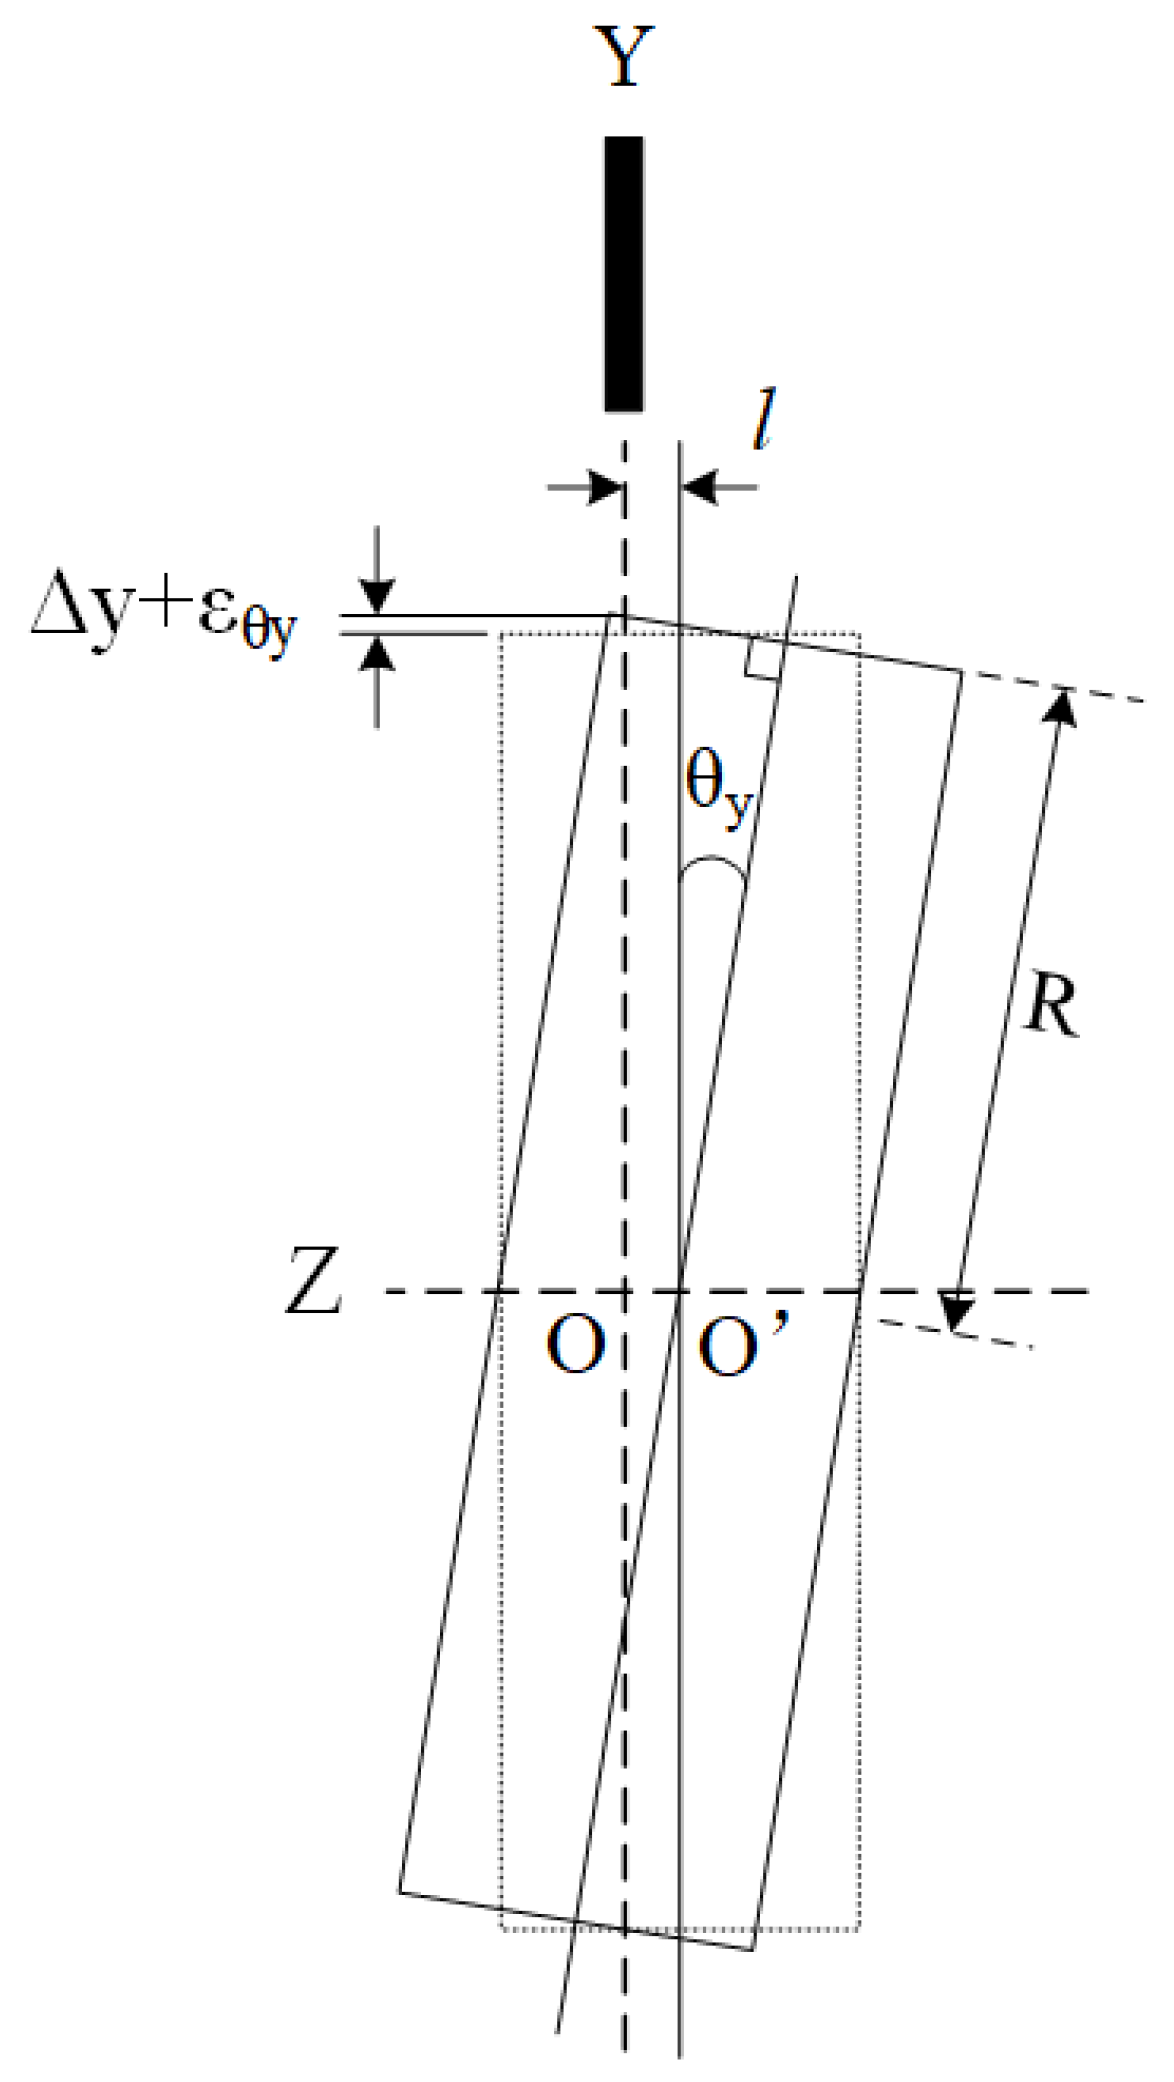
As shown in Figure 3, taking the sensor in the Y direction as a reference, the displacement measuring results of the radial sensor included not only the radial displacement of the cage but an accounting for the deflection error caused by the deflection of the cage’s attitude. The error is related not only to the deflection angle but to the distance between the measuring point position and the cage centroid along the axial direction.
The measuring results of the radial sensor are as follows:
Y = y + ε θ y = y + R 1 cos θ y cos θ y + d tan θ y
X = x + ε θ x = x + R 1 cos θ x cos θ x + d tan θ x
where Δx and Δy are the radial displacements of the cage in the X and Y directions, respectively; εθx and εθy are the deflection errors of the cages in the X and Y directions, respectively; R is the radius of the cage; and l is the axial distance between the origin point O of the measuring coordinate system and the centroid O’ of the cage.

2.2.3. Cage Centroid Axial Vibration Solution

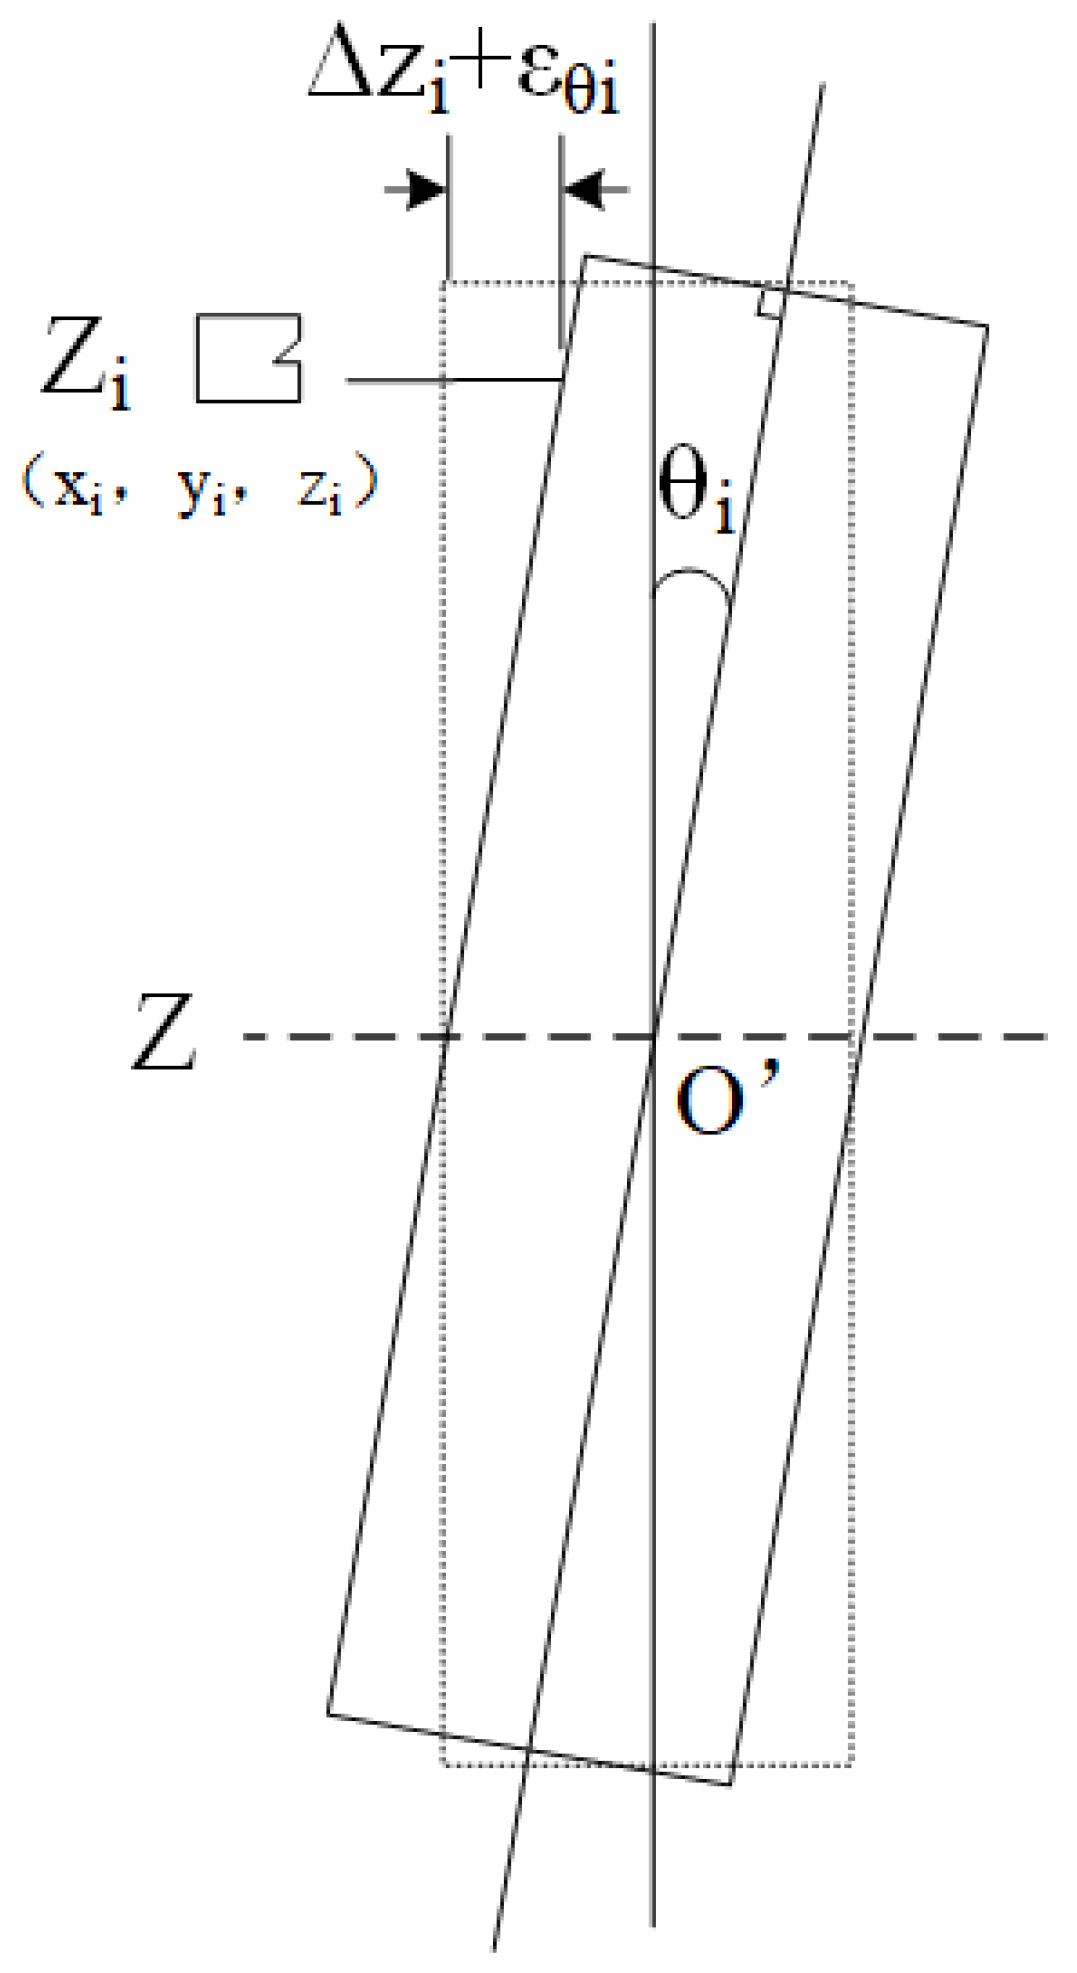
As shown in Figure 4, the measuring results included not only the axial displacement of the of the measuring points but the deflection error caused by the attitude deflection of the cage at each point. The error depends on the deflection angle and the distance from each measuring point to the shaft line.
According to the quadrants of the measuring points in the radial plane, the measurement results of the three axial sensors can be obtained as follows:
Z 1 = z 1 + ε θ 1 = z 1 + a x 1 + b y 1 c Z 2 = z 2 + ε θ 2 = z 2 + a x 2 + b y 2 c Z 3 = z 3 + ε θ 3 = z 3 + a x 3 b y 3 c
where Δzi are the axial displacement of each measuring point and εθi are the deflection error of each measuring point.
The axial displacement of the centroid is calculated by the axial displacement of three measurement points:
z = z 1 + z 2 + z 3 3

3. Angular-Contact Ball Bearing Dynamic Model

3.1. Bearing Dynamic Model

A 7010C angular-contact ball bearing model was created with SolidWorks software 2022 and imported into ADAMS software 2020 in Parasolid format for simulation analysis. The structure parameters of the bearing are listed in Table 1. The material of the rings and rollers was GGr15Z bearing steel, while the material of the cage was polyimide. The specific material parameters are listed in Table 2.

3.2. Boundary Condition Settings

In the simulation process, all parts of the bearing were regarded as rigid bodies, ignoring structural deformation during operation [1]. According to the actual operating conditions of the bearing, a fixed joint was applied to the outer ring to limit all its degrees of freedom; the inner ring was constrained by adding a parallel joint between the outer ring and the inner ring, while applying rotational drive around the axis, preserving its four degrees of freedom of translation in three directions and rotation around the axis; and the rollers and other components were constrained by establishing 54 pairs of contacts, while the rollers and cages retained six degrees of freedom. An axial force of 100 N was applied to the inner ring along the axial direction. Based on the simulation model, the centroid coordinates of the cage were obtained, and a measuring coordinate system was set up on its Z axis, as shown in Figure 5.
Based on the Hertz contact theory, the IMPACT function in ADAMS can be used to calculate the contact pressure between the rollers and other parts during motion. The formula for calculating the contact pressure F is as follows:
I M P A C T = 0 ; q > q 0 K q 0 q e c m a x d q d t STEP q , q 0 d , 1 , q 0 , 0 ; q q 0
where K is contact stiffness; q0 and q are the initial distance between two contact objects and the actual distance in the collision process, respectively; e is the instantaneous normal force index, with a value of 1.5 for the angular-contact ball bearing; cmax is the maximum damping coefficient, which is usually 0.1~1% of the contact stiffness; and d is the maximum penetration depth, which is defined as the deformation depth of the contact object when the maximum damping coefficient is defined, with a value of 0.01 mm in this paper [14].
In accordance with the Hertz contact theory, the contact-related parameters are calculated as follows:
R i e = 1 D w + 1 R i 1
R o e = 1 D w _ 1 R o 1
E * = 2 1 v 1 2 E 1 + 1 v 2 2 E 2 1
where Rie and Roe are the effective radii of curvature between the rollers and the bearing rings, respectively; Ri and Ro are the radii of the inner and outer rings, respectively; E* is the synthetic elastic modulus; E1 and E2 are the elastic moduli of the two contact objects; and v1 and v2 are the material Poisson’s ratios of the two contact objects.
The contact stiffness Ki and Ko between the roller and the rings are [15]:
K i = 2 2 E * 3 R i e k n i 1.5
K o = 2 2 E * 3 R o e k n o 1.5
where kni and kno are the contact deformation coefficients between the rollers and rings, respectively.
The Coulomb method can be used to calculate the friction between components. The expression for the coefficient of friction is:
μ = SIGN v μ d ; v > v d STEP v ,   v s , μ s , v d , μ d SIGN v ; v s v v d STEP v , v s , μ s , v s , μ s ; v s < v < v s
where v is the relative translational speed between two contact bodies; μd is the dynamic friction coefficient; μs is the static friction coefficient; vd is the translational speed of dynamic friction; and vs. is the translation speed of static friction.
In this paper, the dynamic coefficient of friction between the components was set to 0.02, and the static coefficient of friction was set to 0.1 [16].

3.3. Model Verification

To verify the accuracy of the established bearing dynamics model, the average rotational speed of the cage obtained from the simulated results was extracted and compared with the values calculated using the theoretical formula [17]:
n c = 1 2 n i 1 D w cos α d m
where nc is the theoretical rotational speed of the cage, ni is the rotational speed of the inner ring, and dm is the pitch diameter of the bearing.
The comparison between the theory and simulation of the cage rotation speed is shown in Table 3. It can be clearly seen that the average rotational speed of the cage obtained by simulation was generally consistent with the theoretical results, and the error did not exceed 1%, which verifies the rationality of the simulation model established in this paper.

4. Cage Motion Test and Simulation Verification

4.1. Cage Deflection Error Test and Simulation Comparison Verification

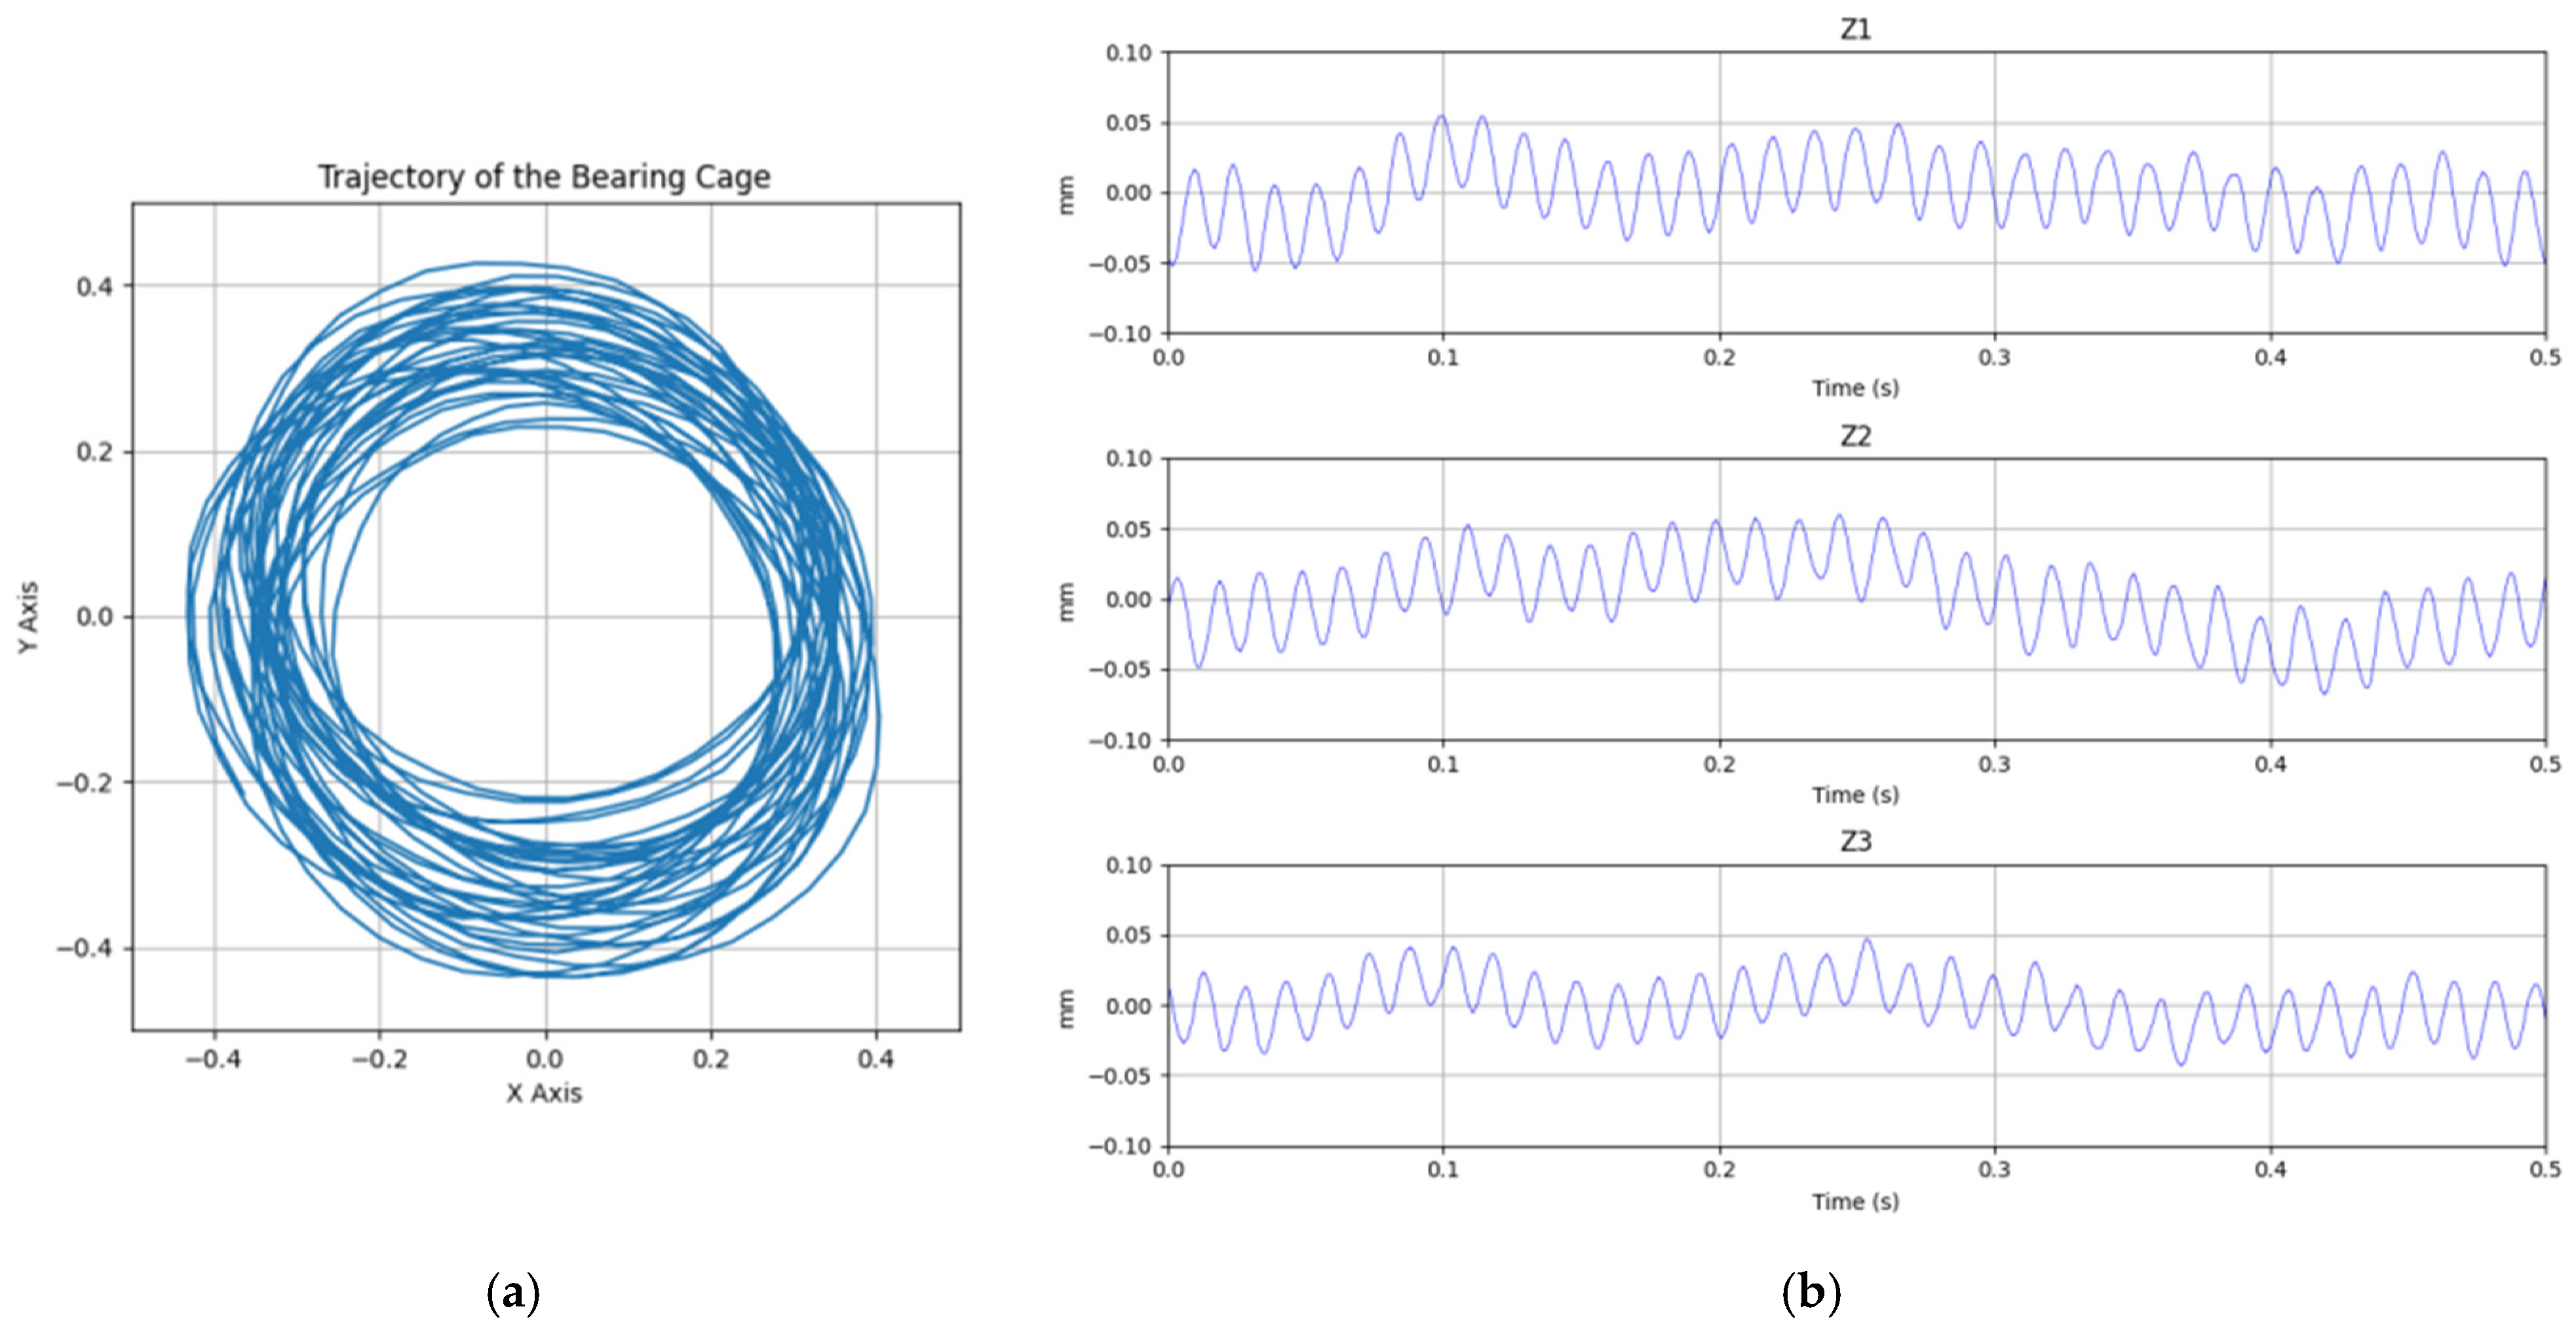
An axial load of 100 N was applied to the inner ring of the bearing to perform the cage motion test at different rotational speeds. The measured results of the radial trajectory and axial displacement of the cage when the rotational speed of the inner ring reached 10,000 r/min are shown in Figure 6. The radial trajectory and axial displacement of the centroid obtained by the above method of solving the cage centroid trajectory are shown in Figure 7.
It can be seen from Figure 6 and Figure 7 that the cage deflection had a significant effect on the measurement of axial displacement. Compared with the actual axial motion of the centroid, the vibration measured at the measuring point showed a periodicity consistent with the rotation frequency of the cage [18].
However, the influence of the deflection on the measurement of the cage radial trajectory is difficult to draw a conclusion on intuitively. Therefore, the differences between the maximum and minimum vortex radii of the cage motion trajectory were calculated for comparison. After measuring the cage motion trajectory at rotational speeds of 4000 r/min, 7000 r/min, 10,000 r/min, and 11,000 r/min, the vortex radius differences between the measured results and the solved results are shown in Table 4.
It can be seen from Table 4 that under the influence of cage deflection, the vortex radius difference obtained by measurement was slightly larger than that from the theoretical solution. When the rotational speed was less than 10,000 r/min, the error decreased with increasing rotational speed. However, once the rotational speed exceeded 10,000 r/min, the error started to increase with increasing rotational speed.
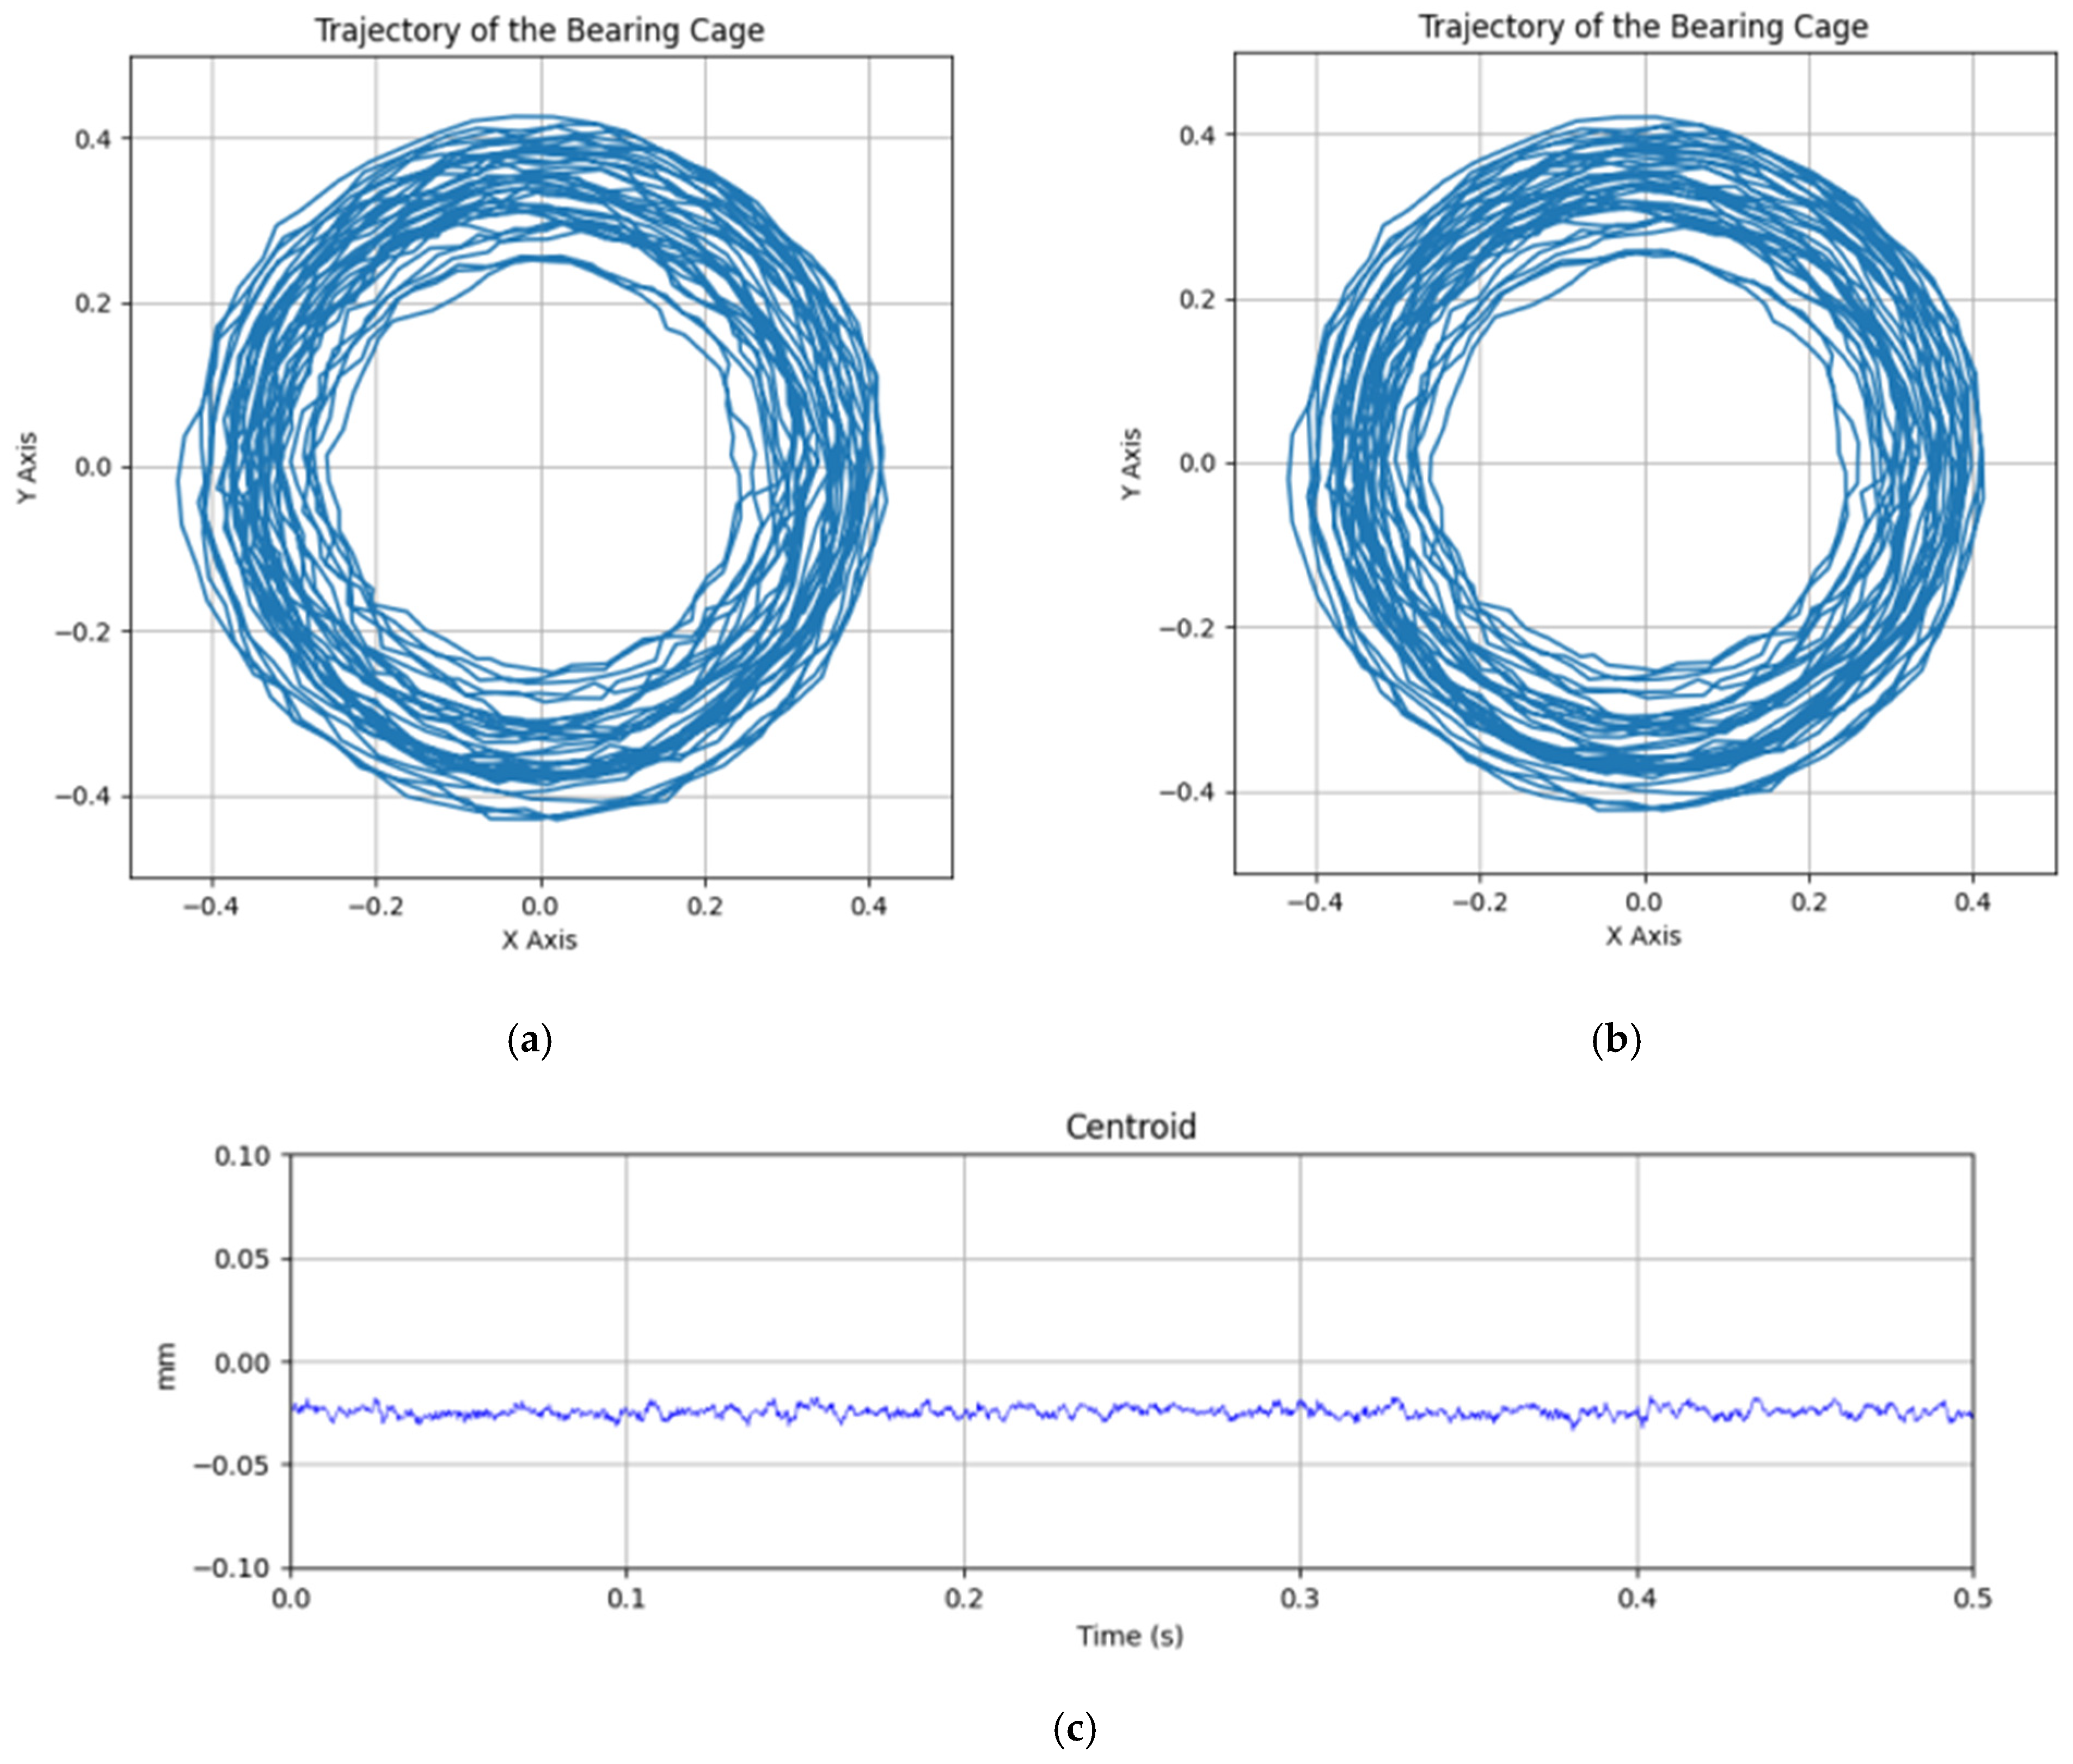
To verify the testing results, the bearing dynamics simulation was carried out at the above speeds. The simulated results of the cage motion trajectory at the rotational speed of 10,000 r/min are shown in Figure 8. From the simulation, the vortex radius differences between the origin point position of the measuring coordinate system and the centroid position are shown in Table 5.
It can be seen from the above figures and table that there was good consistency between the simulation and test for the measurement error caused by cage deflection. The correctness and effectiveness of the method proposed in this paper for solving the cage centroid trajectory were verified.

4.2. Dynamic Characteristics of Cage with Rotational Speed

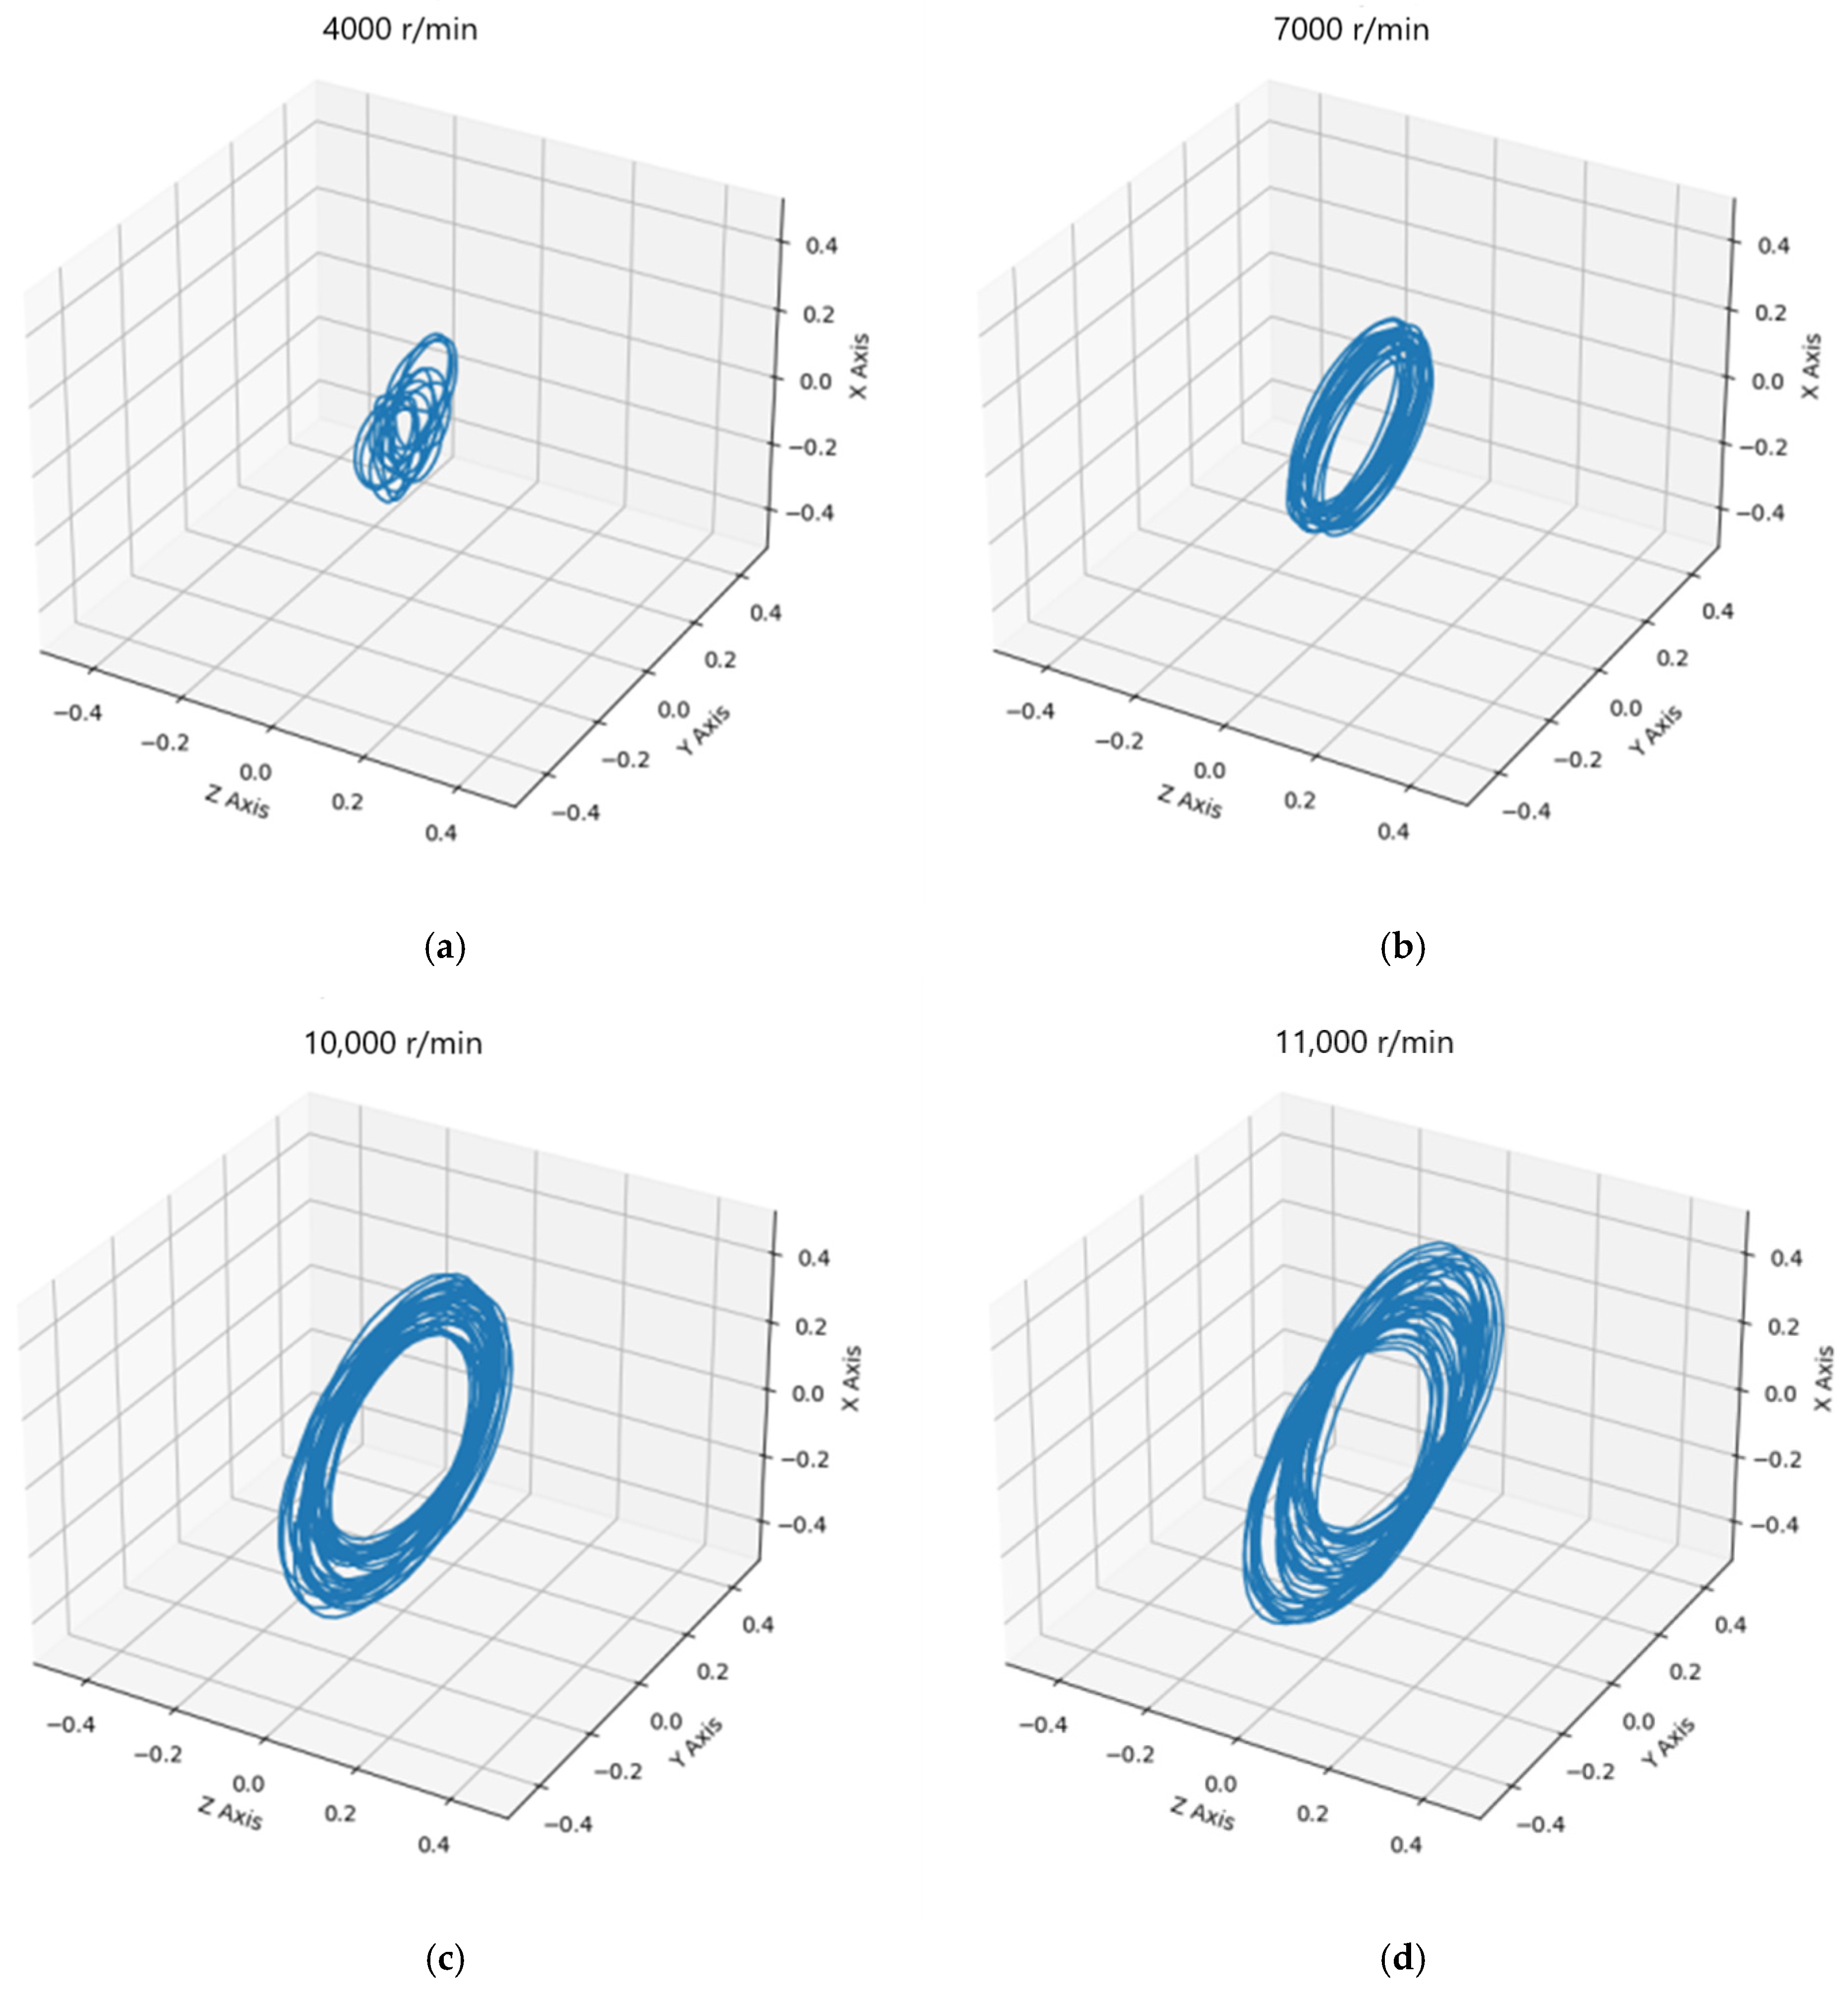
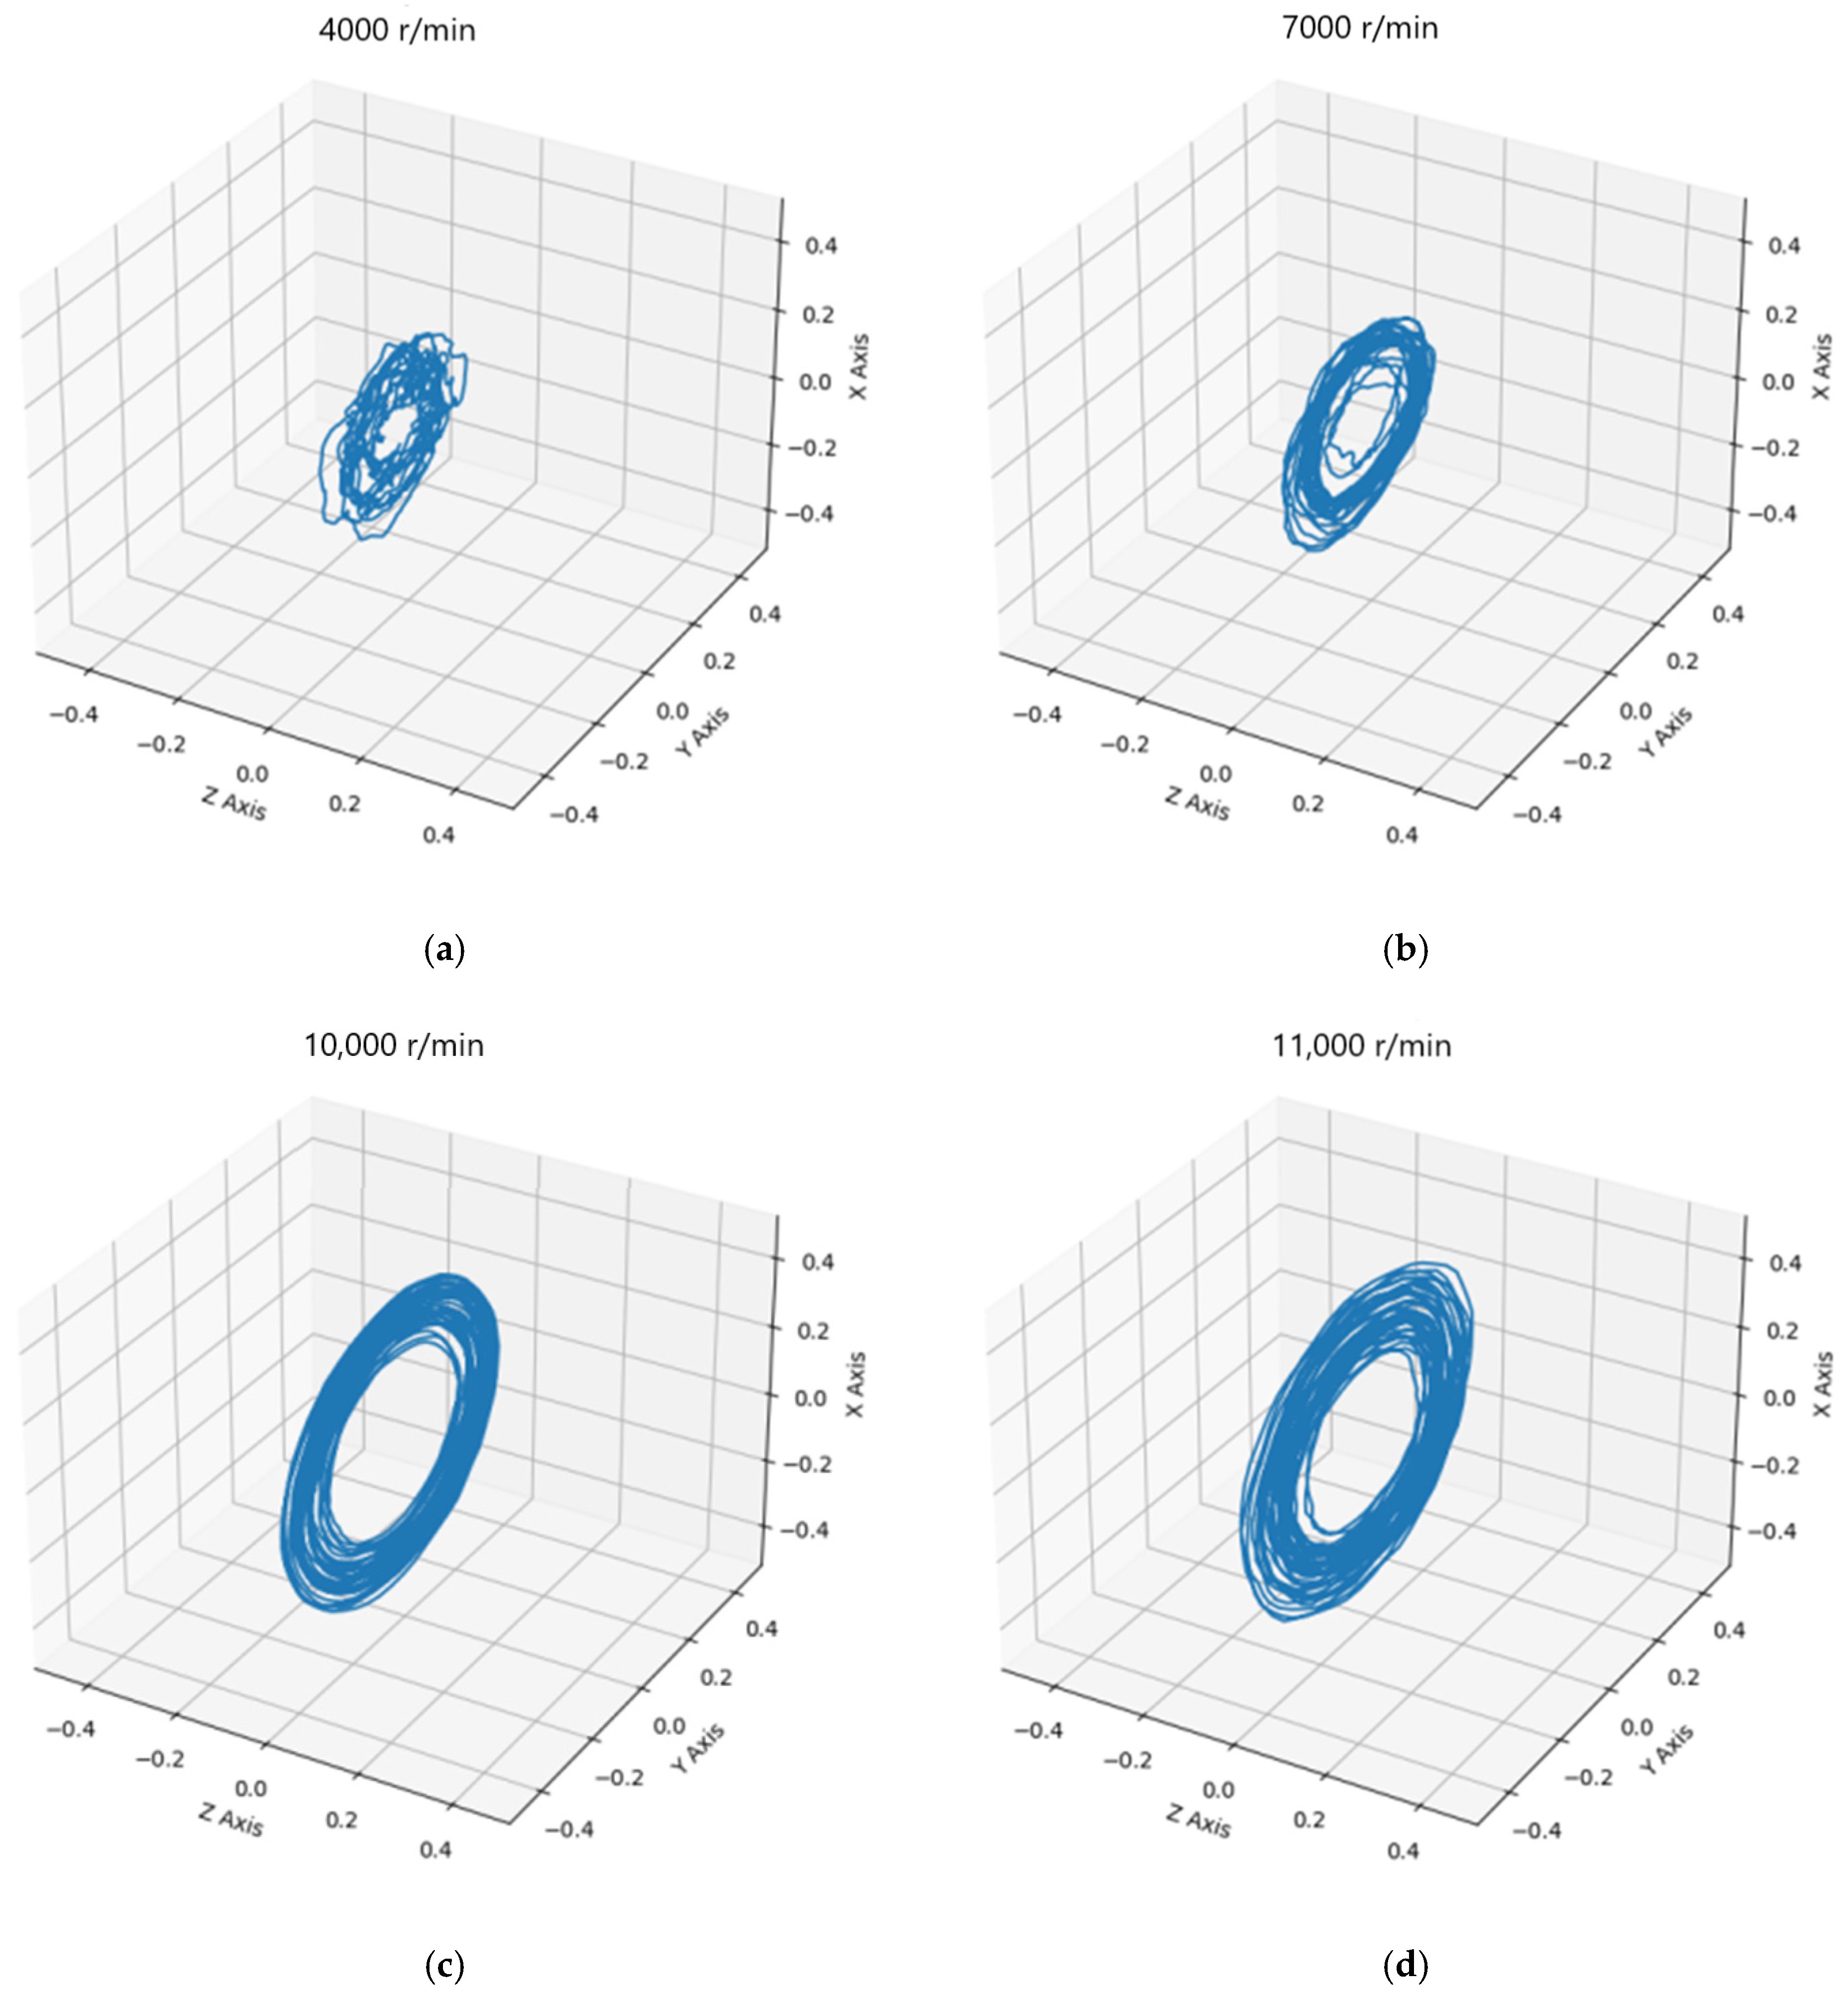
The dynamic characteristics of cages usually vary with different working conditions. In previous studies [19,20], the motion stability of the cage was evaluated by the centroid trajectory. When the spatial trajectory of the centroid is close to a ring or a cylinder, the motion state of the cage is relatively steady. At the above-mentioned rotational speeds, the spatial trajectories of the centroid obtained by test and simulation are shown in Figure 9 and Figure 10.
As clearly shown in the figures above, when the rotational speed was less than 10,000 r/min, the centroid trajectory gradually tended to be a regular circle with increasing rotational speed, and the vortex radius increased. When the rotational speed exceeded 10,000 r/min, the motion stability of the cage centroid started to deteriorate.
Figure 11 shows the vortex radius ratios (ratios of vortex radius difference to average vortex radius) obtained from both test and simulation at different rotational speeds, which reflects the influence of rotational speed on the degree of divergence of the centroid radial trajectory [21]. The vortex radius ratio gradually decreased with increasing rotational speed when the rotational speed was below 10,000 r/min and began to increase when the rotational speed exceeded 10,000 r/min, indicating that the cage motion gradually stabilized with increasing rotational speed and then showed a gradual deteriorating trend. This phenomenon occurs because the unbalanced force exerted by the cage itself increases with rotational speed, thereby playing a dominant role in maintaining stable whirling. However, once the rotational speed exceeds 10,000 r/min, the interaction between pockets and rollers begins to surpass the unbalanced force of the cage, resulting in unequal spacing among the rollers [22]. Consequently, this leads to a decline in motion stability within the cage and exhibits an increasingly divergent trend [23,24]. In addition, it can be noted that the change trend of the vortex radius ratios and the errors of the vortex radius differences in Table 5 had the same law, indicating that deflection errors during the measuring process were negatively correlated with cage motion stability; instability within the cage resulted in larger deflection angles.

5. Conclusions

Based on the challenge of measuring the centroid trajectory of rolling bearing cages, this paper proposes a method for measuring the centroid trajectory considering the cage deflection error, which aims to improve the accuracy and reliability of centroid trajectory analysis. The influence of the rotational speed on the motion stability of the cage was evaluated with the indexes of the vortex radius ratio of the cage centroid trajectory, and the correctness of the measuring method was verified by comparing with simulation results using a dynamic model. The main conclusions were as follows.
Through both tests and simulations of cage motion trajectory, the results verified the influence of cage deflection on the accuracy of measurement of centroid trajectories. In addition, the results verified the feasibility of the proposed method for measuring cage centroid trajectories while considering the deflection error, as well as its effectiveness in improving the measurement accuracy.
The test and simulation results showed that in the test rotational speed range, the motion stability of the cage initially increased with increasing rotational speed and showed a tendency to deteriorate after exceeding a certain rotational speed. The influence of cage deflection on measurement accuracy was negatively correlated with the motion stability of the cage.

Author Contributions

Conceptualization, X.M. and C.L.; Methodology, J.Y., X.M. and H.Z.; Validation, J.Y. and M.Z.; Investigation, M.Z.; Resources, X.M.; Data curation, J.Y. and D.J.; Writing—original draft, J.Y. and H.Z.; Writing—review & editing, X.M. and C.L.; Funding acquisition, X.M. and D.J. All authors have read and agreed to the published version of the manuscript.

Funding

This research was funded by: National Key Research and Development Plan (Grant No. 2021YFB2011000); Longmen Laboratory Tuyere Industry Project (Grant No. LMFKCY2023001); Frontier Exploration Project of Longmen Laboratory (Grant No. LMQYTSKT037); and the Key Scientific and Technological Project of Henan Province (Grant No. 242102220081).

Data Availability Statement

The original contributions presented in the study are included in the article, further inquiries can be directed to the corresponding author.

Conflicts of Interest

The authors declare no conflict of interest.

References

  1. Petuya, K. Angular Contact Ball Bearing Modelling with Flexible Cage. Ph.D. Thesis, INSA de Lyon, Villeurbanne, France, 2022. (In English). [Google Scholar]
  2. Boesiger, E.A.; Donley, A.D.; Loewenthal, S. An Analytical and Experimental Investigation of Ball Bearing Retainer Instabilities. ASME J. Tribol. 1992, 114, 530–538. [Google Scholar] [CrossRef]
  3. Xu, F.; Ding, N.; Li, N.; Liu, L.; Hou, N.; Xu, N.; Guo, W.; Tian, L.; Xu, H.; Lawrence Wu, C.; et al. A Review of Bearing Failure Modes, Mechanisms and Causes. Eng. Fail. Anal. 2023, 152, 107518. [Google Scholar] [CrossRef]
  4. Li, Y.; Tao, C.H.; Zhang, W.; Jiang, T. Fracture analysis on cage rivets of a cylindrical roller bearing. Eng. Fail. Anal. 2008, 15, 796–801. [Google Scholar] [CrossRef]
  5. Fan, R.; Yao, T.; Liu, X.; Xiong, T. Stability Analysis of Angular Contact Ball Bearing Cage. Mach. Des. Res. 2017, 33, 76–81. [Google Scholar]
  6. Gupta, P.K.; Dill, J.F.; Bandow, H.E. Dynamics of Rolling Element—Bearings Experimental Validation of the DREB and RAPIDREB Computer Programs. J. Tribol. Trans. ASME 1985, 107, 132–137. [Google Scholar] [CrossRef]
  7. Schwarz, S.; Grillenberger, H.; Tremmel, S.; Wartzack, S. Prediction of Rolling Bearing Cage Dynamics Using Dynamic Simulations and Machine Learning Algorithms. Tribol. Trans. 2022, 65, 225–241. [Google Scholar] [CrossRef]
  8. Li, Y.; Li, W.; Zhu, Y.; He, G.; Ma, S.; Hong, J. Dynamic Performance Analysis of Cage in Four-Point Contact Ball Bearing. Lubricants 2022, 10, 149. [Google Scholar] [CrossRef]
  9. Yang, Z.; Chen, H.; Yu, T.; Li, B. A high-precision instrument for analyzing nonlinear dynamic behavior of bearing cage. Rev. Sci. Instrum. 2016, 87, 085105. [Google Scholar] [CrossRef] [PubMed]
  10. Huang, D. Detection and CharacteristicA nalysis for M assCenterO rbitofBearing Cag. China Mech. Eng. 2012, 23, 1779–1784. [Google Scholar] [CrossRef]
  11. Liu, Y.; Zhang, P.; Chao, B.; Yan, K.; Hong, J. A Non-Intrusive Rolling Bearing Cage Traj ectory Extraction Method Using Image Processing Program. J. Xi’an Jiaotong Univ. 2024, 58, 95–105. [Google Scholar] [CrossRef]
  12. Zhu, M. Mechanical Characteristics of High Speed Speed Precision Ball Bearing and Stability Analysis of Cage. Master’s Thesis, Inner Mongolia University of Science & Technology, Hohhot, China, 2022. [Google Scholar]
  13. Zhao, Z. Research on Trajectory and Measurement Technology of Rolling Bearing Cage. Master’s Thesis, Henan University of Science and Technology, Luoyang, China, 2015. [Google Scholar] [CrossRef]
  14. Sun, Y.; Song, B.; Liu, H.; Wen, B. Analysis on Dynamic Characteristics of Cages in Heavy Axle Load Railway Freight Bearings. Bearing 2019, 12, 1–5. [Google Scholar] [CrossRef]
  15. Zhang, Y.; Yao, T.; Liu, Z.; Cheng, X. Stability Study of Thin Walled Four Point Contact Ball Bearing Cage. Light Ind. Mach. 2021, 39, 1–6. [Google Scholar] [CrossRef]
  16. Wang, Y.; Deng, S. Influence of Rheological Model on Computation of Traction Coefficient of Aviation Lubricating Oils. Acta Aeronaut. Astronaut. Sin. 2009, 30, 220–225. [Google Scholar]
  17. Tu, W.; He, H.; Liu, L.; Luo, Y. Analysis on Cage Dynamic Characteristic of Angular Contact Ball Bearing During Deceleration. J. Mech. Transm. 2019, 43, 125–129. [Google Scholar] [CrossRef]
  18. Wen, B.; Ren, H.; Zhang, H.; Han, Q. Experimental investigation of cage motions in an angular contact ball bearing. Proc. Inst. Mech. Eng. Part J J. Eng. Tribol. 2017, 231, 1041–1055. [Google Scholar] [CrossRef]
  19. Wu, Z.; Xu, Y.; Deng, S.; Cao, D. Dynamic stability of cages in high-speed tapered roller bearings with grease lubrication. J. Vib. Shock 2019, 38, 49–57. [Google Scholar]
  20. Yao, T.; Wang, L.; Liu, X.; Huang, Y. Dynamic stability analysis on the cage of ball bearing under varying working environment. J. Vib. Shock 2016, 35, 172–180. [Google Scholar]
  21. Sakaguchi, T.; Harada, K. Dynamic Analysis of Cage Behavior in a Tapered Roller Bearing. ASME J. Tribol. 2006, 128, 604–611. [Google Scholar] [CrossRef]
  22. Niu, L.; Cao, H.; He, Z.; Li, Y. An investigation on the occurrence of stable cage whirl motions in ball bearings based on dynamic simulations. Tribol. Int. 2016, 103, 12–24. [Google Scholar] [CrossRef]
  23. Rivera, M.P. Bearing-Cage Frictional Instability—A Mechanical Model. Tribol. Trans. 1991, 34, 117–121. [Google Scholar] [CrossRef]
  24. Zhang, H.; Lei, X.; He, Y. The Effect of Geometric and Working Parameters on Dynamic Performance of Flexible Cages on Bearings. Flight Control Detect. 2021, 4, 73–79. [Google Scholar]
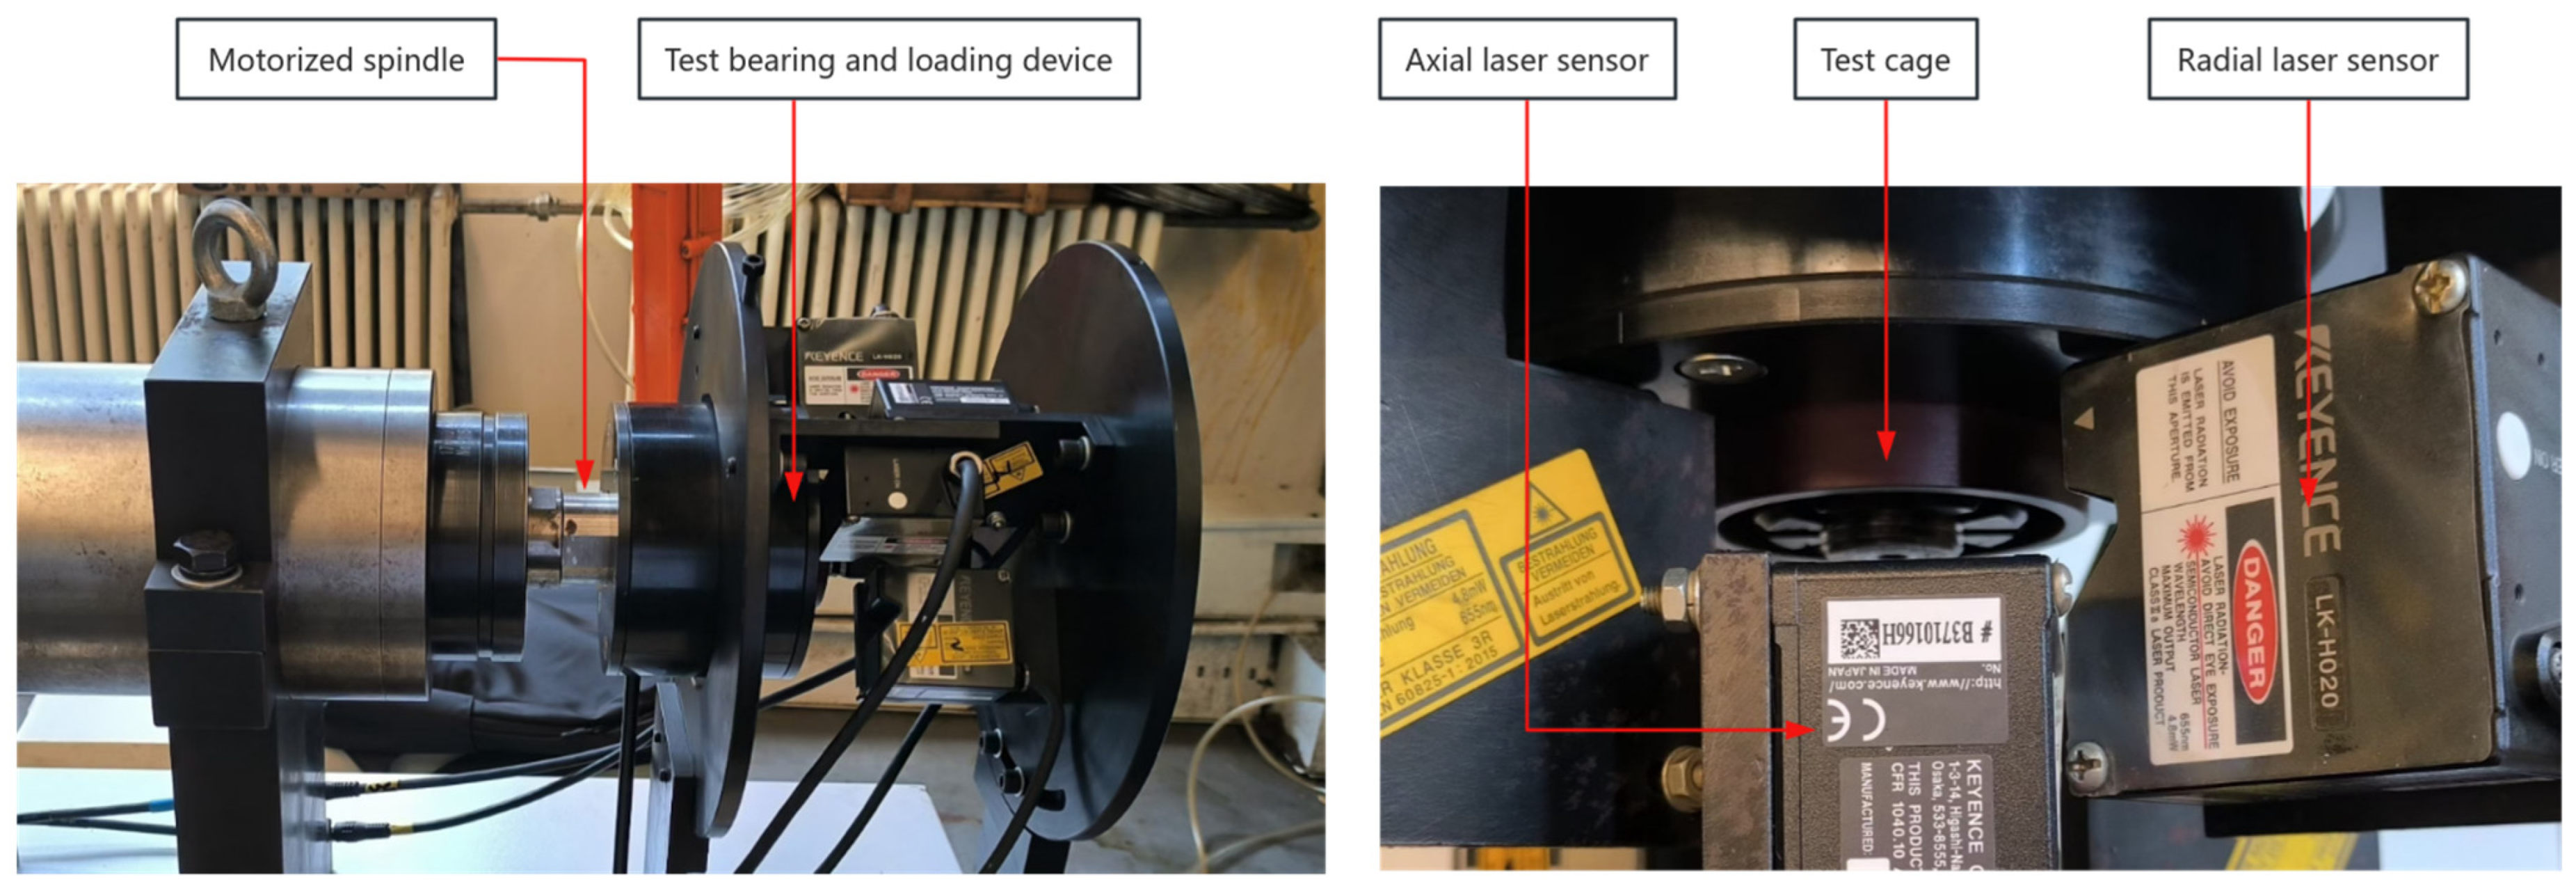
Figure 1. Bearing cage trajectory measurement test bench.
Lubricants 12 00379 g001
Figure 2. Concrete arrangement of the laser sensors.
Lubricants 12 00379 g002
Figure 3. Composition of radial displacement measurement.
Lubricants 12 00379 g003
Figure 4. Composition of axial displacement measurement.
Lubricants 12 00379 g004
Figure 5. Dynamic model of 7010C angular-contact ball bearing.
Lubricants 12 00379 g005
Figure 6. Measured results of cage motion at the rotational speed of 10,000 r/min. (a) Radial trajectory; (b) axial displacement.
Lubricants 12 00379 g006
Figure 7. Cage centroid motion at the rotational speed of 10,000 r/min. (a) Radial trajectory; (b) axial displacement.
Lubricants 12 00379 g007
Figure 8. Simulated results of cage motion at the rotational speed of 10,000 r/min. (a) Radial trajectory of origin point; (b) radial trajectory of centroid; (c) axial displacement.
Lubricants 12 00379 g008
Figure 9. Tested results of centroid space trajectory at different rotational speeds: (a) 4000 r/min; (b) 7000 r/min; (c) 10,000 r/min; (d) 11,000 r/min.
Lubricants 12 00379 g009
Figure 10. Simulated results of centroid space trajectory at different rotational speeds: (a) 4000 r/min; (b) 7000 r/min; (c) 10,000 r/min; (d) 11,000 r/min.
Lubricants 12 00379 g010
Figure 11. Vortex radius ratio of the cage centroid trajectory at different rotational speeds.
Lubricants 12 00379 g011
Table 1. Structural parameters of the 7010C angular-contact ball bearing.
ParametersValue
Bearing bore diameter/d50 mm
Bearing outside diameter/D80 mm
Bearing width/B16 mm
Roller diameter/Dw9.525 mm
Number of rollers/Z18
Contact angle/α15°
Table 2. Material parameters of the 7010C angular-contact ball bearing.
MaterialDensity (kg/m3)Poisson’s RatioElastic Modulus (GPa)
GGr15Z bearing steel78000.30208
Polyimide11200.342.62
Table 3. Comparison of simulated and theoretical rotational speeds of a cage.
Inner Ring Rotational Speed (r/min)Cage Theoretical Rotational Speed (r/min)Cage Simulated Rotational Speed (r/min)Error
40001716.91712.50.25%
70003004.62986.90.59%
10,0004292.34258.30.79%
11,0004721.54748.50.57%
Table 4. Comparison of measured and solved results of cage vortex radius differences.
Inner Ring Rotational Speed (r/min)Vortex Radius Difference (mm)Error
Measured ResultsSolved Results
40000.24360.23115.40%
70000.22390.21673.33%
10,0000.23810.23142.91%
11,0000.28130.27093.86%
Table 5. Comparison of simulated results of cage vortex radius differences.
Inner Ring Rotational Speed (r/min)Vortex Radius Difference (mm)Error
Origin PointCentroid
40000.26610.25494.40%
70000.24880.24133.12%
10,0000.19410.18862.95%
11,0000.25940.25123.25%
Disclaimer/Publisher’s Note: The statements, opinions and data contained in all publications are solely those of the individual author(s) and contributor(s) and not of MDPI and/or the editor(s). MDPI and/or the editor(s) disclaim responsibility for any injury to people or property resulting from any ideas, methods, instructions or products referred to in the content.