Lubrication Analysis of a Mechanical Seal Considering the Mixed Lubricant State of Gas and Liquid During External Power Shutdown of a Reactor Cooling Pump


Abstract
:1. Introduction
2. Method of Analysis
2.1. Lubrication Analysis in Fluid Film
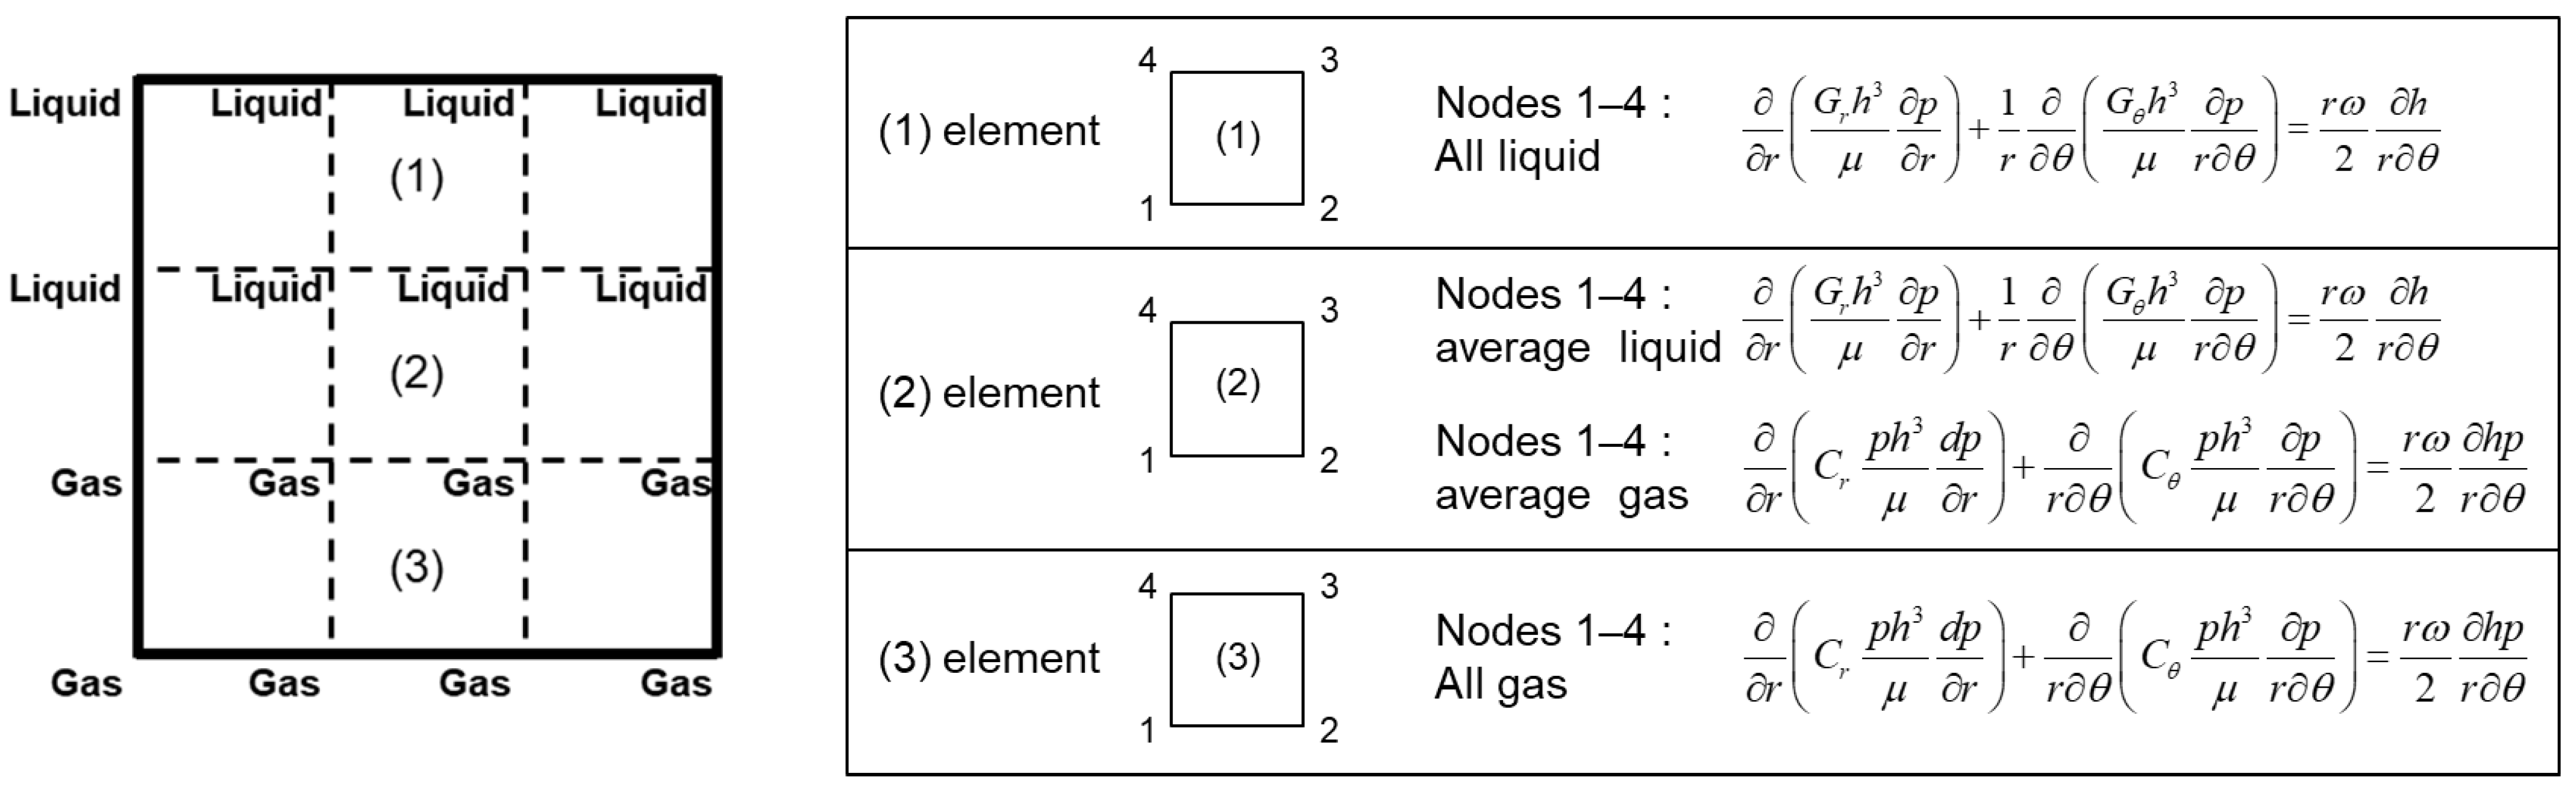
2.1.1. Finite Element Equation of Incompressible Lubricant
2.1.2. Finite Element Equation of Compressible Lubricant
2.2. Thermal Analysis in Fluid Film
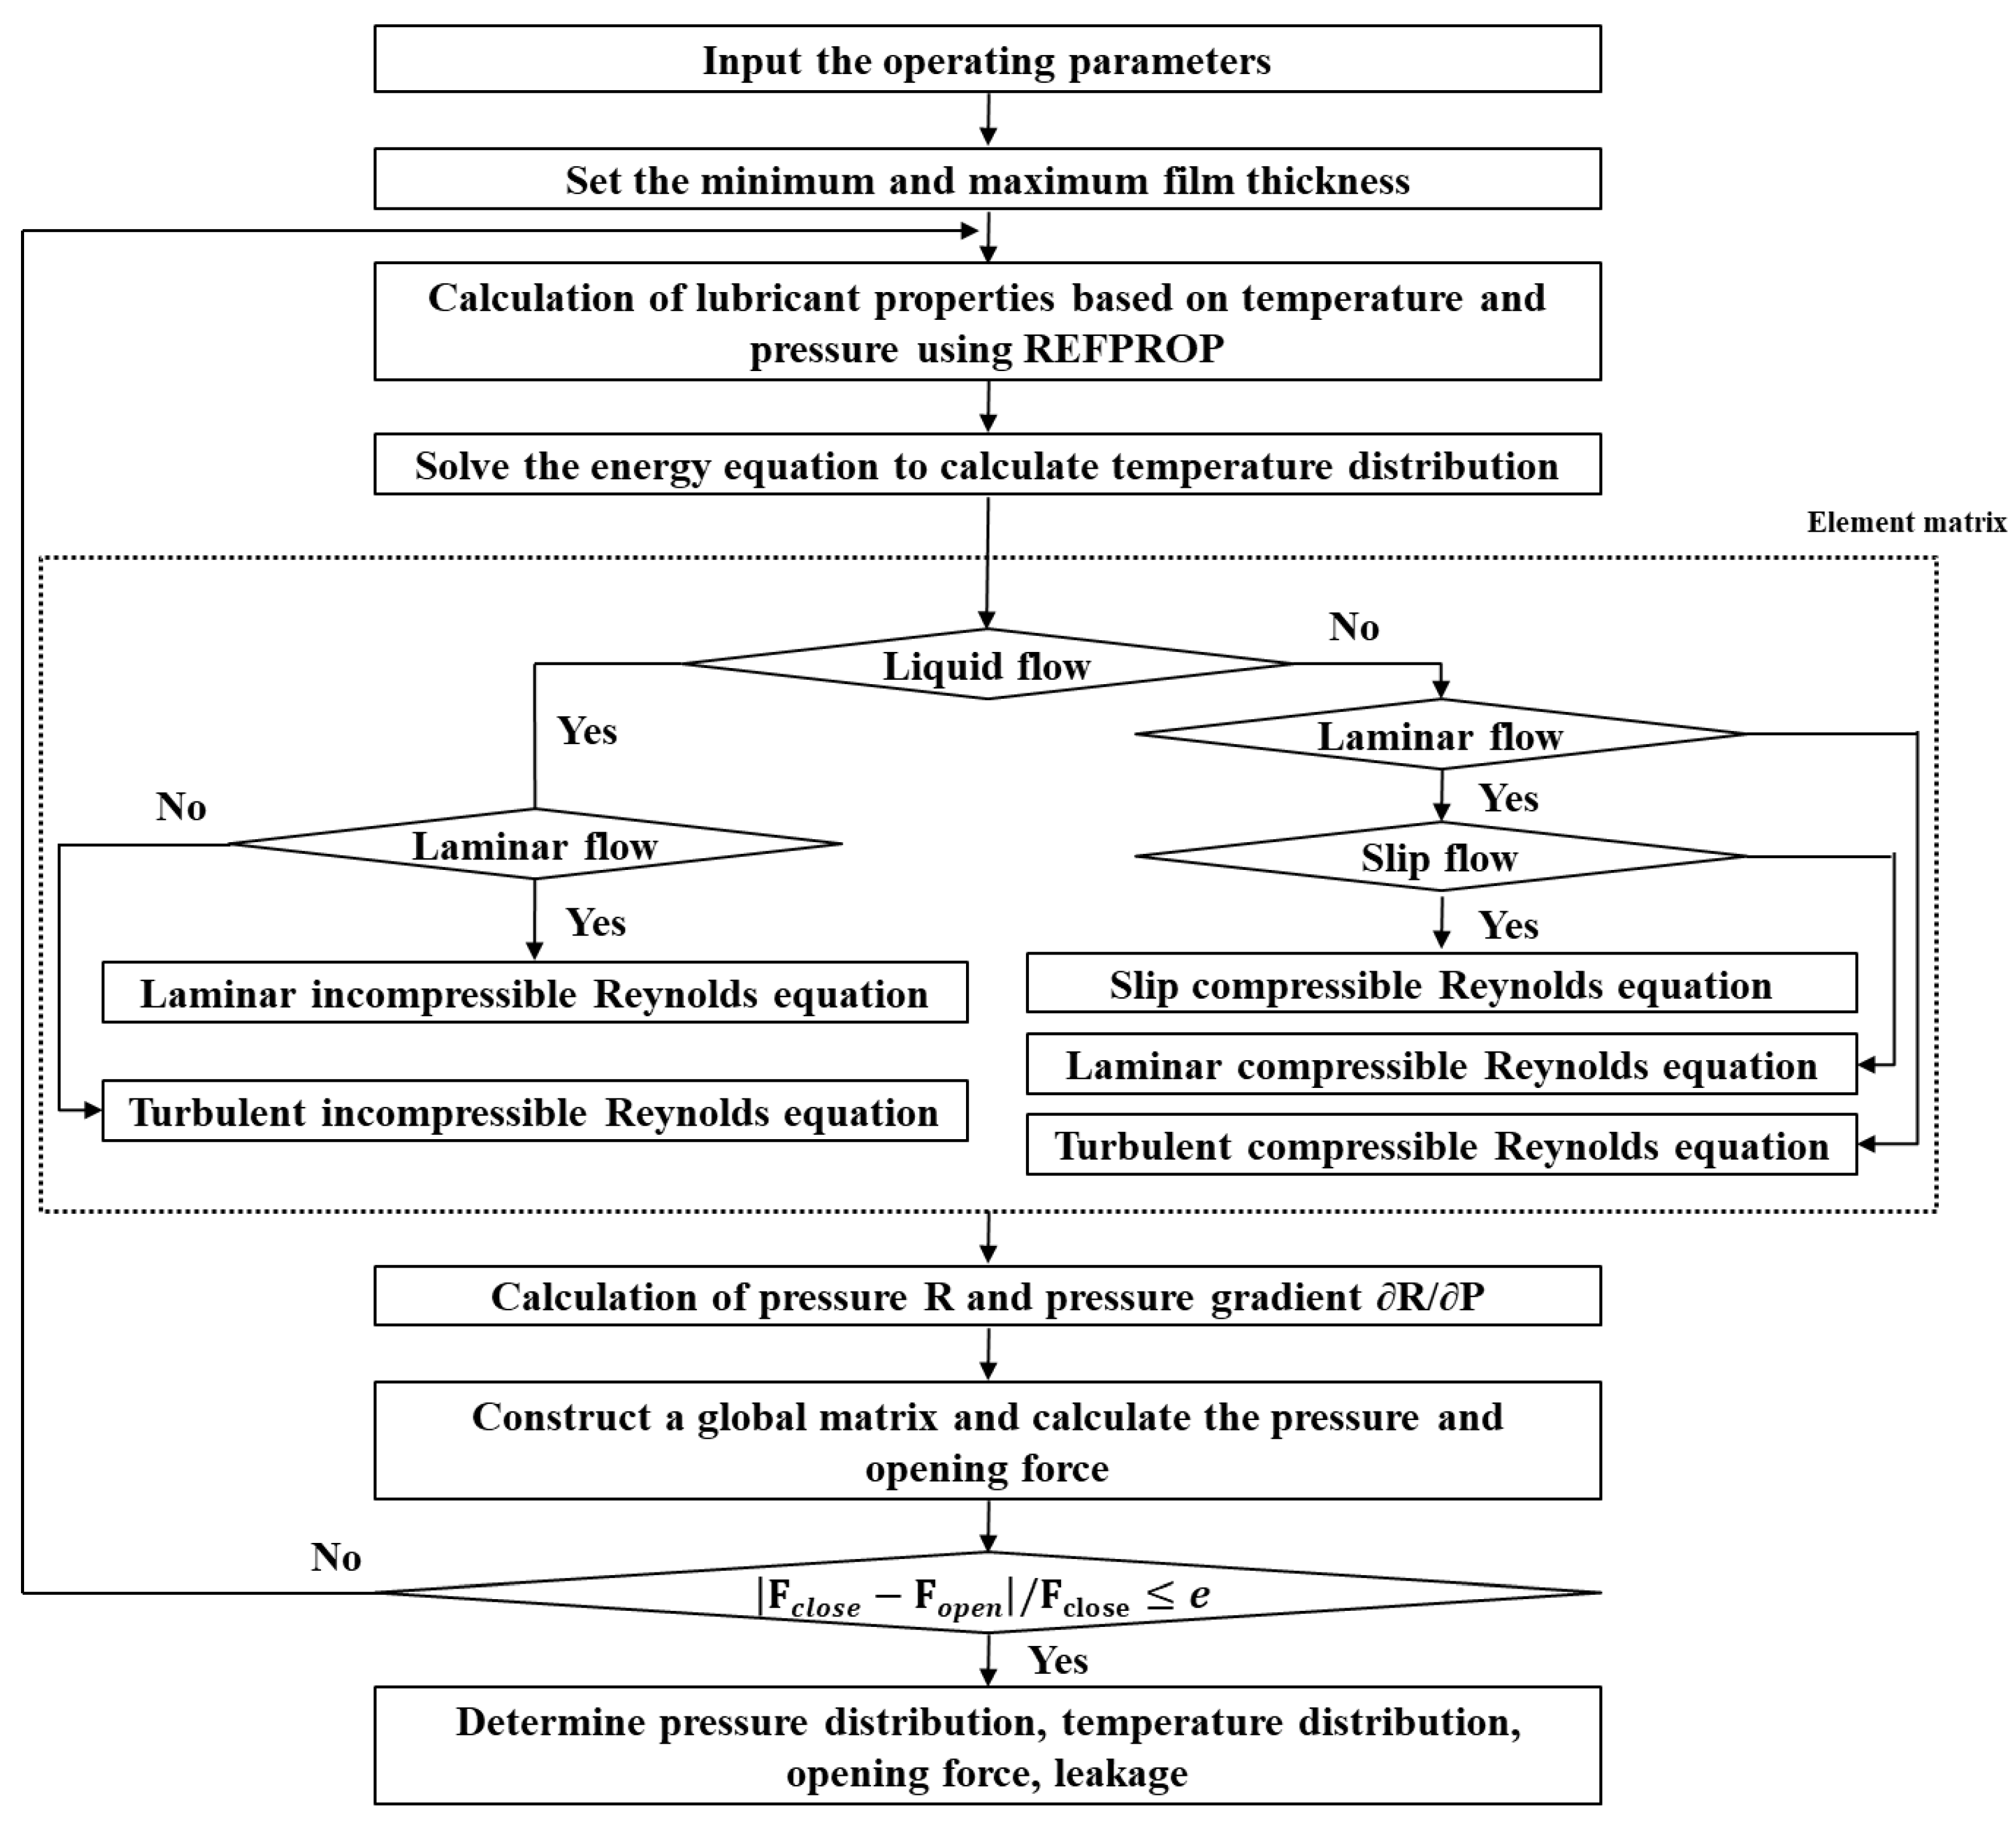
2.3. Numerical Analysis Method
3. Numerical Verification
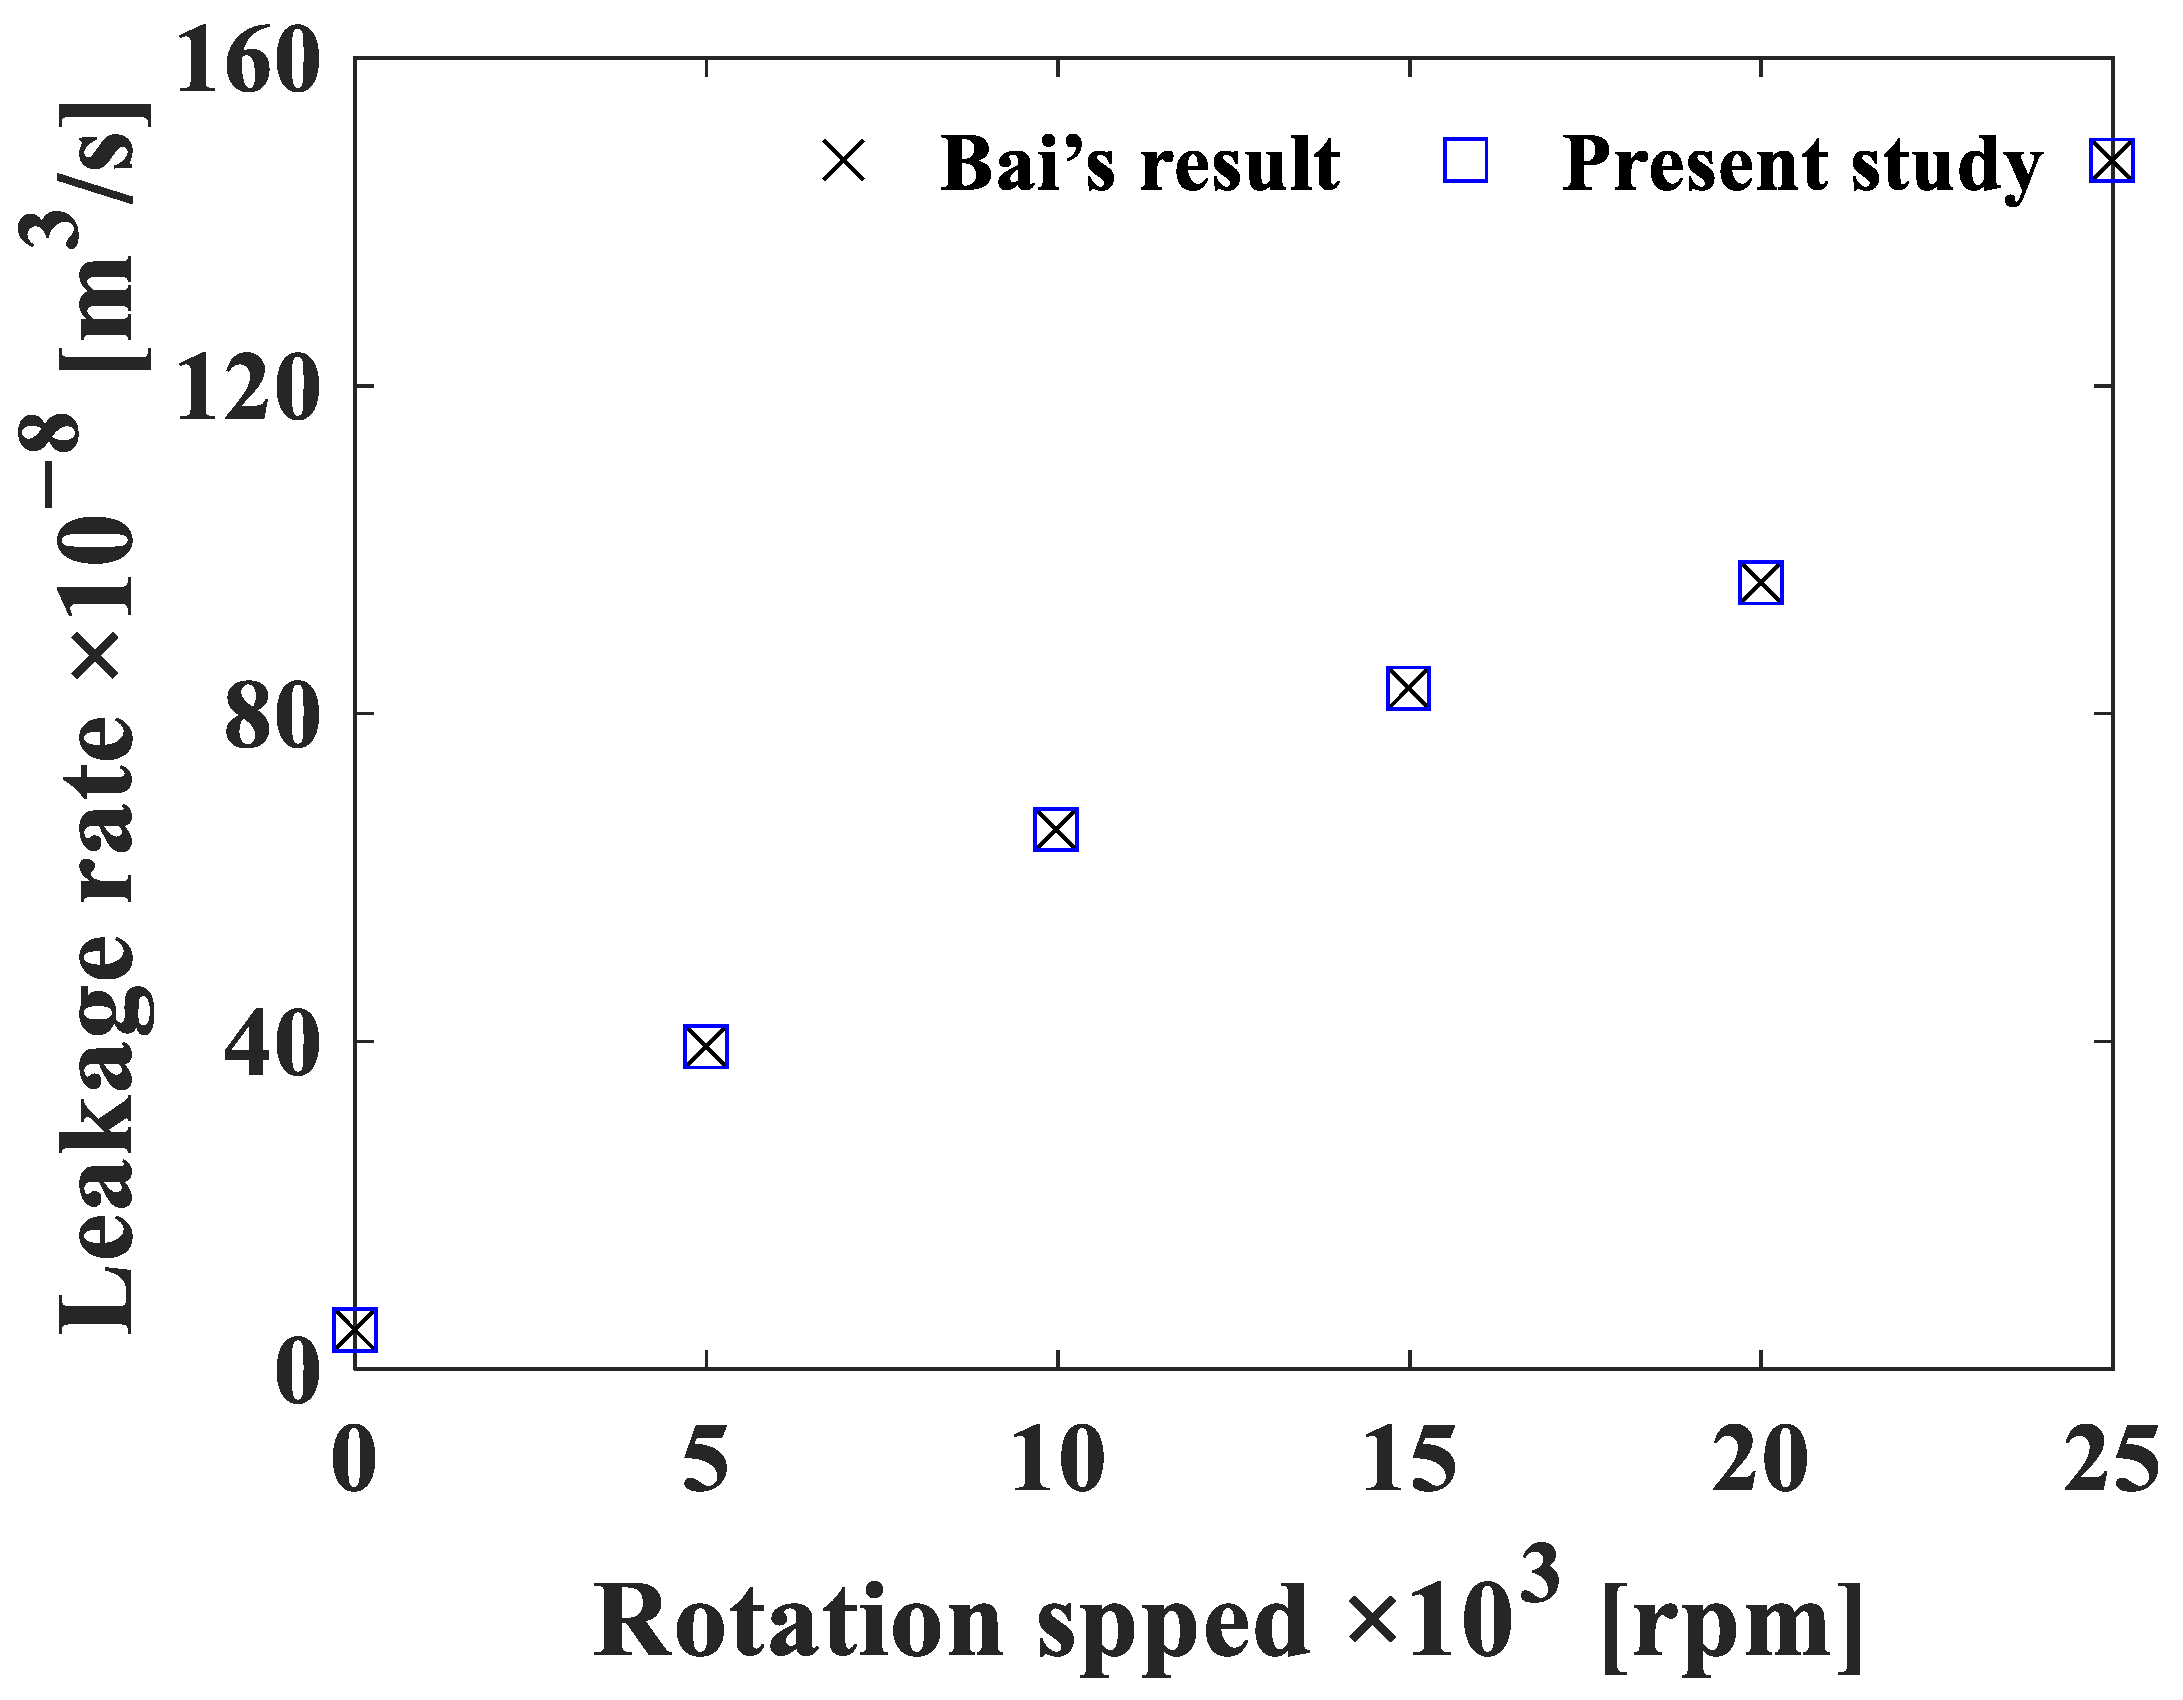
3.1. Verification of the Liquid State in the Developed Program Compared to Previous Studies
3.2. Verification of the Gas State in the Developed Program Compared to Previous Studies
4. Results and Discussion
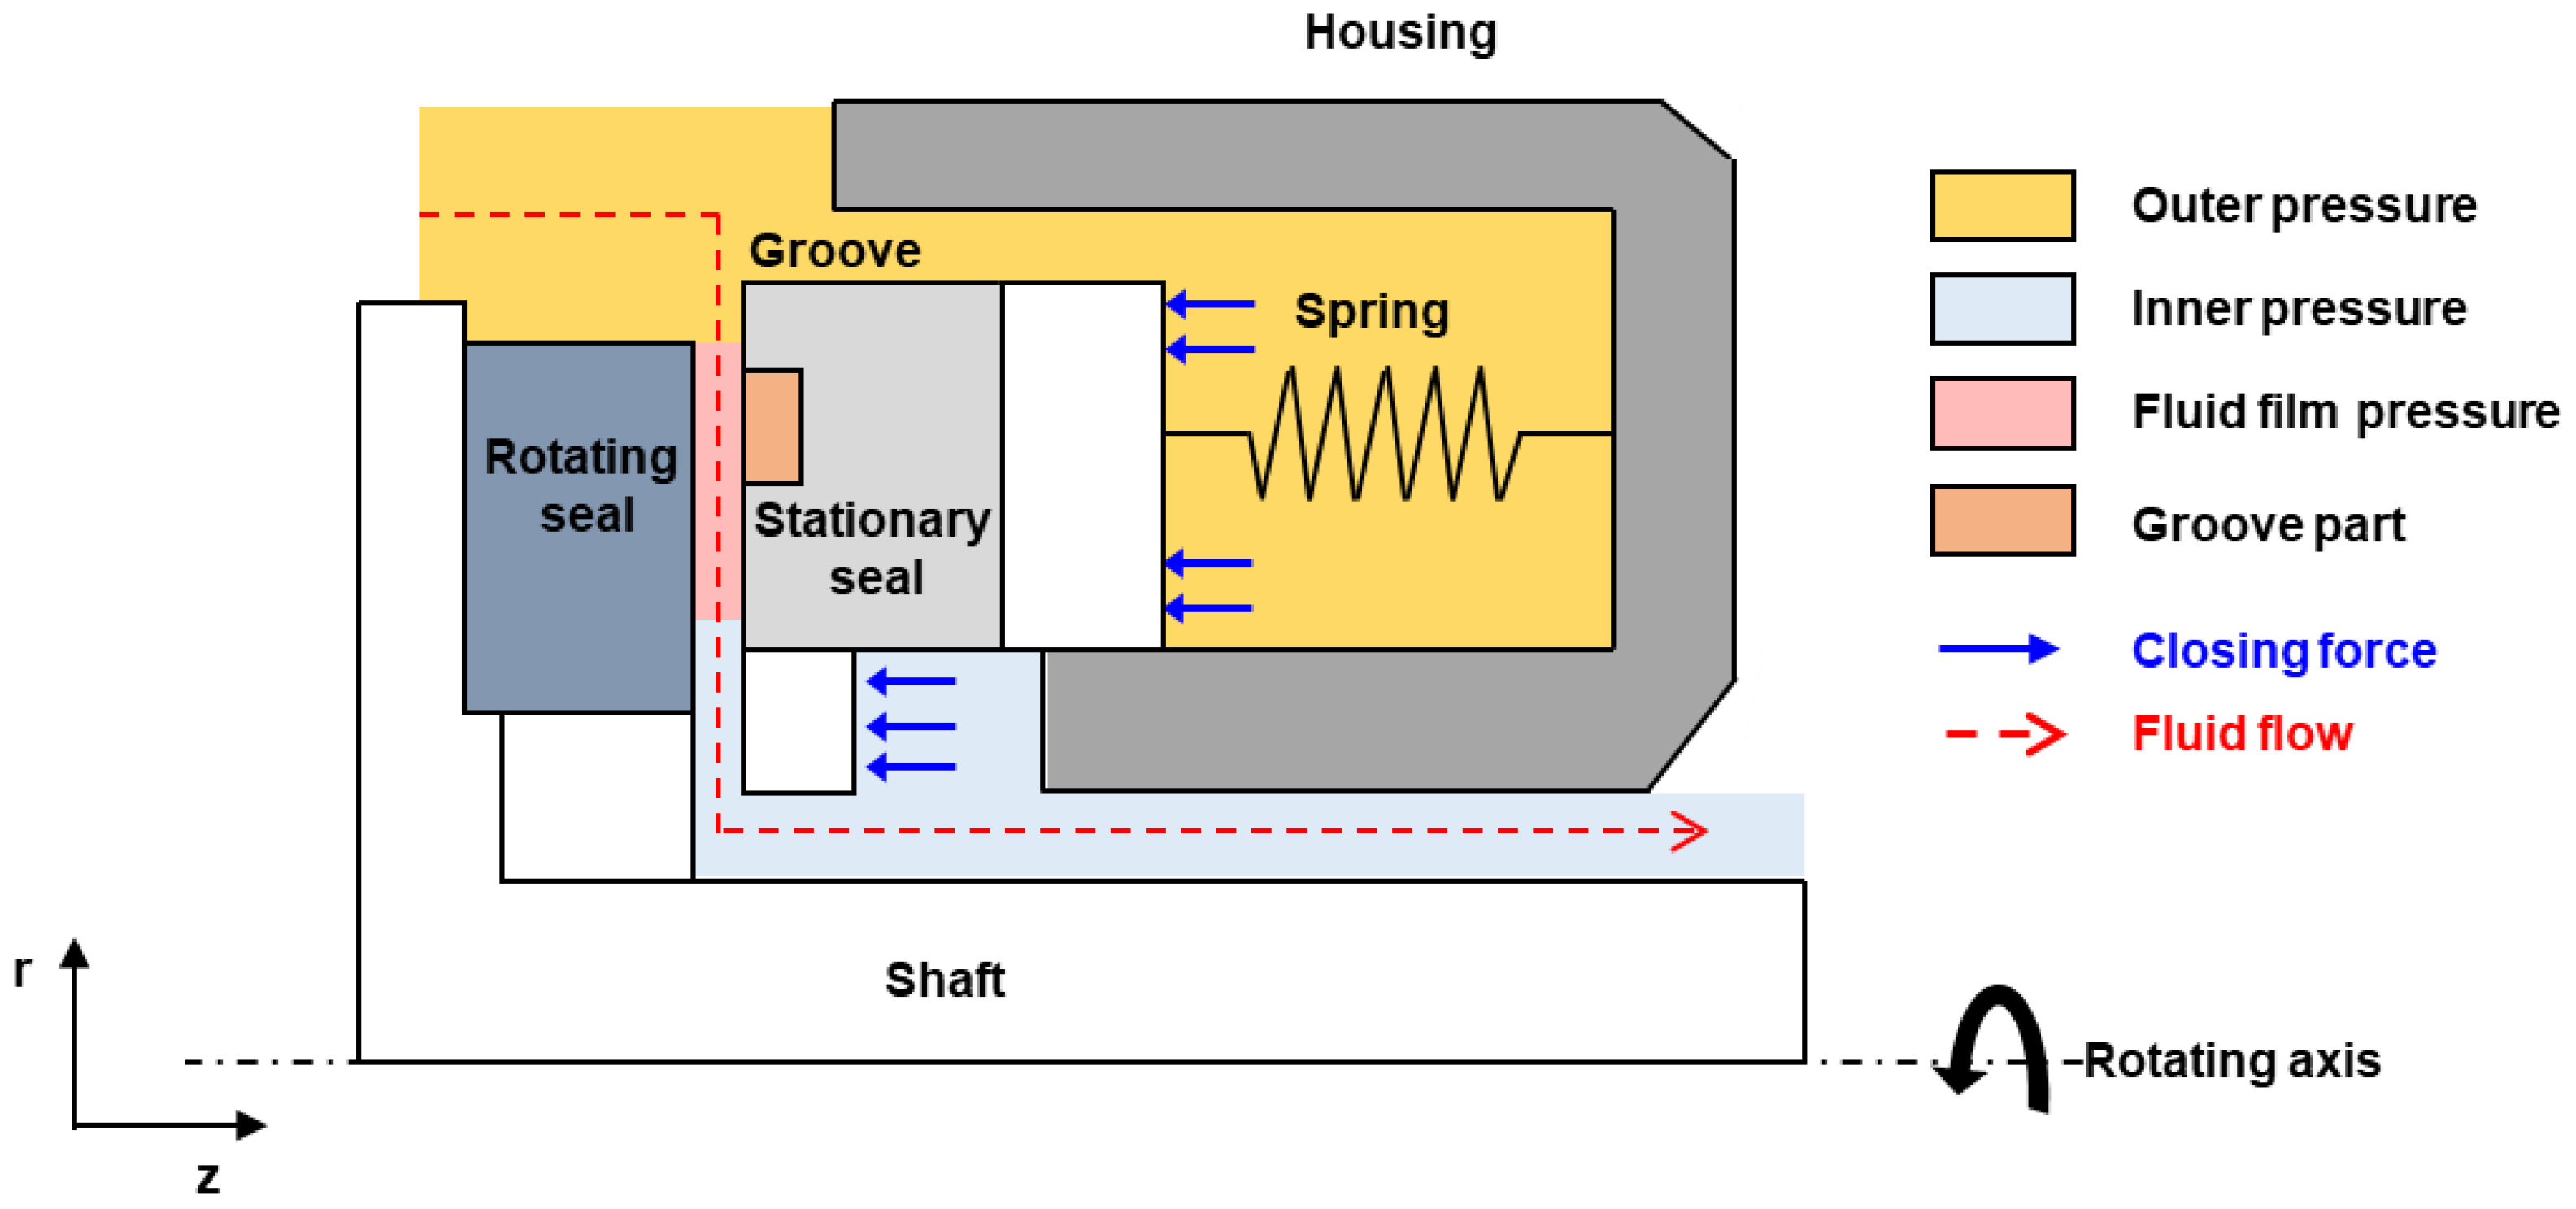
4.1. Analysis Model
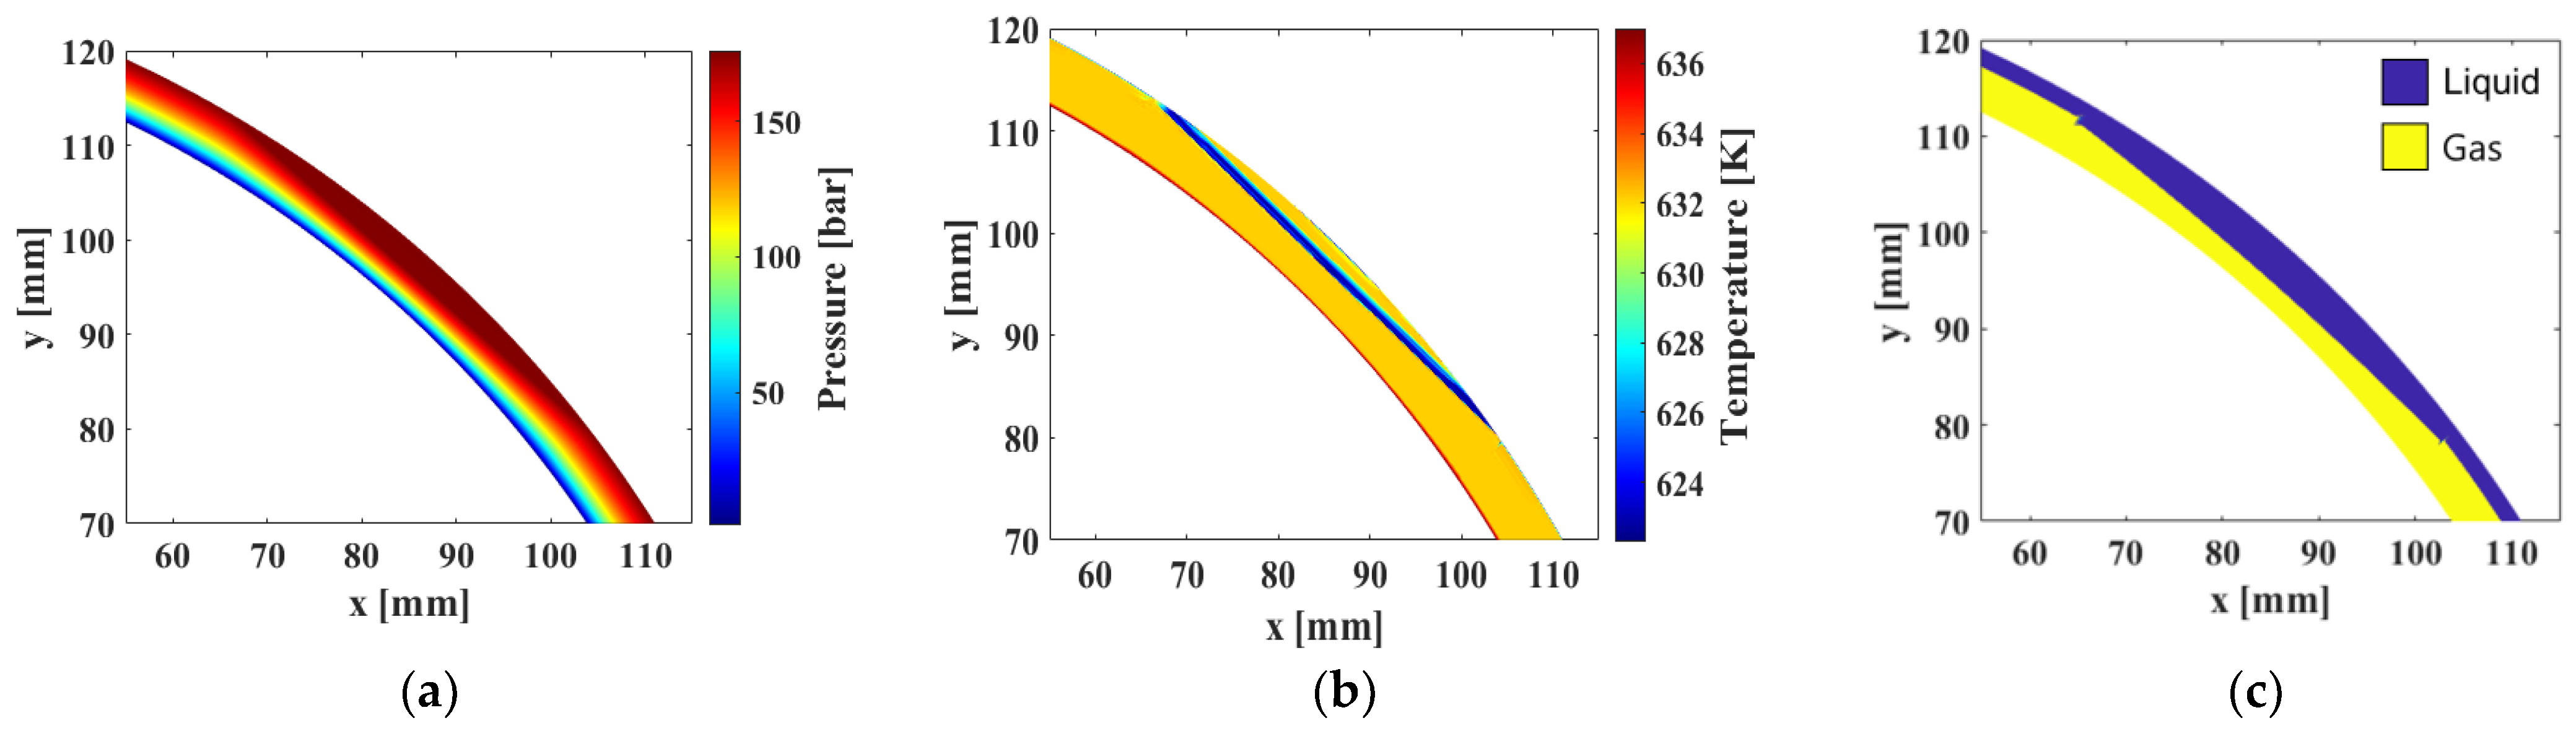
4.2. Characteristics of a Mechanical Seal Under Normal and External Power Shutdown Conditions
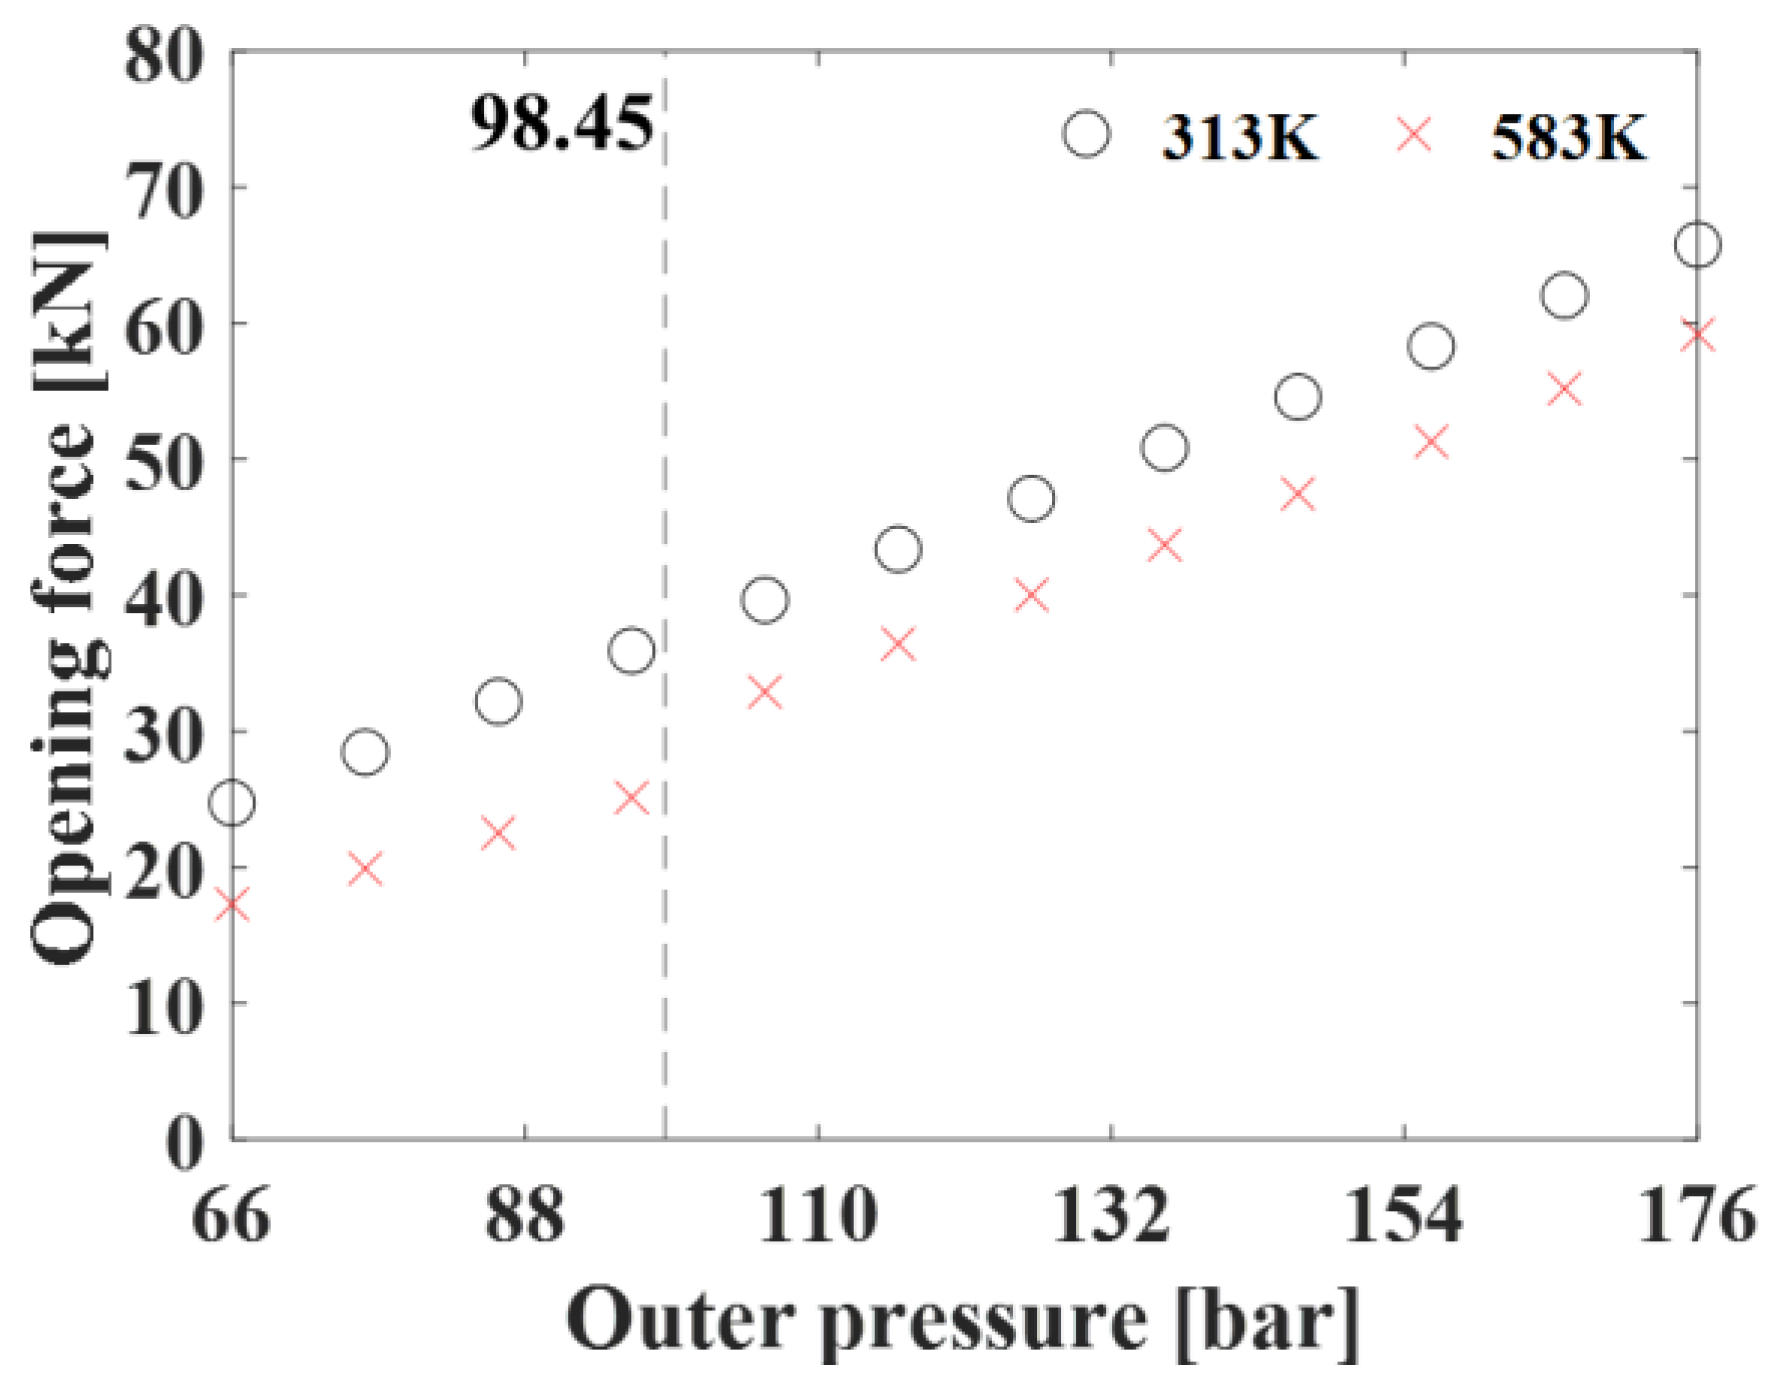
4.3. Analysis of Mechanical Seals Due to Outer Pressure
5. Conclusions
Author Contributions
Funding
Institutional Review Board Statement
Informed Consent Statement
Data Availability Statement
Conflicts of Interest
Nomenclature
| Cr | Fluid state coefficients in radial laminar: turbulent, and slip flow |
| Cθ | Fluid state coefficients in circumferential laminar, turbulent, and slip flow |
| Fclose | Closing force [N] |
| Fopen | Opening force [N] |
| Gr | Fluid state coefficients for radial laminar and turbulent flow |
| Gθ | Fluid state coefficient for circumferential laminar and turbulent flow |
| h | Film thickness [mm] |
| hc | Minimum film thickness [mm] |
| hg | Groove depth [mm] |
| Knudsen number | |
| p | Pressure of fluid film [bar] |
| Flow rate for liquid [m3/s] | |
| Flow rate for gas [m3/s] | |
| Temperature of fluid film [K] | |
| Weighting function | |
| Shape function vector | |
| Element pressure vector [bar] | |
| Element temperature vector [K] | |
| Ω | Interested domain |
| Rotating velocity [rad/s] | |
| Re | Reynolds number |
| Greek symbols | |
| Viscosity [Pa∙s] | |
| Density [kg/m3] | |
| Arbitrary vector | |
| Rotation speed [rpm] |
References
- Yang, J.H.; Wang, J.R.; Shih, C.; Huang, C.F.; Chen, S.W. The simulation and study of ELAP event with URG and FLEX mitigation strategies for PWR by using TRACE code. Kerntechnik 2019, 84, 72–83. [Google Scholar] [CrossRef]
- Hirs, G.G. A bulk-flow theory for turbulence in lubricant films. J. Lubr. Technol. 1973, 95, 137–145. [Google Scholar] [CrossRef]
- Hirs, G.G. A systematic study of turbulent film flow. J. Tribol. 1974, 96, 118–126. [Google Scholar] [CrossRef]
- Hahn, M.; Park, Y.; Kang, M.; Jun, S.; Jang, G. Effects of laminar, turbulent, and slip conditions in a fluid film on a dry gas seal. Machines 2022, 10, 954. [Google Scholar] [CrossRef]
- Hughes, W.F.; Winowich, N.S.; Birchak, M.J.; Kennedy, W.C. Phase change in liquid face seals. J. Lubr. Technol. 1987, 100, 74–79. [Google Scholar] [CrossRef]
- Hughes, W.F.; Chao, N.H. Phase change in liquid face seals II—Isothermal and adiabatic bounds with real fluids. J. Lubr. Technol. 1980, 102, 350–357. [Google Scholar] [CrossRef]
- Lau, S.Y.; Hughes, W.F.; Basu, P.; Beatty, P.A. A simplified model for two phase face seal design. Tribol. Trans. 1990, 33, 315–324. [Google Scholar] [CrossRef]
- Yasuna, J.A.; Hughes, W.F. A continuous boiling model for face seals. J. Tribol. 1990, 112, 266–274. [Google Scholar] [CrossRef]
- Etsion, I.; Pascovici, M.D. Phase change in a misaligned mechanical face seal. J. Tribol. 1996, 118, 109. [Google Scholar] [CrossRef]
- Delnoij, E.; Lammers, F.A.; Kuipers, J.A.M.; van Swaaij, W.P.M. Dynamic simulation of dispersed gas-liquid two-phase flow using a discrete bubble model. Chem. Eng. Sci. 1997, 52, 1429–1458. [Google Scholar] [CrossRef]
- Zhang, J.; Meng, Y. Direct observation of cavitation phenomenon and hydrodynamic lubrication analysis of textured surfaces. Tribol. Lett. 2012, 46, 147–158. [Google Scholar] [CrossRef]
- Ma, X.; Meng, X.; Wang, Y.; Peng, X. Suction effect of cavitation in the reverse-spiral-grooved mechanical face seals. Tribol. Int. 2019, 132, 142–153. [Google Scholar] [CrossRef]
- Liu, F.; Li, Y.; Yu, B.; Hao, M.; Sun, X.; Li, Z.; Xu, L. Experimental research on sealing performance of liquid film seal with herringbone-grooved composite textures. Tribol. Int. 2023, 178, 108005. [Google Scholar]
- Liang, Y.B.; Ding, X.X.; Wang, S.P. Performance analysis of end face liquid film mechanical seal under cavitation effect. Fluid Mach 2022, 50, 23–30. [Google Scholar]
- Bai, S.; Song, Y.; Yang, J. Elastic deformation of liquid spiral groove face seals operating at high speeds and low pressure. Int. J. Mech. Sci. 2022, 226, 107397. [Google Scholar] [CrossRef]
- Zhang, G.Y.; Yan, X.T. Analysis of two phase flow in liquid oxygen hybrid journal bearings for rocket engine turbopumps. Ind. Lubr. Tribol. 2014, 66, 31–37. [Google Scholar]
- Arauz, G.L.; San Andre, L. Analysis of two-phase flow in cryogenic damper seals—Part I: Model validation and predictions. J. Tribol. 1998, 120, 221–227. [Google Scholar] [CrossRef]
- Arauz, G.L.; San Andre, L. Analysis of two-phase flow in cryogenic damper seals—Part II: Model validation and predictions. J. Tribol. 1998, 120, 228–233. [Google Scholar] [CrossRef]
- Jin, J.; Peng, X.; Meng, X.; Zhao, W.; Jiang, J. Analysis of stability of two-phase flow mechanical seal with spiral groove under high speeds. J. Braz. Soc. Mech. Sci. Eng. 2021, 43, 260. [Google Scholar] [CrossRef]
- Jin, J.; Peng, X.; Li, Y.; Li, X.; Chen, Y.; Wang, B. Comparison and analysis of the performance of a spiral groove mechanical seal subjected to phase change with different sealing media. Appl. Therm. Eng. 2023, 219, 119618. [Google Scholar] [CrossRef]
- Brunetiere, N. Modelling of reverse flows in a mechanical seal. Tribol. Online 2016, 11, 94–101. [Google Scholar]
- Wang, Y.; Yang, H.; Wang, J.; Liu, Y.; Wang, H.; Feng, X. Theoretical analyses and field applications of gas-film lubricated mechanical face seals with herringbone spiral grooves. Tribol. Trans. 2009, 52, 800–806. [Google Scholar] [CrossRef]
- Zhang, L.; Ding, X.X.; Wang, S.; Zhang, S.; Cui, B. Lubrication characteristics of dry-gas seals with spiral grooves. Machines 2024, 12, 610. [Google Scholar] [CrossRef]
- Ma, C.; Bai, S.; Peng, X. Thermo-hydrodynamic characteristics of spiral groove gas face seals operating at low pressure. Tribol. Int. 2016, 95, 44–54. [Google Scholar] [CrossRef]
- Yu, B.; Hao, M.; Xinhui, S.; Wang, Z.; Fuyu, L.; Yongan, L. Analysis of dynamic characteristics of spiral groove liquid film seal under thermal–fluid–solid coupling. Ind. Lubr. Tribol. 2021, 73, 882–890. [Google Scholar] [CrossRef]


| Fluid Condition | Cr | Cθ |
|---|---|---|
| Laminar | 1/12 | 1/12 |
| Turbulent | 1/Dr | 1/Dθ |
| Slip | qp/12 | qp/12 |
| Range of Inverse Kn | n0 | n1 | n2 | n3 |
|---|---|---|---|---|
| 5 < 1/Kn ≤ 1000 | 1.000 | 6.097 | 6.391 | −12.812 |
| 0.15 < 1/Kn ≤ 5 | 0.831 | 7.505 | 0.939 | −0.058 |
| 1/Kn ≤ 0.15 | −13.375 | 12.640 | 0.099 | 0.0004 |
| Parameter | Value |
|---|---|
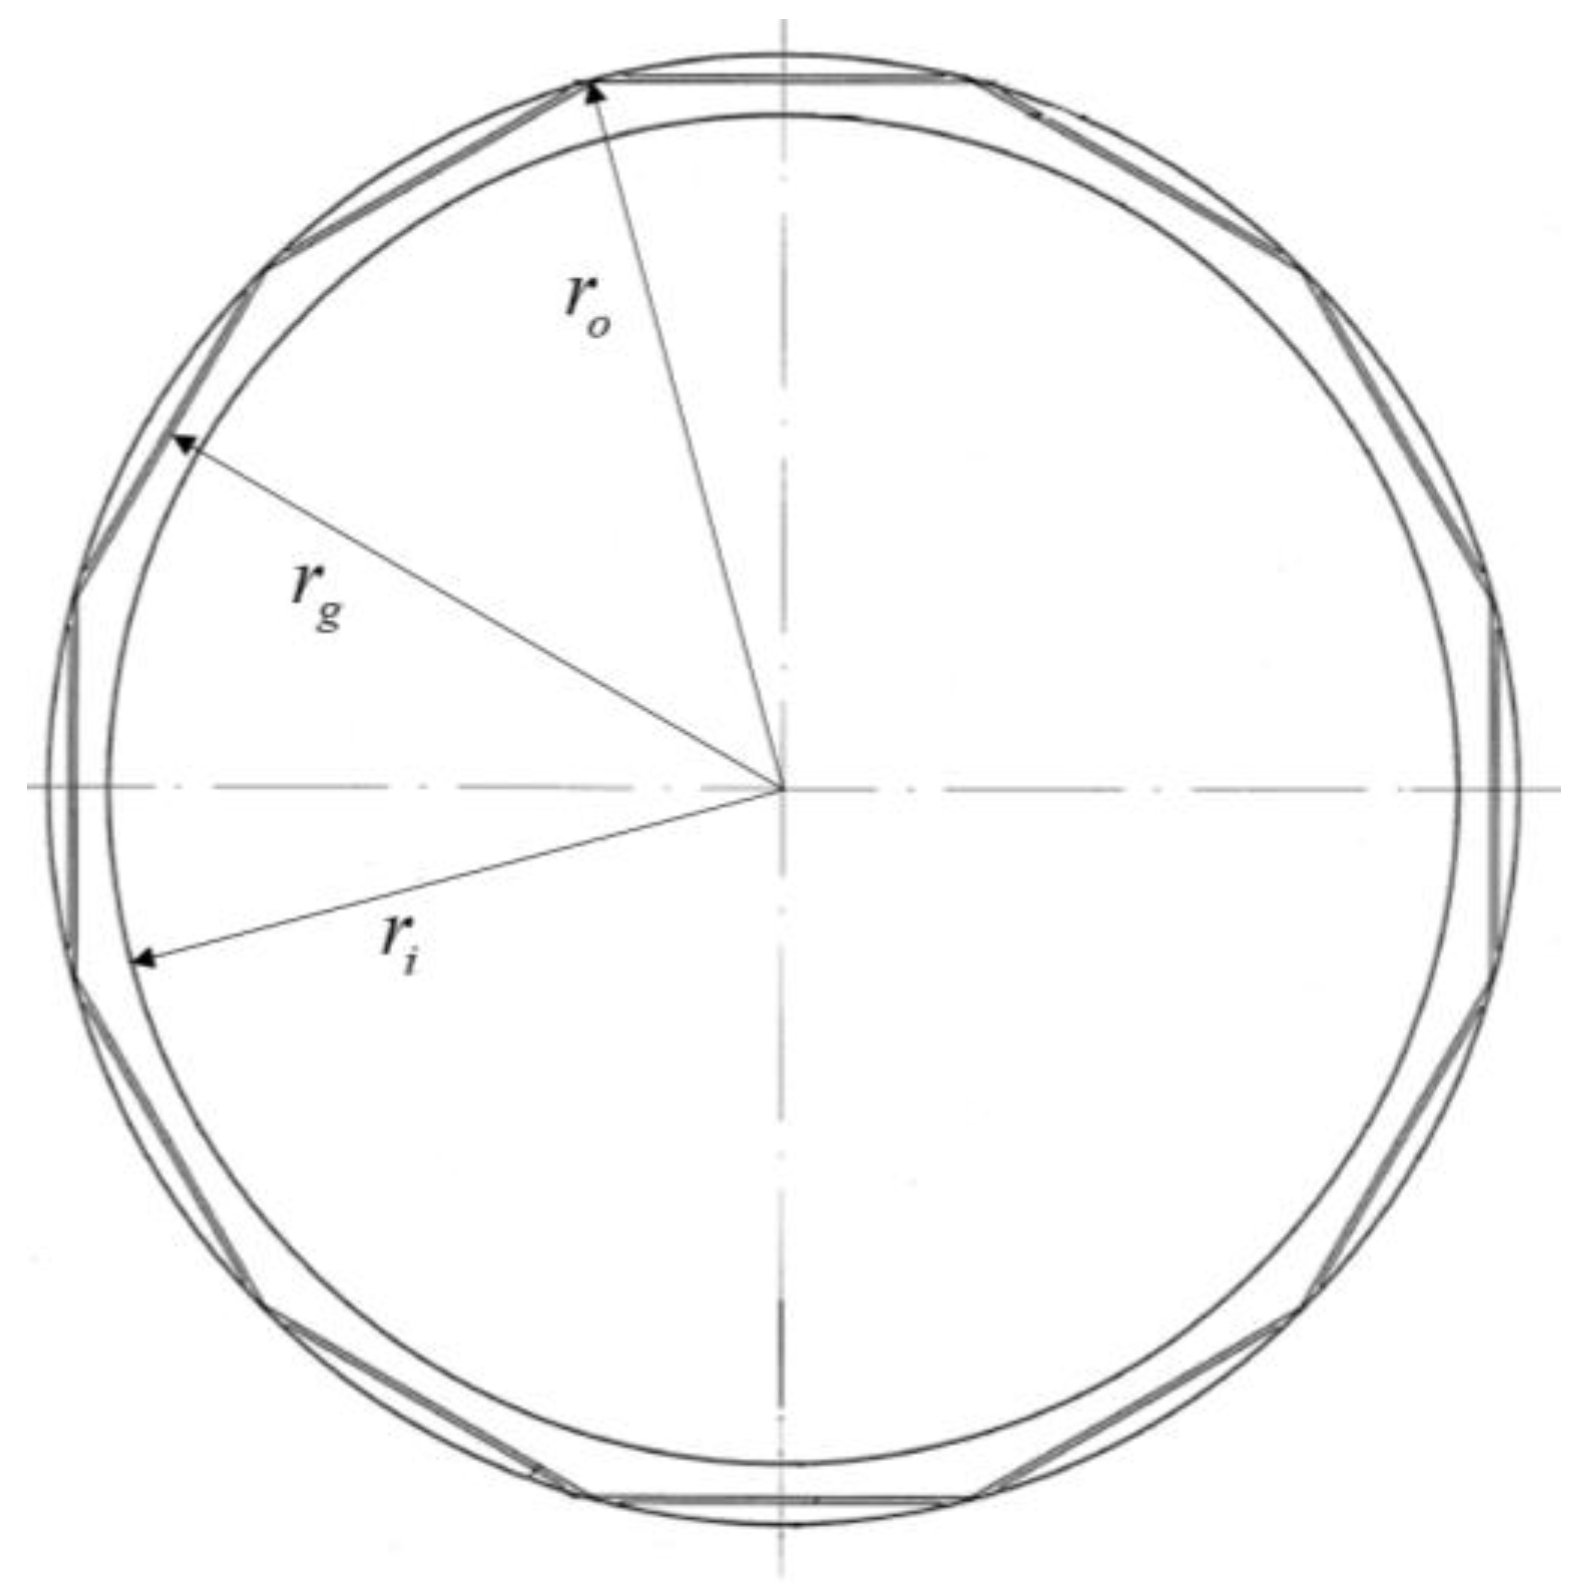
| Outer radius of mechanical seal, ro [mm] | 131 |
| Groove radius of mechanical seal, rg [mm] | 128.7 |
| Inner radius of mechanical seal, ri [mm] | 125 |
| Radial groove length [mm] | 1 |
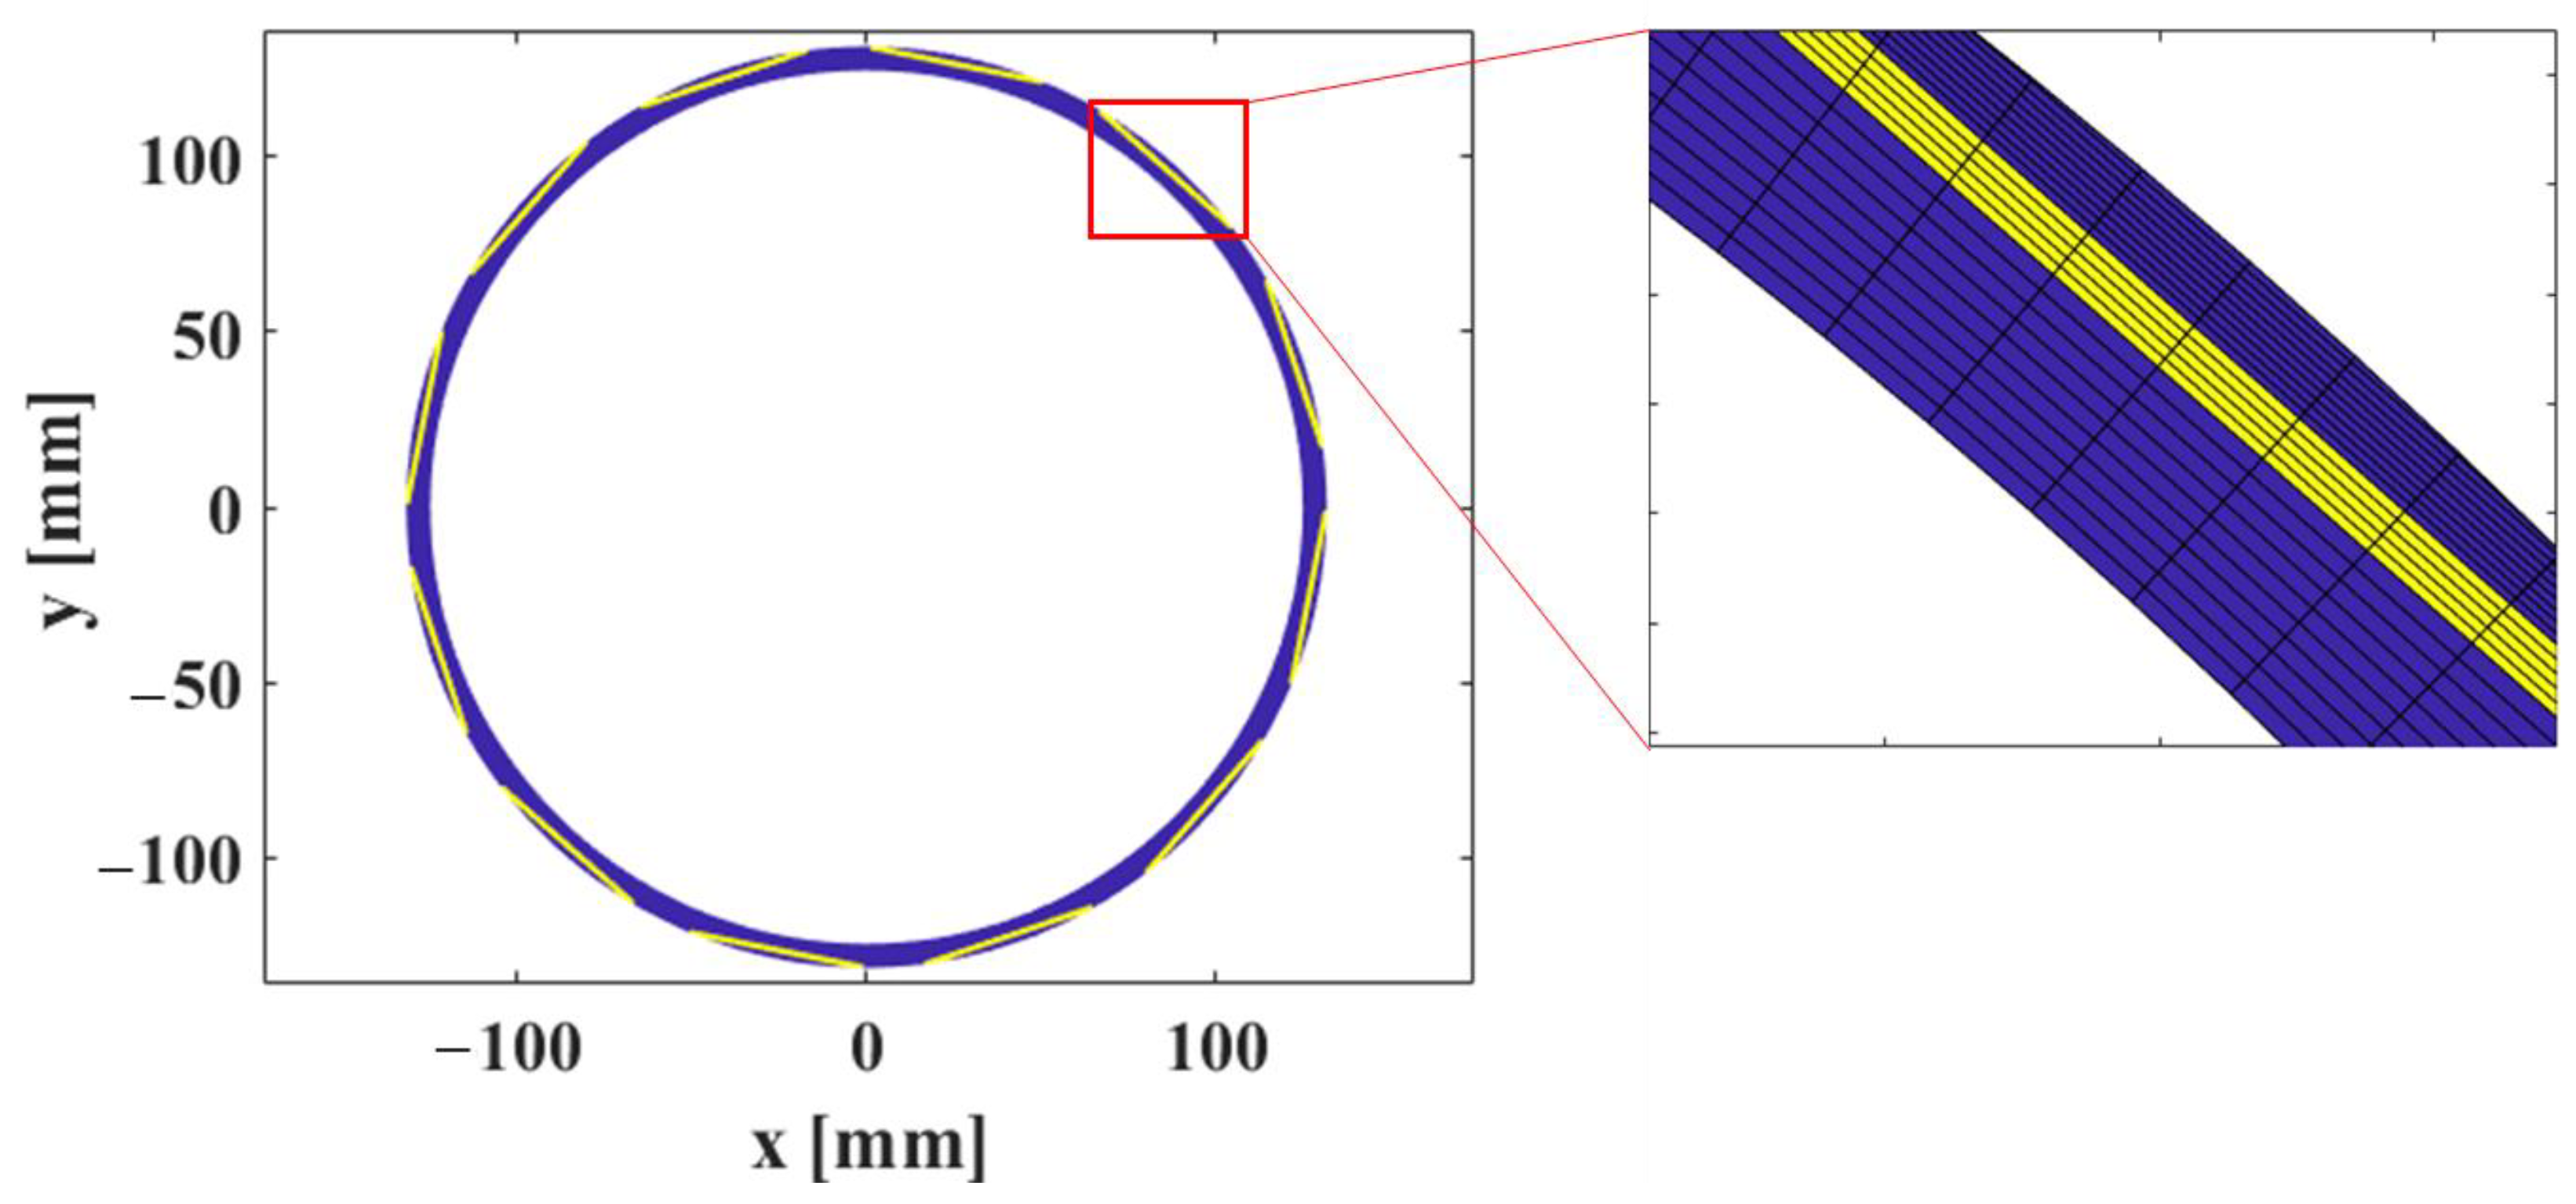
| Number of grooves [ea] | 12 |
| Groove depth [mm] | 1 |
| Parameter | Value |
|---|---|
| [rpm] | 1200 |
| Outer pressure, po [bar] | 66–176 |
| Inner pressure, pi [bar] | 1 |
| Seal fluid temperature, To [K] | 313, 583 |
| Ambient temperature, Ti [K] | 313, 583 |
Disclaimer/Publisher’s Note: The statements, opinions and data contained in all publications are solely those of the individual author(s) and contributor(s) and not of MDPI and/or the editor(s). MDPI and/or the editor(s) disclaim responsibility for any injury to people or property resulting from any ideas, methods, instructions or products referred to in the content. |
© 2024 by the authors. Licensee MDPI, Basel, Switzerland. This article is an open access article distributed under the terms and conditions of the Creative Commons Attribution (CC BY) license (https://creativecommons.org/licenses/by/4.0/).
Share and Cite
Park, Y.; Hong, G.; Jun, S.; Choi, J.; Kim, T.; Kang, M.; Jang, G. Lubrication Analysis of a Mechanical Seal Considering the Mixed Lubricant State of Gas and Liquid During External Power Shutdown of a Reactor Cooling Pump. Lubricants 2024, 12, 406. https://doi.org/10.3390/lubricants12120406
Park Y, Hong G, Jun S, Choi J, Kim T, Kang M, Jang G. Lubrication Analysis of a Mechanical Seal Considering the Mixed Lubricant State of Gas and Liquid During External Power Shutdown of a Reactor Cooling Pump. Lubricants. 2024; 12(12):406. https://doi.org/10.3390/lubricants12120406
Chicago/Turabian StylePark, Youngjun, Gwanghee Hong, Sanghyun Jun, Jeongmook Choi, Taegyu Kim, Minsoo Kang, and Gunhee Jang. 2024. "Lubrication Analysis of a Mechanical Seal Considering the Mixed Lubricant State of Gas and Liquid During External Power Shutdown of a Reactor Cooling Pump" Lubricants 12, no. 12: 406. https://doi.org/10.3390/lubricants12120406
APA StylePark, Y., Hong, G., Jun, S., Choi, J., Kim, T., Kang, M., & Jang, G. (2024). Lubrication Analysis of a Mechanical Seal Considering the Mixed Lubricant State of Gas and Liquid During External Power Shutdown of a Reactor Cooling Pump. Lubricants, 12(12), 406. https://doi.org/10.3390/lubricants12120406