Article

Synergistic Effect of Spark Plasma Sintering Driven Solid-Solution Phases on Scratch Resistance in Two-Dimensional Materials

by
Varad Agarwal
1,
Ambreen Nisar
2,*,
Abhijith K. Sukumaran
2,
Lihua Lou
2 and
Sohail M. A. K. Mohammed
2
1
Department of Materials Science and Engineering, Indian Institute of Technology Kanpur, Kanpur 208016, India
2
Plasma Forming Laboratory, Department of Mechanical and Materials Engineering, Florida International University, Miami, FL 33174, USA
*
Author to whom correspondence should be addressed.
Lubricants 2024, 12(2), 31; https://doi.org/10.3390/lubricants12020031
Submission received: 12 December 2023 / Revised: 20 January 2024 / Accepted: 22 January 2024 / Published: 24 January 2024
(This article belongs to the Special Issue 2D Materials in Tribology)

Abstract

:
Developing a solid lubricant with the ideal blend of lubrication and mechanical strength poses a formidable challenge. For the first time, we delve into synthesis and wear behavior of multicomponent 2D materials via spark plasma sintering (SPS) by mixing equimolar concentrations of hexagonal boron nitride (hBN), graphene nanoplatelets (GNPs), molybdenum disulfide (MoS2), and tungsten disulfide (WS2) using ball-milling (BM) and cryo-milling (CM) techniques. The mixing process controls the distribution of parent phases and thus solid-solutions, forming new phases, namely BCN, (Mo,W)S2, and B4C in the sample post sintering. The CM sample revealed a higher densification of 93% in contrast to the BM sample, with only 86% densification and a higher content of BCN, (Mo,W)S2, and B4C phases, exhibited via XRD and confocal Raman analysis. CM sample showed improved wear resistance (up to 46%) elicited from the lower wear volume loss (9.78 × 106 µm3) as compared to the BM sample (14.32 × 106 µm3). The dominant wear mechanisms were plowing, cracking, spallation, and severe abrasion in the BM sample, while cracking and plowing in the CM sample. The findings can pave the way for tailoring solid lubricants’ compositions and wear behavior per the intended application.

1. Introduction

Friction and wear-induced mechanical failures are critical issues in the dynamic components of machinery and vehicles, contributing to 80% of part failures and consuming over 30% of generated energy [1,2]. Advanced economies experience a notable 6% reduction in gross national product due to friction-related losses [3]. A mere 20% reduction in friction could yield substantial energy savings and environmental advantages [4], underscoring the need to mitigate friction and wear between mechanical parts for enhanced efficiency and longevity [5]. Global research endeavors are actively pursuing novel materials capable of minimizing friction and wear, even under extreme operational circumstances [6]. In this context, two-dimensional (2D) materials such as graphene nanoplatelets (GNPs), hexagonal boron nitride (h-BN), transition metal dichalcogenides (TMDs), transition metal carbides (MXenes), hydrotalcites, halides, phosphorous trisulfides, and phosphorene are gaining significant attention [7,8]. Two-dimensional materials are single-layer materials of single elements or compounds of two or more elements. Two-dimensional materials are commonly used as solid lubricants in electronics, sensing, spintronics, plasmonics, photodetectors, ultrafast lasers, batteries, supercapacitors, and thermoelectrics [1]. GNP is a 2D sheet in a hexagonal lattice with high tensile strength and thermal and electrical conductivity [9,10]. Similarly, h-BN consists of stacked hexagonal sheets with alternative boron and nitrogen atoms [11]. TMDs such as WS2 and MoS2 have anti-wear and friction reduction properties [12]. The combination of these 2D materials finds wide applications in the form of a coating on various substrates to improve their mechanical properties [13] and provide corrosion resistance [14], catalysts, energy conversion, and storage devices [15]. The easy sliding of the layers in 2D materials is attributed to the weaker van der Waals force between the atomic layers [16]. Also, the robust in-plane mechanical integrity of the 2D sheets prevents their disintegration during high loading or sliding.
The concept of “high-entropy alloy (HEA)” has swiftly expanded to encompass a diverse array of compounds, including oxides [17], diborides [18], nitrides [19], silicides [20], and carbides [21,22,23]. Materials containing five or more elements (or compounds) with approximately equal molar ratios are termed high-entropy (HE) materials. The 2D features, as well as their unique properties compared to the bulk counterpart in 2D materials, facilitate convenient assembly with other materials for the creation of novel functional composites. Applying the concept of entropy stabilization may allow 2D materials to achieve high durability even under harsh thermal and corrosive conditions [24].
The concept of entropy-stabilized multiple principal elements has been applied to layered 2D materials in recent years in oxides, chalcogenide [25], carbide/carbonitride (MAX, MXenes) [26], and hydroxide forms. Work has been done on synthesizing and characterizing HE-2D material using 4–5 Transition-metal dichalcogenides (TMDCs) [27], namely Mo, W, V, Nb, and Ta, via low-pressure sintering. HE-TMDCs thus formed were tested for CO2 electroreduction and showed extremely high activity with high selectivity toward CO production at low overpotentials. Synthesis of HE transition metal hydroxides has also been explored via bottom-up polyol processes [28]. These 2D HE hydroxides showed promising electrochemical catalytic activity for the electrocatalytic oxygen evolution reaction (OER), exhibiting a low overpotential of 275 mV (at 10 mA/cm2) for (CoFeMnNiZn)-OH. Further, single to a few layers of HE MXenes have been synthesized by selective etching of their HE-MAX phases [29]. MAX phases were synthesized by mixing the powder and performing pressureless reactive sintering. First-principles calculations highlight the importance of high configurational entropy in equimolar compositions of multiple elements, enabling the formation of pure and stable phases in MAX materials [29].
In summary, all these studies involve the usage of an equilibrium state pressureless sintering process for solid-solution formation while the realm of the non-equilibrium processes like spark plasma sintering (SPS), which brings about rapid changes in the kinetics of the alloying process, remains unexplored. SPS is a fast consolidation involving the simultaneous application of pressure and temperature with a pulsed current, which results in enhanced densification in a shorter time. Changing the SPS processing parameters has also been shown to affect the tribological behavior of NiTi alloys attributed to the phase transformation [30,31]. SPS has widely been used to obtain bulk 2D materials and their composites [32,33,34,35,36]. It is yet to be studied if rapid changes in the processing environment bring about the formation of new phases or changes in mechanical properties concerning the original 2D materials used. Previous studies on MXenes, high-entropy hydroxides, and high-entropy TMDCs [27,28,29] focus more on the synthesis and electrochemical properties of the high-entropy material formed. At the same time, to the author’s knowledge, no work has been found in the published literature that evaluates the mechanical and tribological properties of multicomponent 2D materials.
Based on the literature, GNP has excellent lubricant characteristics, MoS2, and WS2 exhibit lower wear rates and superior mechanical properties, while h-BN showed superior wear resistance [33,35,37]. Moreover, a composite system of GNP and h-BN [38] and MoS2 and WS2 [27] has been shown to form stable solid-solution phases with superior mechanical and wear properties. Therefore, integrating key features of these individual structures is expected to offer a viable solution to address the persistent issues of inadequate lifespan and low load-bearing capacity in current solid lubricants during wear. Hence, this study explores the fabrication of bulk multicomponent 2D materials via SPS by mixing equimolar concentrations of h-BN, GNP, MoS2, and WS2 powders using ball-milling (BM) and cryo-milling (CM) techniques before sintering. The phase evolution from mere composite to solid-solutions post sintering is expected to govern the mechanical and wear behavior. The wear behavior of the samples is assessed using micro-scratch testing. An effort is made to establish the phase, mechanical, and wear properties correlation. The findings of the present study will assist in customizing the characteristics of solid lubricants based on their phases in order to meet the specific demands of various applications.

2. Materials and Methods

2.1. Materials Processing

Commercially available 2D nanopowders employed in the study were hexagonal boron nitride (hBN, Figure 1a), graphene nanoplatelets (GNP, Figure 1b), molybdenum disulfide (MoS2, Figure 1c), and tungsten disulfide (WS2, Figure 1d), and hBN, MoS2 and WS2, were obtained from Graphene Supermarket; hBN had an average particle size of 70 nm and a purity of 99%; MoS2 had an average diameter of 90 nm and a purity of 99%; and WS2 had an average particle size of 90 nm and a purity of 99%. Additionally, GNPs (xGNP-M-5) were acquired from XG Sciences, Inc., Lansing, MI, USA and had a thickness range of 6–8 nm, a surface area of 120–150 m2/g, and an average particle size of 5 μm. Composite powders were prepared by mixing an equimolar composition of each of the four powders via ball milling (BM) and cryo-milling (CM).
A high-energy vibratory ball mill (BM) machine (Desktop High Energy Vibratory Ball Mill, Across International LLC, Livingston, NJ, USA) was used for mechanical milling. The powders were mixed for 02 h with a ball-to-powder weight ratio of 5:1, using hardened steel balls of 10 mm diameter in a tungsten carbide jar. The cryo-milled (CM) powder was prepared by utilizing a CryoMill (CryoMill, 100–240 V, 50/60 Hz, Retsch, Germany) in a stainless steel jar at a sub-zero temperature of approximately −196 °C maintained through a steady provision of liquid nitrogen (LN2) to the enclosed cryo-mill system. The mixing process was done in a dry setting, employing stainless steel balls with a 5:1 ball-to-powder ratio. Milling was carried out continuously at 25 Hz for 02 h. A higher frequency of 25 Hz was selected because no changes in the particle dispersion were observed at lower frequencies. Higher frequency is recommended to be used for homogeneous and efficient dispersion of the particles [39]. Before milling, a pre-cooling of 5 min ensured a reliable supply of LN2. After the milling procedure, the powders were warmed to room temperature and collected in a sealed container in a controlled environment. The primary objective of employing BM and CM in the present study is to homogeneously mix all 2D materials with no structural change in the shape and size of the 2D materials used. Two different techniques were used to compare their mixing efficacy. For that, the milling parameters, such as a ball-to-powder weight ratio (5:1), milling time (2 h), and type and size of balls (stainless steel, 10 mm), were kept the same.
The composite powders were consolidated in a 20 mm diameter graphite die via spark plasma sintering (SPS, Model 104, Thermal Technologies, Santa Rosa, CA, USA). Additionally, graphite sheets were used to line the inner surface of the graphite die, preventing any potential reaction between the powder and the die and easy removal of the sample post sintering. For thermal insulation, the graphite die was covered with a graphite-felt. During SPS, a vacuum atmosphere with a pressure of less than 2 × 10⁻² Torr was maintained. The sintering process was carried out at a maximum temperature of 1200 °C and pressure of 60 MPa with a heating rate of 100 °C/min for 10 min. The samples were ground on 120P grit paper to remove the graphite foil layer stuck on the surface. The density of the samples was determined using a Helium gas pycnometer (Ultrapyc 5000, Anton Paar, Ashland, VA, USA). SPS parameters were chosen based on the individual SPS parameters available for the selected 2D materials in the present study. Among all four 2D materials, WS2 has the lowest melting temperature (1250 °C). Adigilli et al. [35] studied the SPS sintering of 2D-WS2 nanosheets at temperatures ranging from 600–1200 °C. Samples sintered at 1200 °C showed the highest relative densification of 94% retaining its stoichiometry with no indication of thermal decomposition.

2.2. Microstructural and Phase Analysis

Phases in as-received powders, composite powders via ball milling and cryo-milling, as well as the SPS-processed samples, were identified using X-ray diffraction (XRD, Rigaku, Smartlab Studio, TX, USA) using monochromatic Cu-Kα radiation at a scan rate of 0.2° min−1. The accelerating voltage of 40 kV was set in the diffraction angle (2θ) range of 10–70°.
The microstructure analysis of the as-received, milled composite powders and the fractured surface of the SPS-processed samples was done by using a Schottky field emission scattering electron microscope (FESEM, JEOL-F100 FESEM JEOL Ltd., Akishima, Tokyo, Japan). The FESEM is equipped with an energy-dispersive spectroscopy (EDS) detector, which collects spectra corresponding to the elemental composition in the sample. The operating voltage of the FESEM was set to 5 kV.
To further complement the phase and microstructural analysis, Raman spectroscopy was performed on the as-received, milled powders as well as SPS-processed samples utilizing an inViaTM confocal Raman microscope (Renishaw), employing a laser with a wavelength of 785 nm and a power output set at 1% of 300 mW. The experimental parameters were configured to ensure high-quality Raman spectra with optimal signal-to-noise ratios. The acquisition settings involved using 1% laser power, a 10-s acquisition time, and ten scans. Raman shifts were measured within the range of 100 to 1750 cm1, with a spot resolution of 100 nm and a spectral resolution of 0.03 cm1. To enhance the quality of the spectra, a Fourier Transform Filter (FFT) was utilized for smoothing. Further, OriginPro software (OriginLab Corporation, Northampton, MA, USA) was also employed for peak fitting analysis using Gaussian functions. Chemical mapping of individual Raman peaks, a novel chemical-specific phase analysis technique, was also done for selected peaks in the sintered samples. For chemical mapping, 15 × 15 scanning of a 150 × 150 μm region on both samples was performed. The collected data were processed for mapping using the RamanToolset (BioNEM Lab of the University “Magna Graecia” of Catanzaro, Catanzaro, Italy). Map data for the intensity of selected peaks were generated, and 3D graphs of the same were generated by OriginPro software.

2.3. Wear Behavior via Scratch Test

SPS pellets were sectioned using a Techcut 5X precision high-speed saw (Allied High-tech Products, Inc., Cerritos, CA, USA) and mounted in their top surface and cross-section for scratch testing. The mounted samples were ground using diamond grit up to 6 μm surface roughness, followed by cloth polishing in alumina suspension to obtain a surface finish of <1 μm.
Scratch tests were performed using an instrumented micro-scratch tester (Revetest scratch tester RST3, Anton Paar USA Inc., Houston, TX, USA) to study the wear behavior. The RST3 is equipped to record the acoustic emissions (AE) during the scratch, collect data on the coefficient of friction (CoF), penetration, and residual depths, and obtain a panoramic image of the scratch introduced using a built-in optical microscope. To explore the wear behavior of 2D materials, scratch analysis was performed along the cross-section in SPS-processed samples, both ball-milled and cryo-milled. Tests were performed along the cross-sectional surface so that the indenter would encounter a distribution of retained as well as new phases formed during SPS. A diamond Rockwell Indenter tip (R = 50 μm) was used for scratch testing. Scratches of 1 mm were introduced via progressive loading from 1 N to 10 N at a scratch rate of 1 mm/min and load rate of 9 N/min. The scratches introduced in the surfaces were analyzed using FESEM to understand the location of the cracks, delamination, and types of deformation produced on the samples during the scratch. Optical profilometry (Nanovea, Irvine, CA, USA) was employed to analyze the tested samples’ surface roughness and wear track profile. The wear volume of the scratches was calculated using the Mountains Lab Premium 10 (Digital Surf) software, which analyzed the top-view scratch image obtained from optical profilometry. The wear debris collected from the scratches was analyzed under FESEM to understand the wear phenomenon. To establish the mechanical wear properties’ correlation, the hardness of the polished samples on the top surface was measured using a Vickers microhardness tester (LMS10AT, LeCO, St. Joseph, MN, USA). An indentation load of 10 gf was used with a dwell time of 15 s. The reported values are an average of at least ten indents introduced on the top surface of each sample at similar loading conditions.

3. Results and Discussions

3.1. Microstructural Analysis of the Powder Mixture

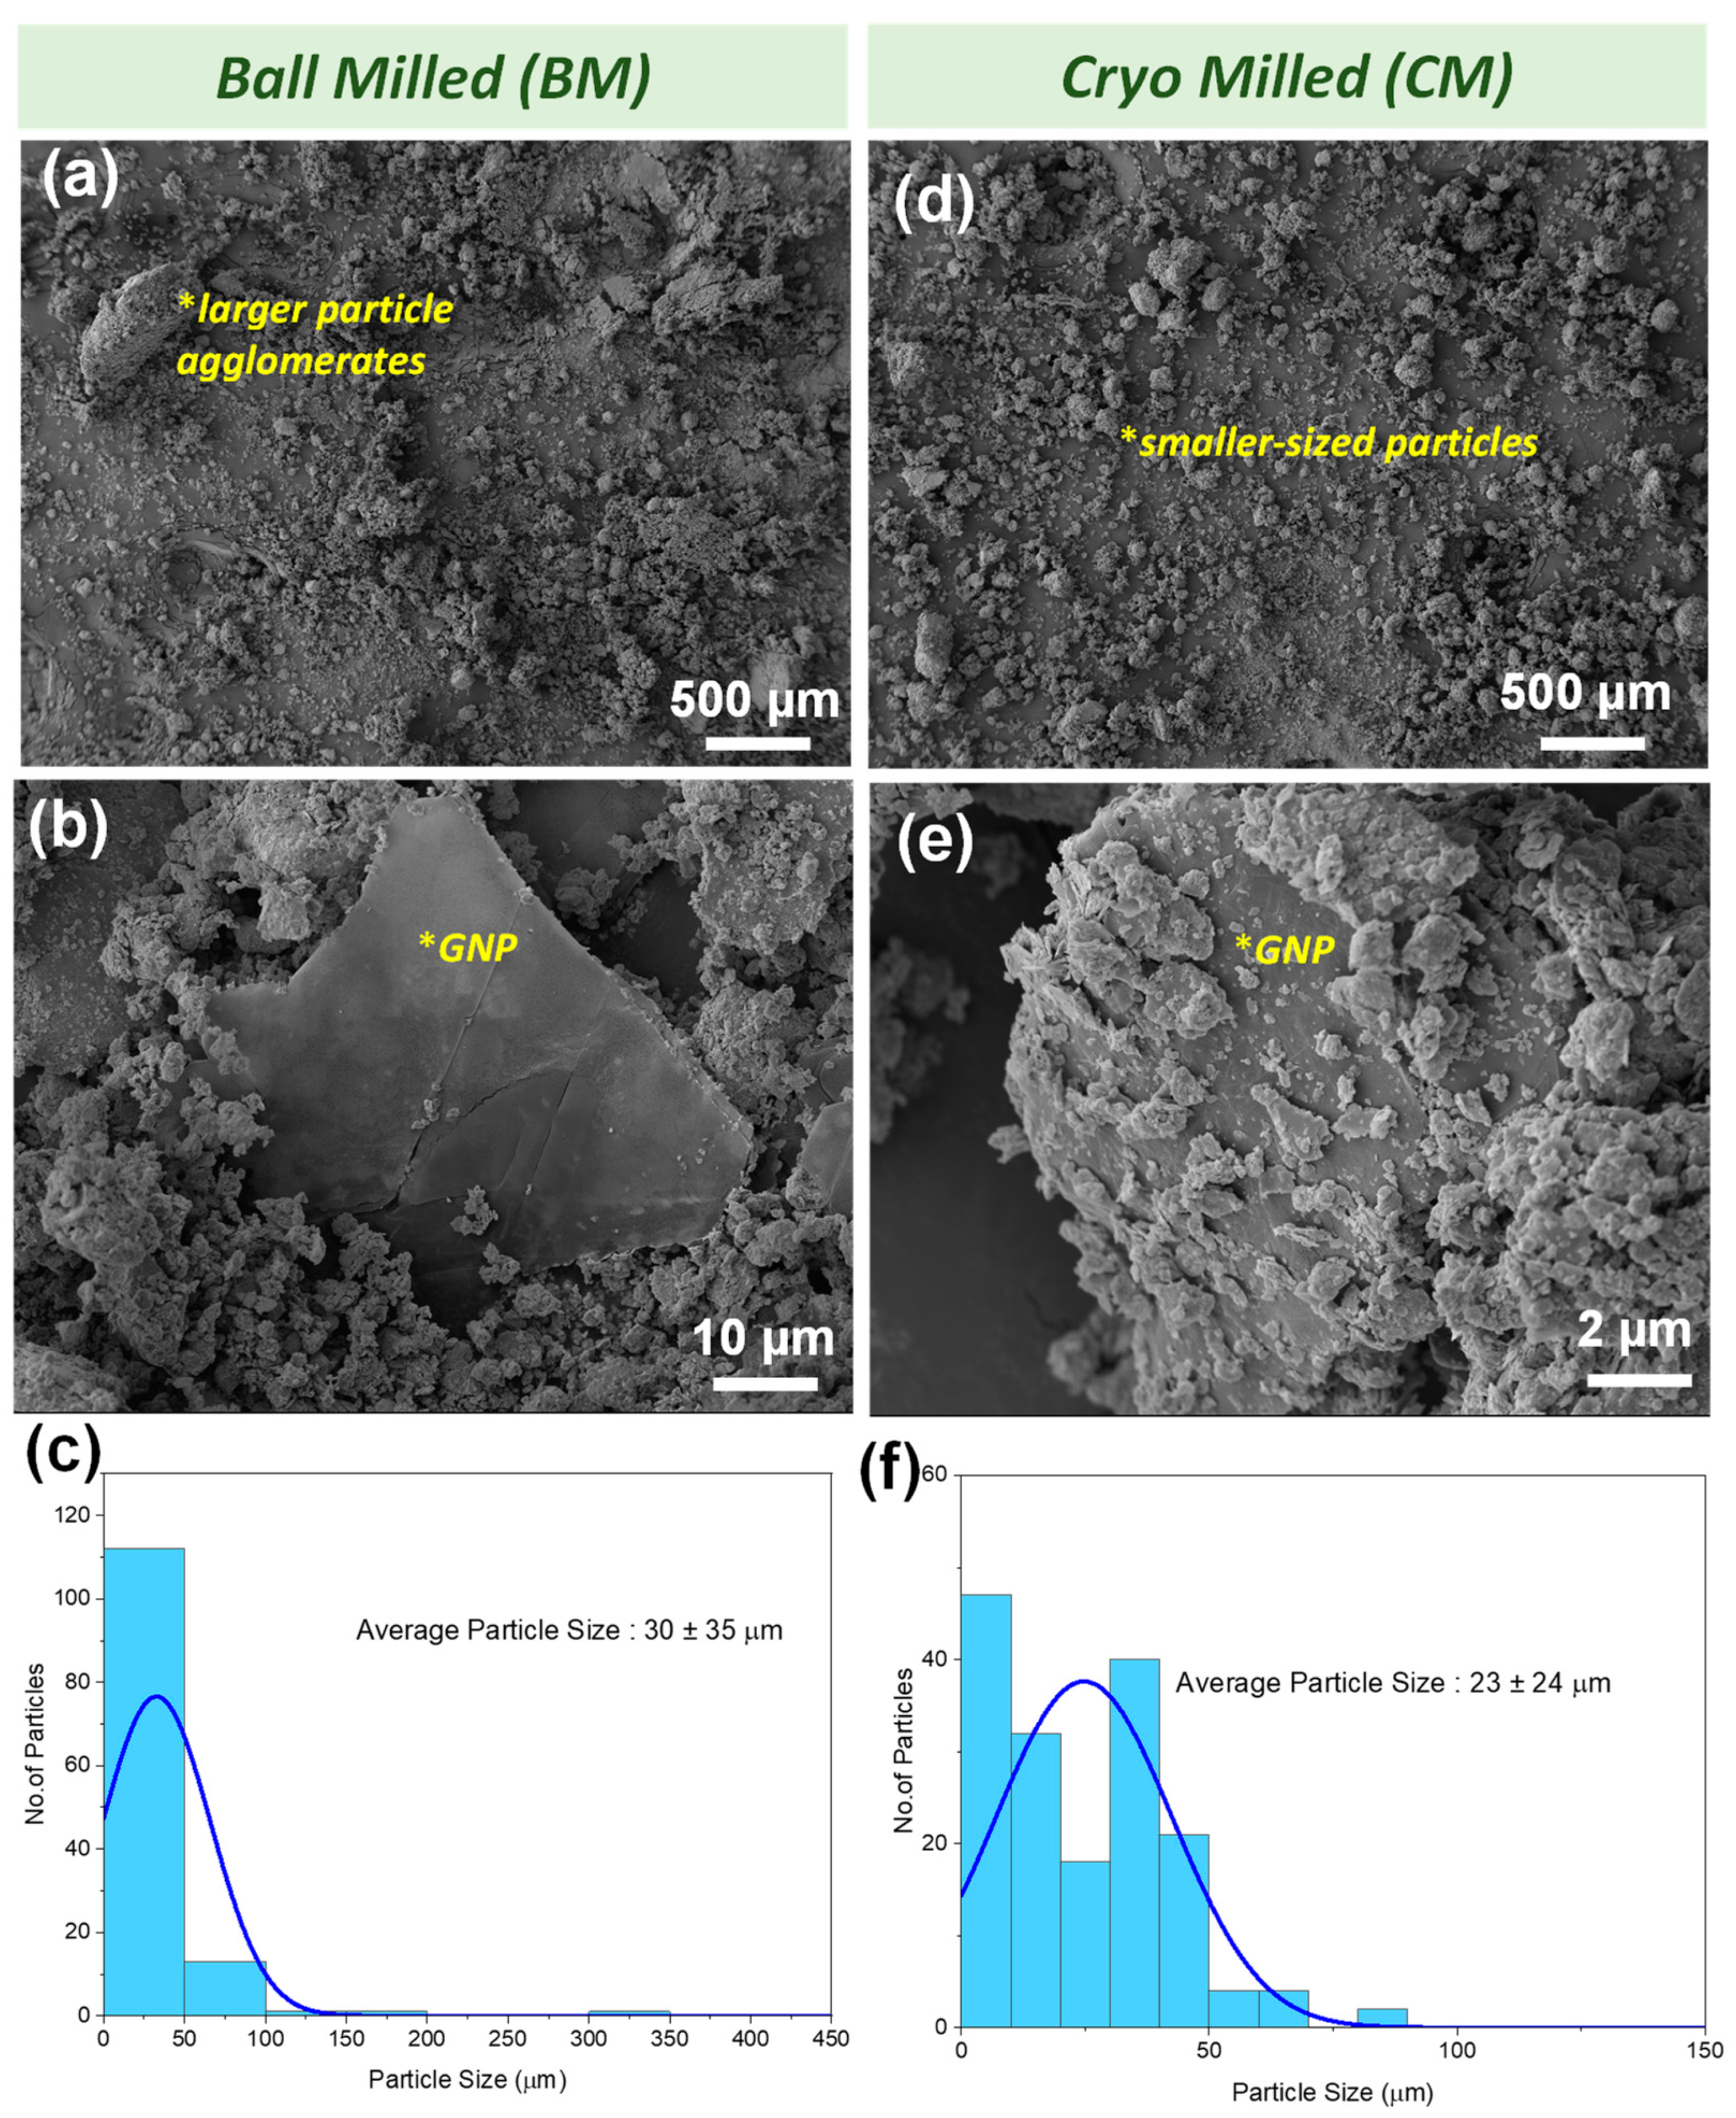
The morphology and distribution of phases in ball-milled (BM) and cryo-milled (CM) composite powder mixtures of all 2D materials are shown in Figure 2. BM (Figure 2a,b) and CM (Figure 2c,d) powder mixtures exhibit distinct microstructural differences primarily attributed to their respective milling processes and environmental conditions. The energy-dispersive spectroscopy (EDS) mapping and the corresponding spectra eliciting the elemental distribution in the BM and CM powders are shown in Supplementary Materials Figure S1. In BM powder, the presence of an oxygen element (Figure S1a) has been attributed to the heat generation during the BM process. However, no such peak was observed in CM powder (see Figure S1b). This further confirms that powders remained uncontaminated by the milling jar and balls. The BM process induces continuous interparticle collisions and collisions between the powders and the steel balls, leading to substantial heat generation [40]. This increase in ambient temperature during BM promotes the visible agglomeration of particles, shown in Figure 2a. The calculated average particle size for the BM sample is 30 ± 35 μm, while the maximum particle size is 409 μm. Conversely, CM maintains sub-zero temperatures through the continuous inflow of liquid nitrogen. Any heat generated during the milling process is offset by the inflow of liquid nitrogen, preventing any significant particle agglomeration. The calculated average particle size for the CM sample is 23 ± 24 μm, while the maximum particle size is 159 μm. Comparing Figure 2a,c, we observe a noticeable difference in particle size between BM and CM powders.
CM powders demonstrate smaller particle sizes and a more uniform distribution than BM powders, which exhibit larger particle sizes and non-uniform particle distribution. Figure 2b illustrates a larger GNP particle resting amidst other powder particles, while Figure 2d shows a comparatively smaller GNP particle decorated with particles of the other powders. Figure 2e,f present a comparative analysis of the particle size distribution in the milled powders, elucidating the influence of the milling processes on the resultant consolidated sample after sintering. BM (Figure 2e) shows a more isolated particle size distribution with a higher maximum particle size than CM (Figure 2f), which has a better distribution of particle size and a lower maximum value.

3.2. Phase Evolution via SPS Processing

The BM and CM composite powders were consolidated under similar SPS processing conditions. By applying the rule of mixtures to the initial four powders, the theoretical density was calculated to be 5.41 g/cc. The apparent bulk density of the BM sample was 4.64 g/cc, and 5.01 g/cc for the CM sample obtained from the He pycnometer. The relative densification is ~86% and ~93%, respectively, in the BM and CM sintered samples. Due to high agglomeration and larger particle size, the BM sample exhibited less efficient packing and a higher number of pores than the CM sample. The density values are indicative of this difference. The idea of adding different particle sizes of the 2D materials is to attain a homogenous distribution where bigger particles are covered with nano or submicron-sized particles. Such a distribution will help in attaining higher densification and more solid-solution phase formation during SPS processing. This is pretty much evident from the comparison of two mixing techniques, i.e., BM vs CM.
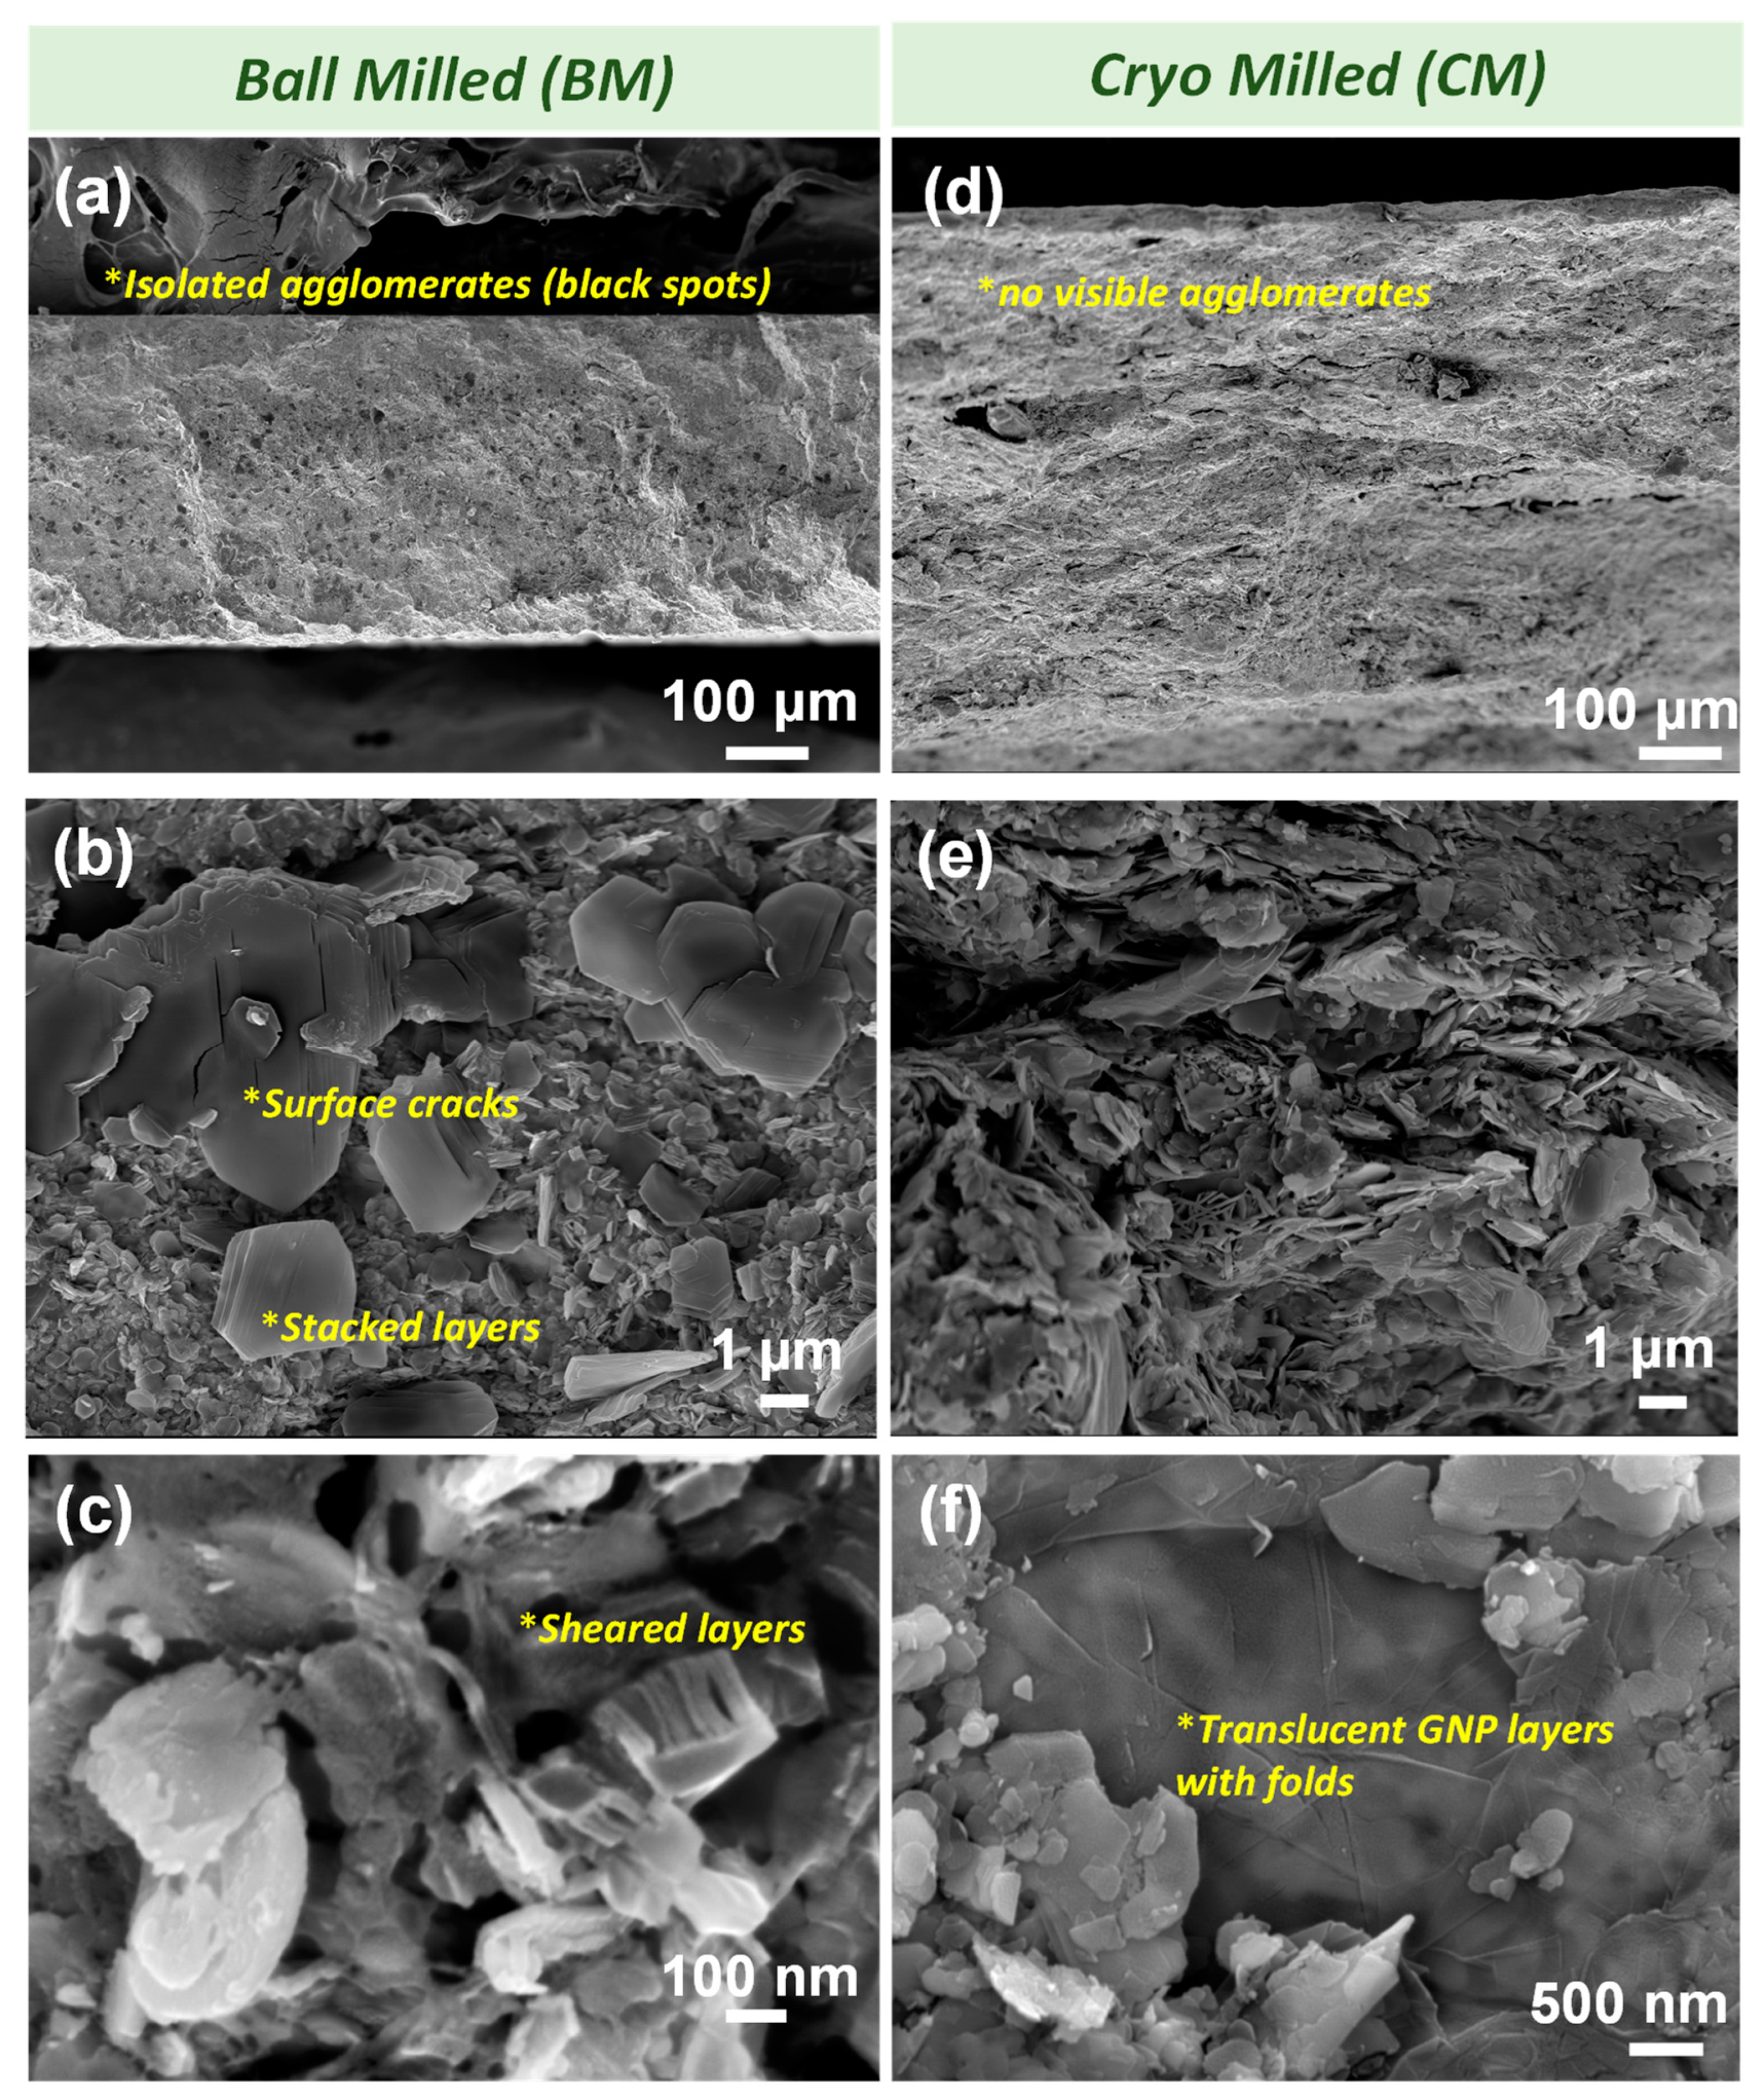
To see the distribution of phases in the sintered samples, fractured surfaces were analyzed under SEM and presented in Figure 3. Similar to the milling process (see Figure 2), both BM (Figure 3a) and CM (Figure 3b) demonstrate a distinct variation in particle distribution post sintering. The fracture surface of the BM sample (Figure 3a) reveals non-uniform particle distribution with black spots, indicating localized agglomeration. In contrast, the CM sample (Figure 3d) exhibits uniform particle distribution. The high-magnification SEM image in the BM sample (see Figure 3c) exhibits cracking and layers that have delaminated and stacked over each other, along with noticeable differences in particle size. However, the CM sample in Figure 3d presents a contrasting image with smaller and more uniformly sized particles. A particularly interesting observation is in Figure 3f, where thin, translucent GNP particles with only a few layers exhibit clear folds. This thin-layered piece may have detached from the parent GNP particle during CM and applying high pressure (60 MPa) during SPS resulted in the formation of folds on its surface. This thin layer of GNP indicates how finely the particles are broken down during CM.
XRD patterns of the BM and CM powders and sintered samples are compared in Figure 4 to verify the presence of existing parent phases and identify any new phase formation. Apart from the parent phases, a new peak corresponding to the B2O3 phase is observed in BM powder. However, no new phase formation is seen in the CM powder. This has been attributed to heat generation during the ball-milling process, resulting in the formation of liquid B2O3 from BN [41], see Equation (1). The B2O3 peak in BM powder disappeared after SPS sintering. This is attributed to the sublimation of B2O3 during SPS sintering as per Equation (2) feasible at temperature ≥ 575.8 °C [36].
2 B N s + 3 2   O 2 = B 2 O 3 l + N 2 g
B 2 O 3   l   B 2 O 3   g
In both the BM and CM sintered samples, peaks corresponding to new phases, namely, B4C and solid-solution phases of (Mo, W)S2 and BCN formed, were observed, as shown in Figure 4. It is to be noted that the overlap in the multiple peak positions of hBN, BCN, and GNP phases and MoS2, WS2, and (Mo, W)S2 makes the exact quantification of phases arduous. However, the indexing has been done considering the peak intensity and its position as the closest match. It is to be noted here that the peak intensity corresponding to B4C and solid-solution phases, i.e., BCN and (Mo, W)S2, is higher in CM than BM, postSPS processing. This indicates that the finer particle size and uniform distribution of phases obtained during CM has enhanced the reactivity of particles during SPS sintering which leads to faster diffusion, promoting solid-solution formation. The high reactivity and faster diffusion in the CM sample are further reflected by the higher densification than the BM sample processed at similar SPS conditions. It is to be mentioned here that solid-solution phase formation (and thus properties) is expected to vary not just by varying the content of 2D materials but also particle size and shapes. Above 850 °C, carbon from GNPs reacts with hBN, and thus BCN is formed via thermal substitution [42,43]. The B-C-N ternary phase diagram [38,44] shows that B4C and BCN are formed when these three elements are at elevated temperatures. Further, h-BN has free boron particles that react with carbon from GNPs to form boron carbide (B4C), facilitated by the high temperature and pressure (1200 °C, 60 MPa) during SPS processing as they help the reacting substances cross the activation energy barrier [45]. Similarly, at temperatures above 500 °C, MoS2 and WS2 demonstrated solid solubility and formed (Mo, W)S2 solid solution [46].
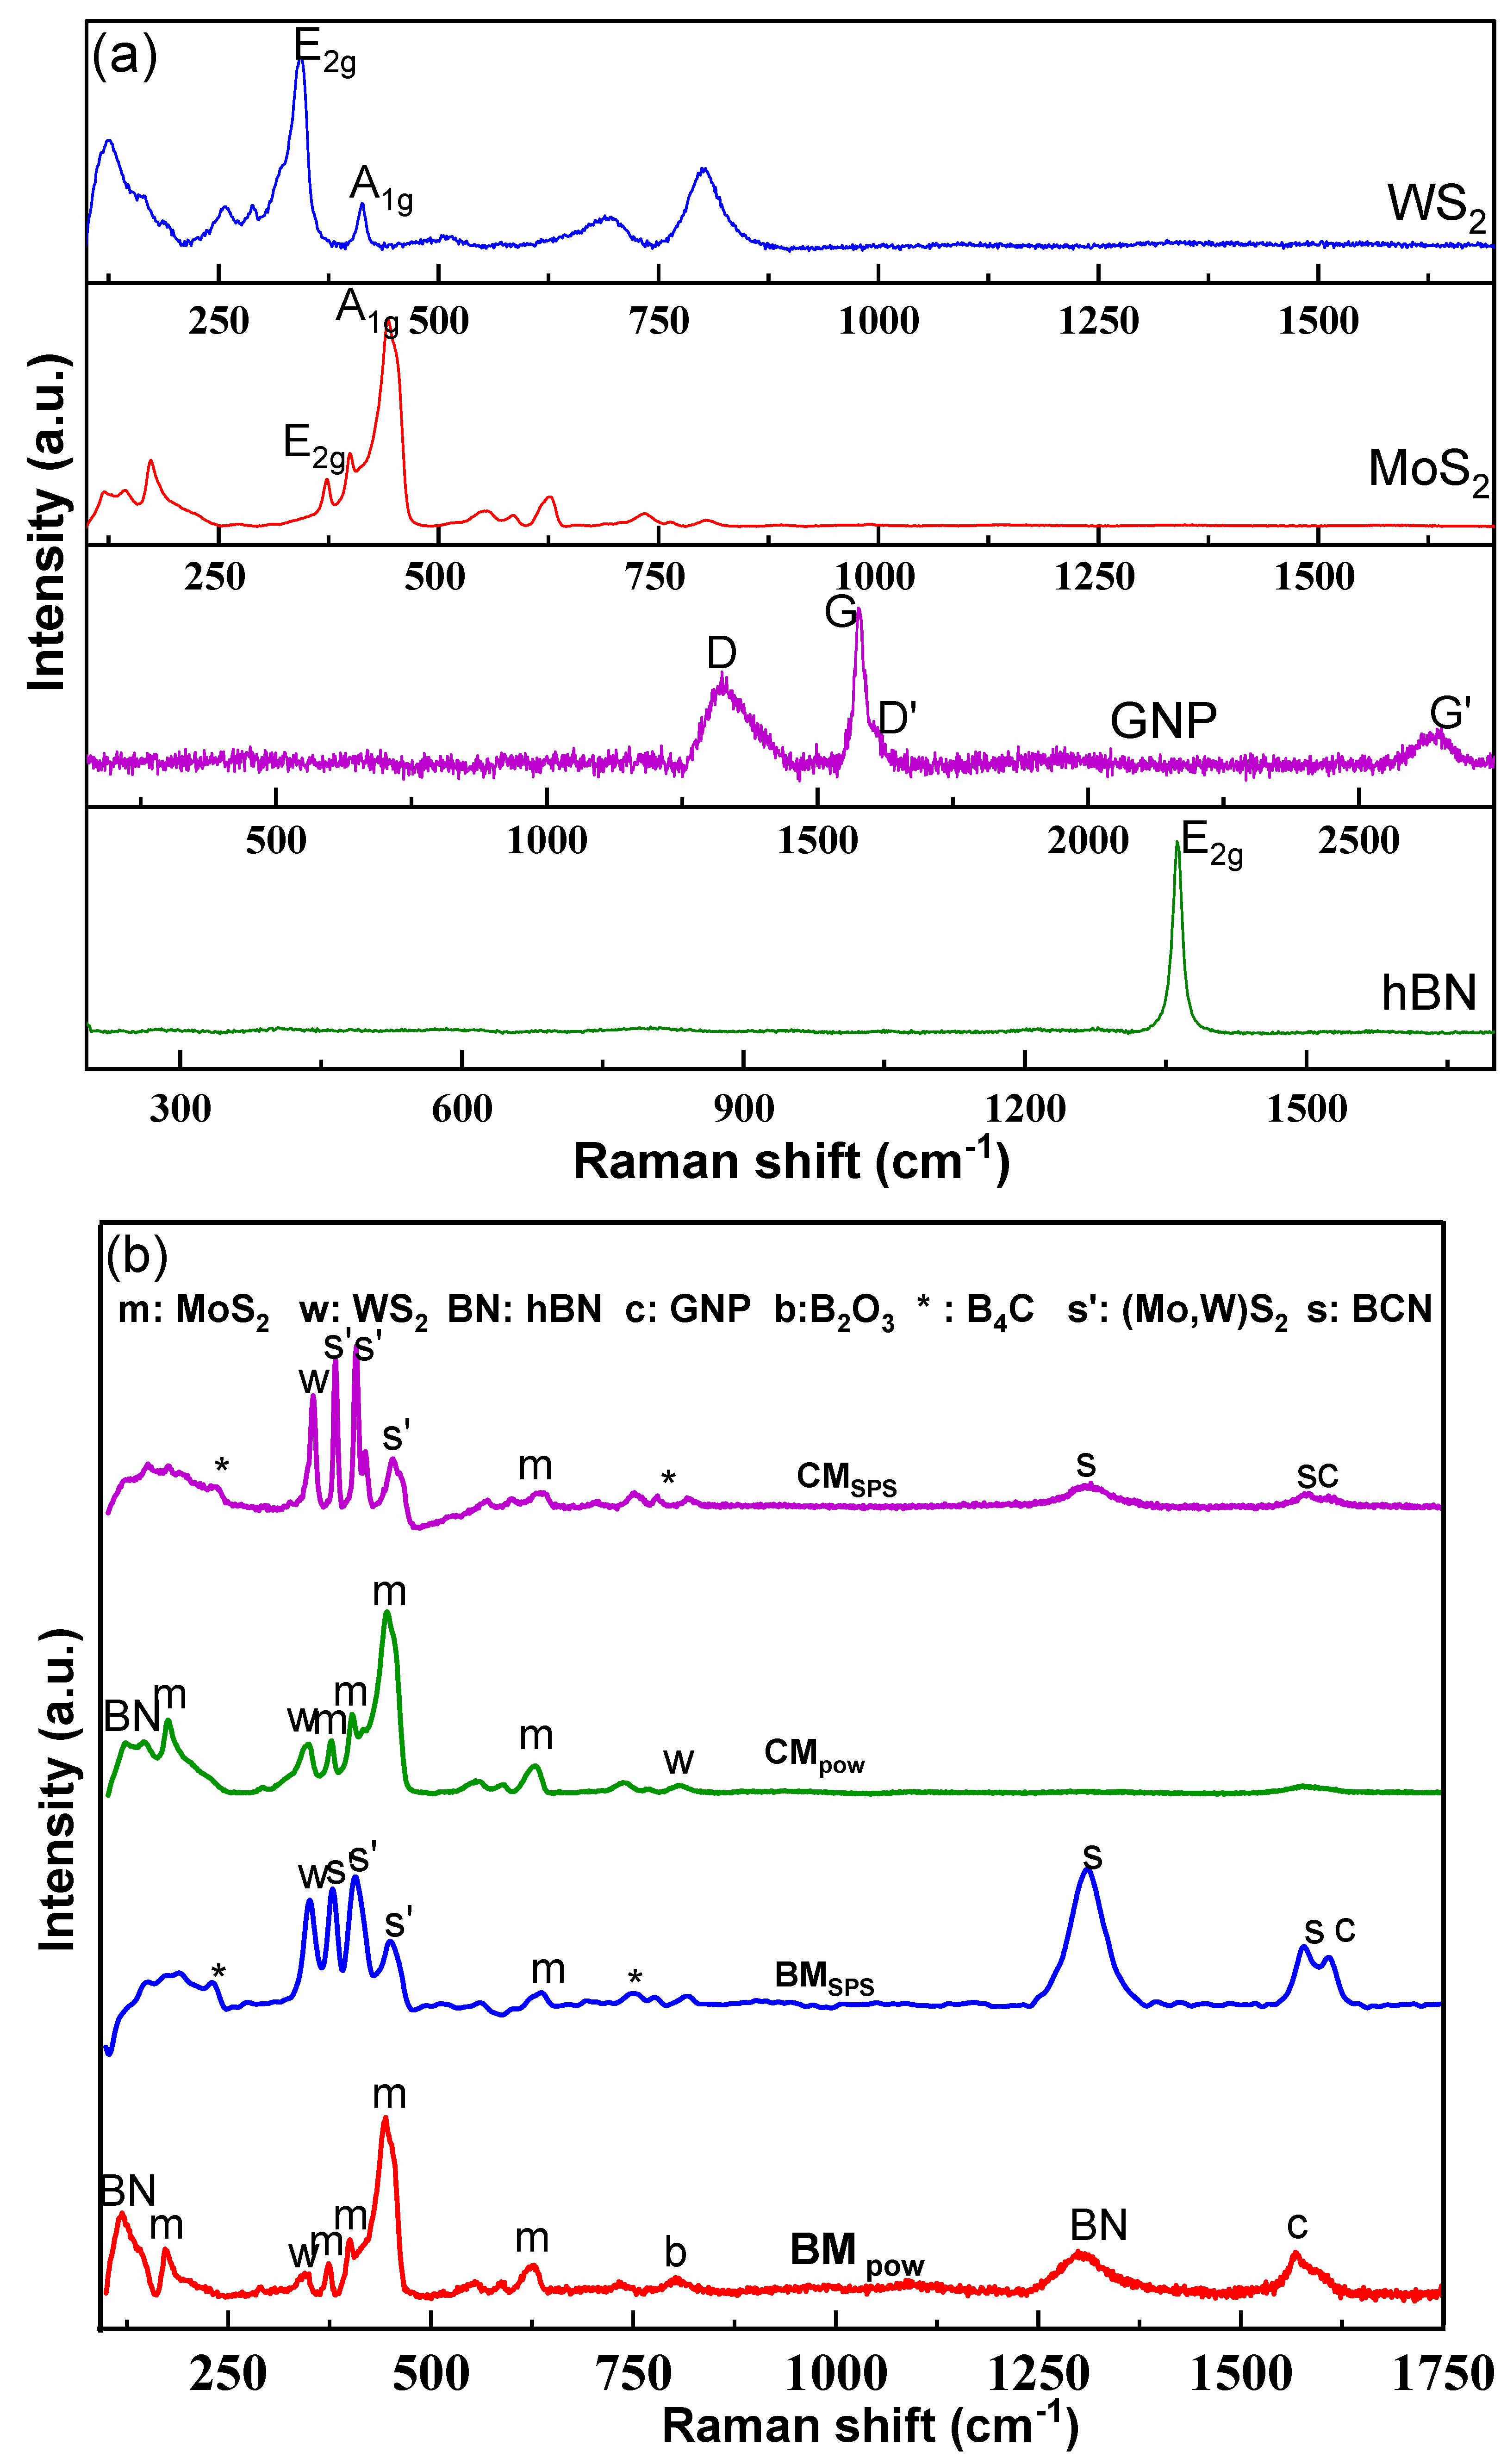
As a complementary approach for phase identification, Raman spectroscopy studies were performed on the received, BM and CM powders as well as the SPS-processed (see Figure 5). The signature peaks in the as-received powders (see Figure 5a), i.e., E2g at 1361.94 cm1 in hBN; D at 1326.61 cm1, G at 1577.50 cm1, D′ at 1595.93 cm1 and G′ at 2645.69 cm1 in GNP; E2g at 373.73 cm1 and A1g at 441.99 cm1 in MoS2; and E2g at 343.13 cm1 and A1g at 413.02 cm1 in WS2 were in good agreement with that in the literature [47,48,49,50,51]. All the peaks in the BM and CM powders were matched with that observed in the as-received powders, as indexed in Figure 5b. The shift in the signature peaks of all 2D materials in the BM and CM samples post SPS processing elicits that compressive stress is introduced due to synergistic effect of the milling process as well as thermal contraction of ceramics during sintering [42,52,53]. Similar to the XRD pattern (Figure 4), the peak corresponding to B2O3 phase was identified at 808 cm−1 [54] in BM powder, which disappeared in the SPS-processed samples (see Figure 5b). Analogous to XRD results, peaks corresponding to new phases, namely B4C, BCN, and solid-solution (Mo, W)S2 were apparent. The peaks for each of these phases, such as B4C, BCN, and (Mo, W)S2 marked in Figure 5b, are in good agreement with those reported in the literature [55,56,57].
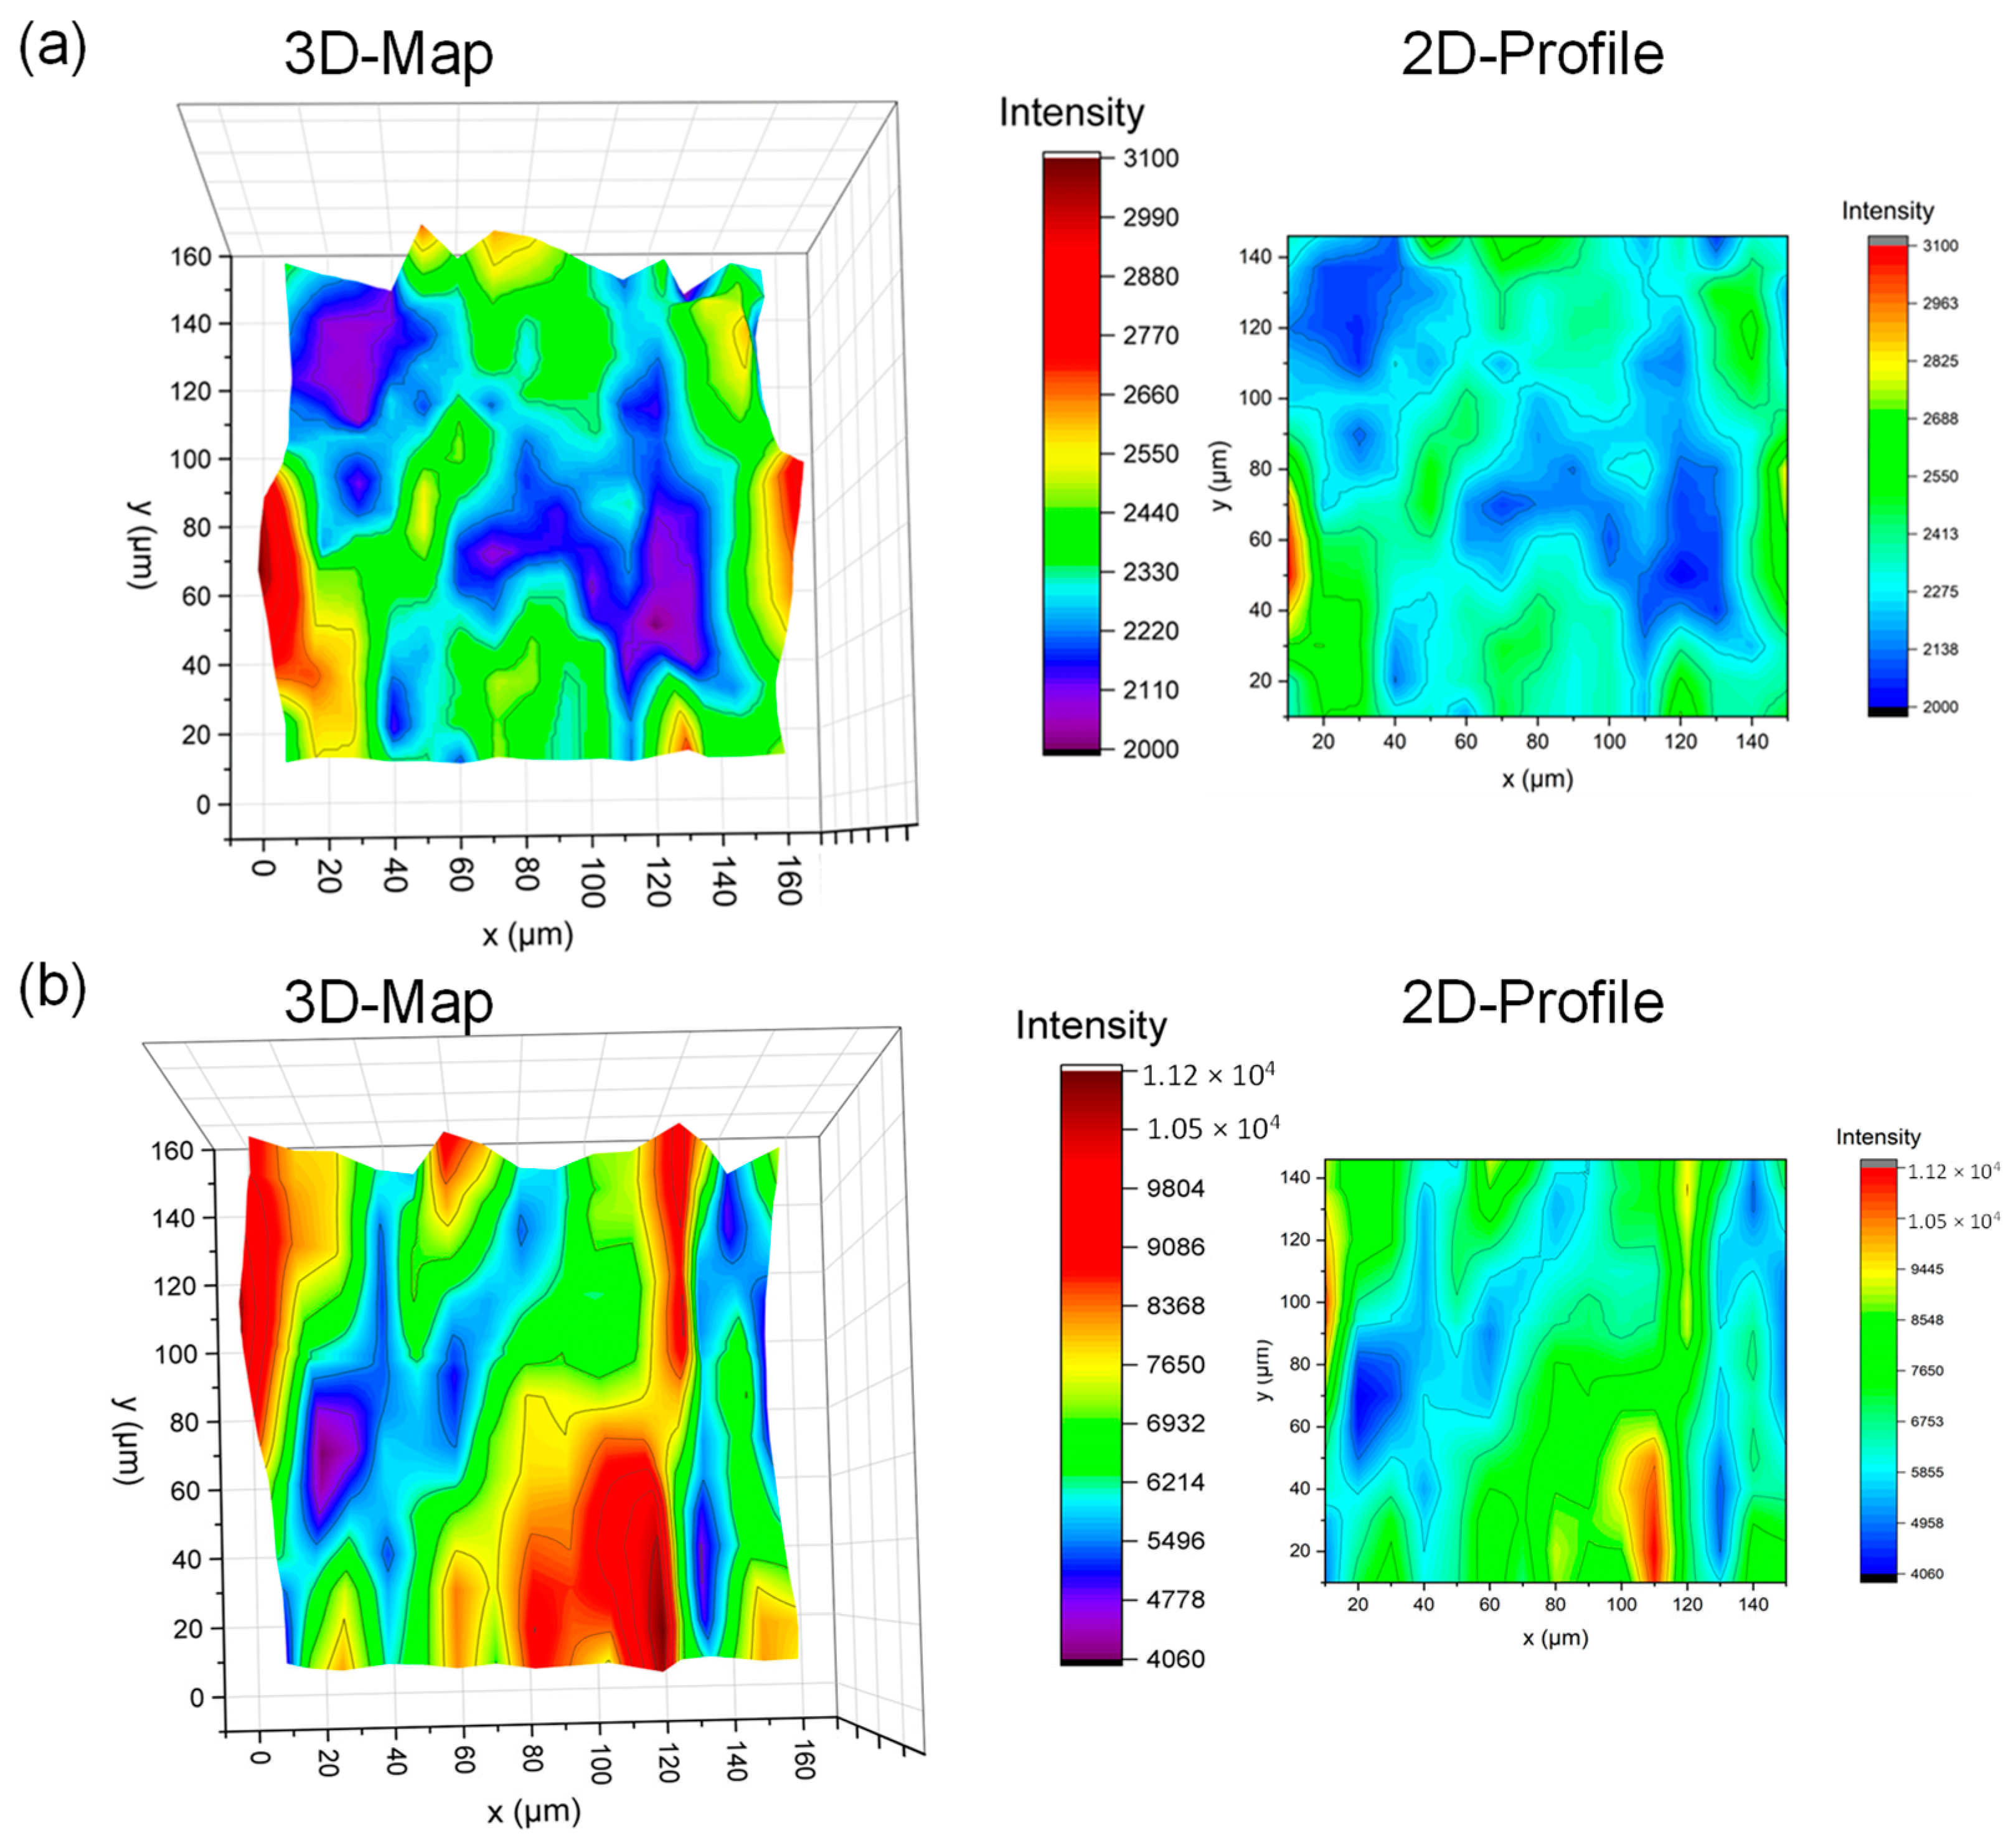
Additionally, chemical mapping of individual peaks of the new phases formed was performed via confocal Raman microscopy. The approach provides an orientation map eliciting the distribution of phases in the sample quantitatively [58]. An area of 150 μm × 150 μm was selected and divided into 15 rows and 15 columns. At the center of each intersection, Raman spectroscopy was performed, and the Raman toolset analyzed the 225 scans generated to produce map data on that area corresponding to that particular peak. Thus, a chemical-specific 3D map was generated using the map data. The 3D and 2D mapping of the solid-solution (Mo, W)S2 peak in both BM (at 404 cm−1) and CM (407 cm−1) SPS-processed samples are compared in Figure 6. The area colored in red indicates high intensity of the solid-solution (Mo, W)S2 peak at that location in the 150 μm × 150 μm region (scale showing correlation between color and intensity of the peak is present in Figure 6).
It can be seen that the CM sample (Figure 6b) shows a higher number and intensity of peaks corresponding to solid-solution (Mo, W)S2 than the BM sample (Figure 6a). This is analogous to the high intensity of the solid-solution (Mo, W)S2 XRD peak seen in the SPS-processed CM sample when compared to the BM sample. The CM powder had a more uniform distribution of particles of smaller average size (see Figure 2), facilitating the formation of larger amounts of solid solution (Mo, W)S2. In contrast, the BM sample showed lower-intensity Raman and XRD peaks isolated to specific regions. Furthermore, the 3D and 2D chemical mapping for peaks corresponding to B4C and BCN phases are compared in BM and CM samples in Figure S2. The map shown in Figure S2 qualitatively demonstrates that similar to a solid solution (Mo, W)S2, the B4C and BCN phases are more likely to form in larger amounts in the CM sample when compared to the BM sample. The observation matches the XRD analysis (see Figure 4). The intensity corresponding to B4C and BCN phases in the SPS-processed CM sample is higher than in the BM sample.

3.3. Scratch Behavior of Multicomponent 2D Materials

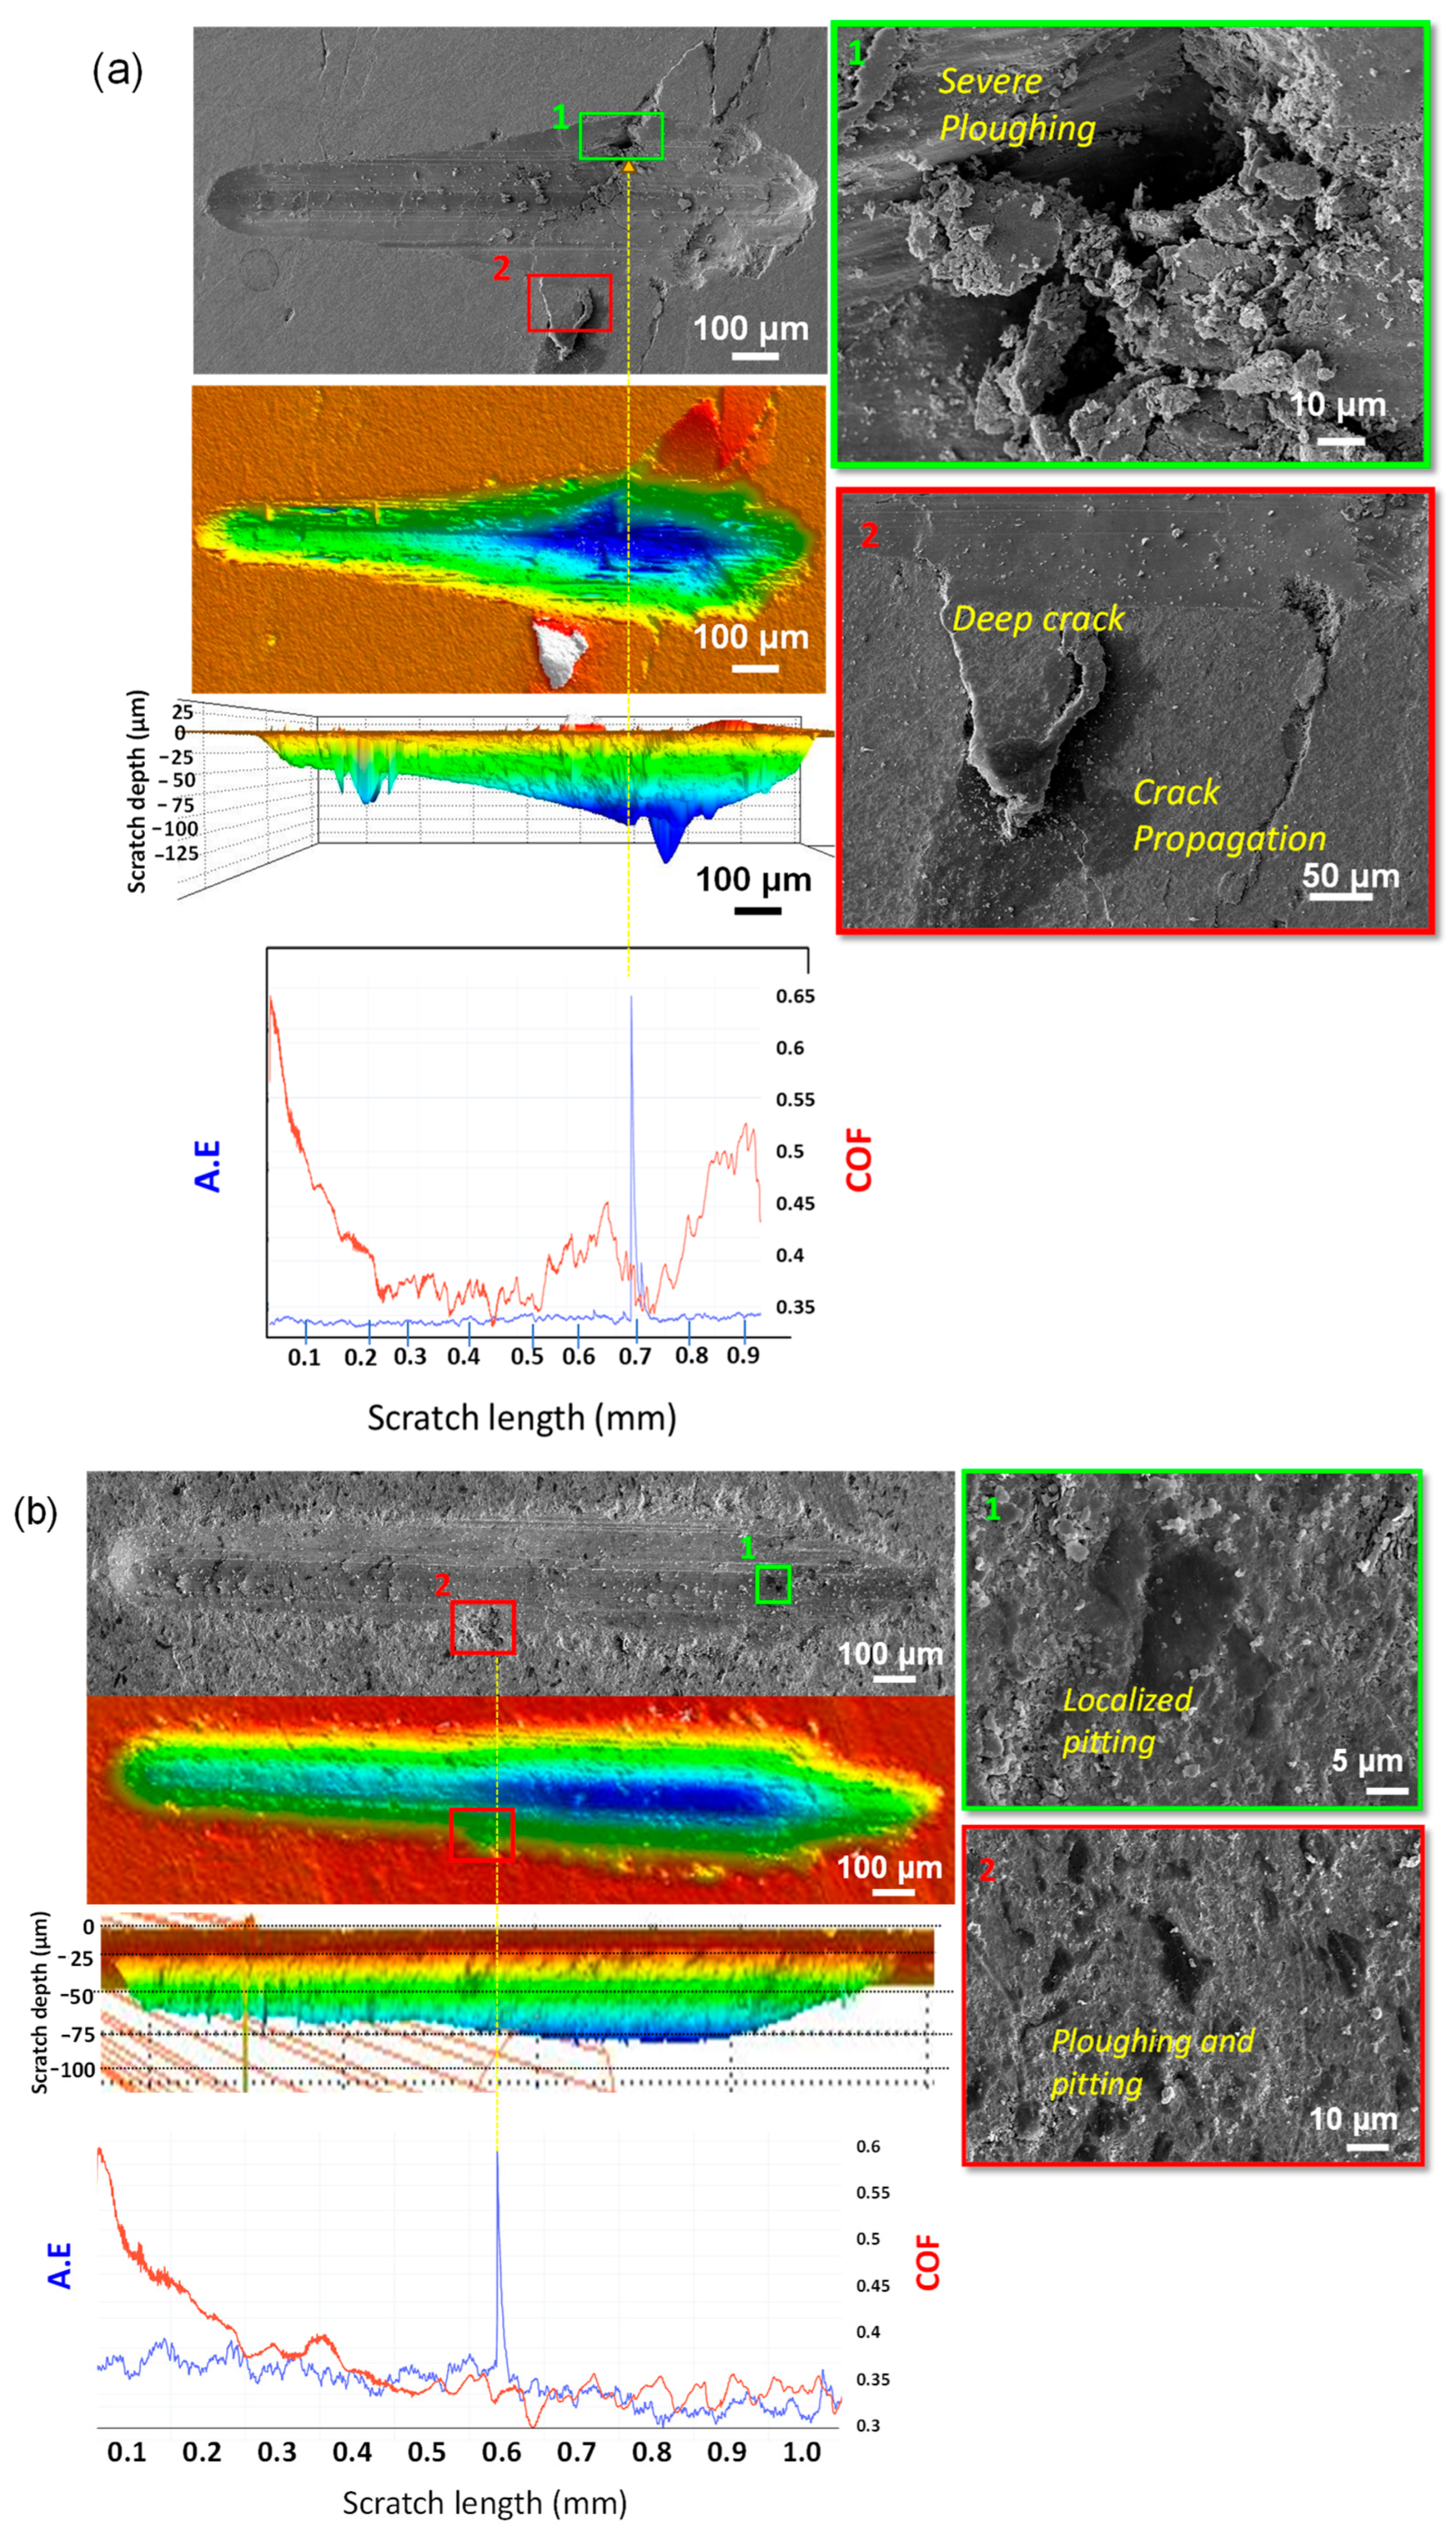
The scratch-induced wear behavior on the cross-sectional surface of the BM and CM sintered samples under progressive loading from 1 N to 10 N is shown in Figure 7. Randomized distribution of parent phases post milling and hence the new phases formed after sintering was observed. As a result, the cross-sectional surface was chosen to perform the scratch analysis, so that the indenter would encounter a wider range/distribution of phases formed rather than being limited to the phases present on or just below the top surface. Table 1 shows a comparative analysis of various parameters studied during the scratch analysis on BM and CM samples along the cross-section. The 1:1 matching between acoustic emission (AE) and coefficient of friction (CoF) data is also depicted to compare and evaluate scratch behavior in both samples. The AE signal in the BM sample (Figure 7a) corresponds to major cracking events propagating on the sample surface. In contrast, the AE signal in the CM sample (Figure 7b) corresponds to a small micro-crack visible at the edge of the scratch.
The maximum penetration depth, residual depth, and recovery are 75.77 μm, 60.16 μm, and 20.6% in the BM sample, and 33.78 μm, 17.74 μm and 47.5% in the CM sample, respectively (Table 1). The penetration depth for the BM sample was observed to be considerably larger than for the CM sample, while the BM sample showed poor recovery compared to the CM sample. Due to the larger average particle size and non-unfirm particle distribution, porosities were trapped (lower densification than the CM sample). These porosities further lead to weak inter-layer adhesion, and the indenter could penetrate deeper under similar loading conditions. The wear volume calculations backed up these facts. In the BM sample, the average CoF is 0.418, in contrast to the CM sample, with an average CoF of 0.350. During scratch testing, CoF data has shown a lot of serrations attributed to the weak van der Waals force between interlayers, causing uneven peeling and breaking of the layers from the cross-sectional surface. The wear volume is ~14.32 × 106 μm3 in the BM sample, which reduces 9.78 × 106 μm3 in the CM sample. The improved wear resistance in the CM sample also resonates with its lower CoF. This has been attributed to the higher bulk hardness of the CM sample, ranging from 0.57 to 0.65 GPa, compared to the BM sample ranging from 0.42 to 0.49 GPa. In the literature, the hardness of the bulk GNP (relative densification ~90%), BN (relative densification ~99.9%), and their equimolar composites (relative densification ~98.7%) processed using SPS at 1600 °C, 50 MPa, 10 min with relative densification are 0.18 GPa, 0.37 GPa, and 0.29 GPa, respectively [33]. Further, bulk WS2 pellets sintered at 1000 °C (relative densification ~87.2%), 50 MPa, 5 min showed a hardness of 0.46 GPa [35]. The increased hardness value together with higher densification, fewer porosities, and higher content of the solid-solution phases in CM sample further supports the improved wear resistance. These new phases, such as B4C [59], BCN [60], and (Mo, W)S2 [61], have shown significant improvement in the mechanical and tribological behavior of the material.
Further, the high-magnification SEM in the green inset image (in Figure 7a) of the region matching the AE peak shows severe abrasion in the sample and a long propagating crack. The severe abrasion in this region has resulted due to the underlying porosity in the area. During the sliding motion, the scratch tip plows into the material, pulling out chunks of material, thus exposing the underlying porosity Figure 7a (green inset). The image also shows debris from the breakage having deposited/fallen in the exposed porosity. This process also led to the cracking of the adjoining surface. Another inset image (Figure 7a red inset) also shows multiple adjacent cracks, starting from scratch edges and propagating onto the sample’s surface. This is caused when the indenter tip plows in and subsequently pushes through the material, causing layers to rip apart, which is seen as a deep crack in the BM sample. No such events were observed in the high-magnification SEM images of CM samples; see green and red inset of Figure 7b. Instead, the SEM image confirms pitting caused by the indenter in the CM sample (see Figure 7b), along with minor plowing, where the indenter digs and scoops out material as it moves, leaving behind deep craters. Craters caused due to severe abrasions and plowing, though they might look similar, are different because of how they are formed. Severe abrasions are a more destructive phenomenon where the indenter brutally ruptures the surface and the surrounding areas, causing a deeper crater filled with debris of all sizes, as seen in BM sample (Figure 7a). In contrast, during plowing, the indenter scoops out material along its direction of motion; hence, the craters are of a lesser depth, as seen in CM sample (Figure 7b). Negligible debris can be found inside the craters; however, no such observations were seen in the CM sample. The higher average CoF in the BM sample than in the CM sample further supports the SEM observations. Hence, the BM sample is more prone to severe abrasions, while the CM sample shows more pitting and plowing (Figure 7).
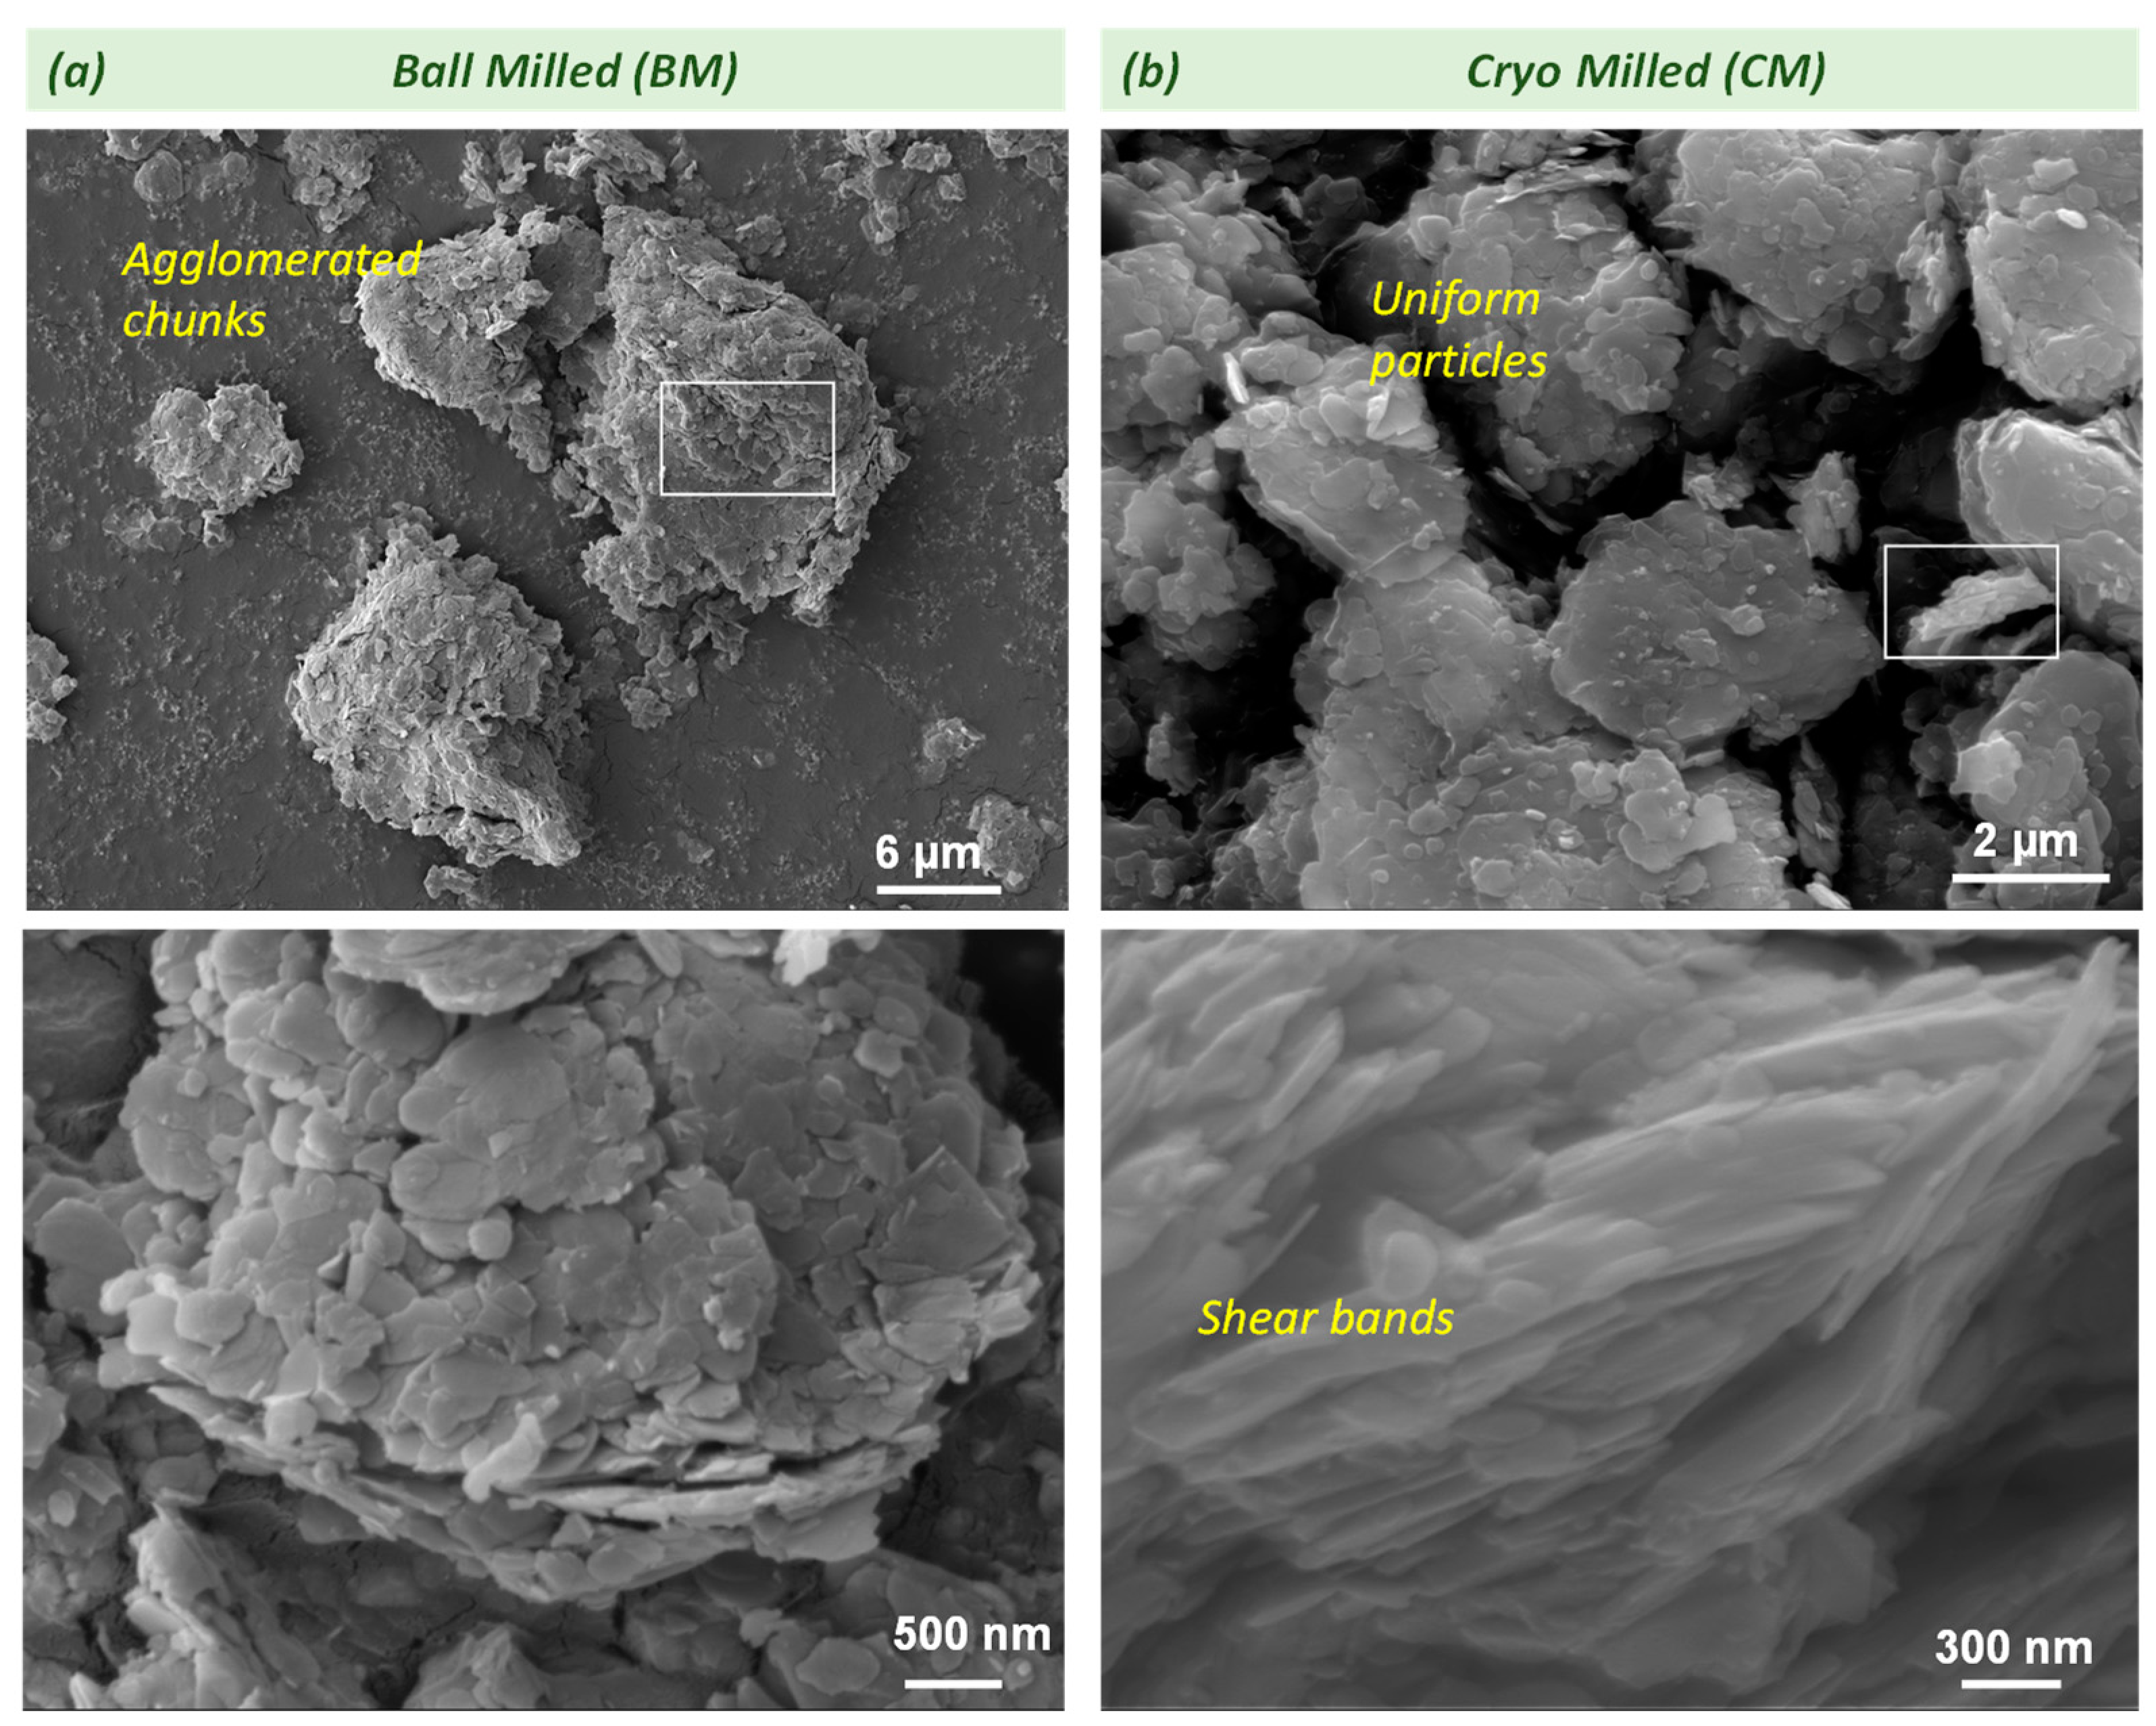
Additionally, the wear debris collected after scratch testing was analyzed under SEM in BM as well as CM samples (see Figure 8). BM debris shown in Figure 8a has chunk-like morphology with a coarser particle size distribution from non-uniform dispersion and agglomeration, similar to BM powders (Figure 2a). The major difference in CM debris from that of BM is the finer and uniform particle size distribution (see Figure 8b). This is attributed to the even dispersion and less agglomeration between 2D materials during CM (Figure 2d). Another noticeable feature is the shear lines seen in the layered structure of CM debris. This has been attributed to the “lip-lip” interactions in 2D materials such as h-BN and GNP. This interaction is stronger in h-BN as compared to GNP [62,63]. The interlayers in the 2D materials are held by weak van der Waal’s forces, which underwent shearing during scratch across the cross-section. The combined effect of lip–lip interlayer interactions and high sliding energy (confirmed by the shear bands in the CM sample) when subjected to in-plane strain during indentation and scratching results in higher resistance to indentation force. As a result, an improvement in the hardness and wear volume was noticed in the CM sample over the BM sample. Interestingly, it is also to be noted from Figure 8a that protrusion of the layers due to sliding of the 2D layers against each other was seen in the debris collected for the BM sample, which is similar to that observed near indentation edges during scratch testing (see Figure 7a). Due to the strong mechanical interlocking between the layers of 2D materials attributed to uniform dispersion of 2D materials in CM process, no such protrusion was seen in Figure 8b.
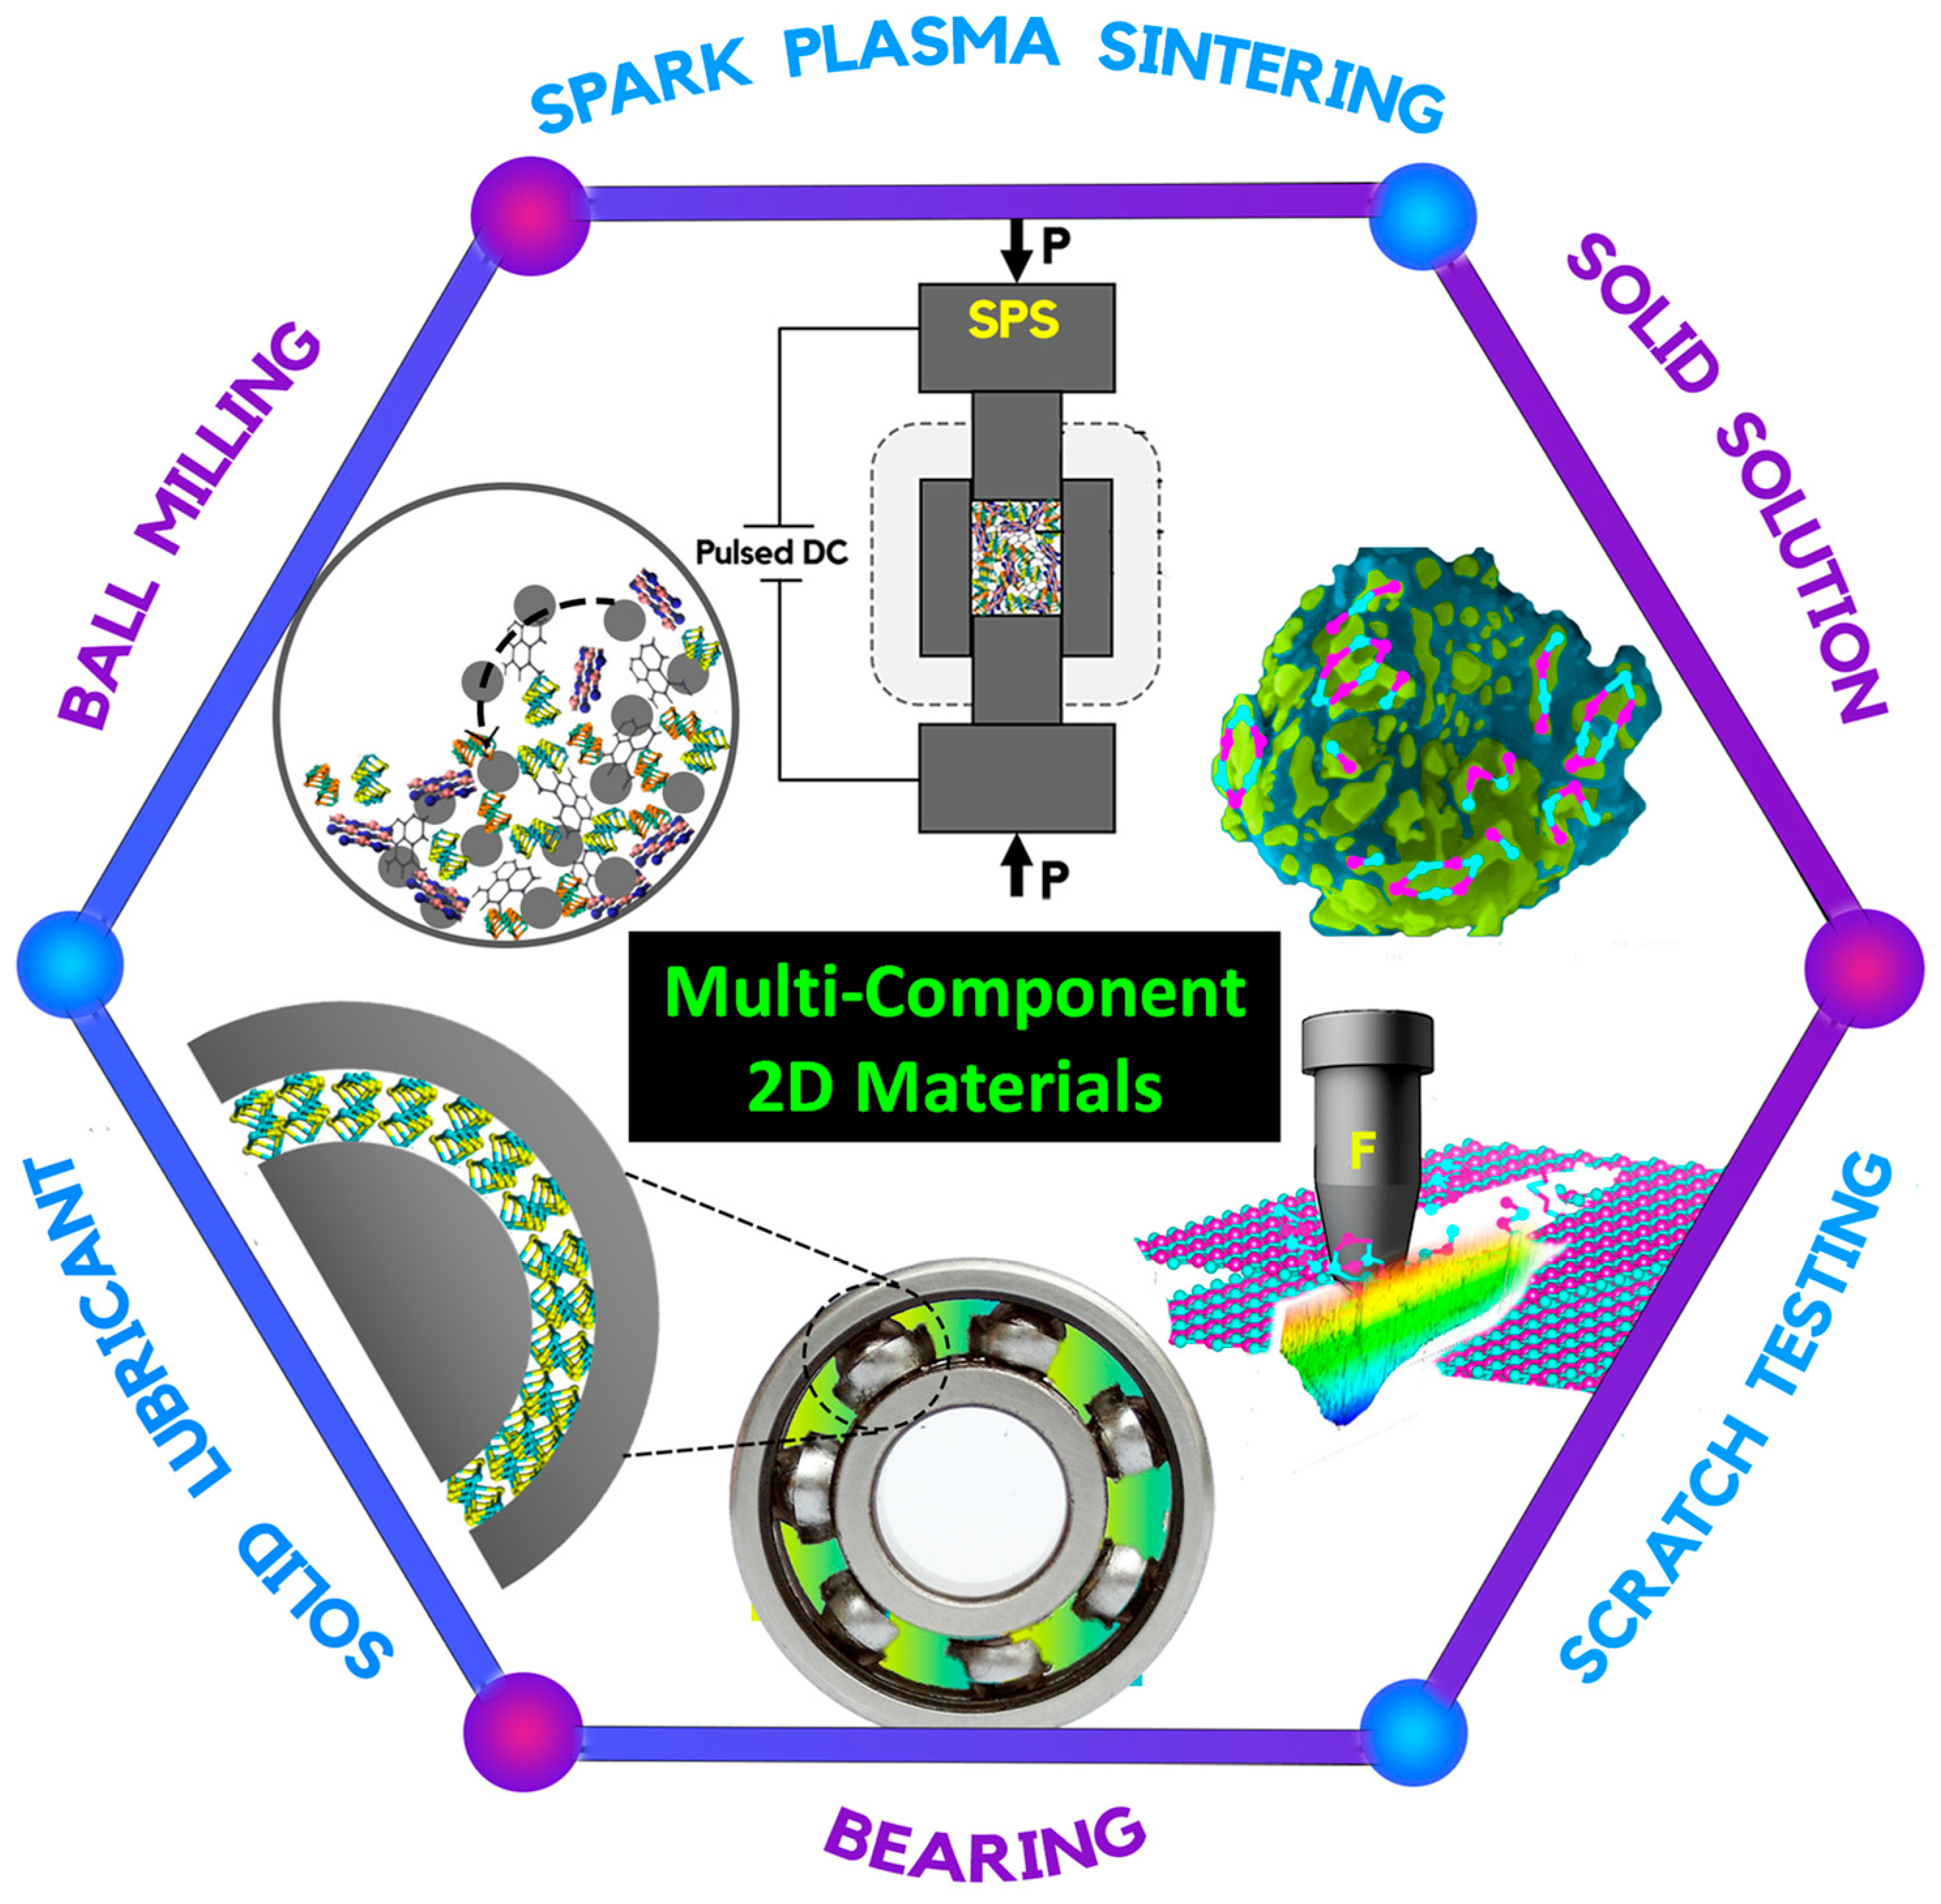
The schematic illustrating the summary of the present study is shown in Figure 9. The study shows that tailoring the phases in the multicomponent 2D materials via altering the content of new solid-solution phases can improve the high-bearing capabilities of these solid lubricants and their composites. The current growing concern about the usage of oil lubricants further illustrates that the multicomponent 2D nanocomposite lubrication system may be a viable solution in extreme space conditions. The presently developed multicomponent 2D materials can also be used as a lubricant additive to water, improving the performance of mechanical systems. Their potential application is further extended to industries involving metal cutting, metal forming, and oil extraction. Particularly appealing is the flexibility to fine-tune the balance between lubrication and wear resistance by adjusting the composition of multicomponent 2D solid lubricants, allowing for easy application as thin coatings on various surfaces. The most attractive part will be tuning and tailoring the balance of lubrication and wear resistance by adjusting the composition (content of solid-solution phases as well as parent phases) as per the application.

4. Conclusions

Equimolar concentrations of four component 2D materials viz. GNP, hBN, MoS2, and WS2 were mixed using BM and CM techniques to synthesize multicomponent 2D materials via SPS. The high temperature and pressure application during SPS (1200 °C, 60 MPa) has led to solid solutions and the formation of new phases, namely BCN, (Mo, W)S2, and B4C in the samples and the parent phase. CM is a more efficient technique for mixing 2D materials than BM due to finer particle size (BM: average size of 30 μm and maximum particle size of 409 μm; and CM: average size of 23 μm and maximum particle size of 159 μm), uniform distribution, and oxidation prevention. This has led to higher densification (BM: 86% and CM: 93%) and higher content of harder phase formation of BCN, (Mo, W)S2 and B4C, exhibited via confocal Raman and XRD analysis. Scratch analysis revealed that the SPS-processed CM sample (wear loss: ~9.78 × 106 μm3) showed better wear resistance (up to 46% more) over the BM sample (wear loss: ~14.32 × 106 μm3). The decrease in the CoF from ~0.42 (BM) to 0.35 (CM) also supports the escalation in the tolerance towards wear damage in the CM sample. The strong AE signal in the BM sample corresponds to major cracking, propagation, and spallation; the weaker AE signal in the CM sample showed some micro-cracks at the edge of the scratch. The dominant wear mechanisms are plowing, abrasion, cracking, and spallation in the BM sample, which is limited to plowing and scratch traces in the CM sample. The present finding offers knowledge about modulating the wear behavior of solid lubricants as per the applications by tailoring the content of solid-solution phases viz., BCN and (Mo, W)S2 in reinforced composites.

Supplementary Materials

The following supporting information can be downloaded at: https://www.mdpi.com/article/10.3390/lubricants12020031/s1, Figure S1: Energy dispersive spectroscopy (EDS) mapping and corresponding spectra eliciting the elemental distribution in (a) BM, and (b) CM powders; Figure S2: 3D chemical map and the representative 2D profile obtained from the sample surface corresponding to B4C phase in (a) BM, and (b) CM samples, and BCN phase in (c) BM, and (d) CM sample.

Author Contributions

V.A. performed the experiments, analyzed the data, and wrote the manuscript. A.N. designed the experiments, provided the ideas and direction for the research, fabricated the samples, and contributed to characterization, interpreting the results, and writing and editing the manuscript. A.K.S. performed SEM analysis and optical profilometry of the worn surfaces and contributed to data compilation. L.L. performed Raman analysis and helped in analyzing the data. S.M.A.K.M. performed cryo-milling of the 2D materials. All authors have read and agreed to the published version of the manuscript.

Funding

This research received no external funding.

Data Availability Statement

The authors declare that the data generated or analyzed during this study are included in this article (and the Supplementary Information file).

Acknowledgments

The Advanced Materials Engineering Research Institute (AMERI) at Florida International University (FIU) is acknowledged for extending various characterization facilities. Gia Garino is accredited for helping with polishing and scratch testing. V.A. thanks Shekhar Bhansali for providing the summer undergraduate research opportunity at FIU.

Conflicts of Interest

The authors declare that they have no known competing financial interests or personal relationships that could have influenced the work reported in this manuscript.

References

  1. Maboudian, R.; Ashurst, W.R.; Carraro, C. Tribological challenges in micromechanical systems. Tribol. Lett. 2002, 12, 95–100. [Google Scholar] [CrossRef]
  2. Bai, Y.; Wang, L.; Ge, C.; Liu, R.; Guan, H.; Zhang, X. Atomically thin hydroxylation boron nitride nanosheets for excellent water-based lubricant additives. J. Am. Ceram. Soc. 2020, 103, 6951–6960. [Google Scholar] [CrossRef]
  3. Wu, H.; Yin, S.; Du, Y.; Wang, L.; Yang, Y.; Wang, H. Alkyl-functionalized boron nitride nanosheets as lubricant additives. ACS Appl. Nano Mater. 2020, 3, 9108–9116. [Google Scholar] [CrossRef]
  4. Berman, D.; Deshmukh, S.A.; Sankaranarayanan, S.K.R.S.; Erdemir, A.; Sumant, A.V. Macroscale superlubricity enabled by graphene nanoscroll formation. Science 2015, 348, 1118–1122. [Google Scholar] [CrossRef] [PubMed]
  5. Li, Z.; Xu, C.; Xiao, G.; Zhang, J.; Chen, Z.; Yi, M. Lubrication performance of graphene as lubricant additive in 4-n-pentyl-4′-cyanobiphyl liquid crystal (5CB) for steel/steel contacts. Materials 2018, 11, 2110. [Google Scholar] [CrossRef]
  6. Berman, D.; Erdemir, A.; Sumant, A.V. Reduced wear and friction enabled by graphene layers on sliding steel surfaces in dry nitrogen. Carbon 2013, 59, 167–175. [Google Scholar] [CrossRef]
  7. Xiao, H.; Liu, S. 2D nanomaterials as lubricant additive: A review. Mater. Des. 2017, 135, 319–332. [Google Scholar] [CrossRef]
  8. Rabiei Baboukani, A.; Khakpour, I.; Drozd, V.; Wang, C. Liquid-Based Exfoliation of Black Phosphorus into Phosphorene and Its Application for Energy Storage Devices. Small Struct. 2021, 2, 2000148. [Google Scholar] [CrossRef]
  9. Nieto, A.; Lahiri, D.; Agarwal, A. Synthesis and properties of bulk graphene nanoplatelets consolidated by spark plasma sintering. Carbon 2012, 50, 4068–4077. [Google Scholar] [CrossRef]
  10. Phiri, J.; Gane, P.; Maloney, T.C. General overview of graphene: Production, properties and application in polymer composites. Mater. Sci. Eng. B 2017, 215, 9–28. [Google Scholar] [CrossRef]
  11. Podgornik, B.; Kosec, T.; Kocijan, A.; Donik, Č. Tribological behavior and lubrication performance of hexagonal boron nitride (h-BN) as a replacement for graphite in alzumn forming. Tribol. Int. 2015, 81, 267–275. [Google Scholar] [CrossRef]
  12. Biswal, S.R.; Sahoo, S. Structural and mechanical properties of a novel Al-Al2O3-WS2 hybrid composites. Mater. Lett. 2022, 307, 131017. [Google Scholar] [CrossRef]
  13. Yang, X.; Zhang, R.; Pu, J.; He, Z.; Xiong, L. 2D graphene and h-BN layers application in protective coatings. Corros. Rev. 2021, 39, 93–107. [Google Scholar] [CrossRef]
  14. Joseph, A.; Gautham, V.; Akshay, K.S.; Sajith, V. 2D MoS2-hBN hybrid coatings for enhanced corrosion resistance of solid lubricant coatings. Surf. Coat. Technol. 2022, 443, 128612. [Google Scholar] [CrossRef]
  15. Li, C.; Cao, Q.; Wang, F.; Xiao, Y.; Li, Y.; Delaunay, J.-J.; Zhu, H. Engineering graphene and TMDs based van der Waals heterostructures for photovoltaic and photoelectrochemical solar energy conversion. Chem. Soc. Rev. 2018, 47, 4981–5037. [Google Scholar] [CrossRef] [PubMed]
  16. Wang, J.; Ma, F.; Sun, M. Graphene, hexagonal boron nitride, and their heterostructures: Properties and applications. RSC Adv. 2017, 7, 16801–16822. [Google Scholar] [CrossRef]
  17. Wright, A.J.; Wang, Q.; Huang, C.; Nieto, A.; Chen, R.; Luo, J. From high-entropy ceramics to compositionally-complex ceramics: A case study of fluorite oxides. J. Eur. Ceram. Soc. 2020, 40, 2120–2129. [Google Scholar] [CrossRef]
  18. Gild, J.; Zhang, Y.; Harrington, T.; Jiang, S.; Hu, T.; Quinn, M.C.; Mellor, W.M.; Zhou, N.; Vecchio, K.; Luo, J. High-entropy metal diborides: A new class of high-entropy materials and a new type of ultrahigh temperature ceramics. Sci. Rep. 2016, 6, 37946. [Google Scholar] [CrossRef]
  19. Yang, Y.; Ma, L.; Gan, G.-Y.; Wang, W.; Tang, B.-Y. Investigation of thermodynamic properties of high entropy (TaNbHfTiZr) C and (TaNbHfTiZr) N. J. Alloys Compd. 2019, 788, 1076–1083. [Google Scholar] [CrossRef]
  20. Qin, Y.; Liu, J.-X.; Li, F.; Wei, X.; Wu, H.; Zhang, G.-J. A high entropy silicide by reactive spark plasma sintering. J. Adv. Ceram. 2019, 8, 148–152. [Google Scholar] [CrossRef]
  21. Castle, E.; Csanádi, T.; Grasso, S.; Dusza, J.; Reece, M. Processing and properties of high-entropy ultra-high temperature carbides. Sci. Rep. 2018, 8, 8609. [Google Scholar] [CrossRef] [PubMed]
  22. Nisar, A.; Dolmetsch, T.; Paul, T.; Sakthivel, T.S.; Zhang, C.; Boesl, B.; Seal, S.; Agarwal, A. Unveiling enhanced oxidation resistance and mechanical integrity of multicomponent ultra-high temperature carbides. J. Am. Ceram. Soc. 2022, 105, 2500–2516. [Google Scholar] [CrossRef]
  23. Nisar, A.; Sakthivel, T.; Zhang, C.; Boesl, B.; Seal, S.; Agarwal, A. Quantification of complex protective surface oxide layer formed during plasma jet exposure of multicomponent ultra-high temperature carbides. Appl. Surf. Sci. 2022, 592, 153247. [Google Scholar] [CrossRef]
  24. Cui, Y.; Zhang, Y.; Cao, Z.; Gu, J.; Du, Z.; Li, B.; Yang, S. A perspective on high-entropy two-dimensional materials. SusMat 2022, 2, 65–75. [Google Scholar] [CrossRef]
  25. Quilty, C.D.; Housel, L.M.; Bock, D.C.; Dunkin, M.R.; Wang, L.; Lutz, D.M.; Abraham, A.; Bruck, A.M.; Takeuchi, E.S.; Takeuchi, K.J.; et al. Ex Situ and Operando XRD and XAS Analysis of MoS2: A Lithiation Study of Bulk and Nanosheet Materials. ACS Appl. Energy Mater. 2019, 2, 7635–7646. [Google Scholar] [CrossRef]
  26. Zhou, J.; Tao, Q.; Ahmed, B.; Palisaitis, J.; Persson, I.; Halim, J.; Barsoum, M.W.; Persson, P.O.Å.; Rosen, J. High-Entropy Laminate Metal Carbide (MAX Phase) and Its Two-Dimensional Derivative MXene. Chem. Mater. 2022, 34, 2098–2106. [Google Scholar] [CrossRef]
  27. Cavin, J.; Ahmadiparidari, A.; Majidi, L.; Thind, A.S.; Misal, S.N.; Prajapati, A.; Hemmat, Z.; Rastegar, S.; Beukelman, A.; Singh, M.R.; et al. 2D high-entropy transition metal dichalcogenides for carbon dioxide electrocatalysis. Adv. Mater. 2021, 33, 2100347. [Google Scholar] [CrossRef]
  28. Li, F.; Sun, S.-K.; Chen, Y.; Naka, T.; Hashishin, T.; Maruyama, J.; Abe, H. Bottom-up synthesis of 2D layered high-entropy transition metal hydroxides. Nanoscale Adv. 2022, 4, 2468–2478. [Google Scholar] [CrossRef]
  29. Nemani, S.K.; Zhang, B.; Wyatt, B.C.; Hood, Z.D.; Manna, S.; Khaledialidusti, R.; Hong, W.; Sternberg, M.G.; Sankaranarayanan, S.K.R.S.; Anasori, B. High-entropy 2D carbide mxenes: TiVNbMoC3 and TiVCrMoC3. ACS Nano 2021, 15, 12815–12825. [Google Scholar] [CrossRef]
  30. Samal, S.; Cibulková, J.; Čtvrtlík, R.; Tomáštík, J.; Václavek, L.; Kopeček, J.; Šittner, P. Tribological behavior of NiTi alloy produced by spark plasma sintering method. Coatings 2021, 11, 1246. [Google Scholar] [CrossRef]
  31. Samal, S.; Molnárová, O.; Průša, F.; Kopeček, J.; Heller, L.; Šittner, P.; Škodová, M.; Abate, L.; Blanco, I. Net-shape NiTi shape memory alloy by spark plasma sintering method. Appl. Sci. 2021, 11, 1802. [Google Scholar] [CrossRef]
  32. Fontoura, L.; Nautiyal, P.; Loganathan, A.; Boesl, B.; Agarwal, A. Nacre-Inspired Graphene/Metal Hybrid by In Situ Cementation Reaction and Joule Heating. Adv. Eng. Mater. 2018, 20, 1800518. [Google Scholar] [CrossRef]
  33. Rajesh, K.; Dubey, A.; Rangaswamy, M.K.; Lahiri, I.; Lahiri, D. Tailoring the tribological behavior of composite structures with optimized ratio of graphene and boron nitride nanosheets. Tribol. Int. 2022, 175, 107835. [Google Scholar] [CrossRef]
  34. Loganathan, A.; Sharma, A.; Rudolf, C.; Zhang, C.; Nautiyal, P.; Suwas, S.; Boesl, B.; Agarwal, A. In-situ deformation mechanism and orientation effects in sintered 2D boron nitride nanosheets. Mater. Sci. Eng. A 2017, 708, 440–450. [Google Scholar] [CrossRef]
  35. Adigilli, H.K.; Murugan, K.; Srinivas, P.V.V.; Basha, D.N.; Karati, A.; Pandey, A.K.; Joardar, J. Spark plasma sintering behavior and structural stability of 2D-WS2 nanosheets. Ceram. Int. 2022, 48, 25151–25158. [Google Scholar] [CrossRef]
  36. Jin, Z.; Chao, M.A.; Xiao, K.; Zhang, L.; Liu, X.-L. Effect of WS2 particle size on mechanical properties and tribological behaviors of Cu-WS2 composites sintered by SPS. Trans. Nonferrous Met. Soc. 2018, 28, 1176–1185. [Google Scholar]
  37. Chen, Z.; Liu, X.; Liu, Y.; Gunsel, S.; Luo, J. Ultrathin MoS2 nanosheets with superior extreme pressure property as boundary lubricants. Sci. Rep. 2015, 5, 12869. [Google Scholar] [CrossRef]
  38. Loganathan, A. Spark Plasma Sintering of 2D Nitride and Carbide Based Ceramics. Ph.D. Thesis, Florida International University, Miami, FL, USA, 2019. [Google Scholar]
  39. Azimi, S.; Rastgoo, A.; Sattari, S.; Rashidi, A. Defects and Structural Analysis of Multi-Wall Carbon Nano Tubes via Ball milling and Cryo-milling. J. Comput. Appl. Mech. 2016, 47, 1–9. [Google Scholar]
  40. Li, T.; Yin, Z.; Wu, G. Study on heat transfer behavior and thermal breakage characteristic of the charge in ball mills. Adv. Mech. Eng. 2021, 13, 1687814021994964. [Google Scholar] [CrossRef]
  41. Jacobson, N.S.; Morscher, G.N.; Bryant, D.R.; Tressler, R.E. High-temperature oxidation of boron nitride: II, boron nitride layers in composites. J. Am. Ceram. Soc. 1999, 82, 1473–1482. [Google Scholar] [CrossRef]
  42. Nisar, A.; Ariharan, S.; Venkateswaran, T.; Sreenivas, N.; Balani, K. Effect of carbon nanotube on processing, microstructural, mechanical and ablation behavior of ZrB2-20SiC based ultra-high temperature ceramic composites. Carbon 2017, 111, 269–282. [Google Scholar] [CrossRef]
  43. Song, L.; Liu, Z.; Reddy, A.L.M.; Narayanan, N.T.; Taha-Tijerina, J.; Peng, J.; Gao, G.; Lou, J.; Vajtai, R.; Ajayan, P.M. Binary and ternary atomic layers built from carbon, boron, and nitrogen. Adv. Mater. 2012, 24, 4878–4895. [Google Scholar] [CrossRef] [PubMed]
  44. Pan, W.J.; Sun, J.; Ling, H.; Xu, N.; Ying, Z.F.; Wu, J.D. Preparation of thin films of carbon-based compounds. Appl. Surf. Sci. 2003, 218, 298–305. [Google Scholar] [CrossRef]
  45. Zeng, H.; Kan, Y.-M.; Zhang, G.-J. Synthesis of boron carbide powder from hexagonal boron nitride. Mater. Lett. 2010, 64, 2000–2002. [Google Scholar] [CrossRef]
  46. Zeng, Y.; Domask, A.C.; Mohney, S.E. Condensed phase diagrams for the metal–W–S systems and their relevance for contacts to WS2. Mater. Sci. Eng. B 2016, 212, 78–88. [Google Scholar] [CrossRef]
  47. Reich, S.; Ferrari, A.C.; Arenal, R.; Loiseau, A.; Bello, I.; Robertson, J. Resonant Raman scattering in cubic and hexagonal boron nitride. Phys. Rev. B 2005, 71, 205201. [Google Scholar] [CrossRef]
  48. Zhou, K.-G.; Withers, F.; Cao, Y.; Hu, S.; Yu, G.; Casiraghi, C. Raman modes of MoS2 used as fingerprint of van der Waals interactions in 2-D crystal-based heterostructures. ACS Nano 2014, 8, 9914–9924. [Google Scholar] [CrossRef]
  49. Gołasa, K.; Grzeszczyk, M.; Bożek, R.; Leszczyński, P.; Wysmołek, A.; Potemski, M.; Babiński, A. Resonant Raman scattering in MoS2—From bulk to monolayer. Solid State Commun. 2014, 197, 53–56. [Google Scholar] [CrossRef]
  50. Berkdemir, A.; Gutiérrez, H.R.; Botello-Méndez, A.R.; Perea-López, N.; Elías, A.L.; Chia, C.-I.; Wang, B.; Crespi, V.H.; López-Urías, F.; Charlier, J.-C. Identification of individual and few layers of WS2 using Raman Spectroscopy. Sci. Rep. 2013, 3, 1755. [Google Scholar] [CrossRef]
  51. Malard, L.M.; Pimenta, M.A.; Dresselhaus, G.; Dresselhaus, M.S. Raman spectroscopy in graphene. Phys. Rep. 2009, 473, 51–87. [Google Scholar] [CrossRef]
  52. Bakshi, S.R.; Musaramthota, V.; Virzi, D.A.; Keshri, A.K.; Lahiri, D.; Singh, V.; Seal, S.; Agarwal, A. Spark plasma sintered tantalum carbide–carbon nanotube composite: Effect of pressure, carbon nanotube length and dispersion technique on microstructure and mechanical properties. Mater. Sci. Eng. A 2011, 528, 2538–2547. [Google Scholar] [CrossRef]
  53. Chen, S.; Liu, X.; Shu, X.; Yang, J.; Wang, L.; Zhang, K.; Wang, X.; Zhang, H.; Lu, X. Rapid synthesis and chemical durability of Gd2Zr2-xCexO7 via SPS for nuclear waste forms. Ceram. Int. 2018, 44, 20306–20310. [Google Scholar] [CrossRef]
  54. Shibata, N.; Horigudhi, M.; Edahiro, T. Raman spectra of binary high-silica glasses and fibers containing GeO2, P2O5 and B2O3. J. Non-Cryst. Solids 1981, 45, 115–126. [Google Scholar] [CrossRef]
  55. Pirker, L.; Ławrowski, R.; Schreiner, R.; Remškar, M.; Višić, B. MoxWx–1S2 Nanotubes for Advanced Field Emission Application. Adv. Funct. Mater. 2023, 33, 2213869. [Google Scholar] [CrossRef]
  56. Zhou, Z.F.; Bello, I.; Lei, M.K.; Li, K.Y.; Lee, C.S.; Lee, S.T. Synthesis and characterization of boron carbon nitride films by radio frequency magnetron sputtering. Surf. Coat. Technol. 2000, 128–129, 334–340. [Google Scholar] [CrossRef]
  57. Reddy, K.M.; Liu, P.; Hirata, A.; Fujita, T.; Chen, M.W. Atomic structure of amorphous shear bands in boron carbide. Nat. Commun. 2013, 4, 2483. [Google Scholar] [CrossRef] [PubMed]
  58. Ilchenko, O.; Pilgun, Y.; Kutsyk, A.; Bachmann, F.; Slipets, R.; Todeschini, M.; Okeyo, P.O.; Poulsen, H.F.; Boisen, A. Fast and quantitative 2D and 3D orientation mapping using Raman microscopy. Nat. Commun. 2019, 10, 5555. [Google Scholar] [CrossRef] [PubMed]
  59. He, D.; Shang, L.; Lu, Z.; Zhang, G.; Wang, L.; Xue, Q. Tailoring the mechanical and tribological properties of B4C/aC coatings by controlling the boron carbide content. Surf. Coat. Technol. 2017, 329, 11–18. [Google Scholar] [CrossRef]
  60. Nehate, S.D.; Saikumar, A.K.; Prakash, A.; Sundaram, K.B. A review of boron carbon nitride thin films and progress in nanomaterials. Mater. Today Adv. 2020, 8, 100106. [Google Scholar] [CrossRef]
  61. Zhang, H.; Pan, Y.; Zhang, Y.; Lian, G.; Cao, Q.; Que, L. A comparative study on microstructure and tribological characteristics of Mo2FeB2/WC self-lubricating composite coatings with the addition of WS2, MoS2, and h-BN. Mater. Des. 2023, 225, 111581. [Google Scholar] [CrossRef]
  62. Wang, Z.; Meziani, M.J.; Patel, A.K.; Priego, P.; Wirth, K.; Wang, P.; Sun, Y.-P. Boron nitride nanosheets from different preparations and correlations with their material properties. Ind. Eng. Chem. Res. 2019, 58, 18644–18653. [Google Scholar] [CrossRef]
  63. Falin, A.; Cai, Q.; Santos, E.J.G.; Scullion, D.; Qian, D.; Zhang, R.; Yang, Z.; Huang, S.; Watanabe, K.; Taniguchi, T.; et al. Mechanical properties of atomically thin boron nitride and the role of interlayer interactions. Nat. Commun. 2017, 8, 15815. [Google Scholar] [CrossRef] [PubMed]
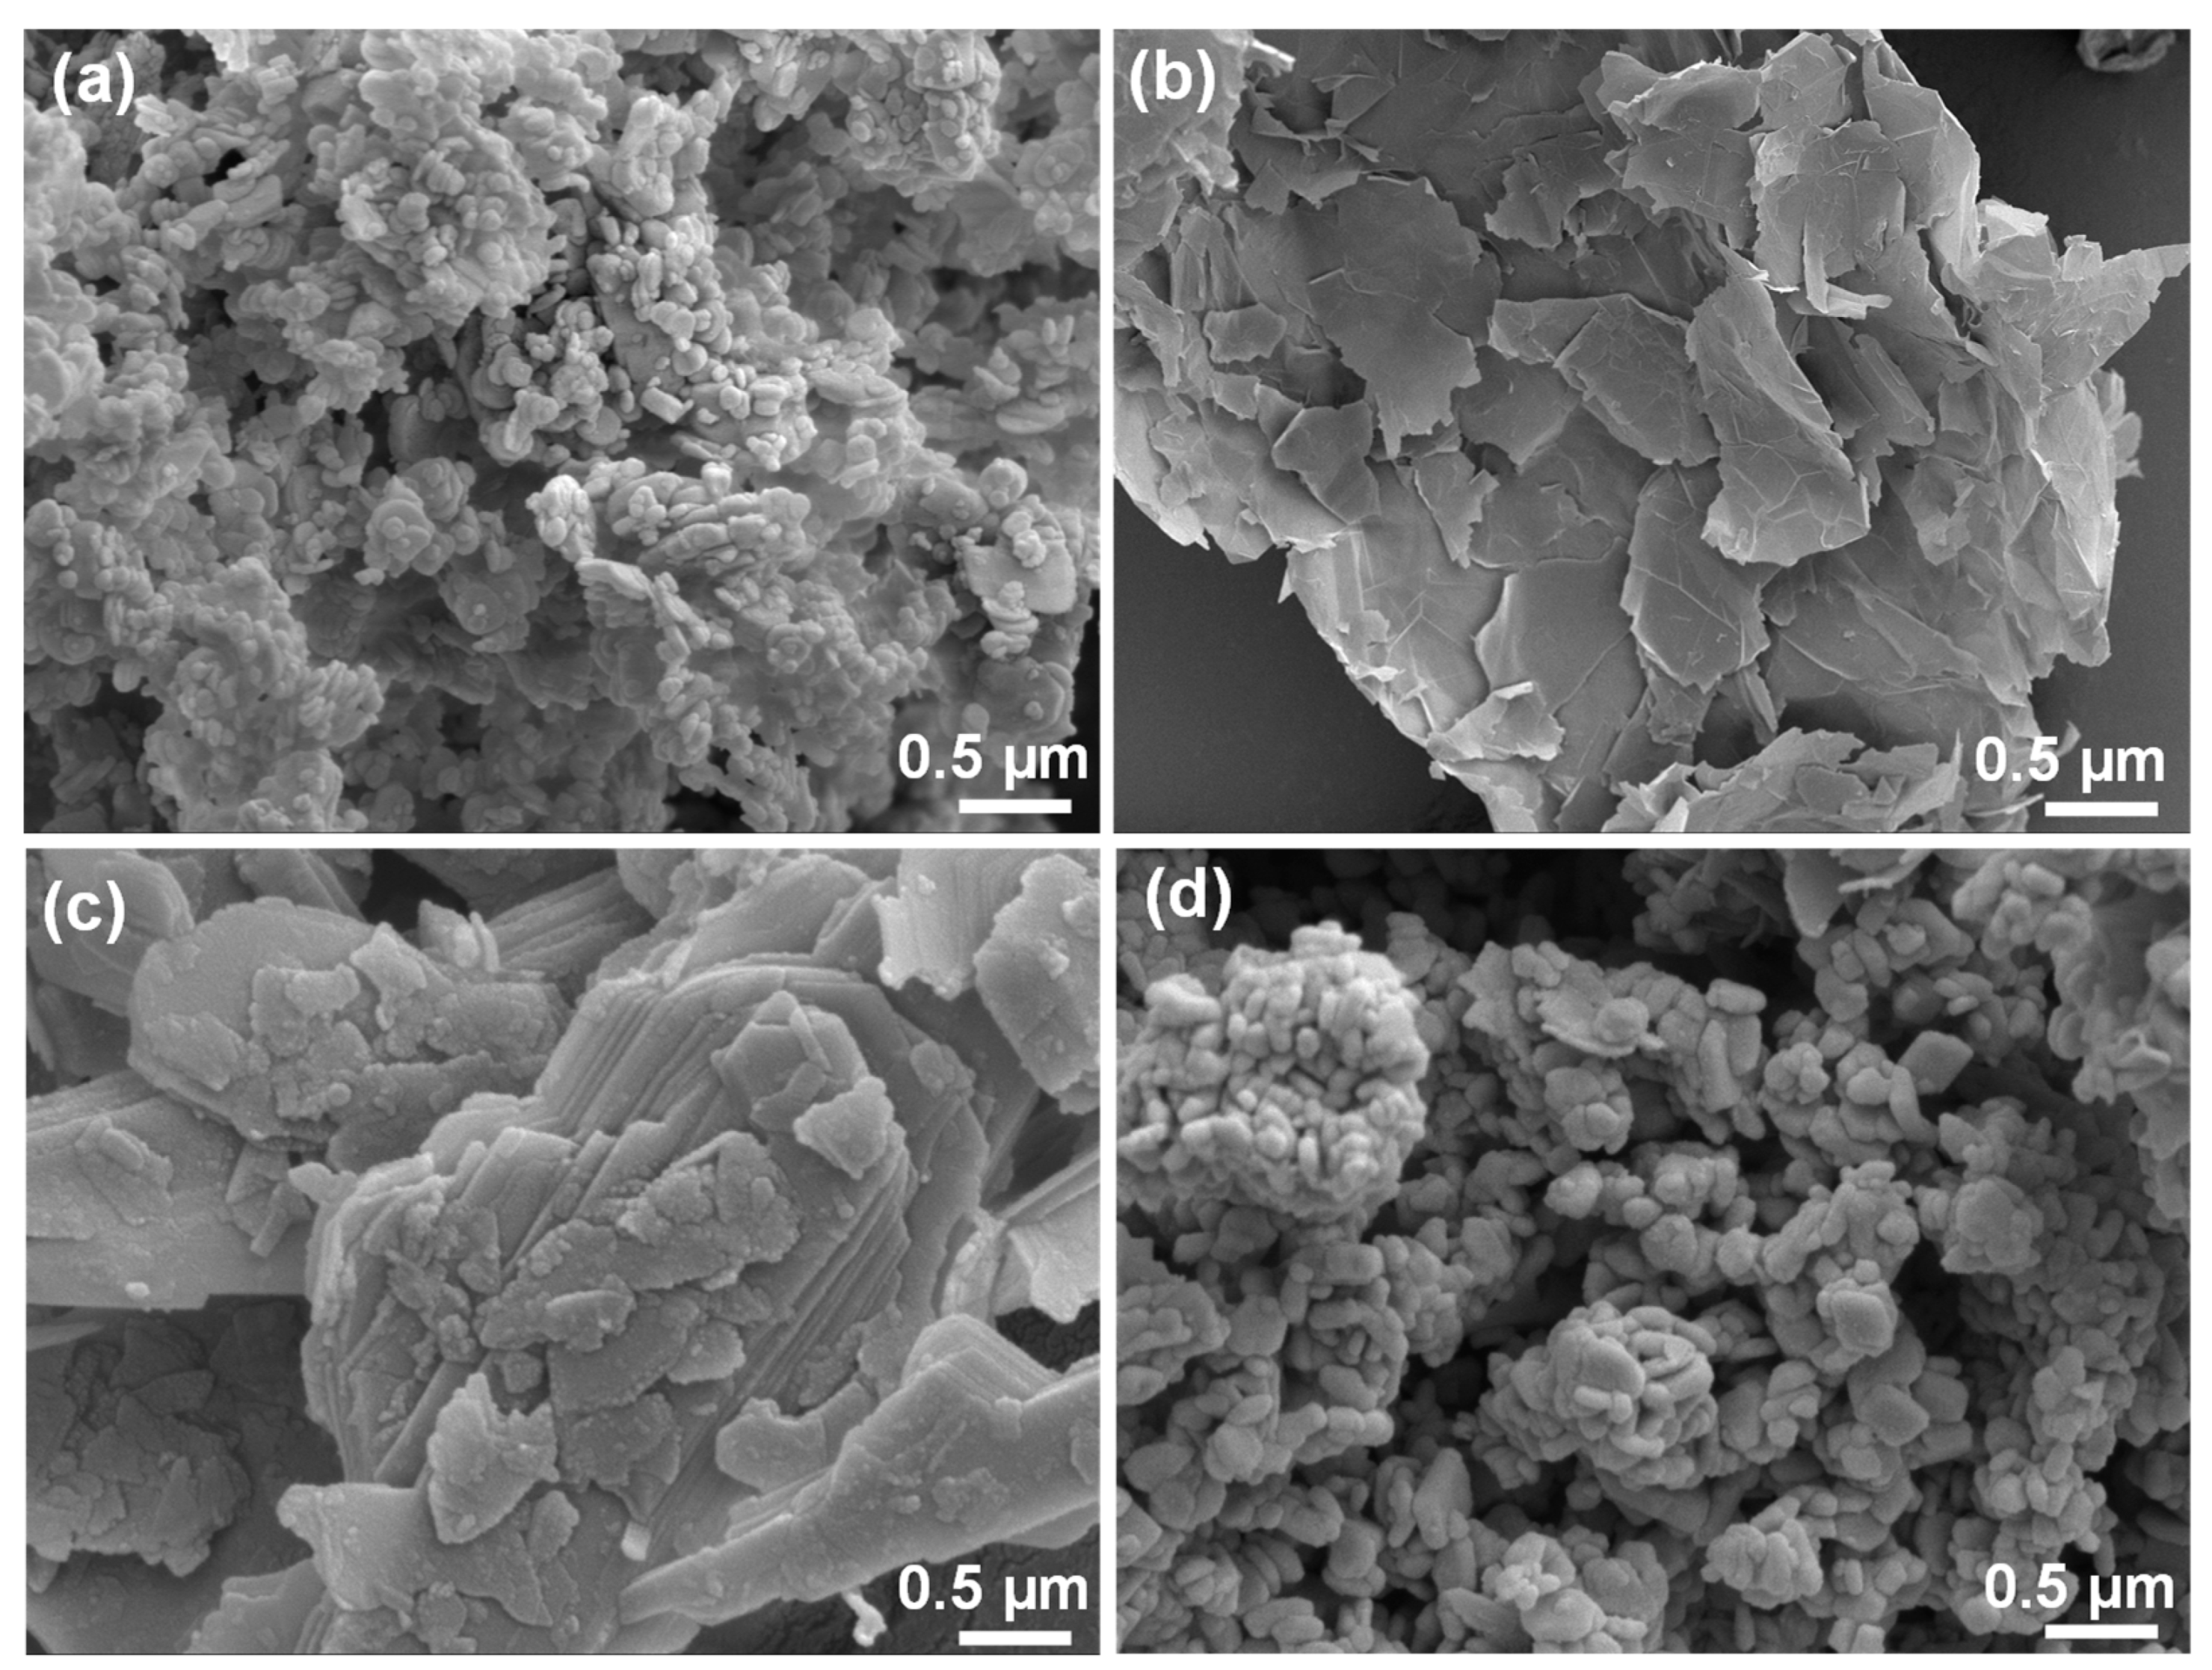
Figure 1. SEM image of the as-received 2D nano-powders (a) h-BN, (b) GNPs, (c) MoS2, and (d) WS2.
Lubricants 12 00031 g001
Figure 2. SEM micrographs and particle size distribution of the starting composite powders were obtained via (ac) ball milling (BM) and (df) cryo-milling (CM).
Lubricants 12 00031 g002
Figure 3. Fractorgraphs of SPS-processed multicomponent 2D materials via (ac) BM and (df) CM.
Lubricants 12 00031 g003
Figure 4. XRD reflections of the milled powders as well as SPS-processed samples.
Lubricants 12 00031 g004
Figure 5. Raman spectra of the (a) as-received powders and (b) BM and CM powders and SPS-processed samples.
Lubricants 12 00031 g005
Figure 6. 3D chemical map and the representative 2D profile corresponding to (Mo,W)S2 phase obtained from the sample surface (a) peak position of ~404 cm−1 in BM sample, and (b) peak position of ~407 cm−1 in CM sample.
Lubricants 12 00031 g006
Figure 7. Progressive scratch testing at a loading of 1 to 10 N and scratch length of 1 mm in (a) BM and (b) CM samples, showing 1:1 correspondence between the SEM image, optical profilometry, acoustic emission (AE), and coefficient of friction (CoF) data.
Lubricants 12 00031 g007
Figure 8. SEM images of the wear debris were collected after scratch testing in (a) BM and (b) CM samples.
Lubricants 12 00031 g008
Figure 9. Schematic illustrating the overall summary of the work. Here, SPS stands for “spark plasma sintering”; P stands for “pressure” and F stands for “applied load”.
Lubricants 12 00031 g009
Table 1. Values of scratch testing parameters during progressive loading on the SPS sintered BM and CM samples along the cross-section.
ParametersBM along Cross-SectionCM along Cross-Section
Surface Roughness (µm)0.288–0.3660.318–0.455
CoF0.389–0.4180.338–0.350
Max. Pd (µm)82.5639.42
Average Recovery18.31%38.18%
Wear Volume (×106 µm3)19.71 ± 7.679.45 ± 0.51
Disclaimer/Publisher’s Note: The statements, opinions and data contained in all publications are solely those of the individual author(s) and contributor(s) and not of MDPI and/or the editor(s). MDPI and/or the editor(s) disclaim responsibility for any injury to people or property resulting from any ideas, methods, instructions or products referred to in the content.