Article

Brake Wear and Airborne Particle Mass Emissions from Passenger Car Brakes in Dynamometer Experiments Based on the Worldwide Harmonized Light-Duty Vehicle Test Procedure Brake Cycle

Japan Automobile Research Institute (JARI), 2530 Karima, Tsukuba 305-0822, Japan
Lubricants 2024, 12(6), 206; https://doi.org/10.3390/lubricants12060206
Submission received: 13 May 2024 / Revised: 29 May 2024 / Accepted: 3 June 2024 / Published: 5 June 2024
(This article belongs to the Special Issue Emission and Transport of Wear Particles)

Abstract

:
Brake wear particles, as the major component of non-exhaust particulate matter, are known to have different emissions, depending on the type of brake assembly and the specifications of the vehicle. In this study, brake wear and wear particle mass emissions were measured under realistic vehicle driving and full friction braking conditions using current commercial genuine brake assemblies. Although there were no significant differences in either PM10 or PM2.5 emissions between the different cooling air flow rates, brake wear decreased and ultrafine particle (PM0.12) emissions increased with the increase in the cooling air flow rate. Particle mass measurements were collected on filter media, allowing chemical composition analysis to identify the source of brake wear particle mass emissions. The iron concentration in the brake wear particles indicated that the main contribution was derived from disc wear. Using a systematic approach that measured brake wear and wear particle emissions, this study was able to characterize correlations with elemental compositions in brake friction materials, adding to our understanding of the mechanical phenomena of brake wear and wear particle emissions.

1. Introduction

Particulate matter in urban air is of concern in terms of climate change and human health, and emissions from road traffic are known to be an important source. Particulate matter emitted by road traffic includes exhaust particulates from incomplete combustion of fuels and the evaporation of lubricating oil components, as well as non-exhaust particulates either emitted by vehicles or resuspended in the air from road surfaces disturbed by moving vehicles [1,2]. The particulate matter associated with brake wear and other non-emission particles accounts for more than half of all vehicle-derived particulate matter in cities, suggesting the importance of non-exhaust emissions in the urban environment [3,4,5]. In response to the challenge of measuring particle mass emissions related to brake wear particles [3,4,5], the Working Group on Energy and Pollution (GRPE) organized the particle measurement program informal working group (PMP-IWG) in 2021 to develop a global technical regulation number 24 (GTR24) for the sampling and measurement of brake dust emitted by light-duty vehicles up to 3.5 tons [6,7]. An industrial standard for measuring the mass emission of brake wear particles in the air by friction brakes for passenger cars was established in Japan by the Society of Automotive Engineers of Japan in 2020 [8]. The EURO7 regulation [9], recently decided upon to be introduced in Europe, will limit PM10, that is, particulate matter of 10 μm or less in diameter, emissions from brakes due to wear, with the aim of improving air quality by keeping vehicle emissions to the lowest possible level [10]. In accordance with Japan’s environmental policy-making process [11], the Japanese Expert Committee on Vehicle Emissions has discussed this issue and is in the process of formulating the “Future Measures to Reduce Vehicle Emissions (15th Report)”. The Japanese Ministry of Environment has stated at the World Forum for Harmonization of Vehicle Regulations (WP.29) that it will actively participate in and contribute to the evaluation of globally harmonized standards to take into account the emission characteristics of brake wear particles, using the knowledge obtained from research on the impact of brake wear particles’ emissions on air quality [12].
Brake wear is the most important starting point in the emission of brake-related particles. Conventional wear studies have measured the mass of a sample used before and after applying a defined amount of friction, which is always conducted under static conditions, although dynamic friction models that include friction history have been established [13]. The correlation of brake emissions to pad and disc wear factors performed in the World harmonized Light-duty Test Procedure (WLTP) Brake Cycle [14], according to the standard driving conditions of a real vehicle, is the focus of many ongoing research projects. It is known that brake emissions are closely related to the brake wear factors of pads and discs, and research efforts are underway to develop wear-resistant brake pads and discs to minimize emissions from braking systems by modifying the composition of friction and disc materials. Brake pads do not contain a single raw material, but a variety of materials in varying proportions. These materials are classified into four categories based on their functionality: friction modifiers, reinforcing materials, fillers, and binders [15,16]. The effects of various components of brake pads on brake emissions have been studied, focusing on binder resins [17], fillers [18], and other components [19,20]. Low-steel type brake pads tend to cause more brake emissions than non-steel pads because of their high level of aggressiveness toward the corresponding gray iron discs. In addition, brake discs with lower surface hardness have higher brake emissions due to higher disc wear [6,21,22,23,24,25,26,27,28,29]. On the other hand, there have been reports comparing non-steel and steel pads, where pad and disc wear factors are comparable, but brake emissions are lower for non-steel pads [26,27]; so, the effect of pad and disc wear factors on brake emissions is complex.
One contributing factor is that the friction film on the pad surface plays an important role in determining the wear resistance and brake emissions of brake pads and discs. Wear particles from the pad and disc aggregate to form a friction film on the pad surface, which serves as a temporary reservoir for wear particles during sliding between the frictions and the counterparts before this film is partially broken down and free particles are released [16,30,31,32,33]. Therefore, the cohesion of the friction film, which determines the wear resistance and particle ejection of the brake pad, is strongly influenced by the wear particles produced by the pad and disc. The brake wear factors of the pad and disc are also known to play an important role in determining the friction brake workload (test vehicle mass, tire dynamic load radius, and inertia related to the kinetic energy provided to the brake), which in turn determines the wear resistance and brake emissions of the brake pad and disc. Despite the fact that previous research has focused on the interaction between brake wear particle emissions and the intended brake assembly (pad/disc combination), a systematic approach to brake emissions and brake friction material characterization for commercial brake assemblies currently in use is lacking.
In this study, our research team measured brake wear particle emissions from current commercial vehicle brake assemblies using different genuine conventional gray iron discs and brake pads. We focused especially on the brake wear factors of pads and discs and on the behavior of airborne particle mass emission factors. Data from 31 test investigations of brake wear particle emissions in our laboratory were compared under various measurement conditions from the public WLTP Brake Cycle to the current state. Brake wear particle emissions were found to be correlated with pad and disc wear factors, but the ratios of particle mass emissions to the brake wear factor vary for different types of brake assemblies. The characteristics of elements in brake friction materials and brake particle emissions were identified based on the correlation of the elemental contents in the brake pads to brake wear and brake wear particle emissions.

2. Experimental Methods

2.1. Dynamometer Experiments

Brake wear particles were measured for 31 different types of commercially available original equipment manufacturer conventional gray cast iron disc assemblies (Table A1). The test brake assemblies were commercially available genuine brake assemblies; each consisted of a conventional cast iron ventilated disc, caliper, and brake pads. A single passenger car front brake wheel was used for driving and brake control in accord with the worldwide light vehicle test procedure (WLTP) brake driving profile (WLTP-Brake Cycle) [14] using an electric inertia dynamometer. The conditions required to control the test brake, the tire dynamic load radius and inertia [34], and the nominal wheel load to disc mass ratio (WLn/DM) required to define the brake temperature are presented in Table A1. Three enclosure/tunnel types were used (Table A1 and Figure A1): Type A, the enclosure/tunnel (inner diameter of φ83.1) equivalent to JASO [8] used in previous studies [35,36]; Type B, enclosure type A changed to a height of 700 mm and tunnel type A changed to an inner diameter of φ108.3; and Type C, enclosure type A changed to a depth of 200 mm, and tunnel type A changed to an inner diameter of φ208.3 as in [37]. The brake assembly was fitted to the dynamometer using universal style (L0-U) brake fixings as described in GTR24 [7]. The disc temperature was measured by locating a thermocouple 10 mm radially outward from the center of the friction pad and at a depth of 1.0 ± 0.1 mm from the disc surface for enclosure/tunnel type A or 0.5 ± 0.1 mm for enclosure/tunnel types B and C in some of the experiments. For reference, the mean disc temperature, the initial brake temperature (IBT), and the final brake temperature (FBT) for trip#10 are shown in Figure A2 for the brake temperature tolerance.
The sampling of brake wear particles was based on the JASO C 470 test method [8] and previous studies [35,36]; the process consists of an enclosure with a brake assembly inserted downstream of air supplied through a HEPA filter and a constant-flow sampling tunnel (25 °C standard for enclosure/tunnel Type A, 20 °C standard for enclosure/tunnel types B and C) (Table A1) because the GTR24 test method was not defined at the time of this experiment [7]. The cooling air flows in a right-to-left direction when the brake disc is viewed from the front, whereas the disc rotates in a counter-clockwise (CCW) direction [7] or clockwise (CW) in some of experiments.
The two most important categories used in this study were low-steel (low-metallic) pads (also known as European performance or “ECE”), which are developed and produced primarily for the European market, and non-asbestos organic (NAO) pads, which are designed primarily for the North American and Asian markets [25,38]. These two types of pads can be distinguished, inter alia, by the percentage of metal components in them. Low-steel (low-metallic) pads contain a significant percentage of iron, whereas NAO pads are usually steel-free (non-steel). However, as previous studies have shown [26,27], even NAO could be registered as ECE in electrified vehicles [37], making the chemical definition ambiguous. Therefore, in this study, pads with less than 0.1% Cr (an additive in steel), which are sold in the Japanese market and referred to as NAO, were defined as “non-steel pads”, and pads with several percent or more Cr were defined as “low-steel pads”. Table A2 summarizes the mass percentages of elements in the brake pads and discs used in this study. The elements of the brake pads (Table A2) and discs (Table A3) were measured by wavelength-dispersive X-ray fluorescence (WD-XRF) analysis (ZSX Primus II, Rigaku, Corp., Tokyo, Japan) [36].

2.2. Brake Wear and Particle Mass Measurements

The sampling of PM10 and PM2.5 was conducted with a multi-cascade impactor (MCI) (MCI-20, Tokyo Dylec Corp., Tokyo, Japan), according to the methods reported by [35,36] and the JASO test protocol [8] on a Teflon filter (Fluoropore FP-500-100, 47 φ for PM10 and PM2.5, Sumitomo Electric Fine Polymer Corp., Osaka, Japan) or a Teflon filter with a support ring (PT47, 47 φ, Measurement Technology Laboratory, Bloomington, MN, USA). Aspiration was conducted with an isokinetic sampling nozzle. In several experiments, PM10 and PM2.5 were measured using a cyclone for PM10 (URG-2000-30ET, URG, Chapel Hill, NC, USA) and a cyclone for PM2.5 (PM2.5 Very Sharp Cut Cyclone [VSCC], BGI), respectively [37,39]. Samples were collected by a suction pump with a mass flow controller (MQV0050, Azbil Corp., Tokyo, Japan) at a flow rate of 20.0 L/min according to the MCI design or 16.7 L/min according to the cyclone design and controlled at 20 °C standard conditions. Within one hour after the test, in a thermostatic chamber in a clean room (room temperature of 22 ± 3 °C, relative humidity of 45 ± 8%), an electronic balance (XPR2UV, Mettler-Toledo International Inc., Columbus, OH, USA, resolution 0.1 μg) was used immediately after neutralizing the filter with an ionizer for filter weighing.
A low-pressure impactor (LPI) (LP-20, Tokyo Dylec Corp., Tokyo, Japan) was used to measure the distribution of mass particle sizes of aerodynamic particles with sizes in the range of 0.05–11 μm. The particles were collected and sampled through the WLTP Brake Cycle three times. Samples were collected by a mass flow controller (MQV0050, Azbil Corp., Tokyo, Japan) at a flow rate of 23.8 L/min at 20 °C standard conditions according to the LPI design. The brake wear particles of each 50% cut aerodynamic particle size were controlled at ≤0.05, 0.12, 0.2, 0.3, 0.48, 0.68, 1.2, 2.0, 3.5, 5.1, 7.7, and ≥11 μm of 50% cut aerodynamic particle diameters and were collected on a Teflon filter (Fluoropore FP-500-100, 80 φ, Sumitomo Electric Fine Polymer Corp., Osaka, Japan) by controlling the flow rate. Prior to the measurement with the filters and devices described above, the sampling lines were cleaned by passing clean air into the line in the opposite direction of the flow path with an air gun cleaner.
The total metals, including the water-soluble and insoluble fractions, were measured via energy-dispersive X-ray fluorescence (XRF) (Epsilon 5, Malvern PANalytical Ltd., Malvern, UK) [40].
The experiments were repeated two or three times under full friction brake work conditions after the five bedding cycles in accord with the previous experimental conditions [6] so that the mass loss data could be compared. As described in Section 3.2.1, the emissions measured in a specific laboratory in this study were very small compared to the variability between laboratories. The number of tests was kept to a minimum with n = 2 experiments when conducting the experiments, which were 4-working-days-long, since conducting n = 3 experiments at that time would have taken 5 working days. The mass loss of the friction partners (pads and discs) was determined (mg), and the brake wear amount divided by the total experimental mileage (km) was derived to allow comparison with airborne particle emission factors. The mass loss of the friction partner was measured before and after an experiment in the laboratory at a temperature of 20 °C and relative humidity of 50%. For the mass loss measurements, we used an electronic balance for brake pads (XPR404SV, Mettler-Toledo International Inc., Columbus, OH, USA, resolution 0.0001 g), a mass comparator for brake discs (KA50–2, Mettler-Toledo International Inc., resolution 0.001 g), and a different mass comparator for brake discs over 10 kg (XPR10003SC, Mettler-Toledo International Inc., Columbus, OH, USA, resolution 0.01 g). The mass loss measurements were taken within 1 h after the experiment.

3. Results and Discussion

3.1. Brake Wear Factor Measurement

3.1.1. Storage Stability for Wear Weighting

The brake wear factor is an important measurement item because it is the starting point for brake wear particle emissions, and the brake wear itself can vary significantly. For example, the results of an interlaboratory study (ILS) of brake wear particle emissions showed a 50% variation (brake wear factors of 1.8–7.6 mg/km) among eight laboratories for the Brake1b [6]. In the GTR24 regulation [7], after the brake emission test is completed, the brake components are stored for up to 24 h in a room with controlled temperature and humidity, cooled below 30 °C, and weighed. We confirmed the storage stability of the pads in experiments 4, 6, 8, 10, and 12. Figure 1 shows the pad mass differences and the ratio of pad mass differences to mass loss measured within one hour after the test at various storage times. In experiments 4, 6, 8, 10, and 12, the mass difference increased from 0.2048 to 0.5783 g (Figure 1a), and the ratio of mass difference to mass loss increased from 16.2% to 51.2% (Figure 1b) at 24 h. The change in pad mass was suggested to be due to the adsorption of gases and the oxidation and rusting of the pad material because pads generally have a porous structure that is filled with various materials, compressed and formed, and sintered. In order to reproducibly measure the mass loss of the pad, it is recommended that the measurement be performed within one hour after the test and with the brake temperature below 30 °C.

3.1.2. Brake Wear Factors

The disc and brake pad wear amount (i.e., mass loss [6,7]) can provide valuable information for the experimental evaluation of the reasonableness of the particulate matter measurements in this study. Figure 2 shows the wear factor of the pad and disc for each experiment and the percentage contribution of the disc in the wear factor.
Mass loss measurements are known to be highly variable depending on the type of experimental brake. The results of the ILS with six different low-steel pads and a conventional cast iron disc brake assembly showed total brake wear factors ranging from 5.02 to 20.1 mg/km [6]. In a study comparing brake friction materials, the wear factor was 3.06 mg/km for non-steel pads and 5.12 mg/km for low-steel pads, depending on the pad material [7,21,22,23,24,25,26,27,28,29]. These brake wear factors [mg/km] were calculated by the authors as the ratio of PM10 to mass loss from ILS data [6]. Other studies using brake assemblies with low-steel pads and conventional cast iron discs, carbon composite discs, and hard-coated discs obtained brake wear factors of 3.23–24.5 mg/km [26]. In this study (Figure 2), we obtained total brake wear factors of 0.6–21.8 mg/km using the genuine brake assemblies of commercial vehicles having test vehicle masses of 943–3390 kg, including non-steel and low-steel pads. Brake wear factors per brake were 0.6–10.2 mg/km for non-steel pads and 13.8–21.8 mg/km for low-steel pads. Non-steel pads were developed to optimize comfort (reduction of noise and rim contamination), and this study (Figure 2) as well as previous studies [6,21,22,23,24,25,26,27,28,29] have shown higher emissions with low-steel pads than with non-steel pads.
The above comparison of brake wear factors in each experiment is based on different brake assemblies and masses of test vehicles. Low-steel pads had a higher brake wear factor than the non-steel pads in our experiments. Low-steel pads are used in Europe, especially in Germany, where the high demands on the braking performance and temperature stability of the friction system require somewhat more aggressive brake pads but have, at the same time, correspondingly higher wear [26,27]. Although the results of this study and those of previous studies based on the WLTP Brake Cycle were in the same range, one study found that the brake wear factors of non-steel and low-steel pads are almost the same [26]. Therefore, additional systematic studies are needed to clarify whether there are significant differences in brake wear factors between non-steel and low-steel pads.
Brake wear particles are generated by pad and disc wear or by the evaporation or thermal decomposition of pad components [41]. To understand the emission factors of brake wear particles, we compared the wear coefficients of the pads and discs. About 14.0–74.8% of the wear particles were from the disc, 14.0–64.4% from the non-steel pads, and 55.0–74.8% from the low-steel pads. We found that the disc wear factor and pad wear factor were correlated with the total brake wear factor (Figure 3). Low-steel pads tended to have higher disc wear factors, and non-steel pads tended to have lower disc wear factors. Although the disc and pad wear factors are not necessarily constant, assuming that the slopes of the respective linear regression lines shown in Figure 3 represent the statistical mean of our experiments, we found that the disc wear factor and pad wear factor contributed 64.8% and 35.2%, respectively, to the brake wear factor. A typical characteristic of friction pairs of low steel pads and discs is that disc wear is reported to be higher and often accounts for about 60% or more of the total wear [26]. Therefore, the results obtained in this study reflect the typical characteristics of the friction pairing of low-steel pads and discs.

3.2. Particle Mass Measurement

3.2.1. Storage Stability for Particle Mass Weighing

Figure 4 shows the storage stability of PM10 and PM2.5 collected on filter media during experiments 13–18. Day 0 was weighed within 1 h after the test, Day 1 was measured 24 ± 1 h after the test, and Day 2 was measured 48 ± 1 h after the test. The samples were stored in a HEPA-filtered electronic balance chamber at 22 ± 2 °C and 45 ± 8% RH before weighing. The GTR24 test regulation [7] allows filters to remain in the test chamber for an extended period of time as long as the filter remains sealed in the filter holder and the conditions in the test chamber are stable within the same temperature and relative humidity conditions noted above. In our experiments, the filter media stored in the weighing chamber were observed to vary within 48 h, with a relative standard deviation (RSD) of 0.11–0.28% for PM10 (Figure 4a) and 0.14–0.32% for PM2.5 (Figure 4b). The RSD tended to increase when the particle mass on the filter media was small (Figure 4c). The variability in the emission factor measurements for experiments 13–18 ranged from an RSD of 1.1–3.2% for PM10 to 1.3–7.1% for PM2.5, with a tendency for the variability to increase as the emission factor decreased. Compared to the PM10 emission factor data from ILS [6], which used the same brake assembly, there was a general trend toward greater emission variability with lower emission factors, although that included between-test variation in the measurement device.

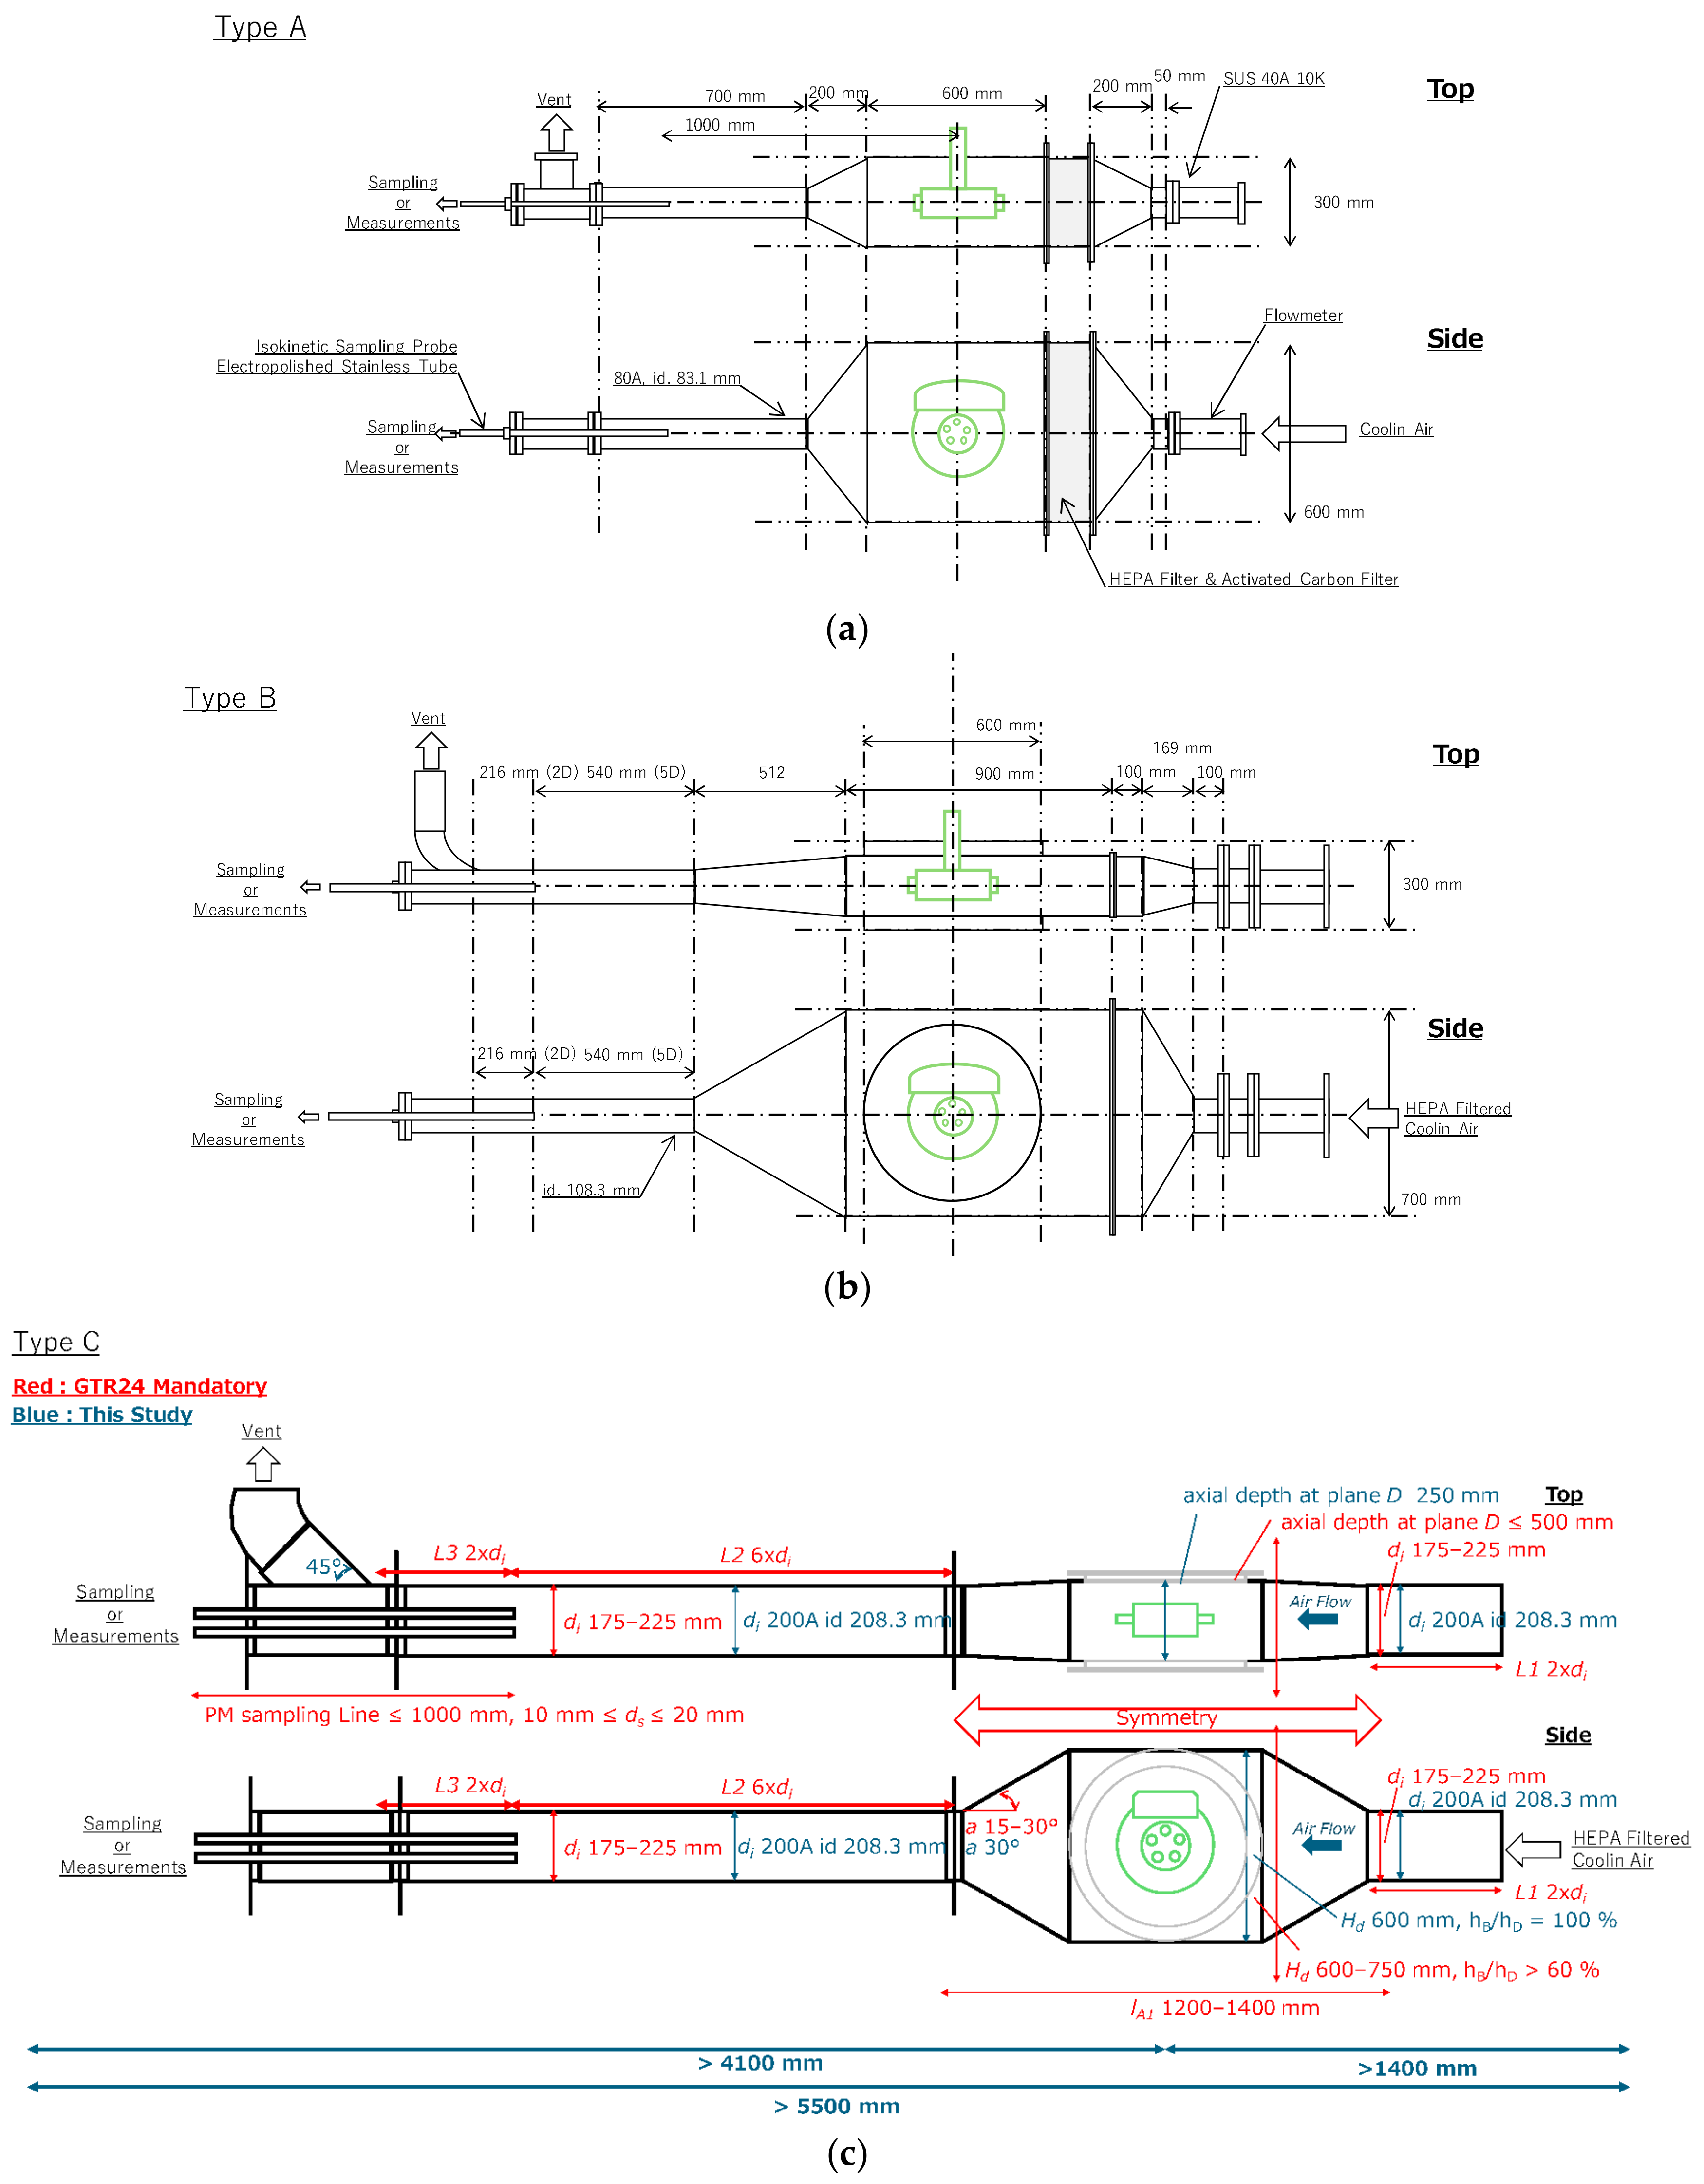
3.2.2. Collection Device for Particle Mass Measurement

It is important to understand the distribution of emitted particle sizes, both from the perspective of emissions to the atmosphere and from the perspective of health effects. In previous investigations, emissions of brake wear particles according to aerodynamic particle size by LPI were distributed between 2 and 3 μm in mode diameter [36,37]. This means that there is uncertainty in the measurement of PM2.5 because the separation characteristic curve is sharper when measuring PM2.5. In this study, PM2.5 was measured using a GTR24-based PM10 cyclone and a sharp-cut cyclone with an impactor that is rated as a method equivalent to the WINDS impactor in PM2.5 separation characteristics [26,39].
The emissions of brake wear particle masses were determined according to their aerodynamic particle diameters measured with an LPI (Figure 5). Generally, the height of each particle size interval is affected by the width of that interval, and the result is a distortion of the shape of the fraction. We therefore used a histogram in Figure 5, in which the particle mass of each fraction was divided by the width of that fraction (dM/dlogDp), and the particle size distribution was normalized by the particle size intervals [42]. However, because the height of each particle size fraction was expressed as the emission factor of the particle mass measured in each fraction, the vertical axis of the graph was used as dM. The brake wear particle emissions were distributed in a mode diameter range of 2–4 μm throughout the WLTP Brake Cycle. Although the individual experimental results cannot be distinguished from the particle size distribution shown in Figure 5, we found through our experiments that the emission factor and cumulative distribution with respect to particle size varied widely. Furthermore, because the brake particles observed in this study are distributed around the peak particle size (2.5 μm; dashed vertical lines in Figure 5), further investigation referring to the accuracy of PM2.5 measurement may be necessary. The ratios of emissions of fine particles (PM2.0 based on LPI specifications) and nanoparticles (PM0.12 based on LPI specifications) to PM11 based on LPI specifications were 31.2% (12.8 to 43.3%, n = 21) for non-steel pads of PM2.0, 21.3% (11.1 to 28.3%, n = 21) for low-steel pads of PM2.0, 31.2% (11.1 to 43.3%, n = 7) for non-steel pads of PM0.12, and 0.4% (0.1 to 0.7%, n = 7) for low-steel pads of PM0.12. For the brake assemblies investigated in this study, the contribution of fine and nanoparticles to the total PM emissions was small, which is consistent with results from previous studies [29,35,36,37].
On the other hand, for particle collection using multistage impactors (e.g., 13 stages for the LPI in this study), it has been reported that 14% particles are deposited on the walls of the device, and the relative loss has an error of 50%, depending on the production lot of the impactor [43]. Figure 6 shows the emission factors for PM10 and PM11 (experiments 1–28) (Figure 6a), PM2.5 and PM2 (experiments 1–28) (Figure 6b), cyclone and MCI for PM10 (experiments 13–18) (Figure 6c), and cyclone (experiments 13–15) and MCI (experiments 20–22) for PM2.5 (Figure 6d). Previous studies have indicated that the LPI, a multistage impactor, tends to detect lower particle loss [43], and assuming that the slope of the regression line that crosses the origin is the mean value, the loss was estimated to be 22.9% for PM10 and 37.4% for PM2.5. Due to the slight variation in the 50% cut diameter characteristics for PM2.5, we expected a larger error in the measurement of brake particles with mode diameters between 2 and 3 μm for the aerodynamic diameters shown in Figure 5a. For the comparison of MCI by the JASO C470 method and cyclone by the GTR24 method, the difference was 1.9% for PM10 and 1.8% for PM2.5 (estimated from the regression line). There was no significant difference between these two measurement methods, especially for PM10, which is proposed as a regulation value in Euro 7 [9].
The above findings indicate that the differences in the measured PM10 emission factors can be considered equivalent unless a multistage impactor is used. PM10 and brake wear factors will be discussed in subsequent sections, including comparisons with emission factors and mass loss.

3.2.3. Cooling Air Flow Effect for Particle Mass Emissions

The emission factors of PM10 and PM2.5 were similar with the increase in the cooling air flow (from 1 m3/min to 10 m3/min, Figure 7a,b); the regression lines cross the origin point from the measurement principle (PM10: R2 = 0.965, r = 0.924, p < 0.05, n = 5; PM2.5: R2 = 0.988, r = 0.961, p < 0.05, n = 5). Because the regression lines cross the origin, R2 was treated as a similarity index, not as a coefficient of determination. There was no significant difference in the emission factors between the two conditions using the JASO C470 sampling systems (Enclosure/Tunnel Type A) [8]. We estimated the difference due to cooling air flow to be about 8.1% for PM10 based on the slope of the linear regression line, with a similarity R2 of 0.981 (r = 0.65, p < 0.1, n = 5) when comparing the two cooling flow rates of 1 m3/min and 10 m3/min. In a previous study, there was also no significant difference in the PM2.5 to PM10 ratio when the cooling flow rate was increased from 15 m3/min to 20 m3/min [44]. Therefore, the current results were consistent with those of previous studies, and the PM10 and PM2.5 emissions were reproduced under very low air flow conditions (1 m3/min) using the JASO C470 method and under high air flow conditions (10 m3/min) equivalent to those of the GTR24 method. On the other hand, our observed PM0.12 under high air flow conditions (10 m3/min) tended to be 12.2 times higher than those under low air flow conditions (1 m3/min) (R2 = 0.965, r = 0.065 p < 0.5, n = 5) in Figure 7c. There was no significant difference in the ratio of PM2.5 to PM10 as the flow rate increased (Figure 8a), but the ratio of PM0.12 to PM10 increased by 14.7 times from a flow rate of 1 m3/min to 10 m3/min (Figure 8b). PM0.12 emissions, known as ultrafine particles, contributed only a small fraction of PM10 emissions in our study, in the range of 0.1–28% (3% on average, n = 28). These small particles (particle size of less than 0.12 μm) may be agglomerated into larger coarse particles and emitted less (i.e., ultrafine particles will be counted among coarse particles).
Figure 9a shows that the increase in cooling air flow rate clearly implies a higher PM10 to total wear ratio. The slope of the regression line of the two variables across the origin associated with the measurement principle shows that the brake wear factor increases by a factor of 2.03 for PM10 (Figure 9a), 1.99 for PM2.5 (Figure 9b), and 23.2 for PM0.12 (Figure 9c) with higher cooling air flow rates. The difference between the PM10 (2.03) and PM2.5 (1.99) emission factors of the two experiments indicates the uncertainty of the experiments. The decrease in losses in the tunnel by decreasing the Stokes number (increasing the collection efficiency, as shown in the PM to brake wear factors in Figure 9a) with the increase in the cooling air flow rate should have a strong impact, indicating the uncertainty of the experiment [44]. The extremely low cooling air flow rate (1 m3/min) in the JASO C470 method used in this study is a limitation of the structural requirements for future tests using automobiles, and it has been used in previous studies to collect sample air at 0.1–0.3 m3/min [45], 0.5–1.3 m3/min [46], and 1.48 m3/min [47]. As described above, there is a trade-off between the reproducibility when the sample to be measured is diluted by increasing the cooling air flow rate and the reproducibility when the concentration is lowered (as shown in Figure 5a,b), in order to study the health effects and reproducibility of ultrafine particle measurement without mass contribution focusing on ultrafine particles in the future investigation. For reference, experiments 23 and 27 (plotted in Figure 6, Figure 7, Figure 8 and Figure 9) were compared under high flow (7.7 m3/min) measurement conditions with different sampling methods using the same brake assembly for experiments 4 and 12, respectively (but different production lots). The regression lines were generally consistent with the low flow rate (1 m3/min) and high flow rate (10 m3/min) using the JASO C470 enclosure, and the plots for experiments 23 and 27 were observed to be higher than the regression lines for PM10 only. As shown in Figure 7d, the brake wear factor was higher at lower cooling air flow rates (1 m3/min), while it was 58.3% lower than the slope of the regression line at higher cooling air flow rates, indicating that the increased sampling efficiency resulted in PM10 and PM2.5 emissions being similar in the GTR24 procedure as a result of improved sampling efficiency. GTR24 defines brake temperature, but the flow rate is not defined at a constant value. Therefore, when designing brakes considering the total brake wear rate, manufacturers should be careful to note that the brake wear factor varies with the tunnel flow rate being measured.

3.3. Comparison of Particle Mass Emissions and Brake Wear Factors

3.3.1. Particle Mass Emissions and Effect of Test Vehicle Mass

The emissions per brake (single axle) ranged from 0.14 to 13.1 mg/km for PM10 (non-steel pads: 0.14–4.2 mg/km, low-steel pads: 5.4–13.1 mg/km), from 0.08 to 3.9 mg/km for PM2.5 (non-steel pads: 0.08–1.1 mg/km, low-steel pads: 1.1–3.9 mg/km), and from 0.002 to 0.04 mg/km for PM0.12 (non-steel pads: 0.002–0.04 mg/km, low-steel pads: 0.007–0.04 mg/km). A comprehensive literature review of the current status of passenger car brake wear particle emissions showed that, for conventional cast iron disc brakes, emissions ranged from 0.1 to 12.4 mg/km for PM10 (non-steel pads: 0.1–3.9 mg/km, low-steel pads: 1.3–12.4 mg/km) and from 0.05 to 6 mg/km for PM2.5 (non-steel pads: 0.05–2.2 mg/km, low-steel pads: 0.8–6 mg/km) [24]. An estimation based on a regression line between vehicle mass and PM10 emissions for the 35 cases provided by OICA (Organisation Internationale des Constructeurs d’Automobiles) yielded 3 mg/km per brake per 1000 kg of vehicle mass, which is similar to the value obtained from the 62 cases in the literature review on ECE brake assemblies (3.1 mg/km per brake per 1000 kg of vehicle) [24]. This study followed the practice of previous studies, e.g., [24], and compared emissions with test vehicle mass. Using the slope of the regression line through the origin between vehicle mass and PM10 emissions in Figure 10b, the low-steel pads (nine cases) had a PM10 emission of 3.9 mg/km per brake per 1000 kg of vehicle mass, with a large variance, as was also found in a previous study [24]. Non-steel pads (22 cases) had a PM10 emission of 0.4 mg/km per brake per 1000 kg of vehicle mass. The results are in reasonable agreement with those in the literature, and they also vary widely depending on the wear characteristics of the pads.
The brake wear factor for low-steel pads (9 cases) was 7.7 mg/km per brake per 1000 kg of vehicle mass with large variability, and that for non-steel pads (22 cases), it was 1.7 mg/km per brake per 1000 kg of vehicle mass. The PM2.5 was 1.2 mg/km per brake per 1000 kg of vehicle mass for low-steel pads (9 cases) and 0.15 mg/km per brake per 1000 kg of vehicle mass for non-steel pads (22 cases). Finally, the PM0.12, which has not been previously reported, was 0.012 mg/km per brake per 1000 kg of vehicle mass for low-steel pads (7 cases) and 0.0073 mg/km for non-steel pads (22 cases) (0.0097 mg/km, excluding the lower cooling air flow rate of 1 m3/min).
In braking, deceleration is caused when a brake pad is pressed against a rotating disc to cause friction. The brake pad absorbs kinetic energy, thereby causing deceleration (or a complete stop) by abrading the friction material on its surface. Because kinetic energy is described as a function of mass and speed, the greater the vehicle mass, the more kinetic energy the brake absorbs, the more mass the brake wears, and consequently, the more brake wear particles are emitted into the atmosphere. When a brake wears, the friction material of the brake pad melts onto the surface of the disc, forming a transfer film with a thickness ranging from several 10s to 100 μm. This transfer film is said to prevent disc wear and keep the coefficient of friction constant. On the pad side, on the other hand, adhesive wear occurs when a portion of the friction material adheres to the disc surface, and abrasive wear occurs when the transfer layer is scraped off by the abrasive contained in the friction material itself. As a result of the different mechanisms of adsorption and wear, the increase in kinetic energy associated with the increase in vehicle mass increases the wear mass due to abrasive wear, contributing to the mass of PM10 and PM2.5 emitted. In the mechanism whereby the gases generated during the formation of the adsorption layer condense to form fine particles, the increase in kinetic energy resulting from an increase in vehicle mass is expected to increase the amount of condensable gases generated with the increase in the brake temperature, while also promoting the formation of the adsorption layer. Therefore, PM0.12 is expected to be composed of gas generation, transfer film detachment, and carbon components associated with these two processes, as well as sulfate ions in the nucleus mode diameter, with no general correlation to vehicle mass.

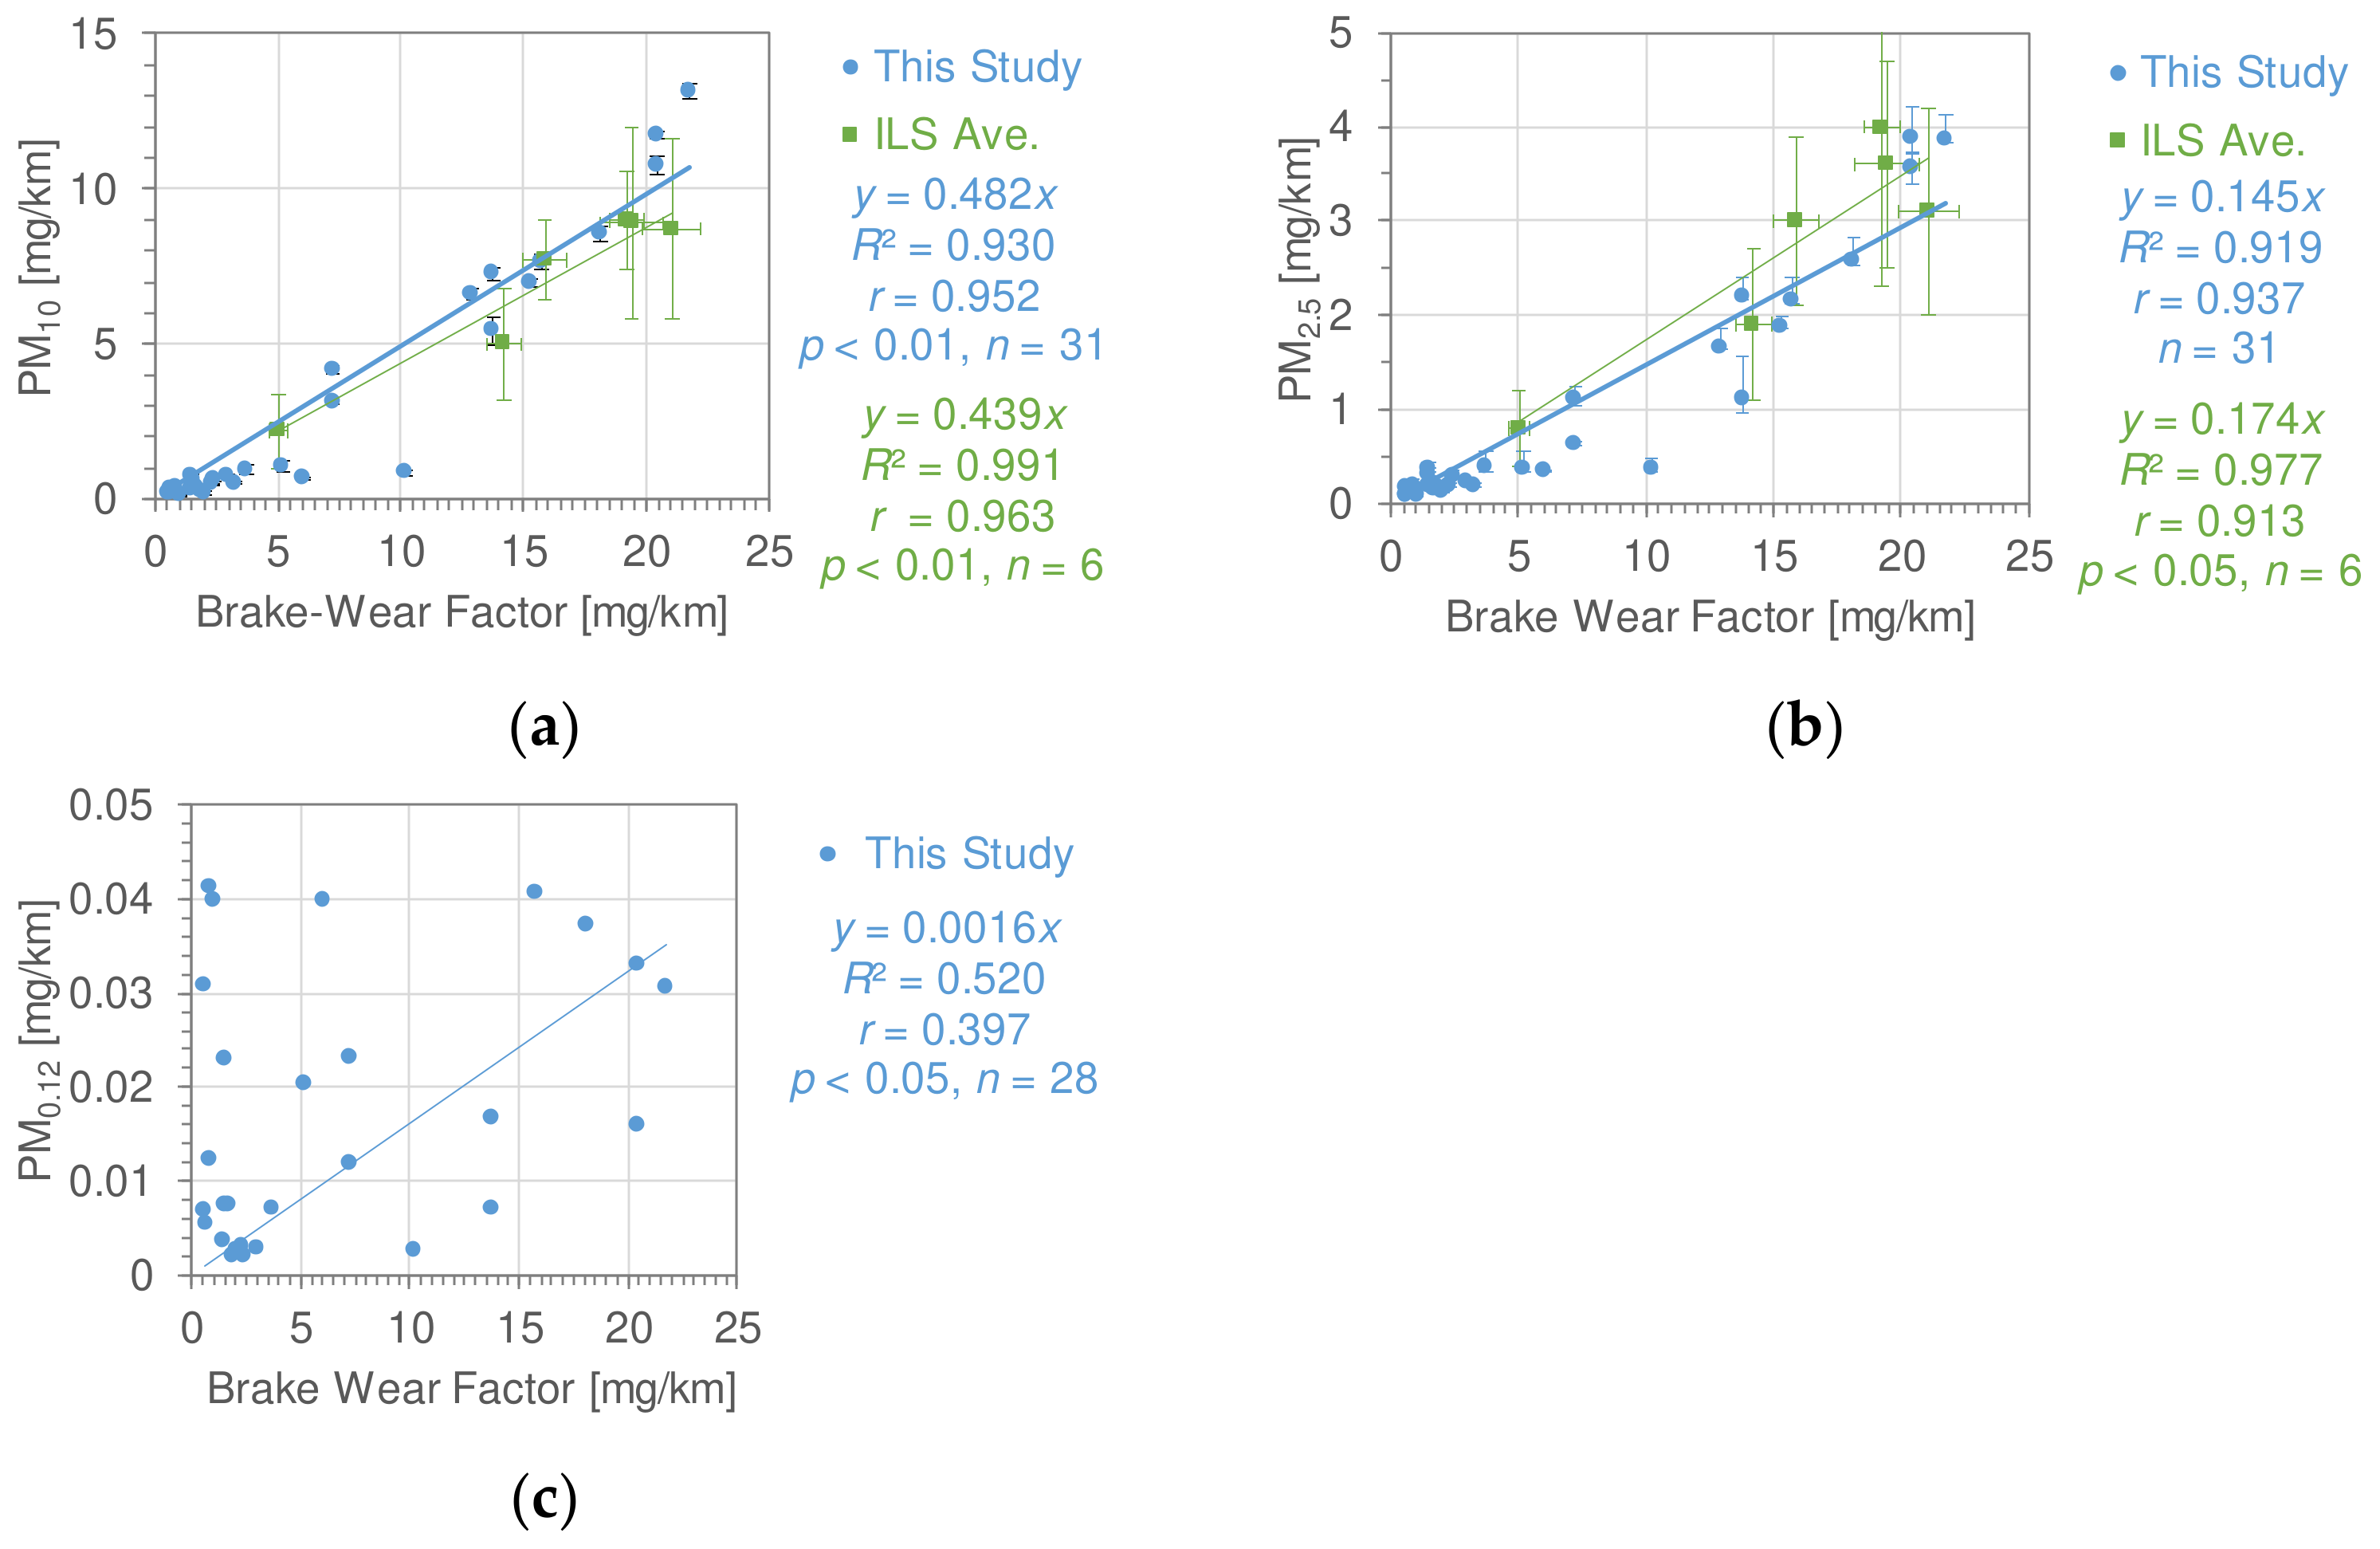
3.3.2. Particle Mass Emissions Correlated with Brake Wear Factors

The investigation of brake wear factors and wear particle emissions behavior in the WLTP Brake Cycle, as defined by actual vehicle driving, is currently the focus of much research. It is known that there is a large variation in the amount of wear, depending on the environment of each research facility (i.e., the dynamometer); in ILS, the variation in the eight laboratories for Brake1b has been shown to have an RSD of 50% [6]. Therefore, this study compared the correlation between brake wear and the emission factors of wear particles in the WLTP Brake Cycle, as defined by the actual vehicle driving, measured at a single laboratory.
The PM10 and PM2.5 emissions for the brake wear factors are shown in Figure 11a,b. As in Section 3.2.3, because the regression lines cross the origin, R2 is treated as a similarity index rather than as a coefficient of determination. In terms of the average of laboratories using different sampling systems in ILS (ILS Ave. in Figure 11), the R2 values are 0.991 for PM10 and 0.977 for PM2.5. If we consider the regression lines that cross the origin as the ratio of PM10 to the brake wear factor and the ratio of PM2.5 to the brake wear factor, respectively, the results are 48.2% for the PM10 ratio (as the regression slope in Figure 11a) and 43.9% for ILS, and 14.5% for the PM2.5 ratio (as the regression slope in Figure 11b) and 17.4% for ILS. Therefore, our results are roughly consistent with the ILS, indicating that PM10 and PM2.5 emissions are generally reproduced, regardless of whether the data include very low air-flow conditions (1 m3/min) using the JASO C470 method or high air-flow conditions (10 m3/min) equivalent to the GTR24 method.
However, as shown in Figure 9, the systematic error of the measurement method becomes apparent when comparing the effect of cooling air flow rate with non-steel pad experiments, and the results obtained in Figure 11 should be interpreted with caution, as the high level of brake wear factor and emission values obtained with ILS drive the statistics. Previous studies [35,36,37] have mentioned that not all of the brake wear is emitted as airborne brake wear particles, but a previous study [6] and our present results provide stronger evidence.
Figure 11c shows a comparison of the brake wear factor and PM0.12 (R2 = 0.520). As shown in Figure 7c, Figure 8b and Figure 9c, the large differences in cooling air flow rates led to large variations in PM0.12 emissions, even when the same sampling construction requirements were satisfied (e.g., the enclosure and tunnel based on JASO C470 method in this study). The GTR24 method establishes a brake temperature criterion and adjusts the cooling air flow rate [6], but differences in the cooling flow rate may contribute to the variation in ultrafine particle emissions that do not contribute to mass emissions. A further investigation of the correlation between PN emissions and PM0.12, as well as the continued investigation of the effects of PN emissions and wind speeds, is needed. For PN emissions, the emissions of brake wear particles are low, and no regulation values have been established. In addition, the Solid-PN (with volatile particles removed) and Total-PN (including volatile particles) measurement methods were first proposed in GTR24. A comprehensive study with a large number of samples is needed.

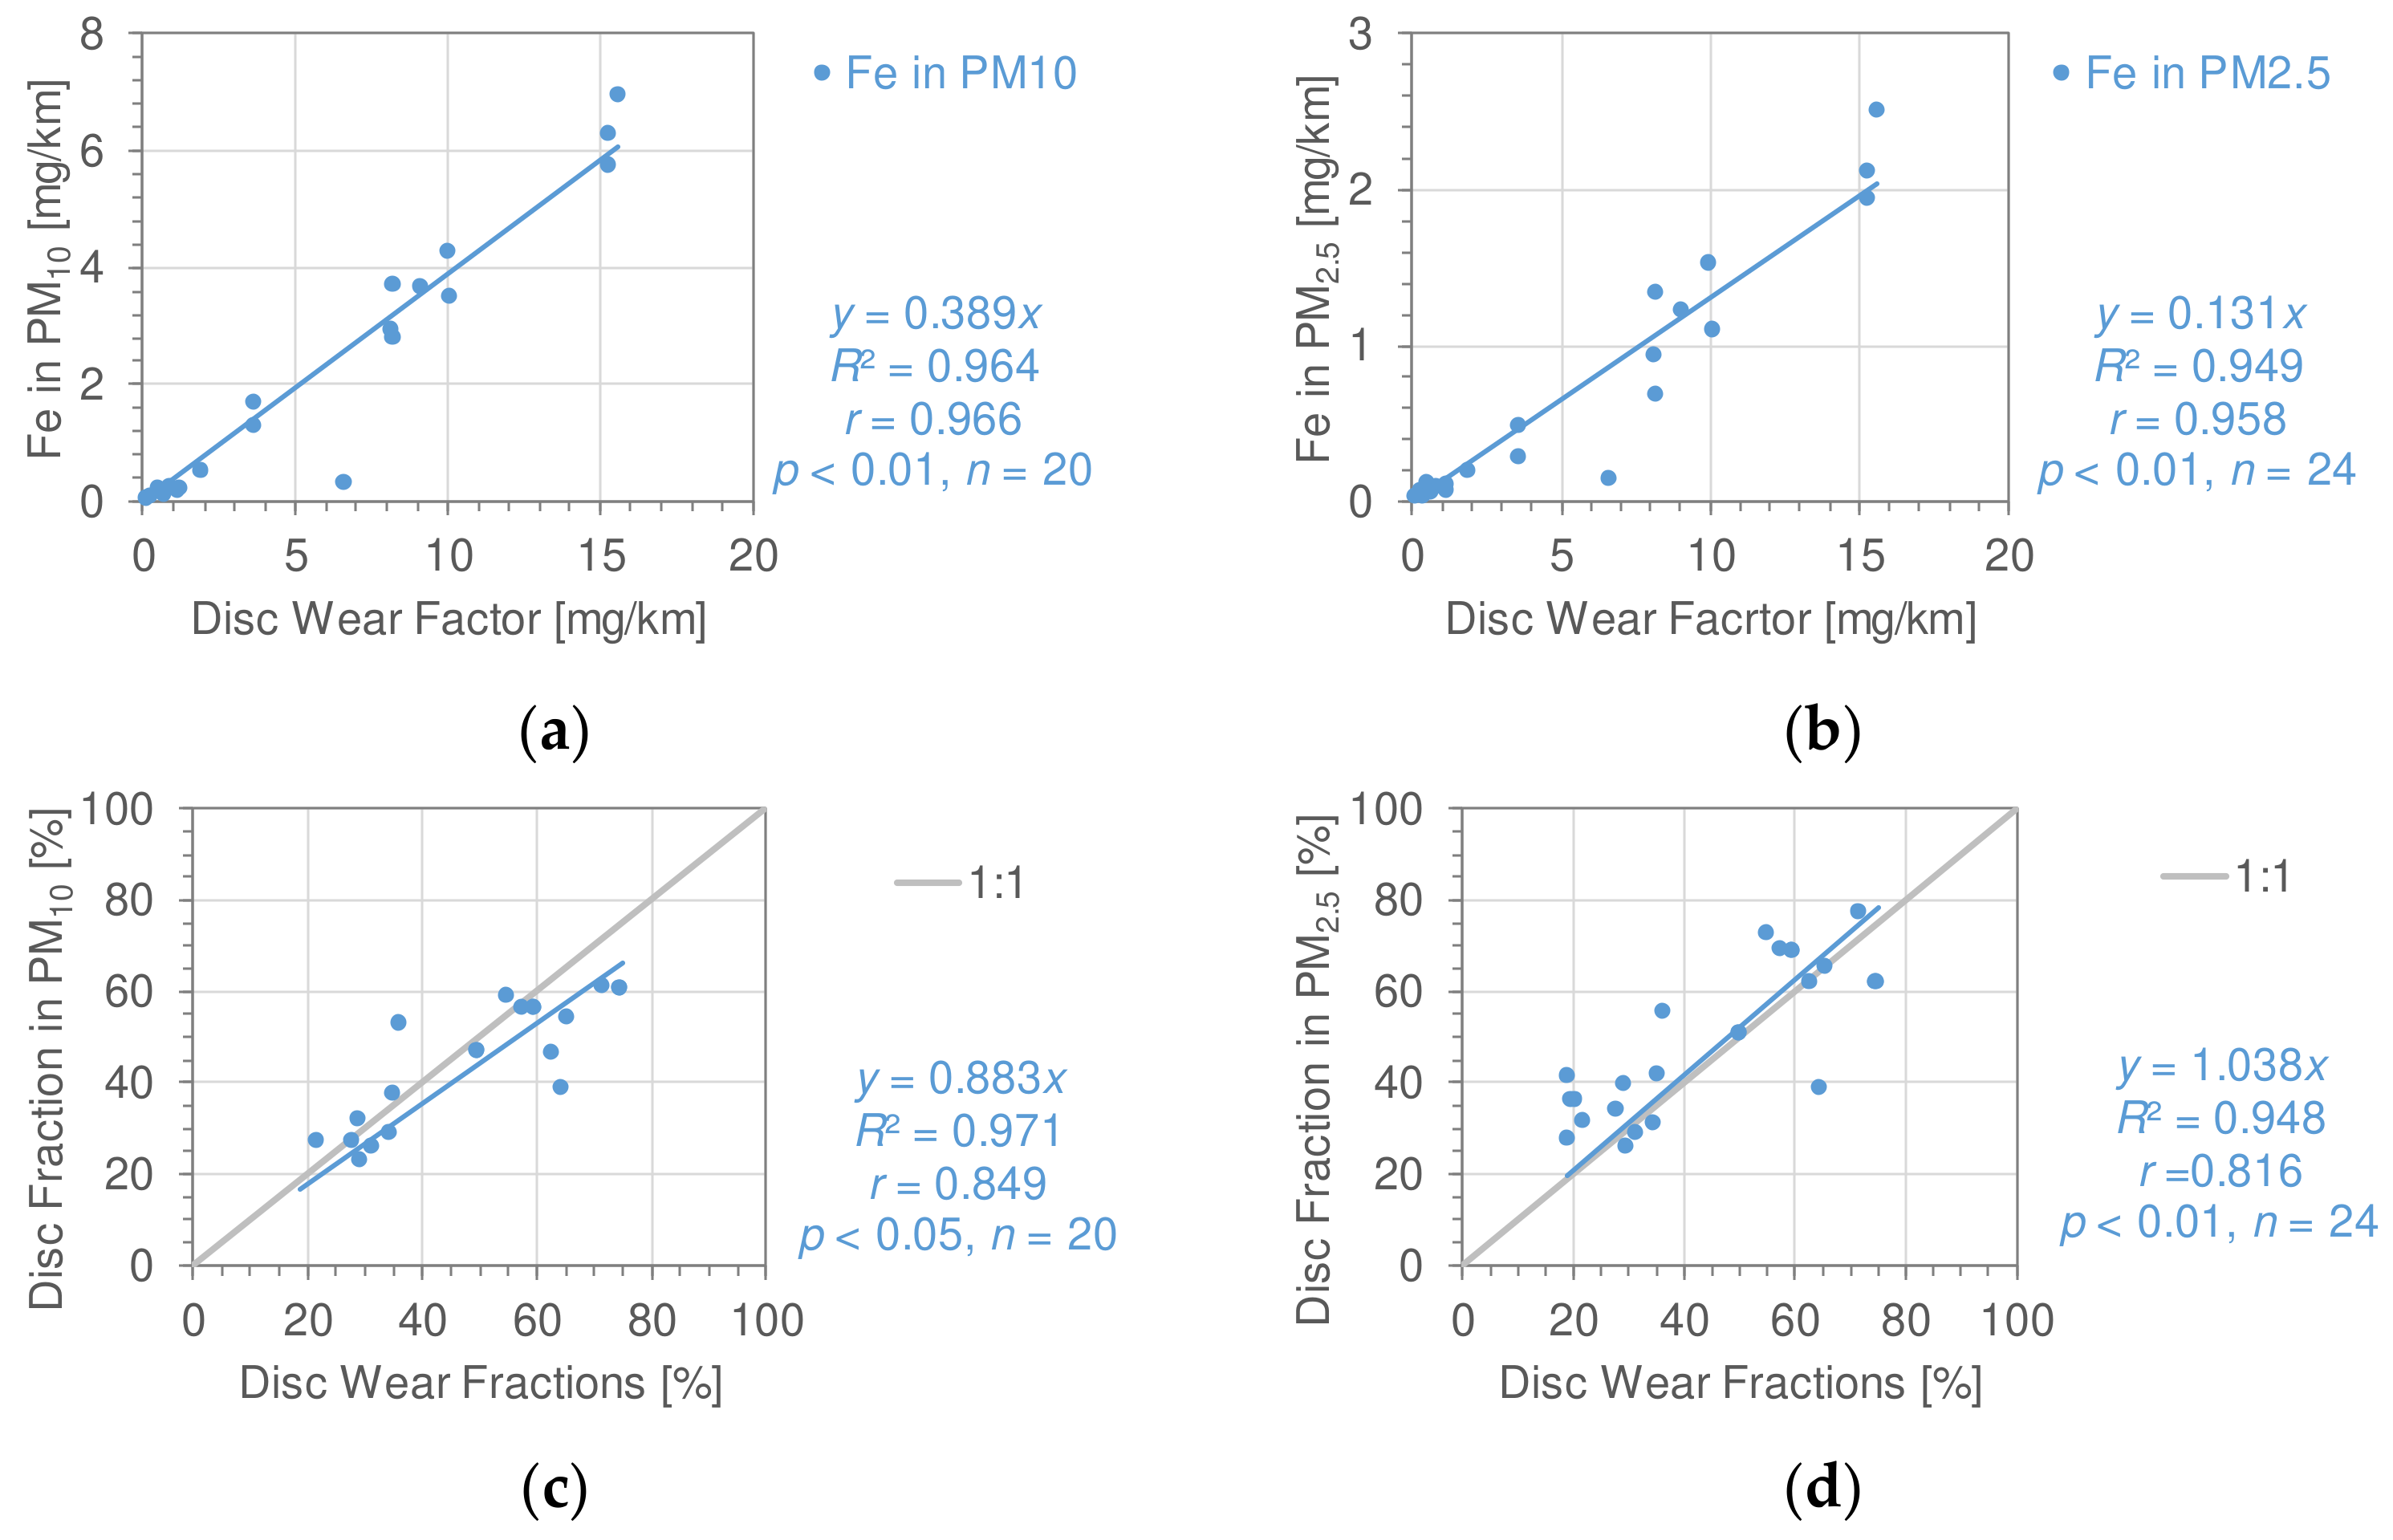
3.3.3. Disc Wear Contribution to Particle Mass Emissions

Cast iron discs are composed mainly of iron and tiny amounts of additive metals. Previous studies have shown that, when the disc is worn by the pad, wear particles (PM10 and PM2.5) are emitted, e.g., [36]. They also indicated that the contribution of Fe tends to increase from the pad wear to brake wear particles, and Fe is most abundant in PM10 and PM2.5 for brake wear particles [35,36,37]. As shown in Figure 12a,b, the emission factor of brake wear Fe particles and the disc wear factor are positively correlated with PM10 (Figure 12a) and PM2.5 (Figure 12b). Hence, we attempted to estimate the proportion of disc wear-derived emission factors by using the brake wear Fe particle emission factors.
The PM originating from disc wear (PMdisc) and pad wear (PMpad) can be distinguished from the PMx, where x equals 2.5 or 10, by solving simultaneous Equations (1) and (2), which, respectively, express the PM and Fe mass balance [35,36,37,48]:
PMdisc + PMpad = PMx,
[Fe]disc × PMdisc + [Fe]pad × PMpad = [Fe]PMx × PMx,
where PMx is PM10 or PM2.5 emissions, [Fe]disc is the Fe mass concentration (%) in the disc, and [Fe]pad is the Fe mass concentration (%) in the pad.
In previous studies [35,36,37,48], the Fe mass concentration (%) in the disc was fixed at 100%. In another study, the discs of gray cast iron brakes were measured to be composed of Fe as the dominant element (>95%), with only a few other elements (<1% for individual metals) [49]. However, as hand-held energy-dispersive XRF devices cannot measure elements such as C, N, O, and S [49], we considered that a >95% Fe content was an overestimation based on our WD-XRF measurements, which included C, N, O, and S. Cast iron generally contains iron as the main component, with C, Si, Mn, P, and S as the other major elements, and other trace components as graphitization promoters, graphitization inhibitors, graphite eutectic refinement agents, graphite coarsening agents, and perlite stabilizers [50]. Therefore, in this study, we performed the WD-XRF measurements on the pads and used the respective values of 74.4–81.1% Fe (Table A3). The [Fe] pad results were 0.1–6.6% for non-steel pads and 7.3–10.3% for low-steel pads (Table A2). Although non-steel pads are generally declared to be iron-free [26,51], they may contain iron as a lubricant (as iron sulfide) and/or as an abrasive (iron oxide and chromium oxide), e.g., [15,16]. For this reason, no iron-free, non-steel pads were detected in the genuine non-steel pads used in the commercial vehicles in this study.
By solving Equations (1) and (2), we determined the contribution of the disc to the PMx (Fdisc [%]) from Equation (3):
Fdisc = PMdisc/PMx × 100 = ([Fe]PMx − [Fe]pad)/([Fe]disc − [Fe]pad) × 100.
A limitation of using Equations (1)–(3) is that the Fe contained in non-steel and low-steel pads may be transferred to a disc, but there has been no study of whether it can be transferred to materials other than cast iron discs. Further large-scale investigations with many types of pads and discs of different materials would be required to address this question.
Figure 12 shows a comparison of the disc fraction in PM10 (Figure 12c) and in PM2.5 (Figure 12d) against the disc mass loss fraction. We found that the disc fraction in PM determined from the Fe concentration and Equation (3) was positively correlated with the disc fraction determined from the mass loss measurement. As discussed in previous sections, the R2 values represent a similarity index, and values closer to 1 indicate a greater similarity. The correlation coefficients shown in Figure 12c,d were 0.953 (n = 20) for PM10 and 0.837 (n = 24) for PM2.5, indicating a positive correlation. The population numbers were different for PM10 and PM2.5 because, in some of the experiments where PM was measured by the MCI sampler, Fe was not measured by XRF because a Teflon-coated glass fiber filter was used. Although not all of the disc wear particles are emitted as PM10 or PM2.5, these results provide strong evidence that the iron concentration in PM measured in this study is comparable to the disc to brake wear ratio measured by mass loss [35,36,37,48].

3.4. Comparison of Elements in Brake Pads and Particulate Matter Emissions

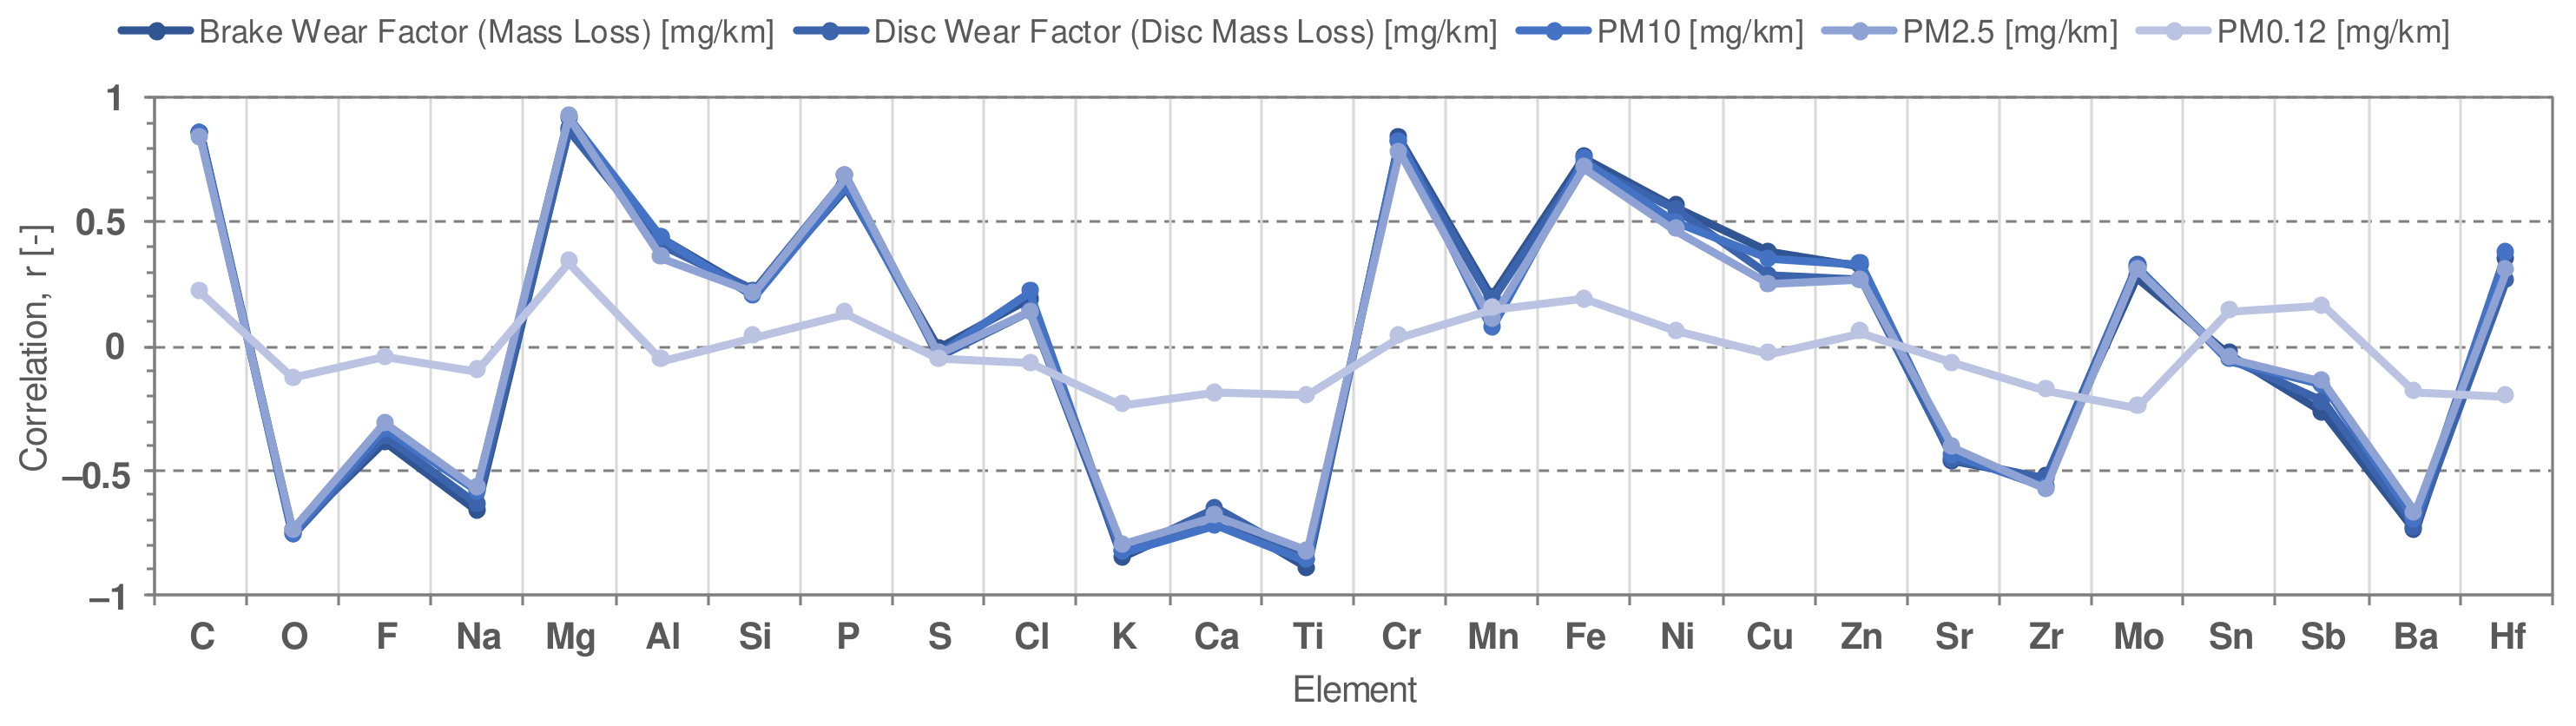
3.4.1. Correlation between Elements in Brake Pads and Particulate Matter Emissions
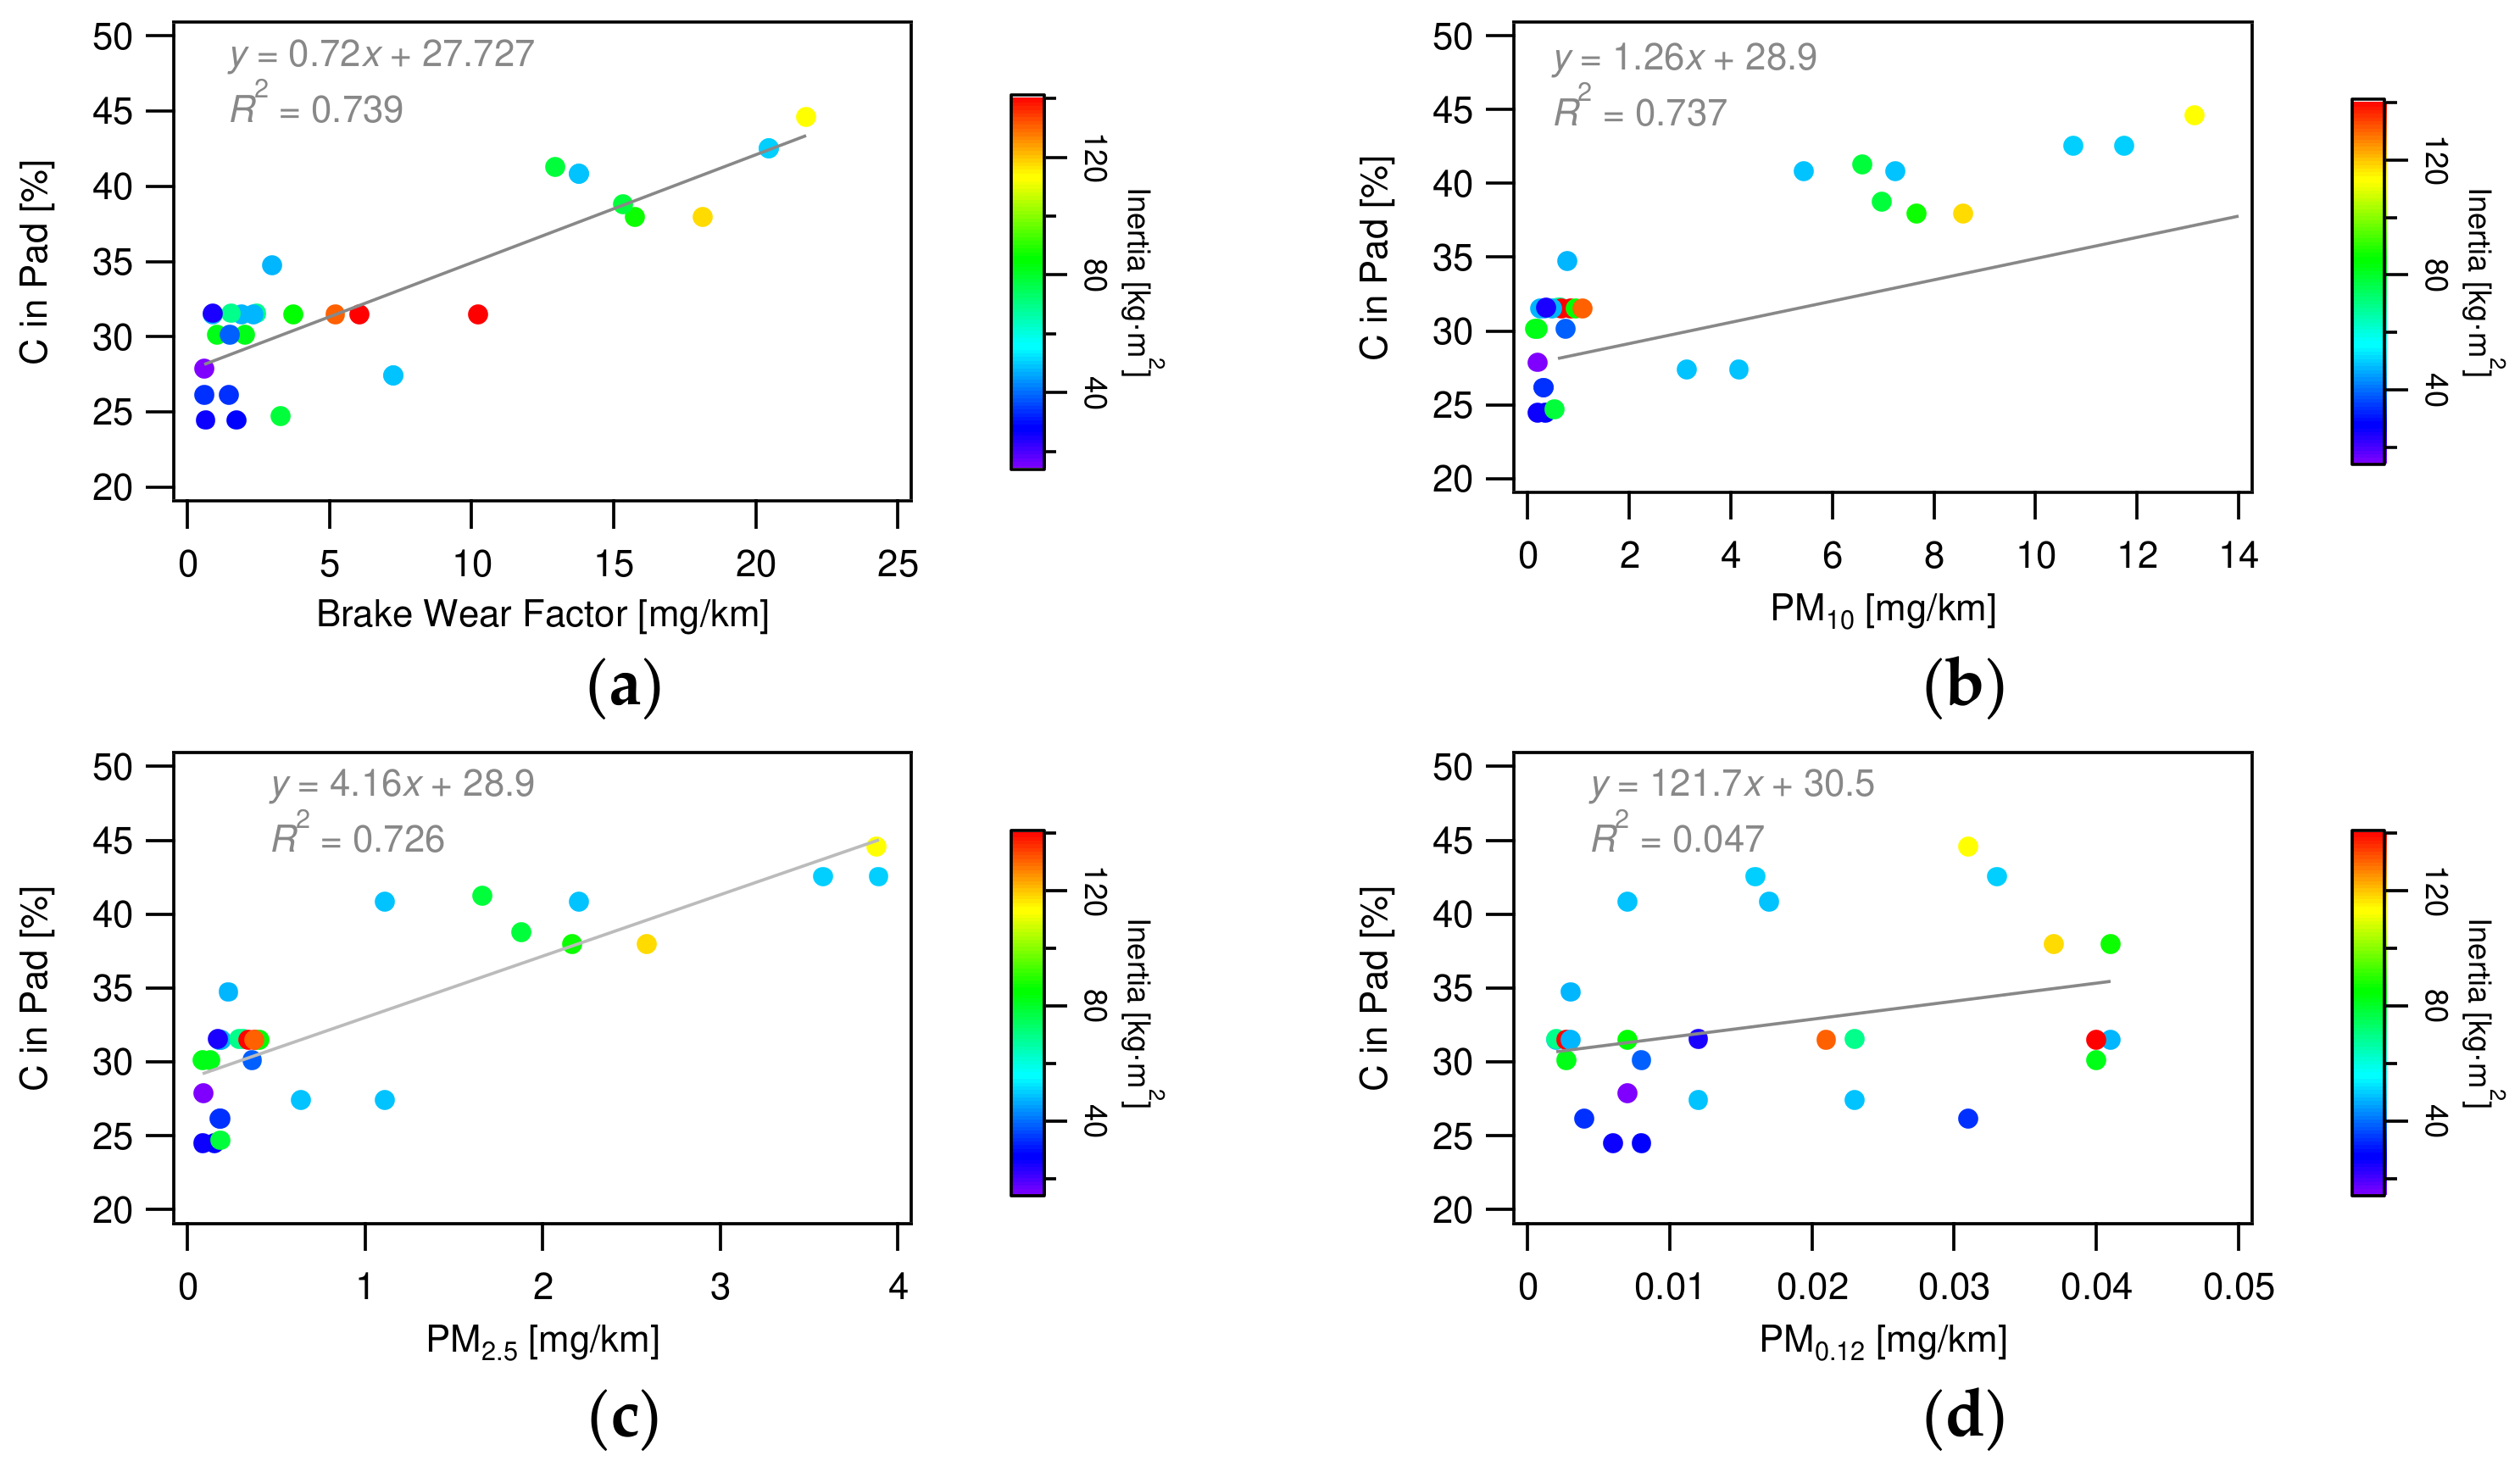
The effects of the different components of brake pads on brake emissions have been studied, mainly focusing on binder resins, fillers, and other components [15,16,17,18,19,20]. Low-steel type brake pads tend to produce more brake emissions than non-steel pads [21,22,23] because of their higher level of aggressiveness against gray iron discs. However, previous studies have either tested small pieces based on the intended material formulation or compared a limited sample of commercially available brake types. In this study, based on actual vehicle specifications for a commercial brake assembly and a medium sample size (31 cases), the mass content of elements in brake pads was correlated with the brake wear coefficient and PM10, PM2.5, and PM0.12 emissions to investigate the effects of various components in brake pads on brake emissions.
Figure 13 shows the correlation coefficients between the brake wear factor, disc wear factor, PM10, PM2.5, PM0.12, and the mass content of each element in the brake pad. The correlation coefficients of the mass content of elements in the pads for the brake wear factor, disc wear factor, PM10, and PM2.5 were very similar; C, Mg, Cr, and Fe mainly had high positive correlation coefficients, and O, K, Ti, and Ba mainly had high negative ones. PM0.12 had no apparent correlations (Figure 13), and further research would be needed to analyze the detailed properties of the materials, such as heat resistance.

3.4.2. Carbon

As shown in Figure 14, the mass content of C in the brake pads was positively correlated with the brake wear factor, disc wear factor, PM10, and PM2.5. Contour plots of inertia are also shown in the figure for reference to confirm that the correlations are not due to inertia. The C in brake pads is mainly in the phenolic resins, silicone-modified resin, and epoxy resins commonly used as binders in most braking systems, and the pads in this study contained 24.5–44.6% C. A binder, also known as a binding agent, is any material or substance that adheres or coheres to other materials in a composite system, preventing them from crumbling and ensuring the structural integrity of the brake pad composite. Binder resins are also used to reduce brake squeal and vibration. Their heat resistance is inferior to that of metals; for example, depending on the chemical modification (chemical structure or additives) of phenolic resins, the thermal weight loss at 400 °C varies from 8 to 25 mass% [52]. We suggested that the heat resistance varies depending on the structure of the phenolic resin, but the heat resistance of the materials in brake pad may contribute to brake wear and wear particle emissions, some of which are emitted as gaseous substances by mechanochemical reactions [33] and some by metal additives. Aramid fibers are included as C in the pad as a reinforcement that provides strength, thermal stability, and friction properties [15,16]. For reinforcement, the use of steel fibers instead of aramid fibers leads to a higher wear due to the accelerated plowing of the mating disc surface, while the addition of aramid fibers leads to relatively less wear of the strong transfer film formed on the disc as the aramid fibers wear [30,31]. In general, the greater the amount of aramid fibers, the better the wear resistance properties [30,31] and, consequently, the lower the particle emissions [32]. The addition of graphite particles has also been reported to improve wear properties [53,54]. Various friction phenomena, such as adhesive wear, abrasive wear, detachment of ingredients on transfer films, and generation and detachment of tribo-film, are caused at the interface of a pad and disc, and the interactions of these phenomena during braking is complicated [30]. The results of this study indicate that the degradation of the organic resin matrix and aramid fibers forms a transfer film that reduces wear. The actual brake wear and particle emissions are caused by the consumption of the organic resin matrix and aramid fibers, which form a transfer film, and by the detachment of the tribo-film due to adhesive wear [55], which is emitted as friction particles. This suggests that the C content in the pad may be correlated with the brake wear coefficient and PM, supporting the assumption [16] that a dynamic equilibrium between the breakdown of the transfer layer due to wear and the formation and restoration of the transfer film by the carbon in the pad occurs during braking.

3.4.3. Magnesium

As shown in Figure 15, the mass content of Mg in brake pads was positively correlated with the brake wear factor, disc wear factor, PM10, and PM2.5. The Mg in the brake pads is in the form of magnesium oxide (MgO), which is mainly contained as filler [3] and abrasives [56,57], and the pads in this study contained 0.2–7.3% Mg. Fillers are used to improve thermal and noise pad properties and to reduce manufacturing costs [58]. Magnesium oxide is added to adjust the coefficient of friction, and its hardness reduces metal wear while properly conducting heat from the friction contact surface. MgO also increases the thermal stability of phenolic resins and the fade resistance of friction materials, and it suppresses low-frequency noise [57]. Its high level of refractoriness contributes to long life in friction applications with high braking temperatures and is helpful in maintaining suitable friction (gripping force). In previous studies, small test pieces with metal oxides added to a phenolic resin-based friction material were tested for wear, and MgO was found to have the lowest wear amount [33,57,59]. In contrast to the above findings, our results show positive correlations between the Mg content in the pads and the total brake wear rate, disc wear rate, PM10, and PM2.5. The previous findings were generally based on the results using test pieces, and tests based on commercial brake pads and actual driving conditions with a wide range of different inertias (as in this study) are more complex. Under these conditions, the Mg-derived material in the pads may have had an unintended abrasive effect.

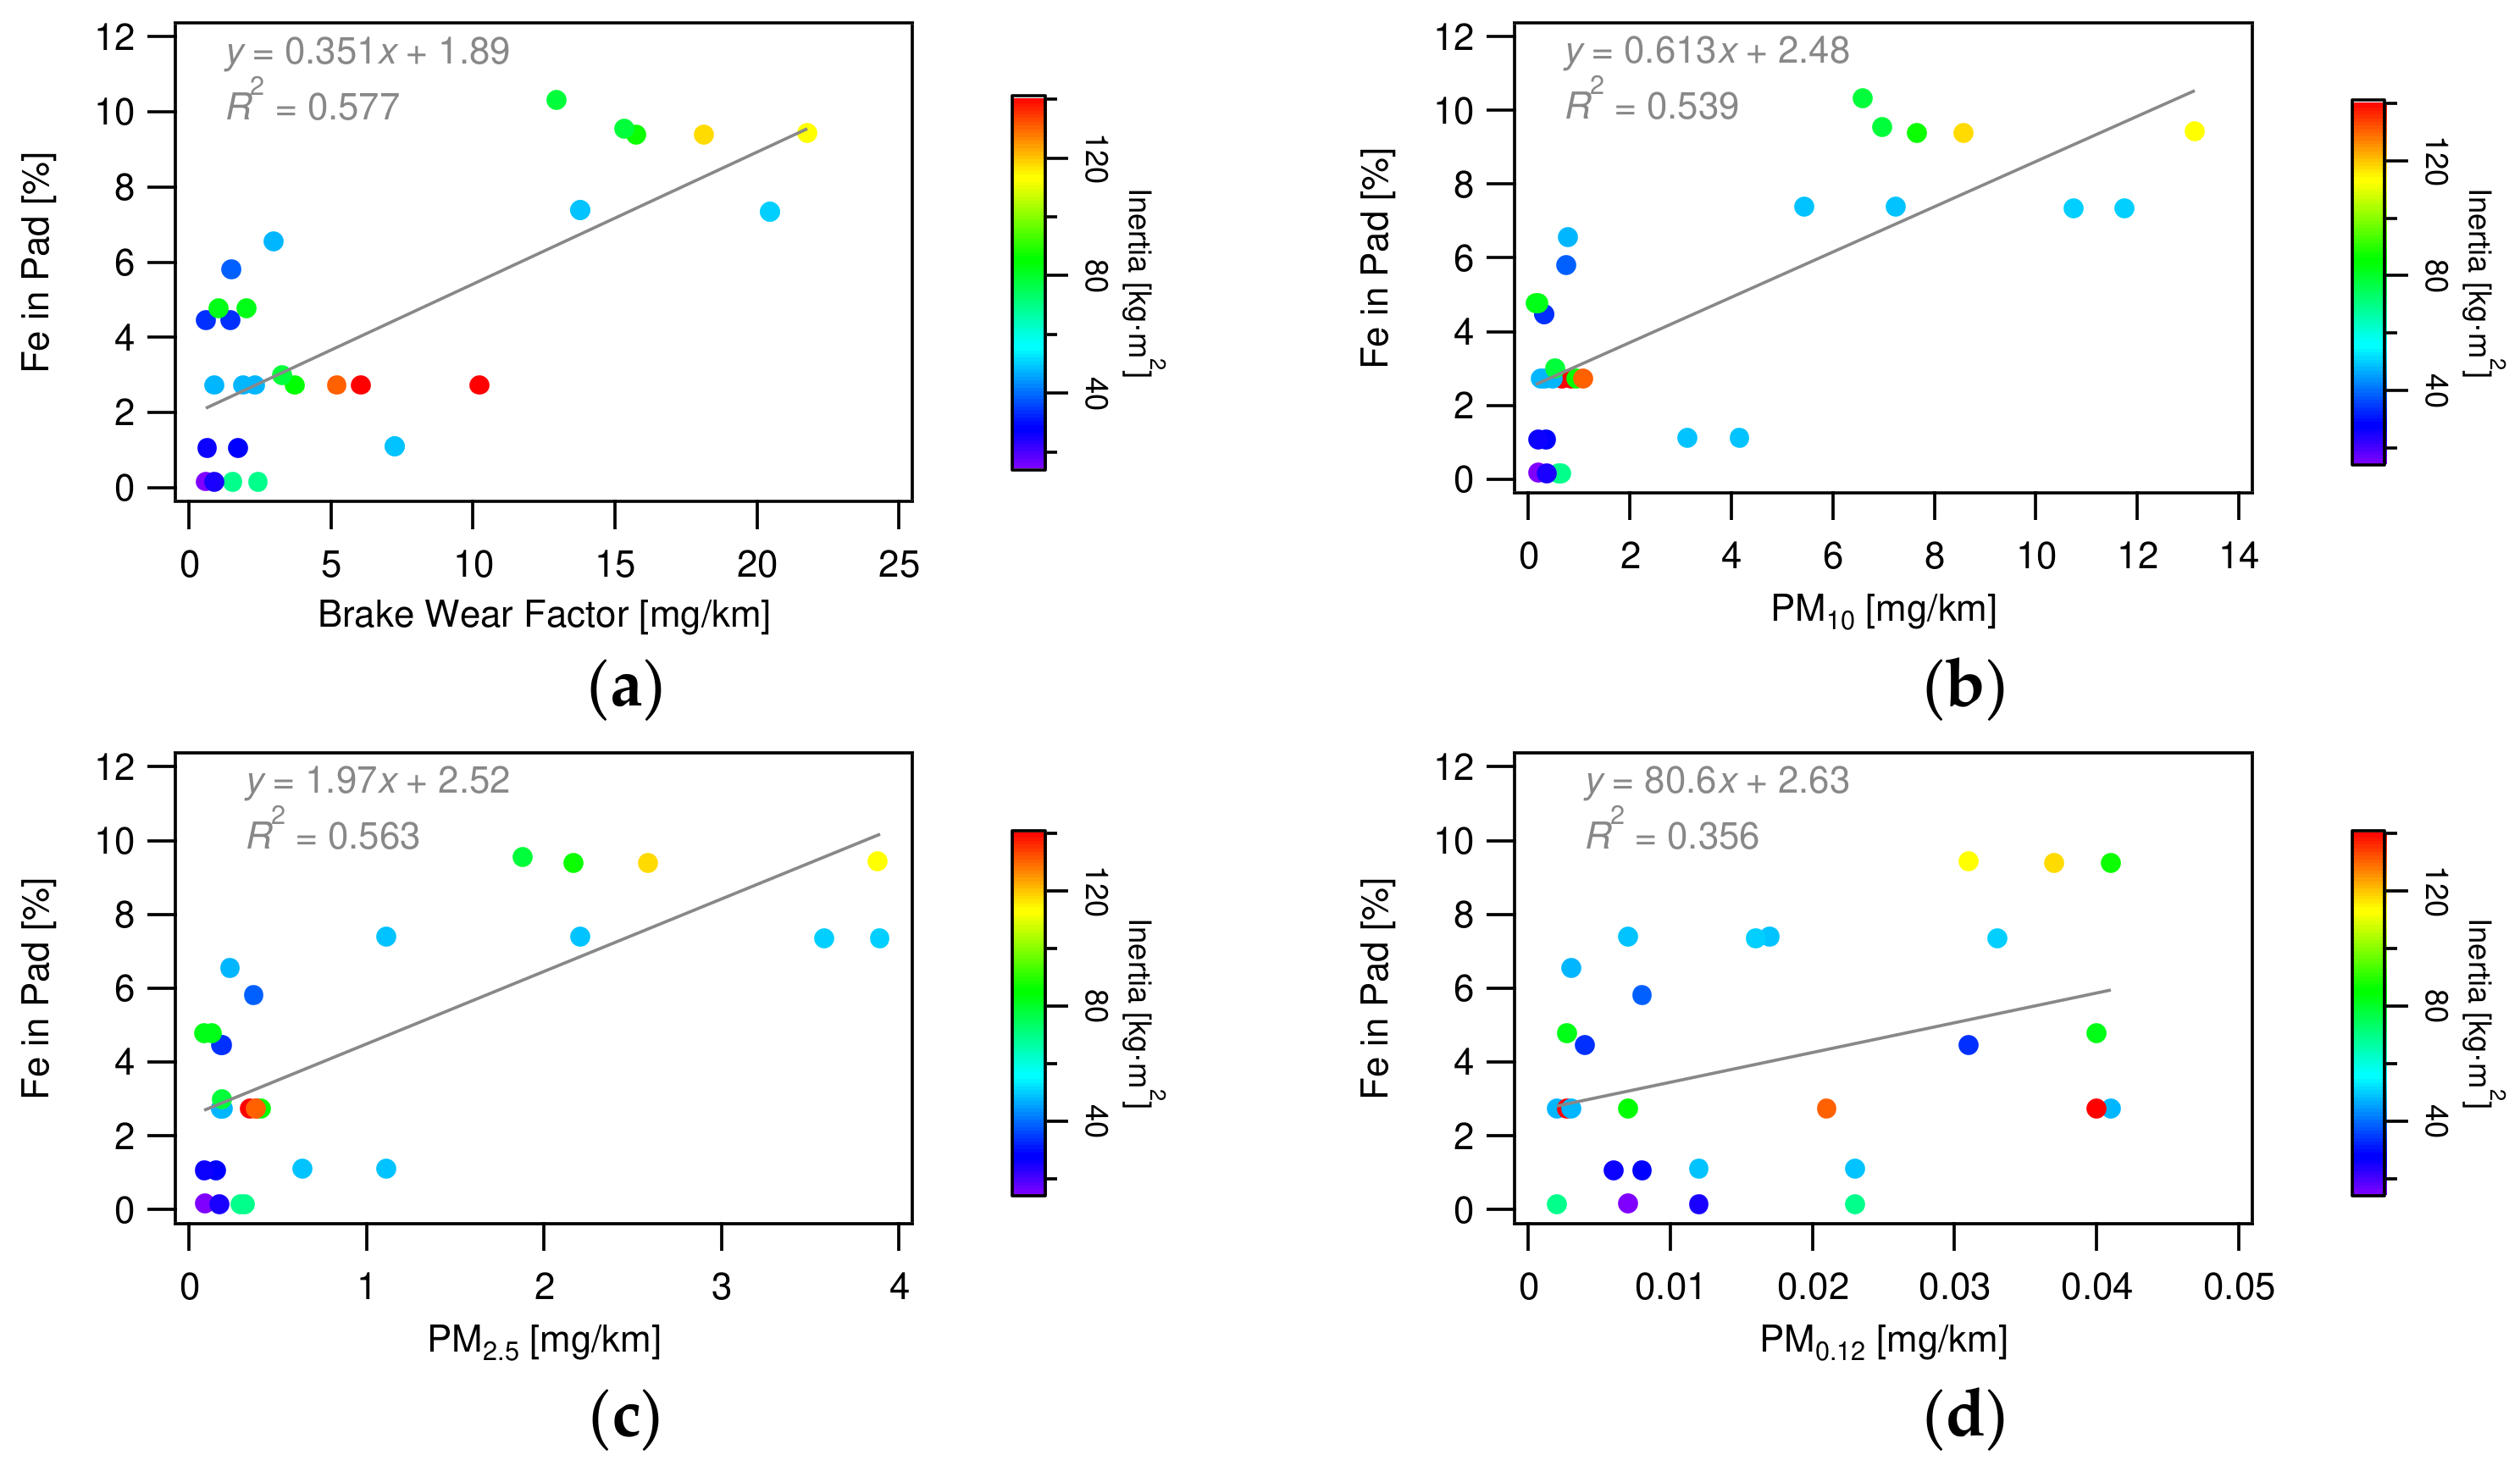
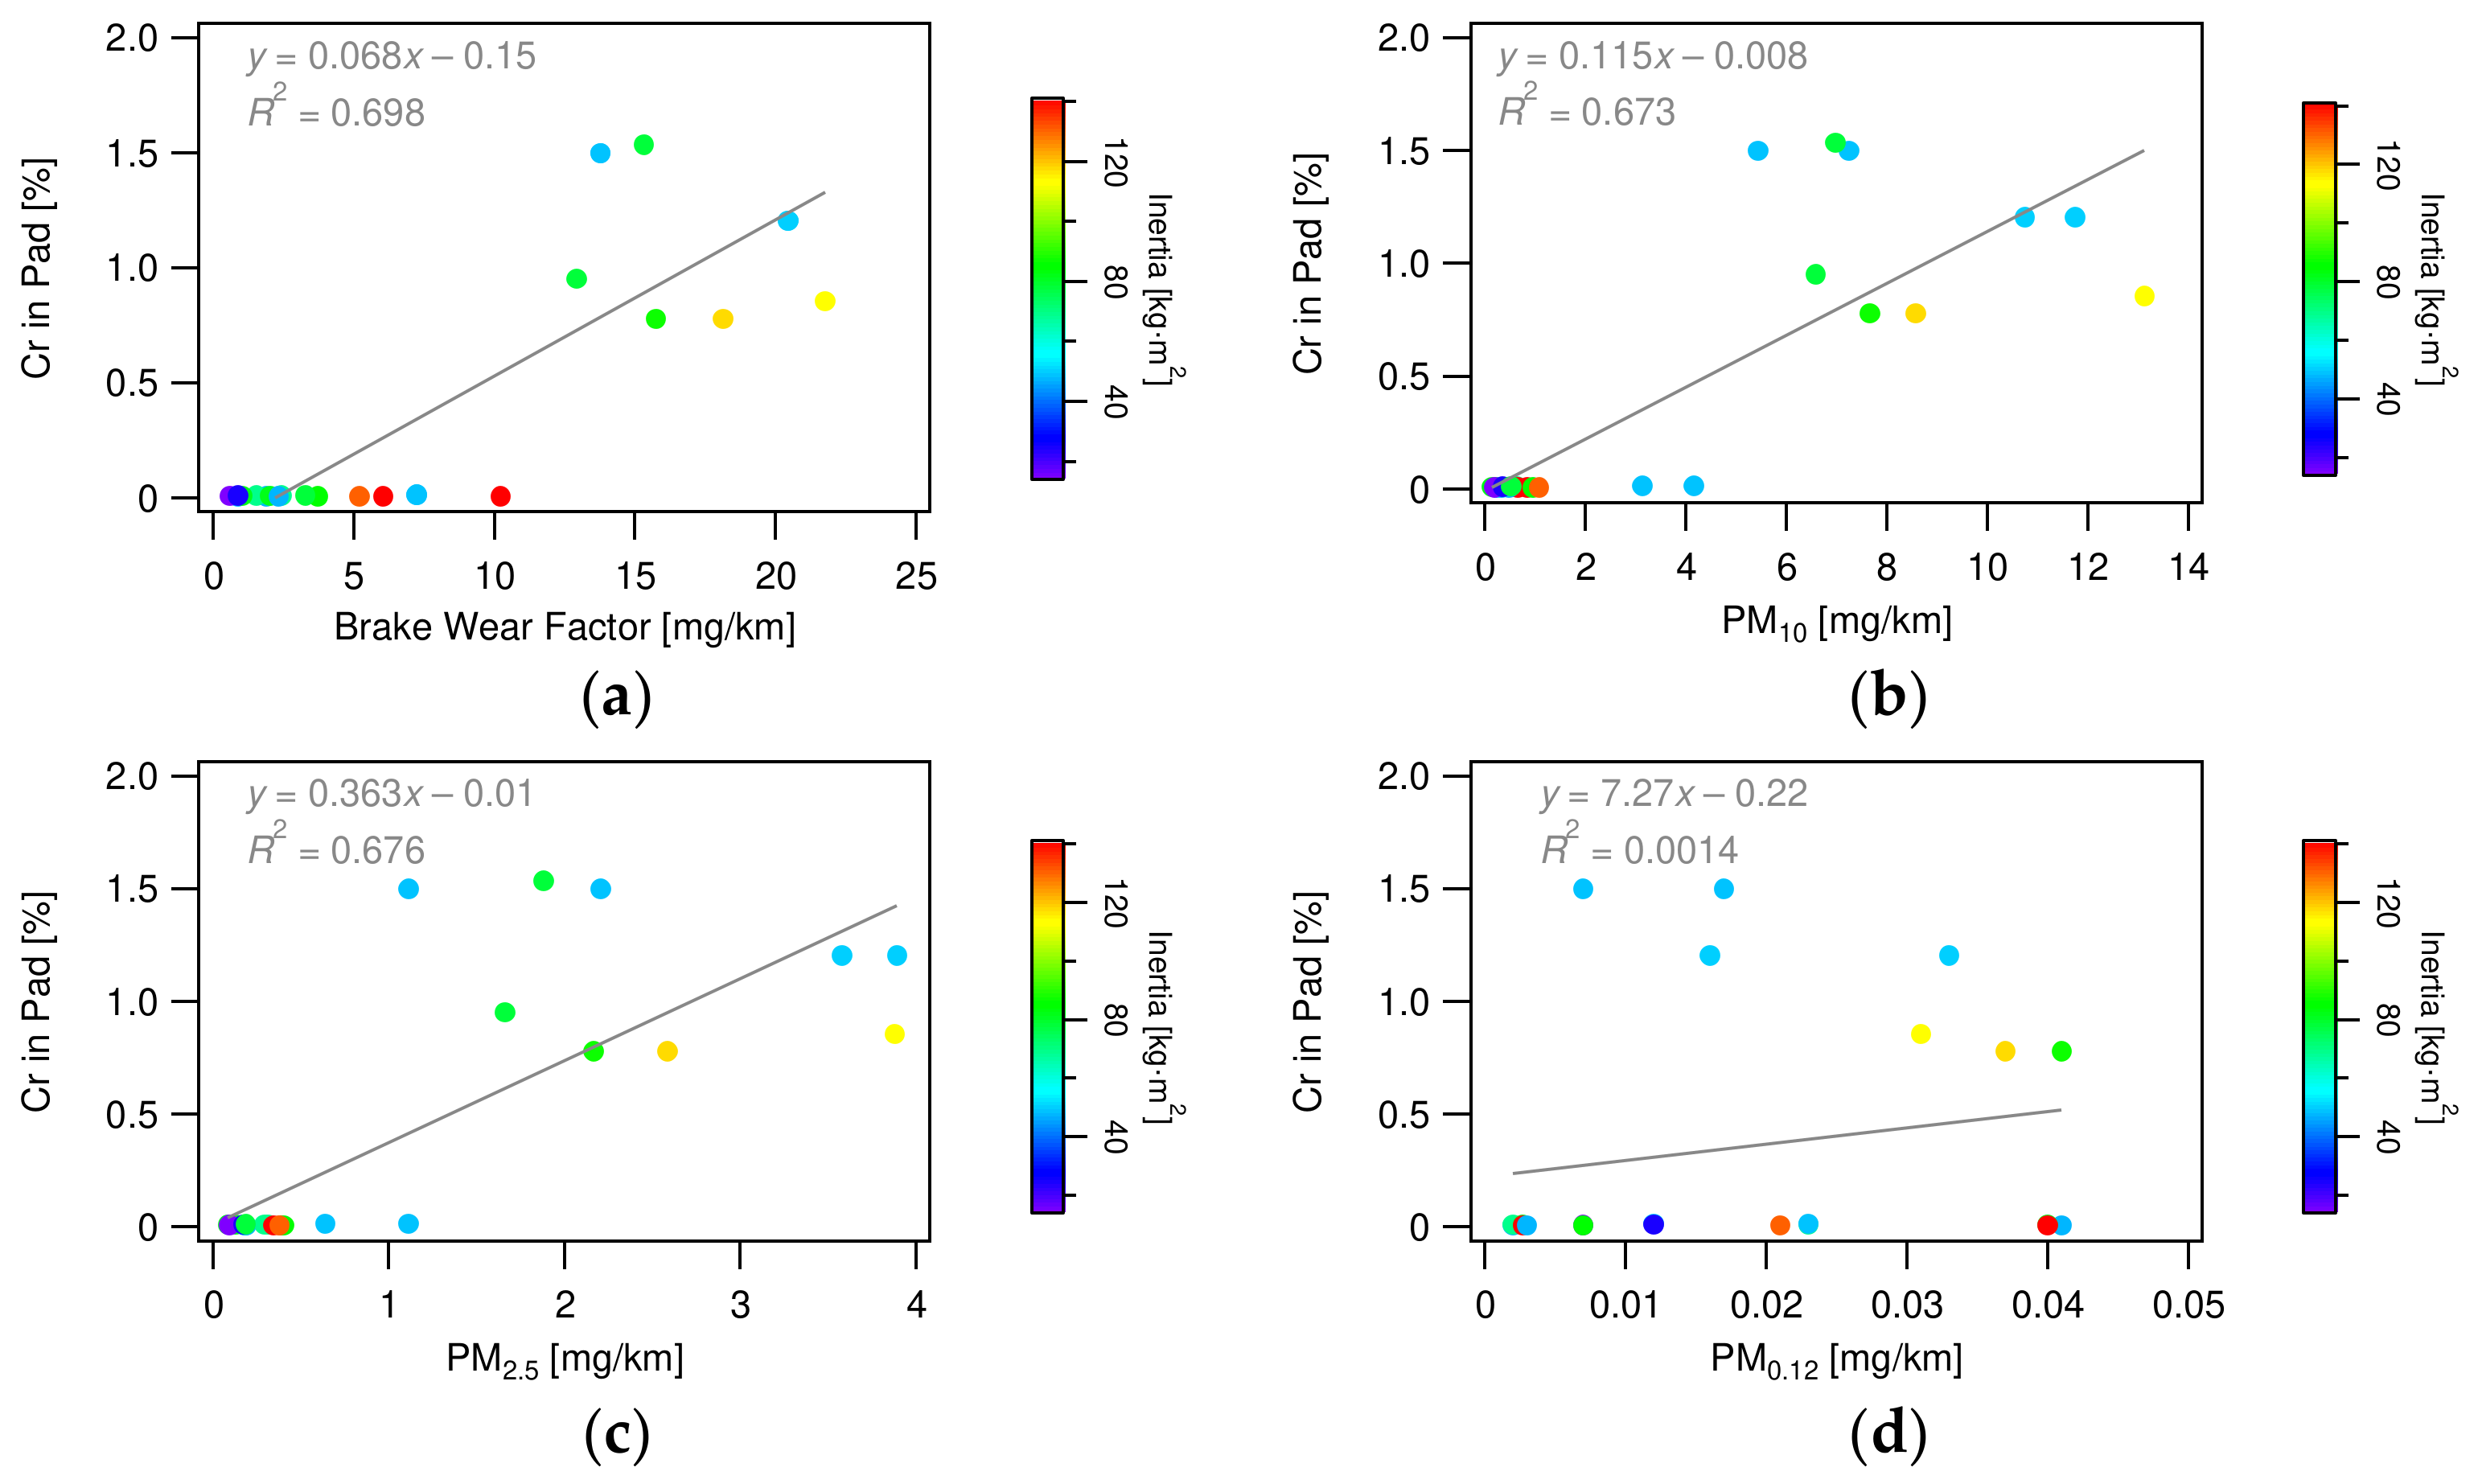
3.4.4. Iron and Chromium

As shown in Figure 16 and Figure 17, respectively, the mass contents of Fe and Cr in brake pads were positively correlated with the brake wear factor, disc wear factor, PM10, and PM2.5. The Fe and Cr in brake pads are mainly derived from steel alloys, mainly used as reinforcement [15,16,27]. In the present study, the pads contained 0.1–10.3% Fe and 0–1.5% Cr. Steel fibers have high strength, modulus of elasticity, and thermal stability, but they are known to increase wear [6,24,25,26,29] due to the accelerated plowing of the counter material (disc) surface [15,16,27]. Primary and secondary contact plateaus are formed at the brake friction interface [4]. The primary contact plateau is composed of wear-resistant components of the pad (e.g., steel fibers and ceramic particles), and it forms the nucleus for the secondary contact plateau, which is formed by the compression of particles that have been stripped in front of the primary contact plateau. The use of steel fibers forms the primary contact plate [60,61], and increasing their content increases contact wear [32,62,63]. Pyrite (iron sulfide, FeS2) and magnetite (Fe2O3) are also present as Fe in the pad, which increases the coefficient of friction, increases brake wear factors, helps to remove iron oxides and other undesirable surface coatings from the mating disc surface during braking, improves vehicle braking effectiveness, and acts as an abrasive agent [15,16,27]. Magnetite (Fe2O3) acts as a solid lubricant, maintaining the coefficient of friction during braking (especially at high temperatures), protecting the mating disc surface from excessive wear and reducing vibration and noise [15,16,27]. In metal-to-metal wear, when the oxygen diffusion coefficient of the supplied metal oxide particles was high relative to the oxygen diffusion coefficient, the formation rate of the friction film occurred faster because of the faster sintering rate of the particles, and a negative correlation was observed for the amount of wear [31]. On the other hand, when metal oxide particles were mixed with phenolic resin and worn on the pad and disc, the amount of wear correlated with the oxygen diffusion coefficient [59], and the trends were not consistent. The amount of wear differed greatly between Fe2O3 and Fe3O4, and the amount of wear was higher when Fe3O4 was added, indicating that Fe3O4 changes to the “homogeneous metal Fe” when reduced and shows high cohesion with the disc material [33]. This high cohesion between the homogeneous metals significantly increases the wear of the pad material [33]. As the results of previous studies indicated, the increase in wear and PM emissions with Fe content (positive correlation) cannot be explained in a monolithic manner, but the results of this study suggest that the increase in steel fiber leads to the positive correlation.

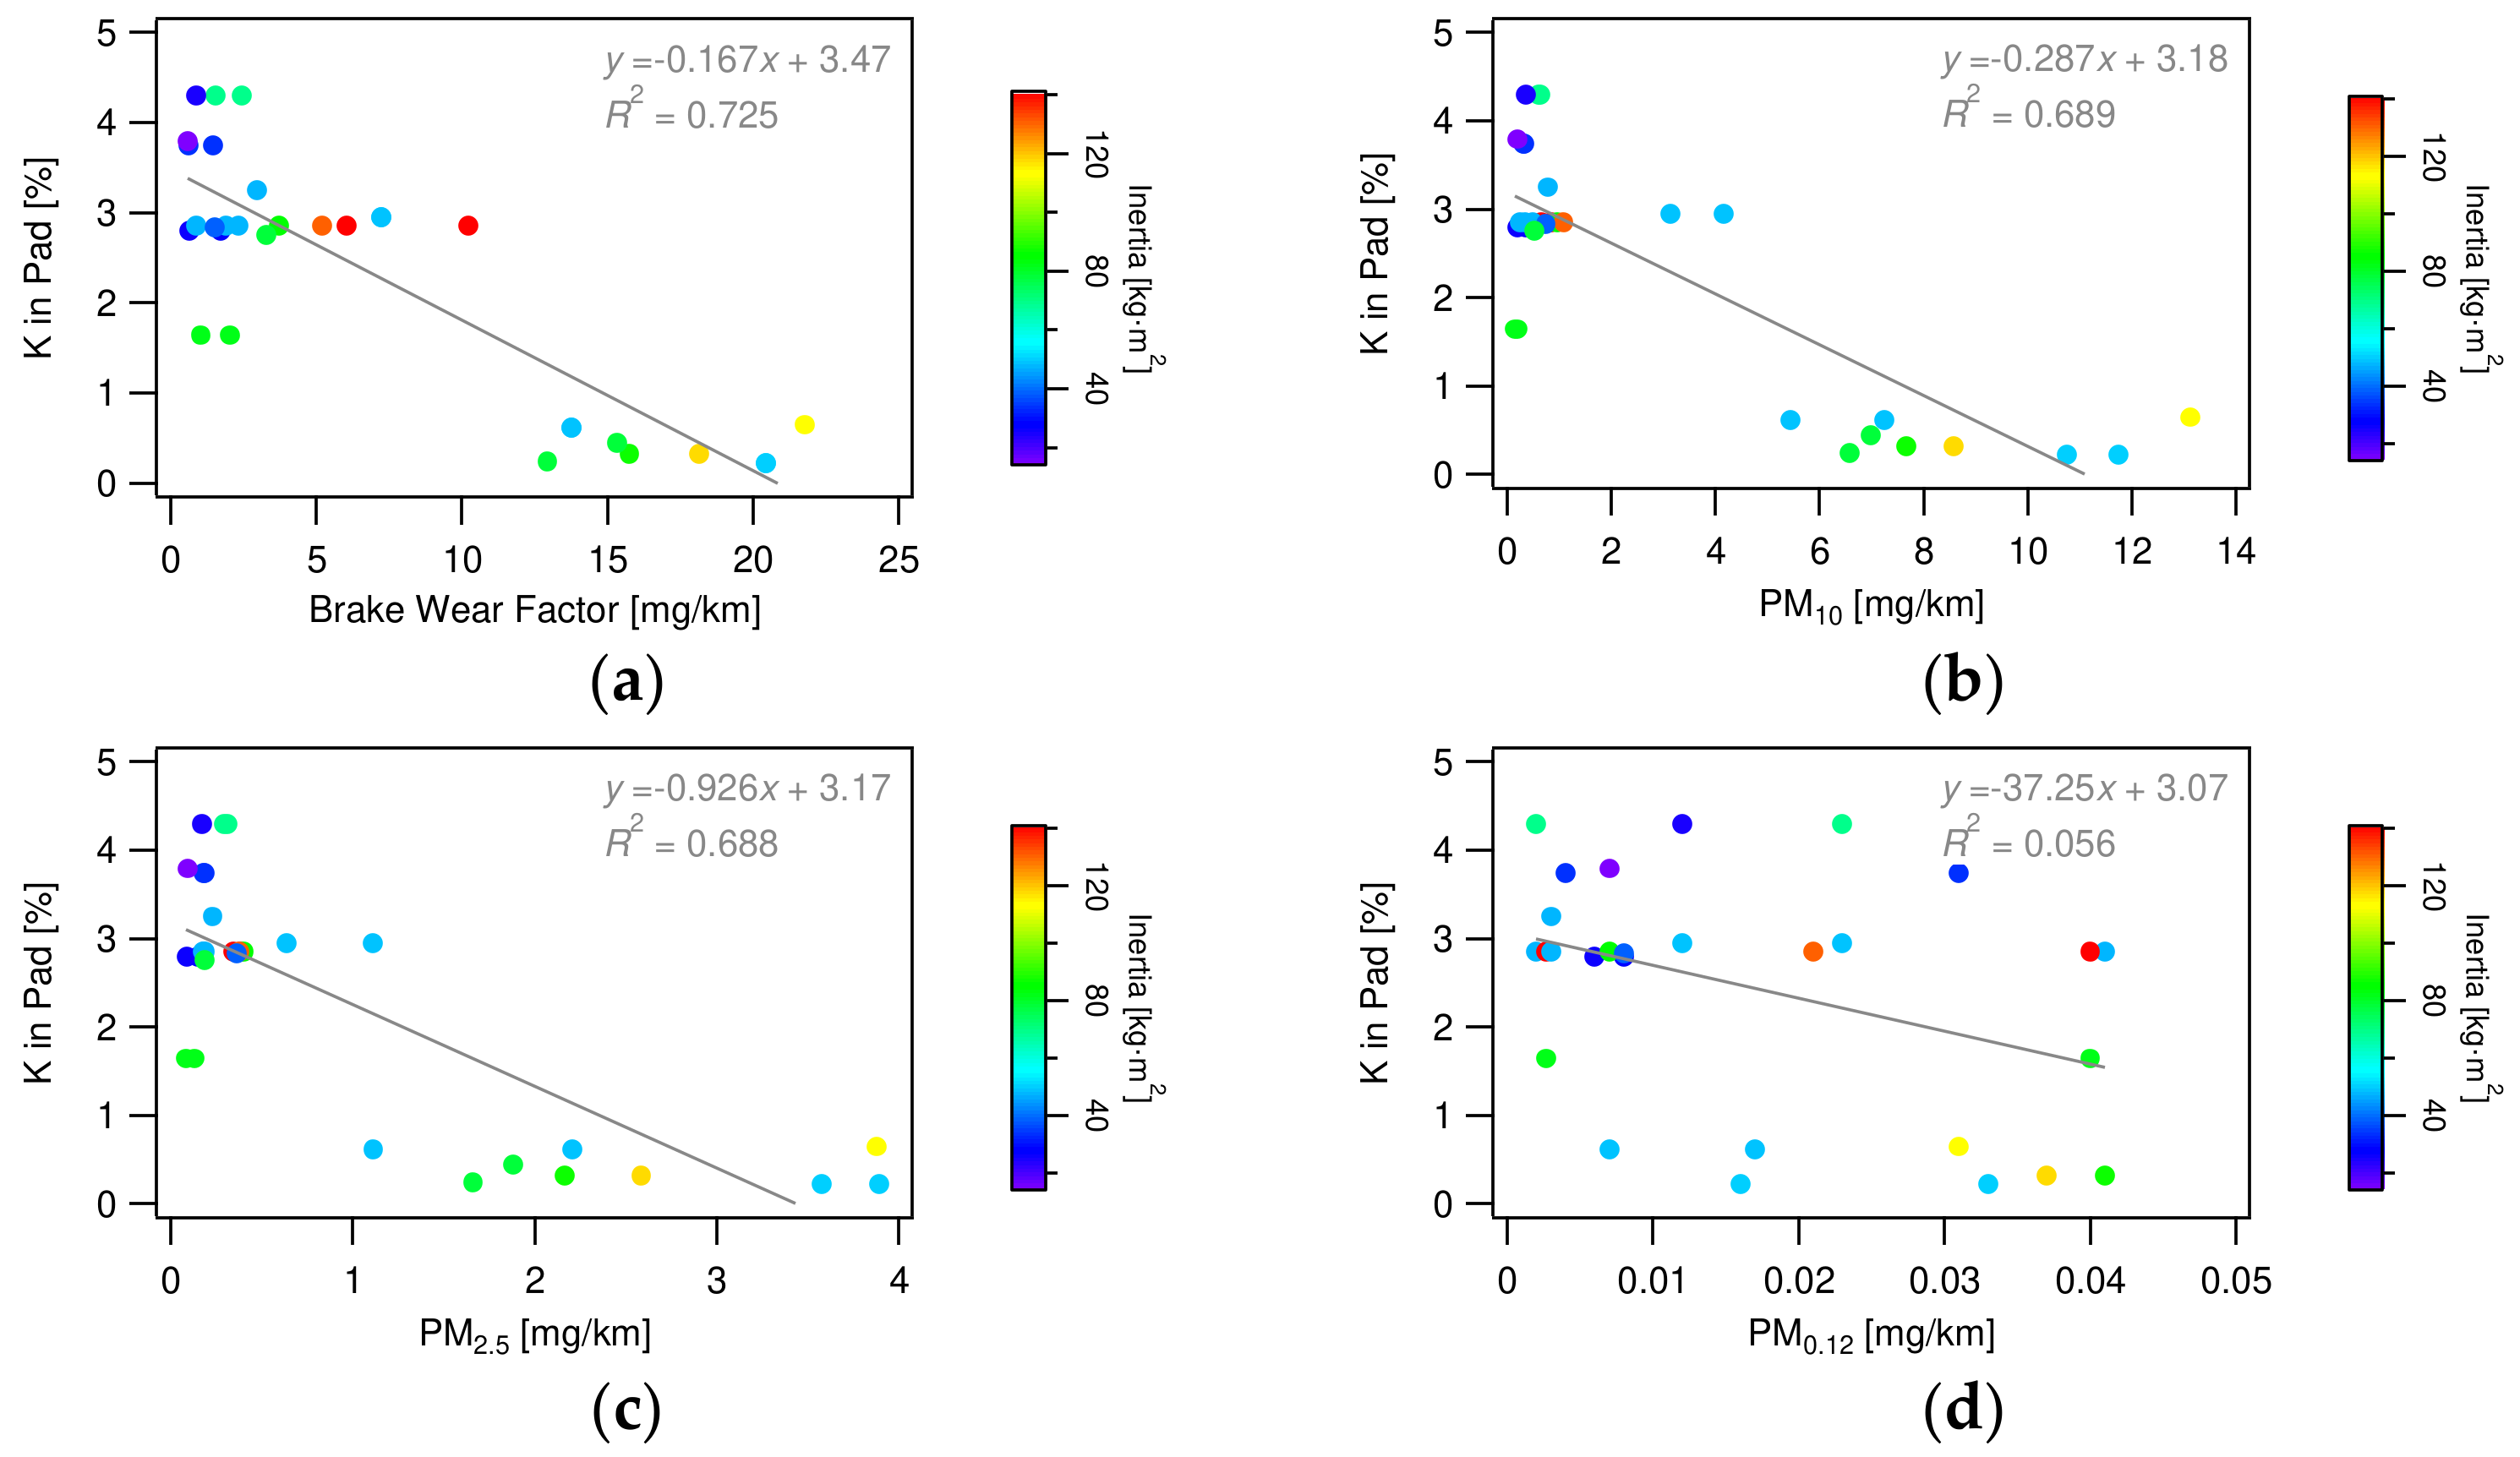
3.4.5. Titanium and Potassium
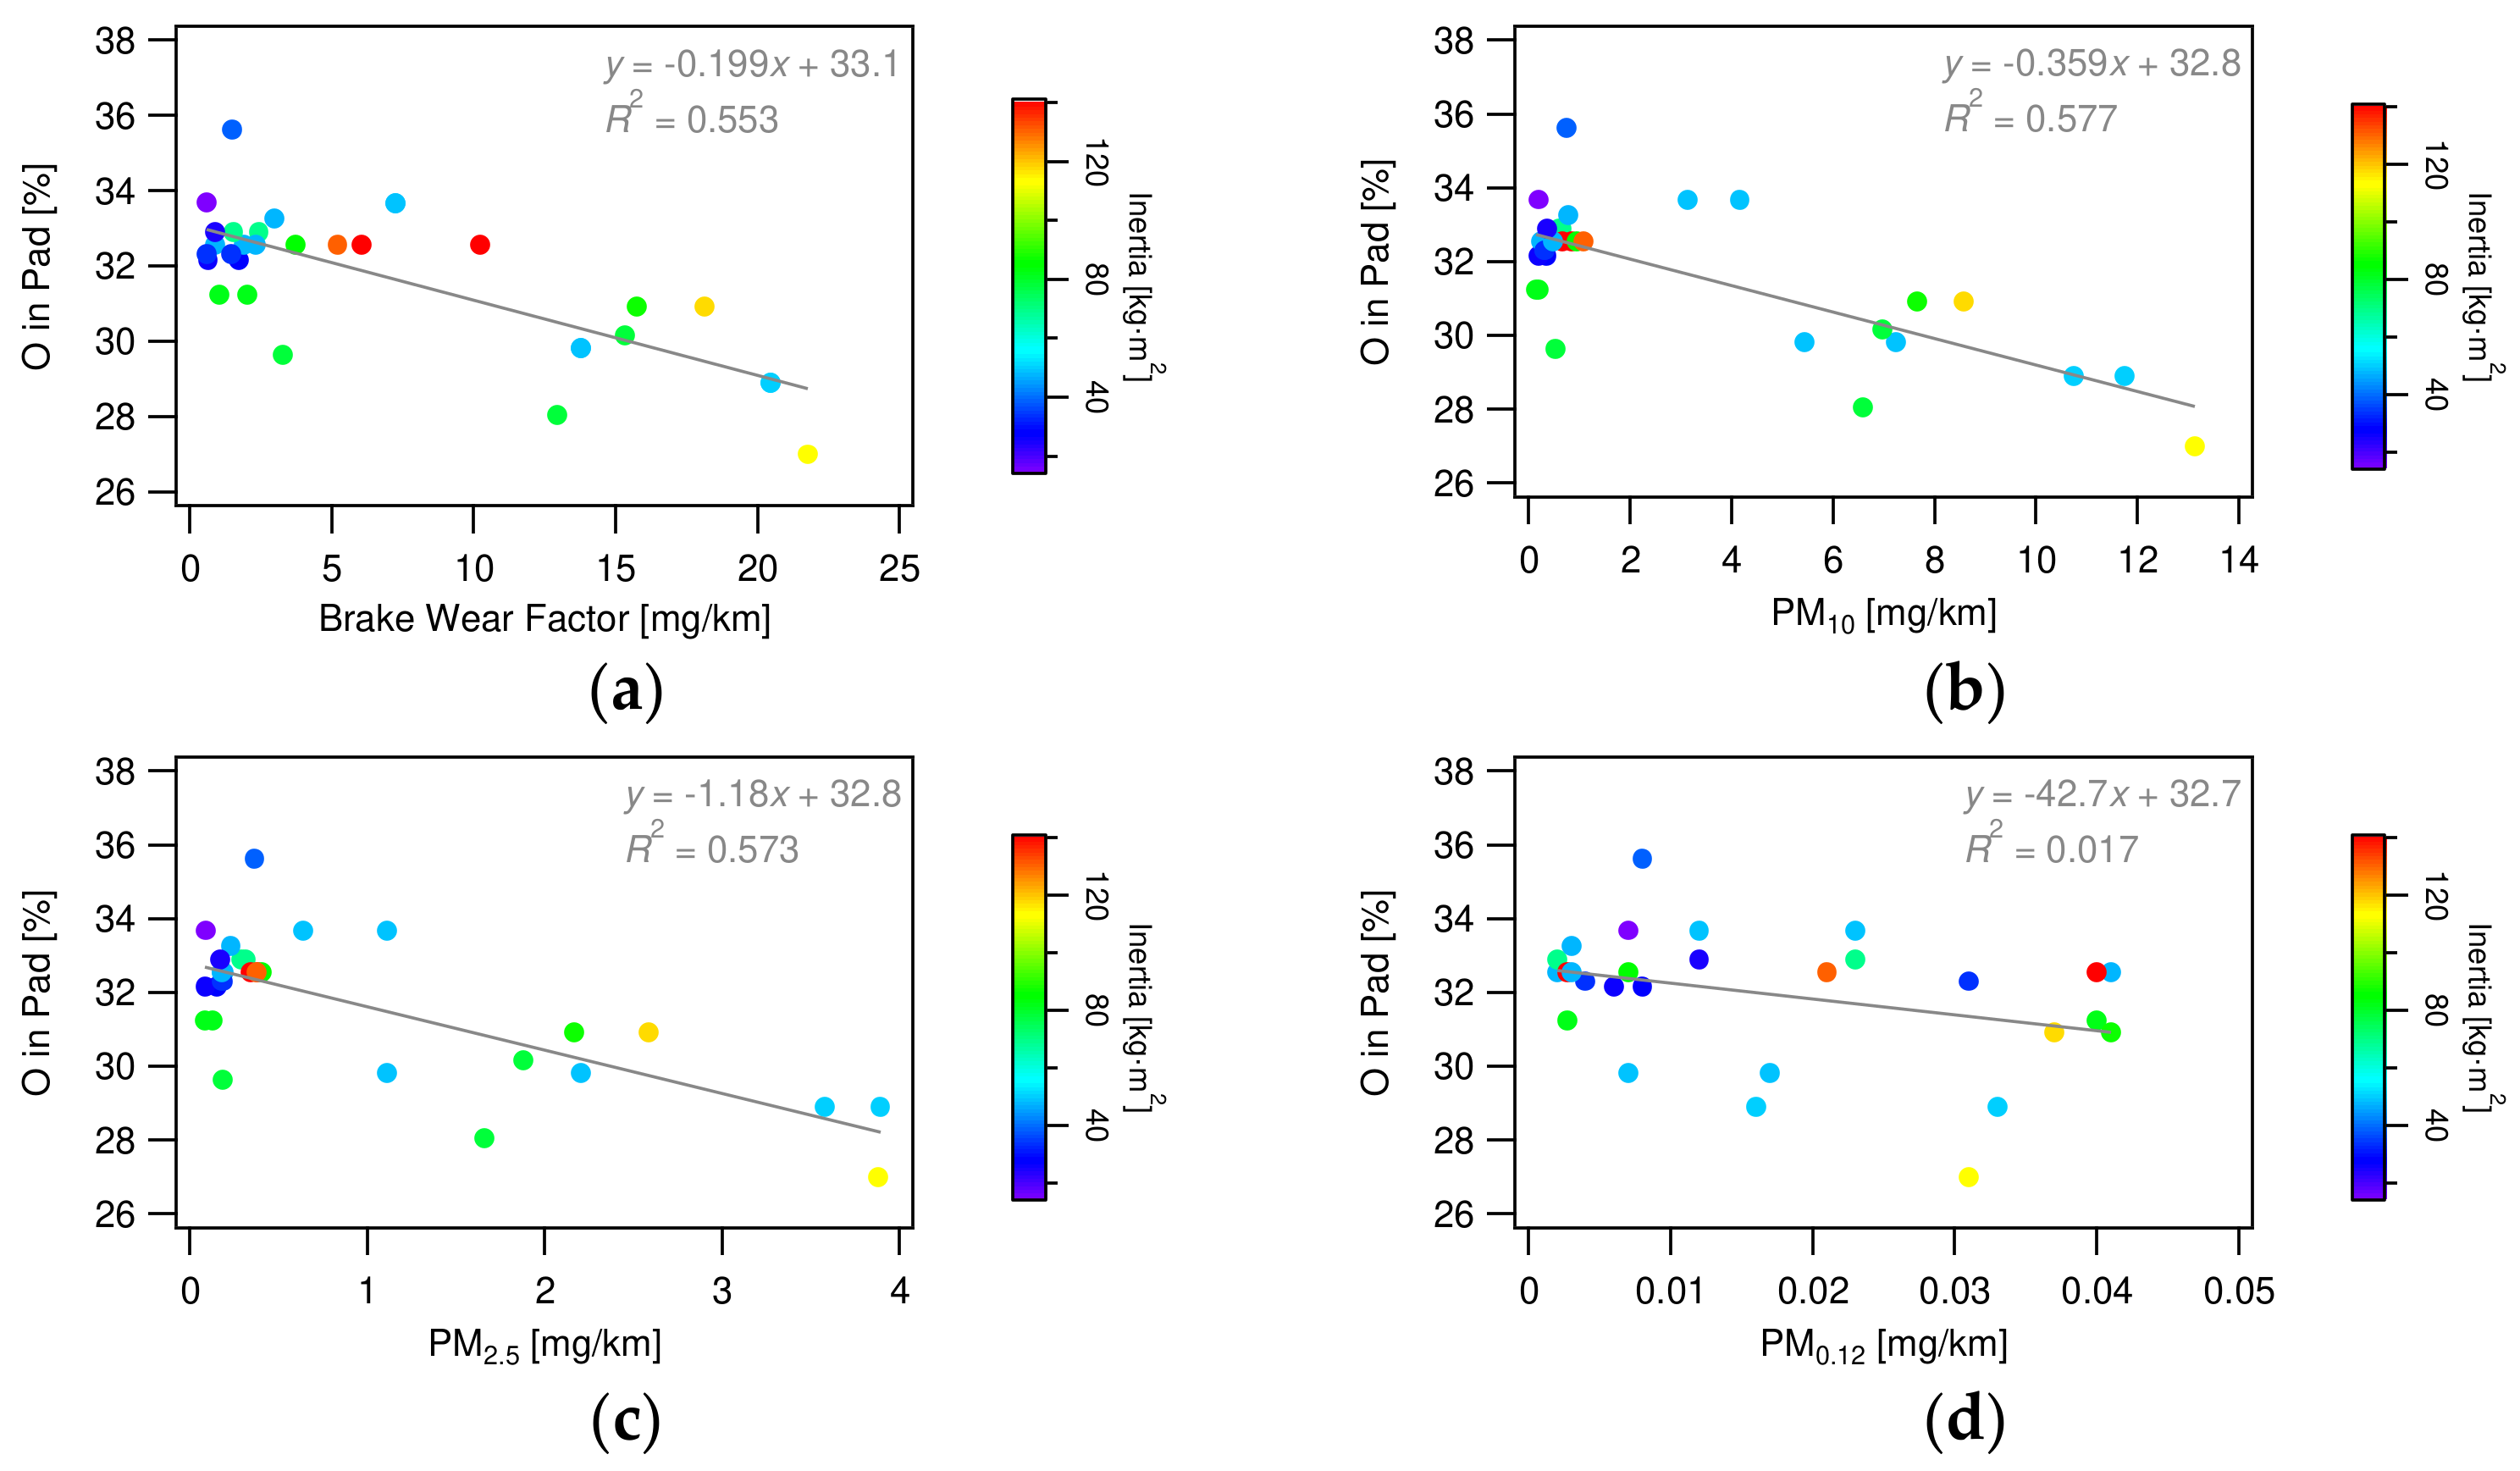
As shown in Figure 18 and Figure 19, respectively, the mass contents of Ti and K in the pad were negatively correlated with the brake wear factor, disc wear factor, PM10, and PM2.5. The Ti and K in brake pads is derived mainly from potassium titanate as friction modifiers [15,16,64]. In this study, the pads contained 0.06–11.6% Ti and 0.2–4.3% K. Potassium titanate has also long been used in non-steel brake pads as a reinforcement in a variety of commercially available brake pads to improve friction stability and wear resistance [64,65,66,67]. Another important feature of potassium titanate is its availability in a variety of forms, which allows for the control of friction properties. The friction and wear properties of brake friction materials containing potassium titanate in various forms and the shape of potassium titanate play an important role in the formation of friction coatings on the friction surface [66]. It has been suggested that the chemical reaction between titanate and phenolic resin forms char on the pad surface and improves friction stability under burnish conditions [68]. Friction materials with high-molecular-weight resins and platelet potassium titanate have a greater plateau on the sliding surface at low temperatures before the resin thermally decomposes, thus improving wear resistance properties [67]. It has also been reported that, depending on the blend amount of aramid fiber and potassium titanate, which have a low wear resistance, fine spherical wear particles are formed on the surface of the friction material [69]. Consequently, our findings suggest that potassium titanate improves friction stability and wear resistance, leading to a negative correlation with brake wear and disc wear, as well as PM10 and PM2.5 emissions.

3.4.6. Oxygen

As shown in Figure 20, the mass content of O in brake pads was negatively correlated with the brake wear factor, disc wear factor, PM10, and PM2.5. In brake pads, O is derived from metal oxide particles (e.g., MgO and FexOy) and barium sulfate (BaSO4) in fillers; the pads in this study contained 27–35.6% O. The brake friction material including iron oxide consists of reinforcing fibers, friction modifiers, and fillers bonded with a binder resin, and it is used for iron-based disc rotors. The brake friction material contains 1–30% (by volume) iron oxide having a particle size of 0.5 μm or less; it reacts with the iron in the mating material (the disc rotor) when it comes into contact with it in a non-steering state to produce a protective film of iron oxide on the disc rotor friction surface. As a result, the grinding action of the disc rotor by the grinding component in the brake friction material is suppressed, e.g., [70]. Barium sulfate (BaSO4), which is included as a filler, has a wear-inhibiting effect [18], as is discussed in Section 3.4.7. Thus, we considered that a negative correlation was found between brake wear and the emission of brake wear particles because of the formation of an oxide film and the wear-inhibiting effect of oxides, rather than the wear-inhibiting effect of oxygen itself in the pad.

3.4.7. Barium

As shown in Figure 21, the mass content of Ba in brake pads was positively correlated with the brake wear factor, disc wear factor, PM10, and PM2.5. The Ba in brake pads is derived from barium sulfate (BaSO4) in fillers, and the pads in this study contained 0.03–8.4% Ba. Barium sulphate, an inorganic mineral, is the most commonly used space filler because of its high thermal stability and minimal water solubility [15,16,71]. The space filler effect on brake wear particles suggests that the proper selection of space fillers can reduce brake wear particles from gray iron discs by preventing direct adhesion with steel fibers [18]. The reduction in metal wear per particle mass suggests that the reduction in the total brake wear factor, PM10, and PM2.5 is predominant (negatively correlated with the ratio of Ba mass per pad mass). However, although outside the scope of this study, a comparison of non-steel pads and low-steel pads (ceramic pads) showed that the formation of OH radicals in the aqueous phase increased with the increase in the Ba concentration in brake wear particles [72]. We suggest that the prevention of direct adhesion with steel fibers by Ba results in a decrease in metal wear per particle mass [18], an increase in organic mass per particle mass, and the predominant formation of OH radicals derived from organic matter. A further investigation is needed to evaluate the reduction in brake wear particles and health effects, as it is suggested that the Ba concentration may be negatively correlated with oxidative potential and OH radical formation in the aqueous phase [72], which would be assumed to be in vivo, when evaluating health effects based on oxidative potential.

4. Conclusions

In this study, brake wear and brake wear particle emissions were systematically investigated for a commercial friction brake system in a dynamometer test. Different sampling methods and the emissions of brake wear particles by particle size (PM10, PM2.5, and PM0.12) were compared. In addition, elemental analysis of the particles and the correlation of brake wear and brake wear particles to the elements in the friction material were investigated to analyze the sources of brake wear particle emissions.
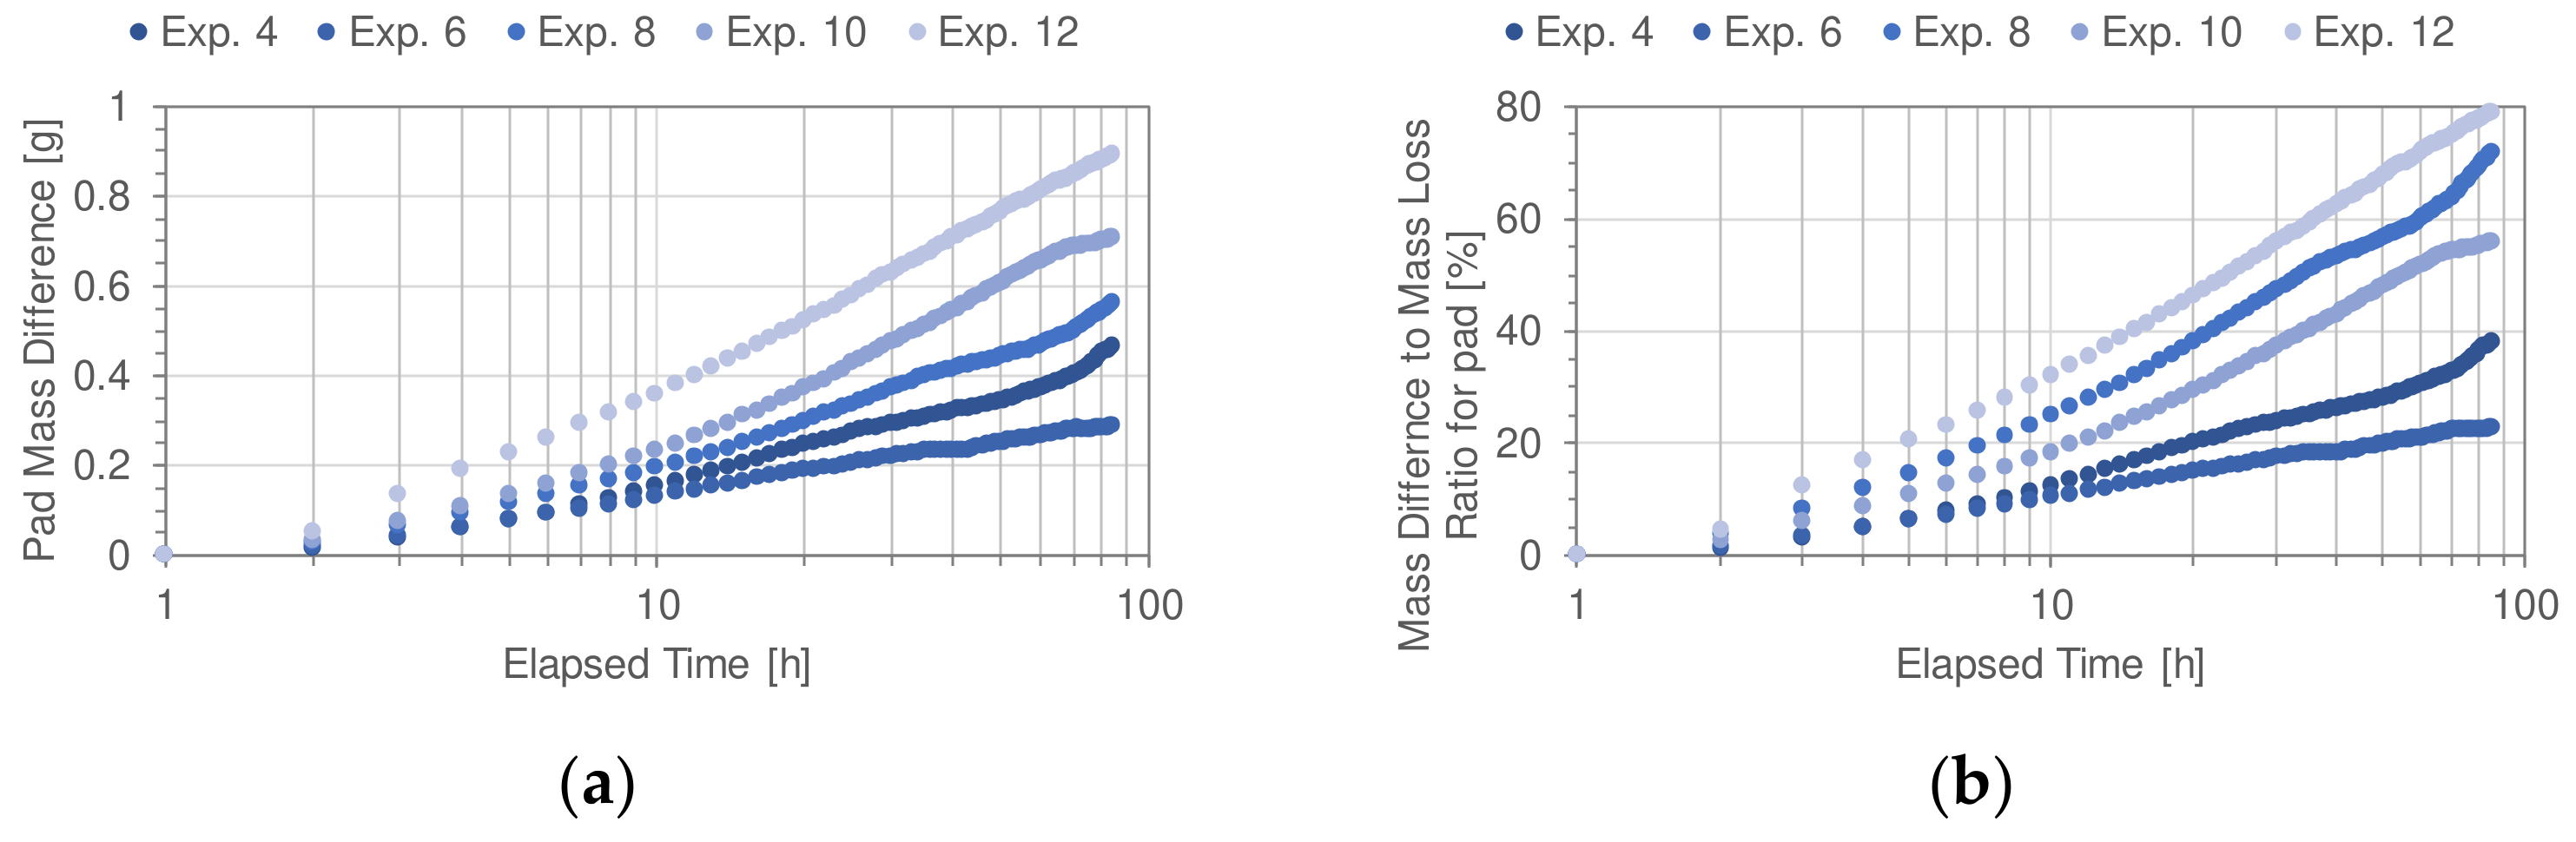
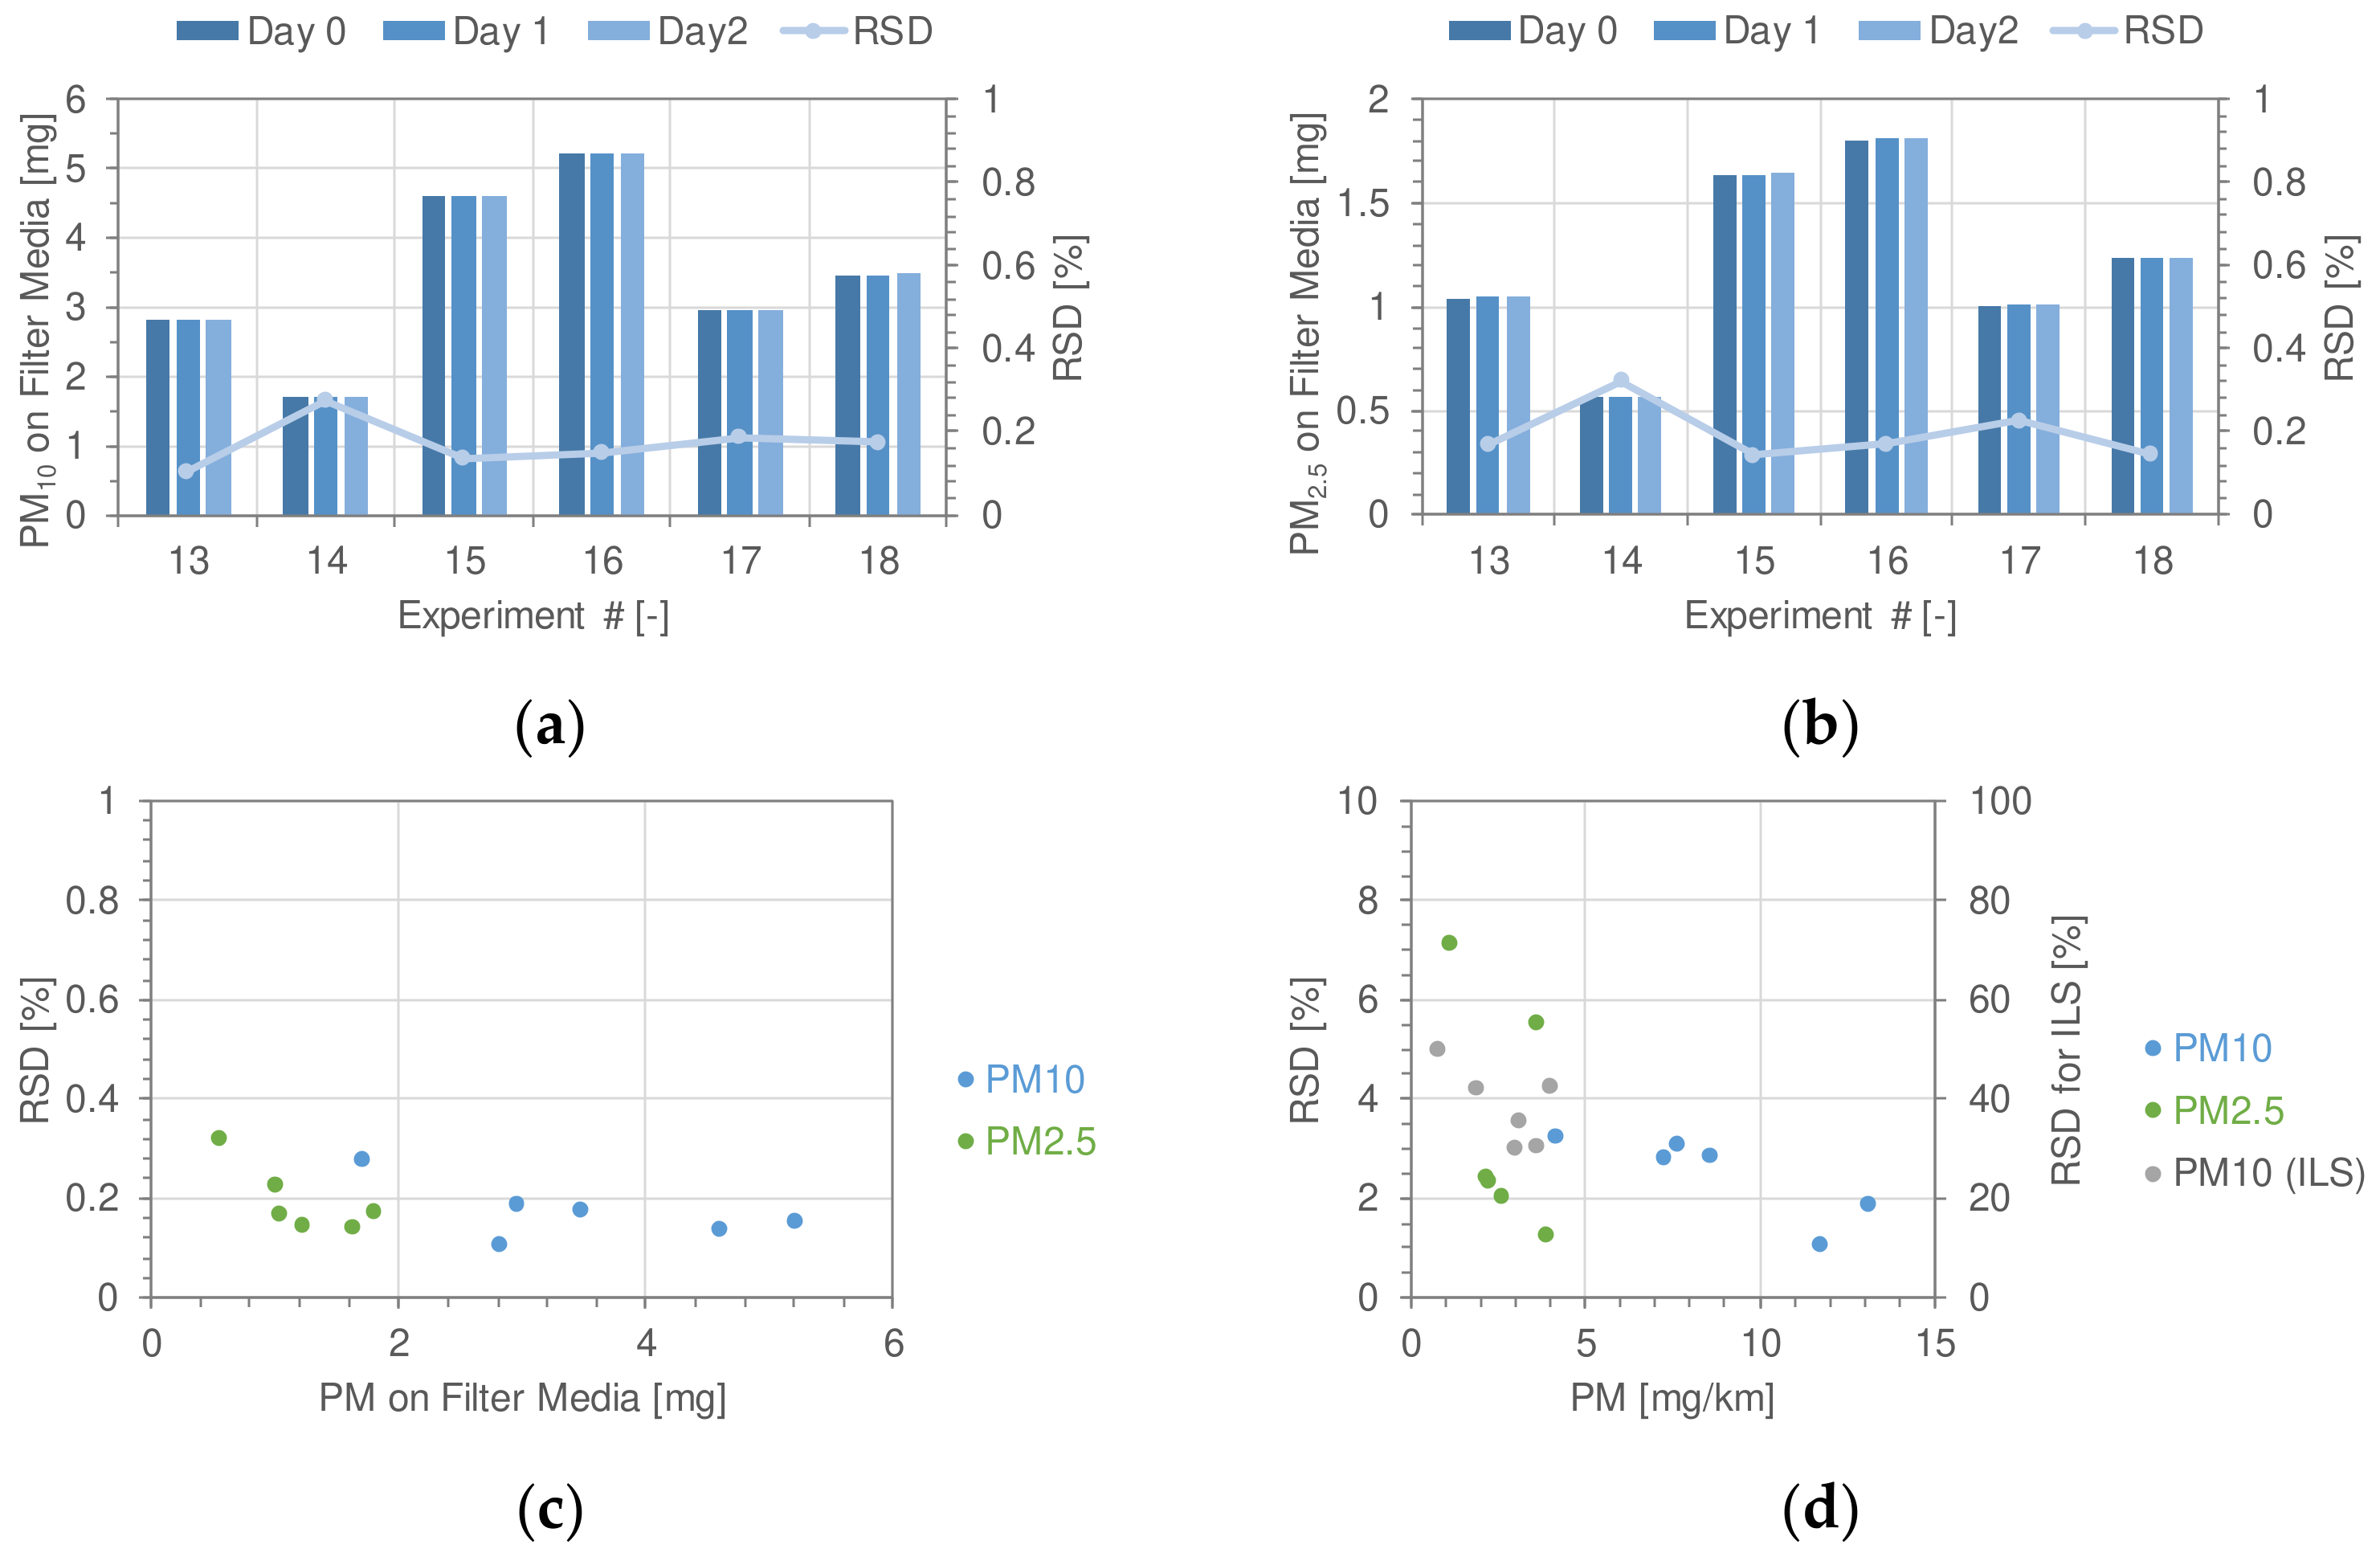
  • The ratio of mass difference to mass loss increased from 16.2% to 51.2% after the 24 h soak required by the GTR24 regulation as compared to the 1 h soak measurement. Therefore, in our experiments, we measured the mass of the pads and discs within one hour after the test and with a brake temperature below 30 °C.
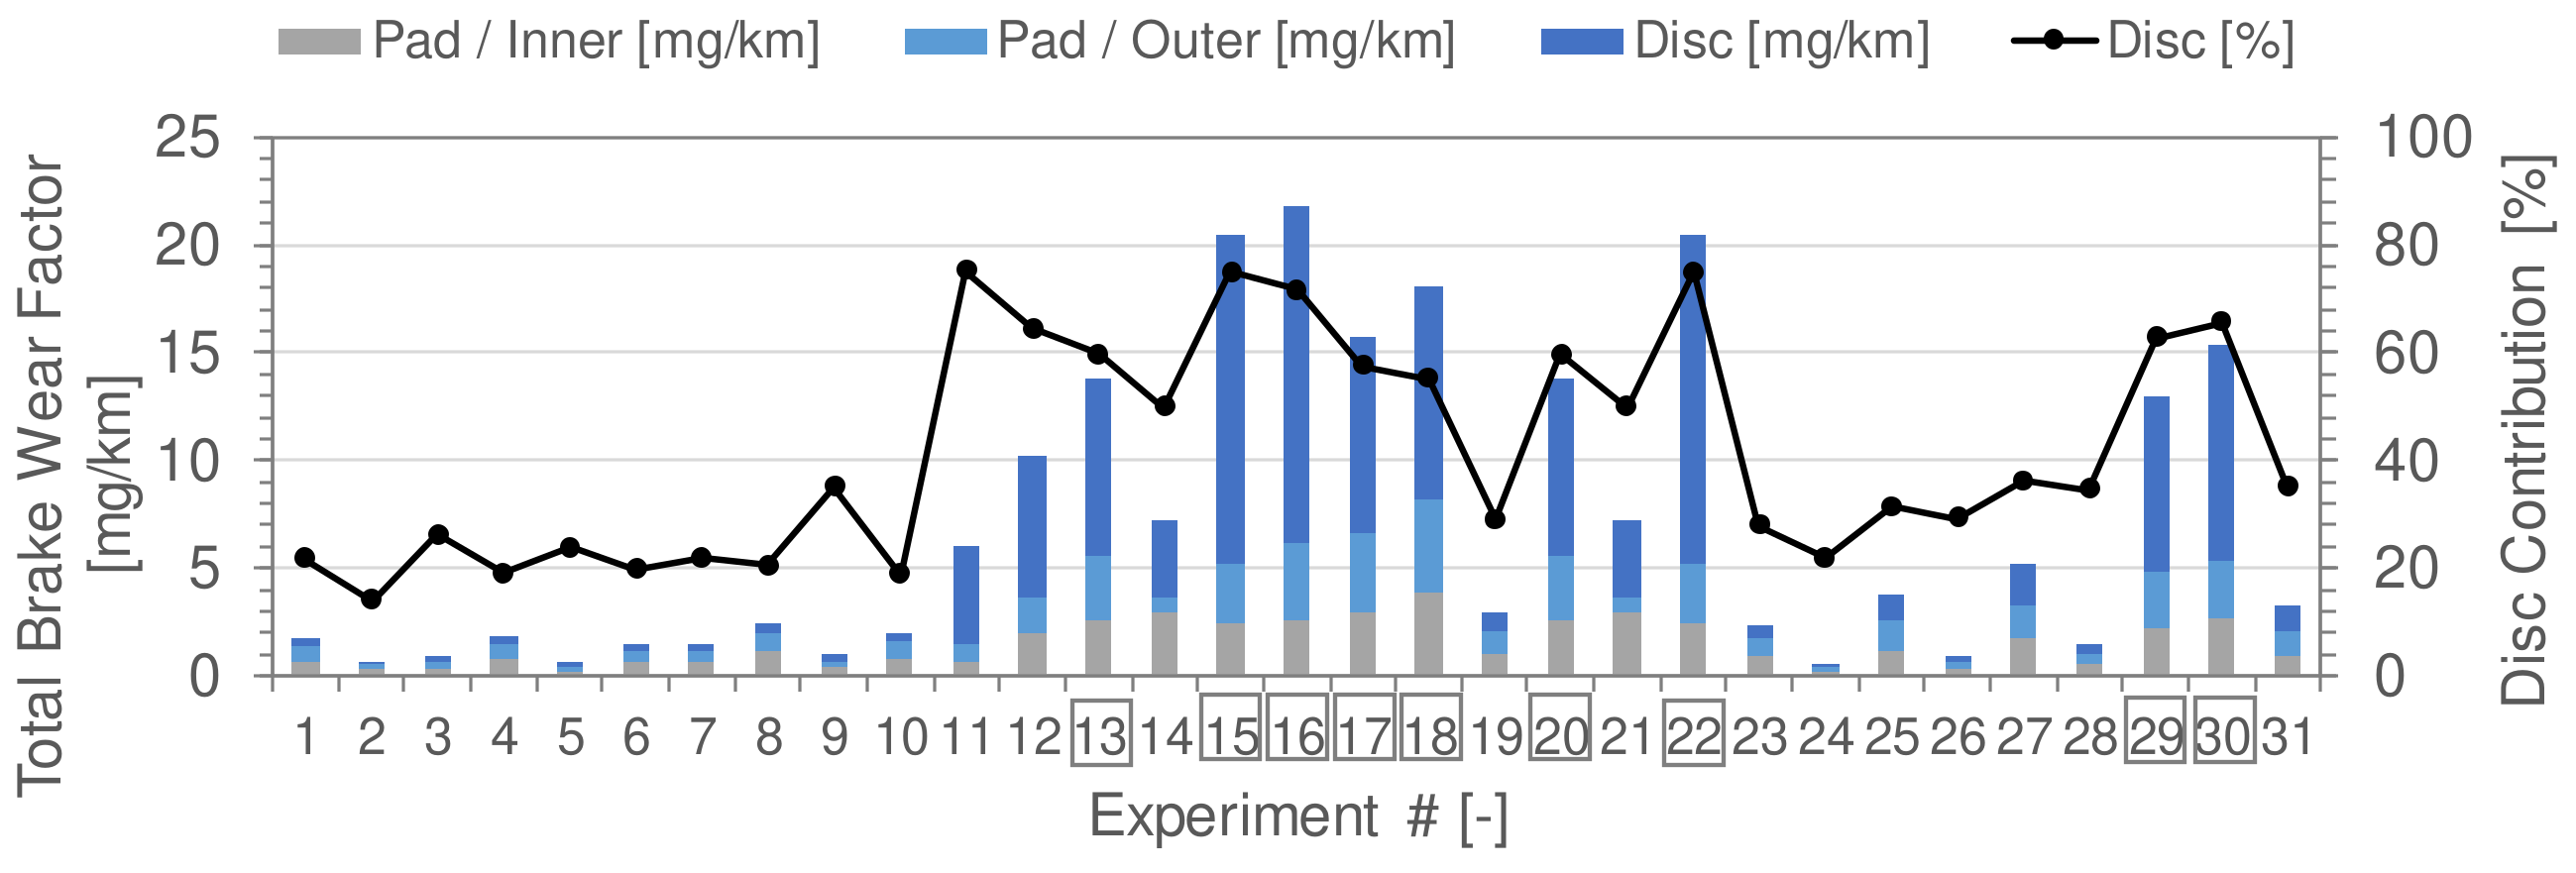
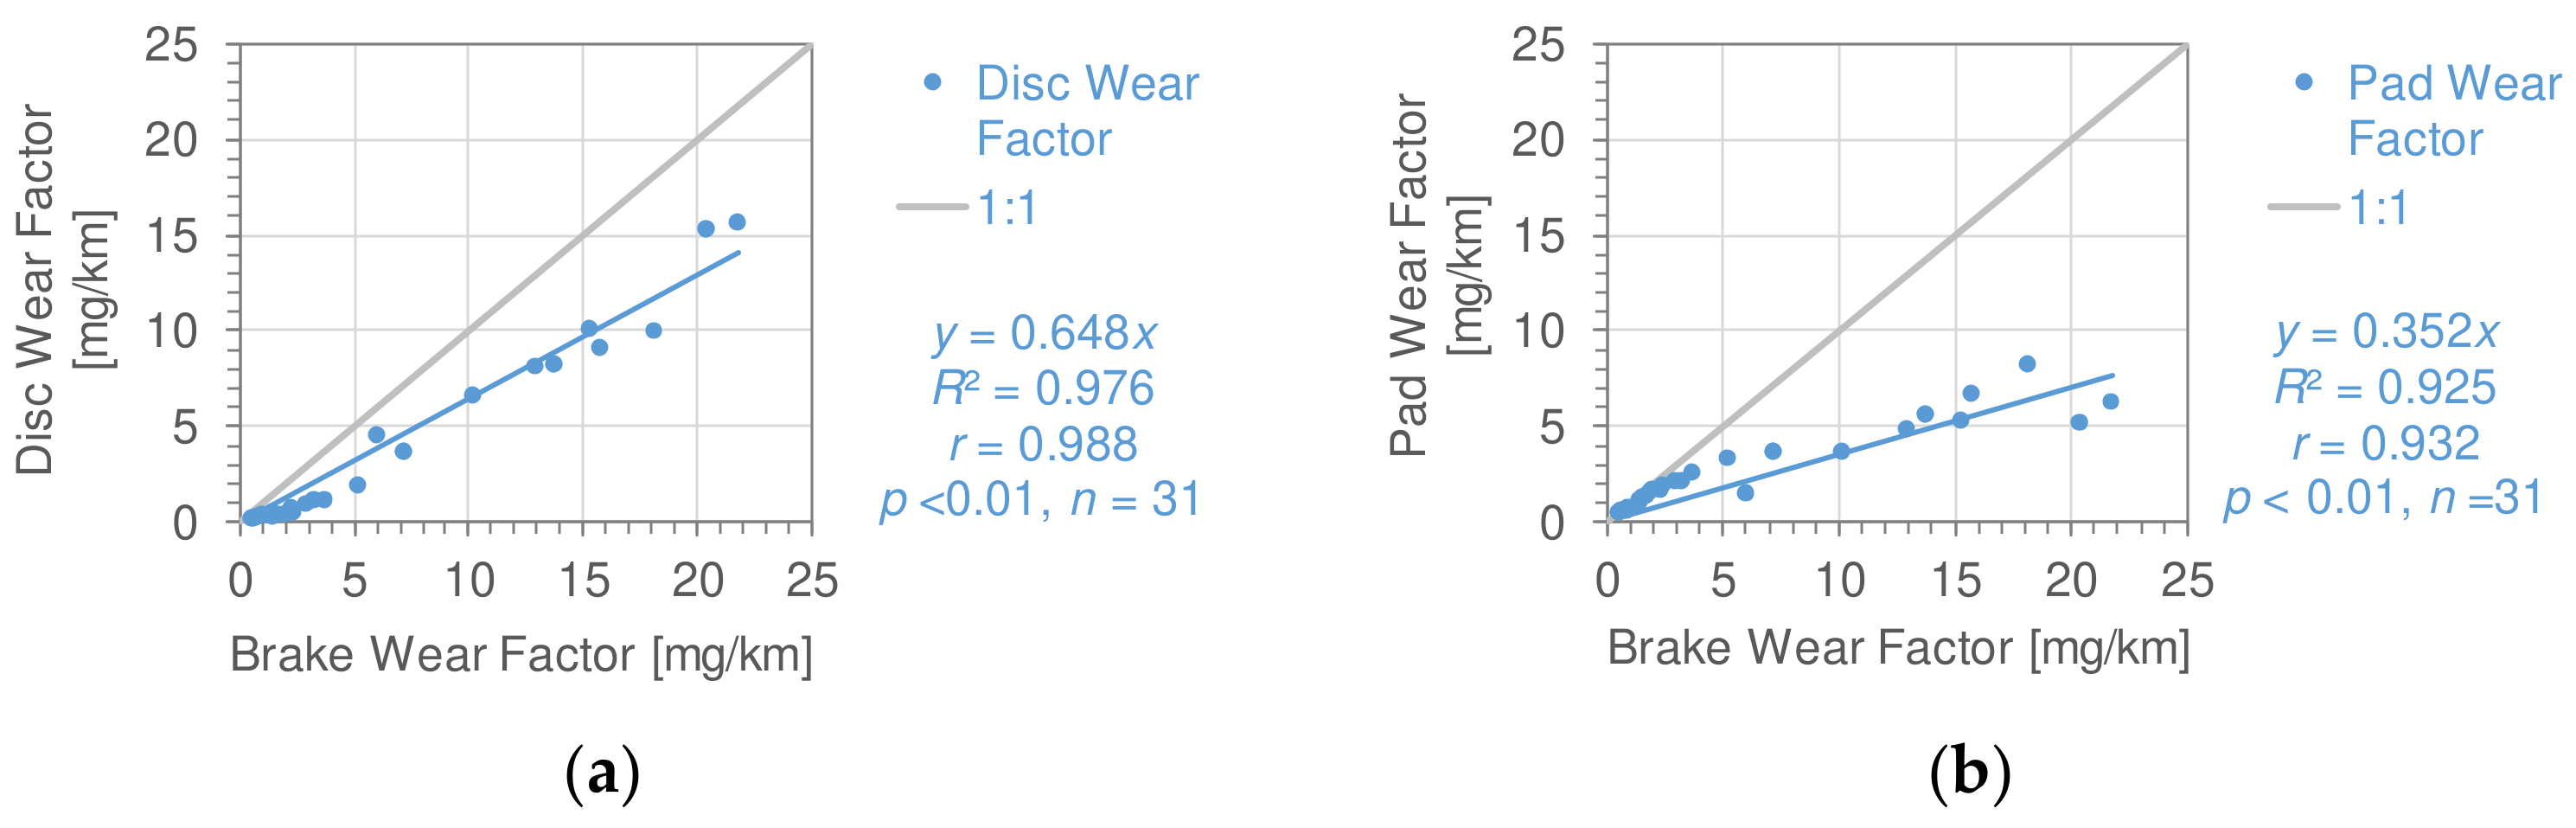
  • Based on the mass loss measurements, we found that the disc and pad wear factors accounted for 64.8% and 35.2%, respectively, of the brake wear factor.
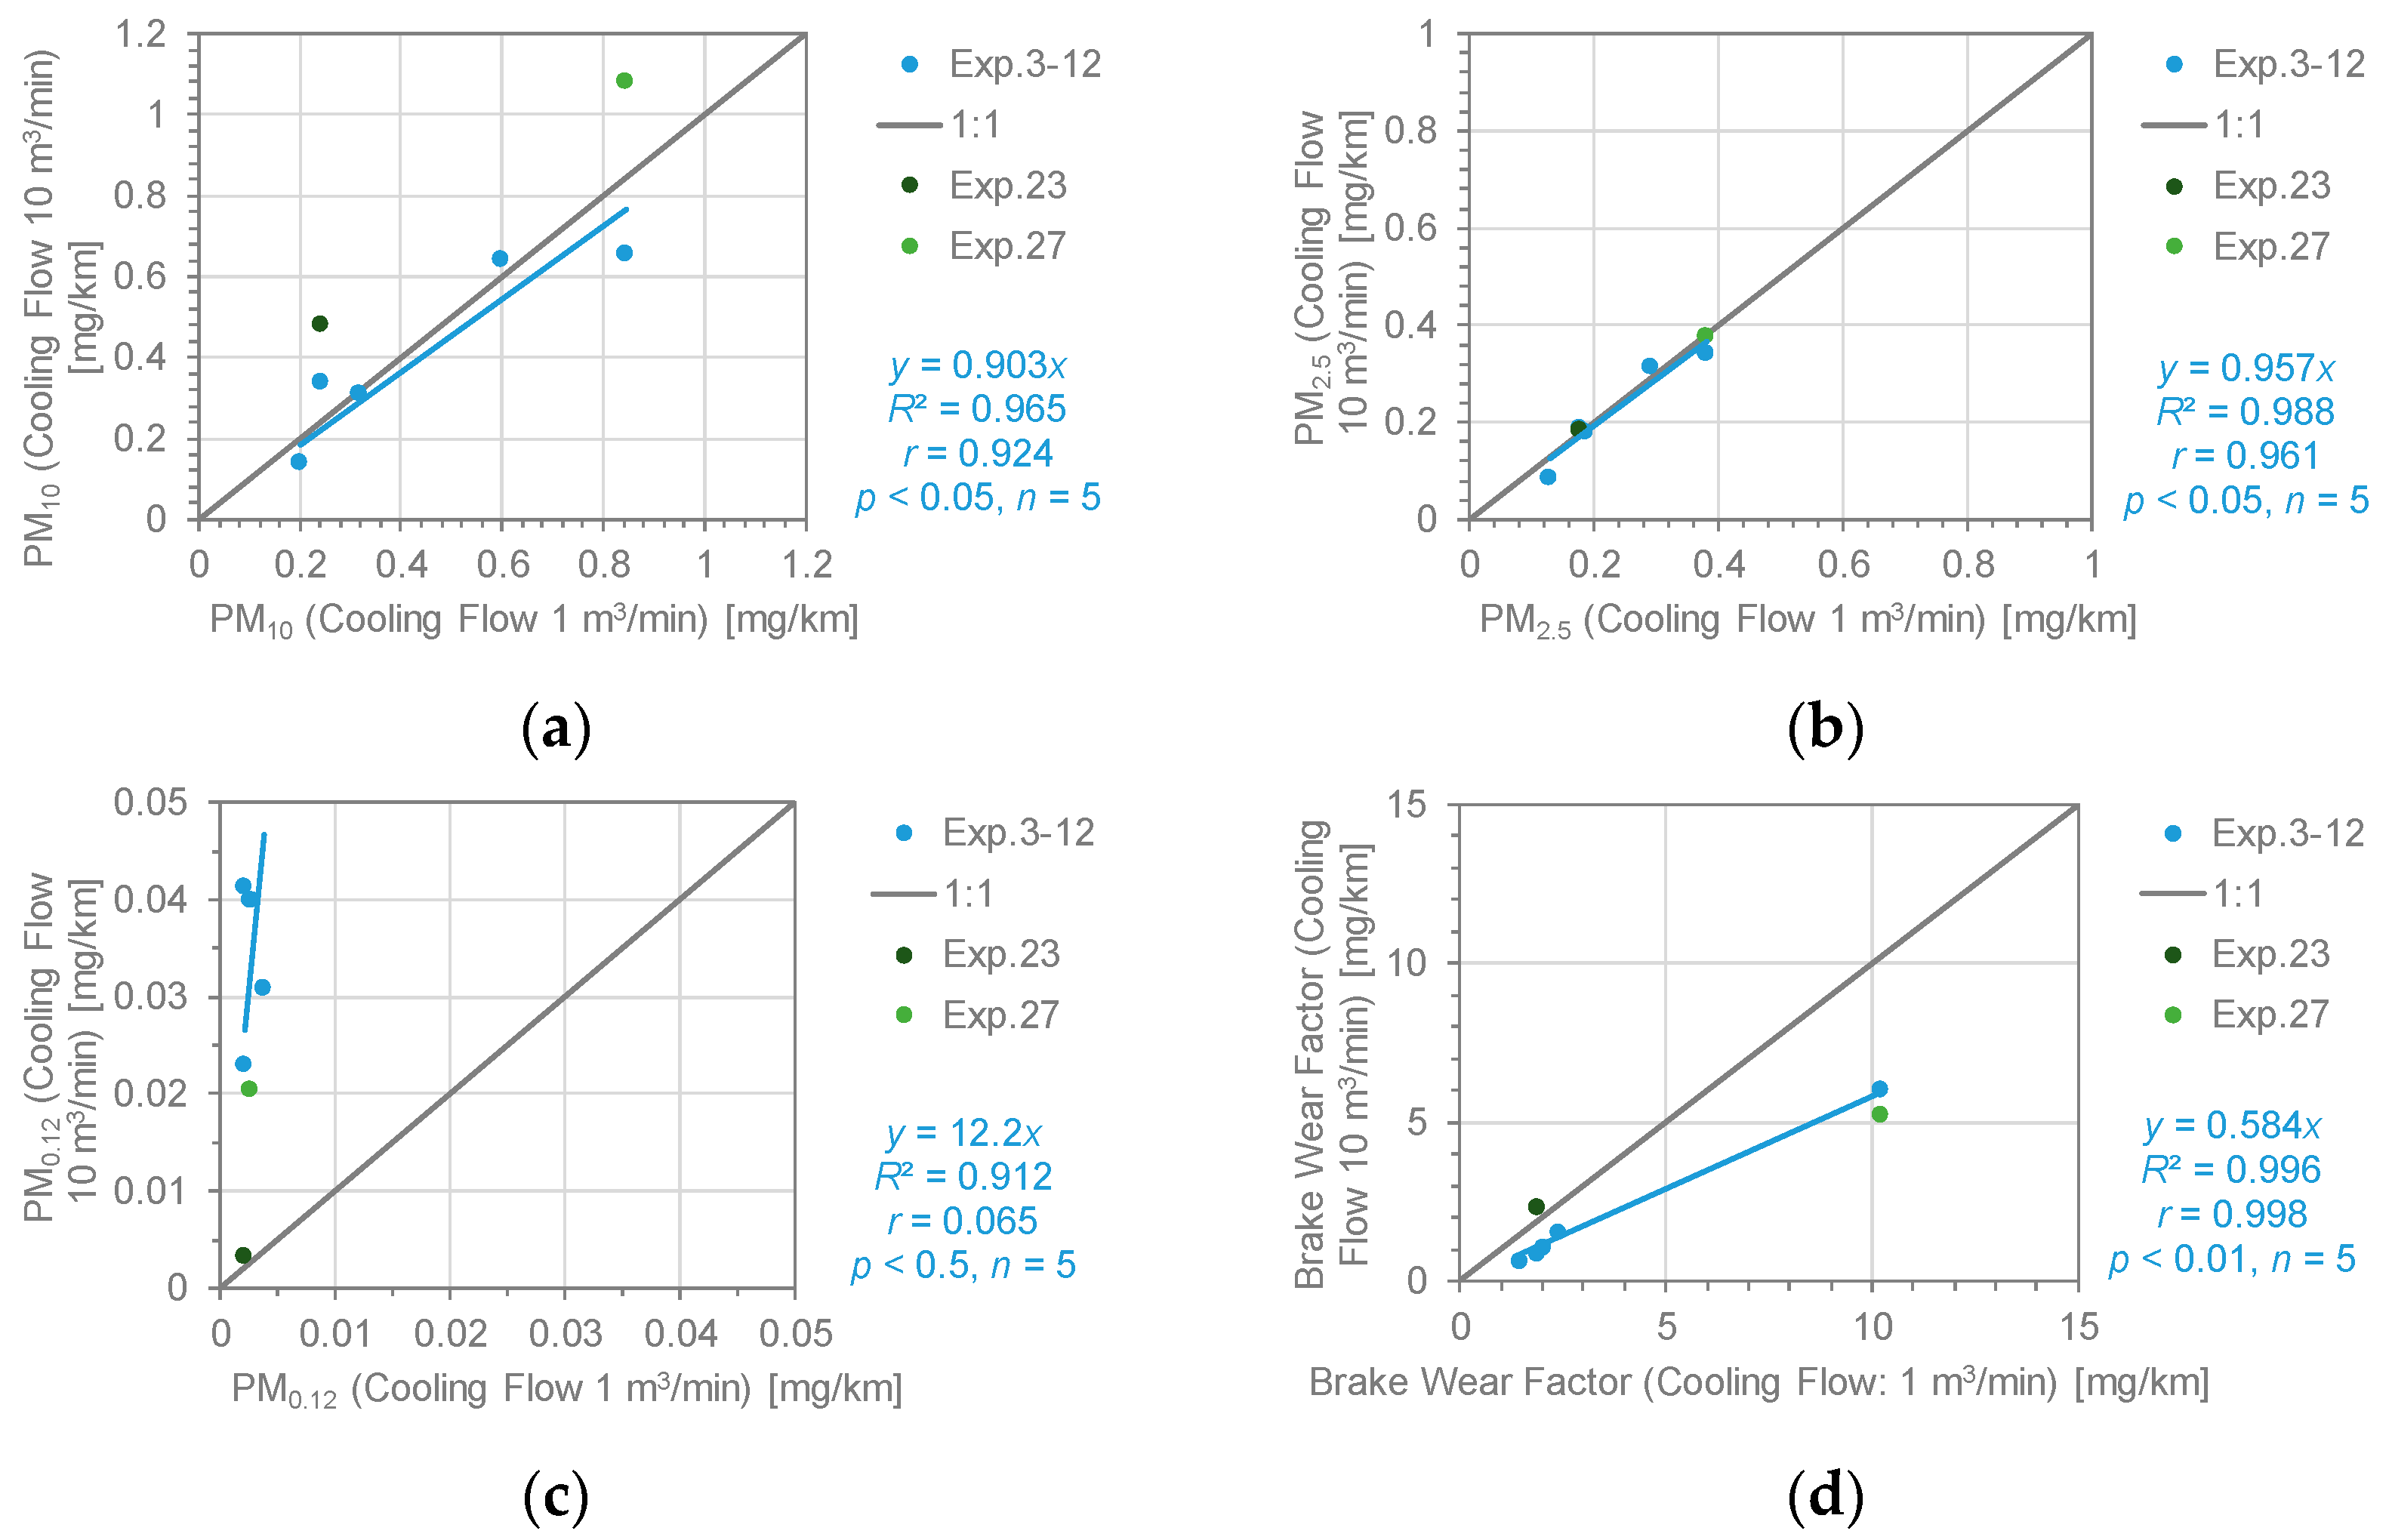
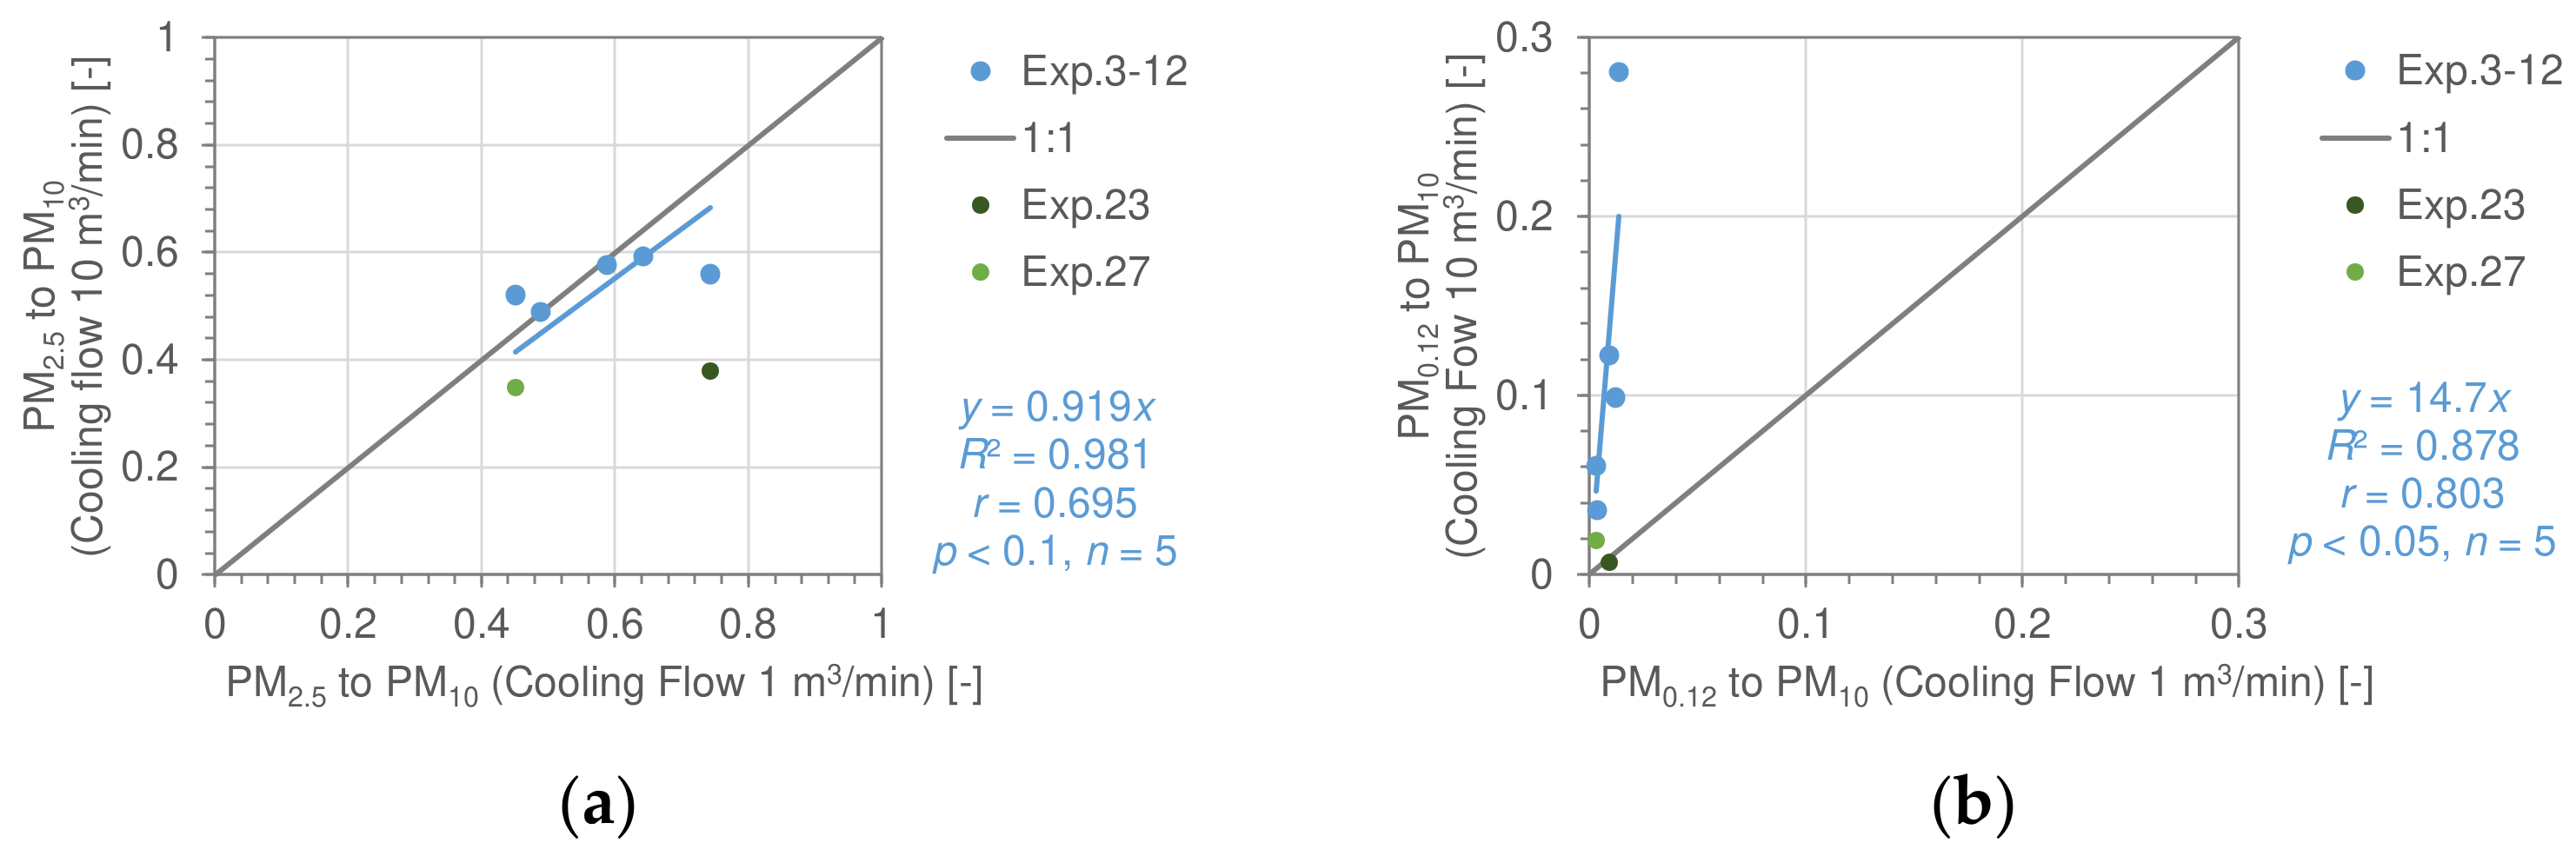
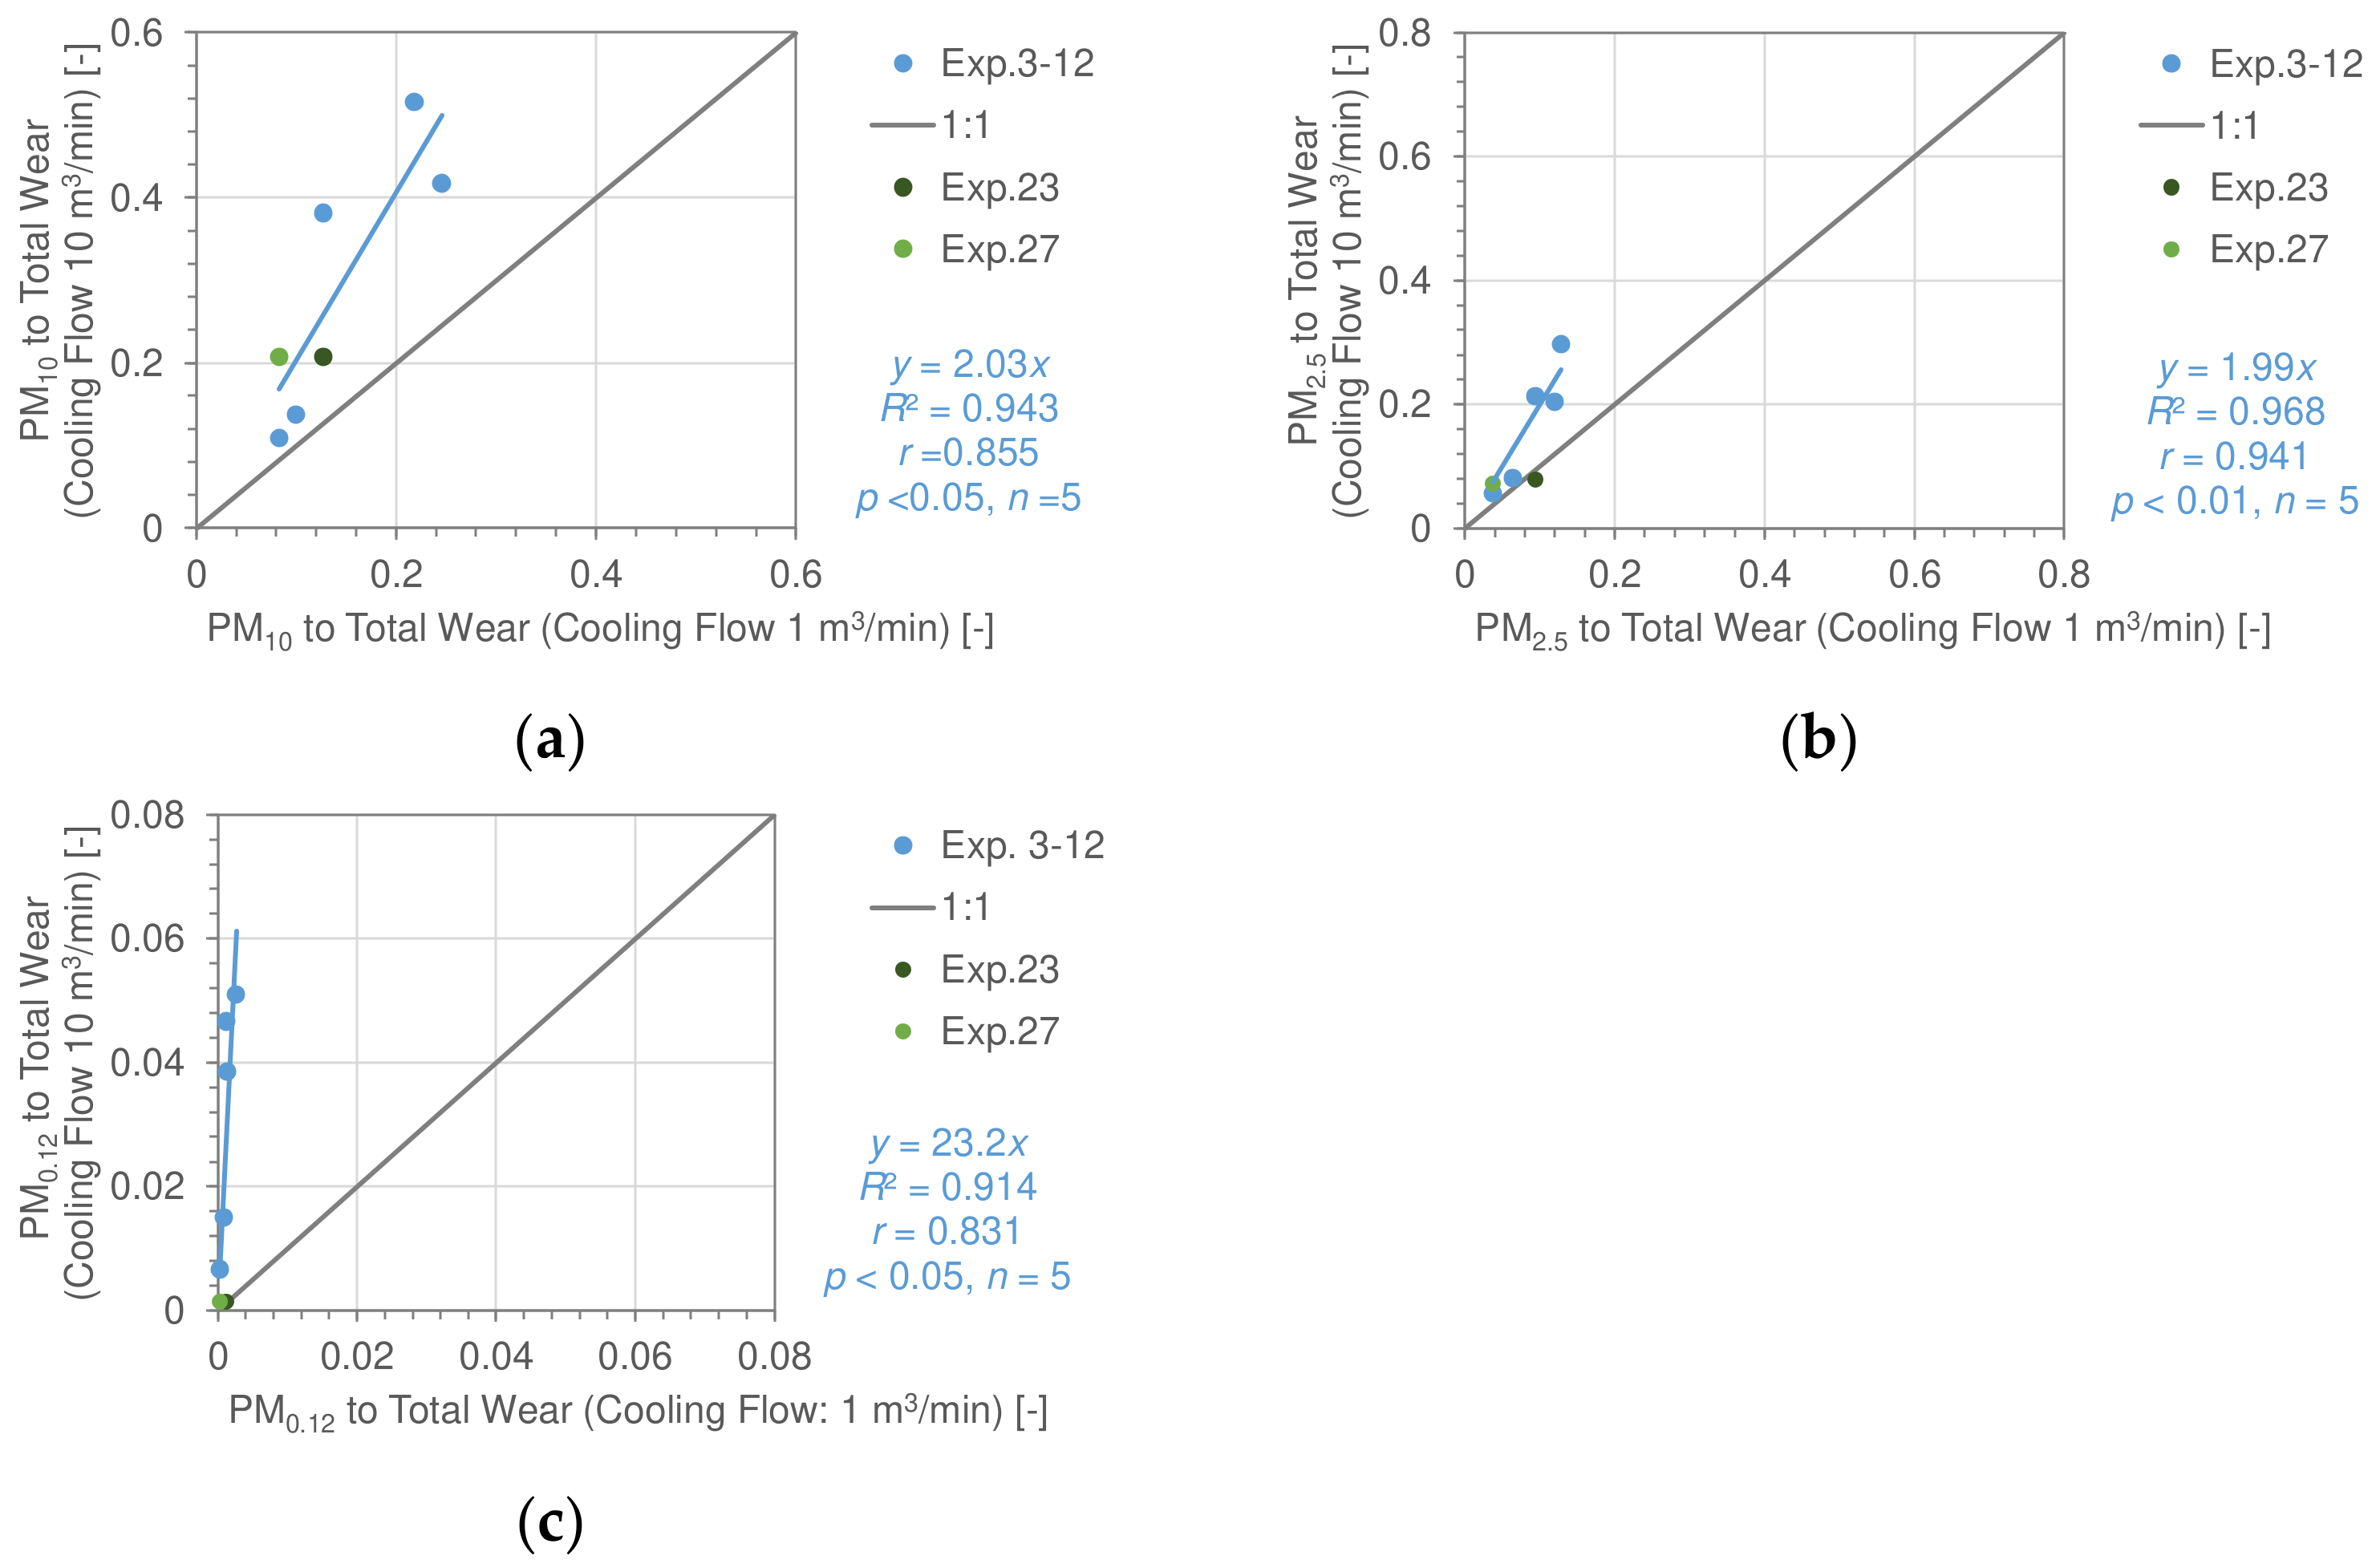
  • Based on the sampling method required by the JASO C470 method, there were no significant differences between cooling air flow rates for PM10, PM2.5, and brake wear particle emissions; however, the total brake wear factor was 58.3% lower at the high flow rate (10 m3/min) compared to the low flow rate (1 m3/min). We also observed that PM0.12 with high cooling air flow rate conditions tended to be 12.2 times higher than low cooling air flow rate conditions.
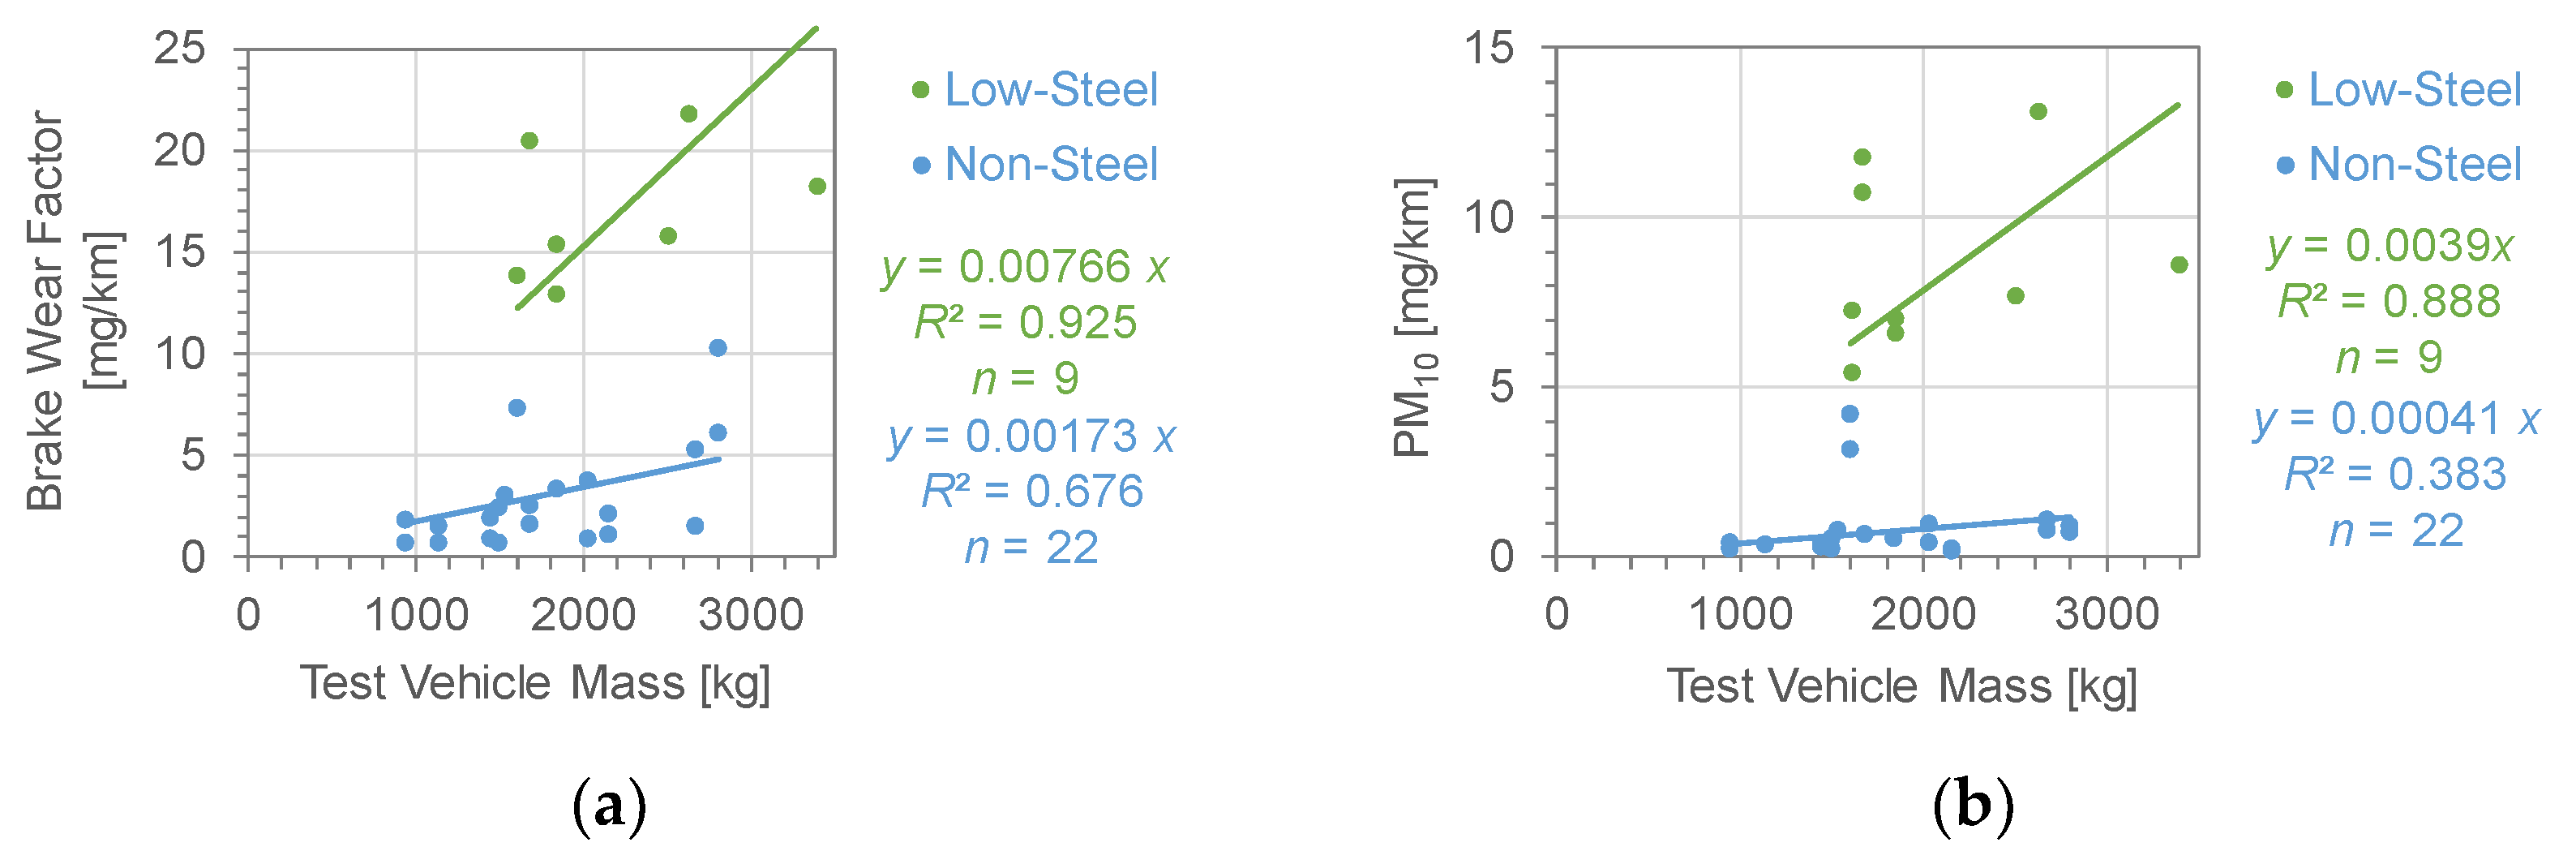
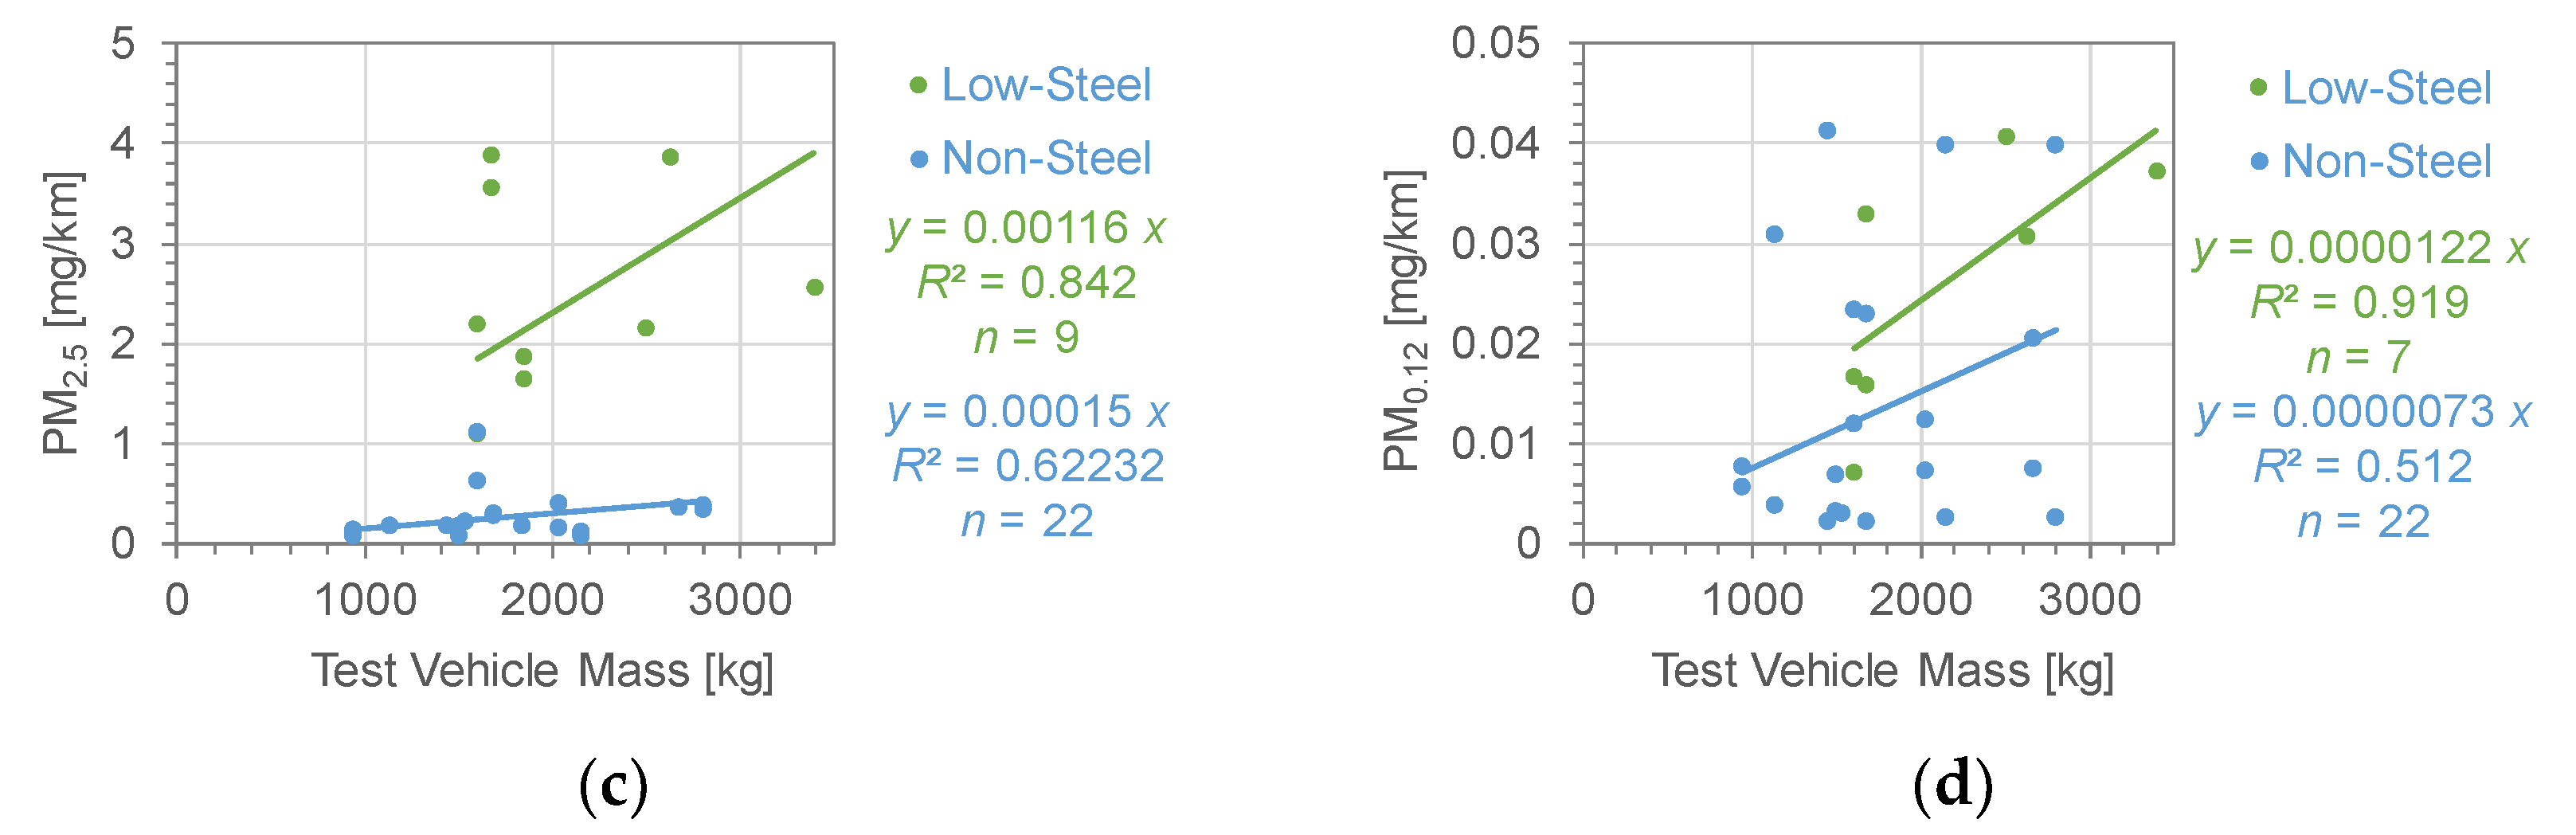
  • Low-steel pads had a PM10 emission of 3.9 mg/km per brake per 1000 kg of vehicle mass, with a large variance, similar to the results of previous studies. There was also a large variation in the correlation between inertia and PM10 emissions, which was also in agreement with the findings of previous studies. In contrast, a PM10 emission of 0.4 mg/km per brake per 1000 kg of vehicle mass was obtained for the non-steel (NAO) pads, which is much lower than that of low-steel pads.
  • For brake wear factors, based on mass loss measurements, 14.0–74.8% of wear particles originated from discs, 14.0–64.4% from non-steel pads, and 55.0–74.8% from low-steel pads. The contribution of disc wear determined from the iron concentration in the brake wear particles was approximately similar to the mass loss measurements, although there was a large variation.
  • The correlation coefficients of the mass content of elements in the pads for the brake wear factor, disc wear factor, PM10, and PM2.5 were very similar; C, Mg, Cr, and Fe mainly had high positive correlation coefficients, and O, K, Ti, and Ba mainly had high negative ones.

Funding

This work was supported by the Japan Society for the Promotion of Science (JSPS) KAKENHI Grant Number JP 22K03895.

Institutional Review Board Statement

Not applicable.

Informed Consent Statement

Not applicable.

Data Availability Statement

All data presented in this study are available upon request from the corresponding author. The data are not publicly available due to a confidentiality agreement with the part providers.

Acknowledgments

The author would like to thank the co-workers who supported the set-up and operation of the dynamometer and the measurements. In addition, the author would like to thank Akiyoshi Ito for proofreading support during the preparation of the draft manuscript.

Conflicts of Interest

The author declares no conflict of interest.

Appendix A. Experimental Conditions

Table A1. Brake assemblies and test conditions used in this study.
Experiment #Test Vehicle MassBrake Force DistributionsTest InertiaRolling RadiusWln/dmAir Flow/DirectionsEnclosure/Tunnel Types
kg%kg-m2mm-m3/min
1943 8028.2293109.01.0, CCWA
2943 8026.7285109.01.0, CCWA
31443 8048.331096.710.0, CCWA
41443 8048.331096.71.0, CCWA
51133 8033.829390.510.0, CCWA
61133 8033.829390.51.0, CCWA
71683 8069.734588.710.0, CCWA
81683 8069.734588.71.0, CCWA
92153 8082.1331111.010.0, CCWA
102153 8082.1331111.01.0, CCWA
112803 80140.938099.810.0, CCWA
122803 80140.938099.81.0, CCWA
131600 71.649.3314.587.68.2, CWB
141600 71.649.3314.587.68.2, CWB
151668 6850.832144.98.2, CWB
162623 67112.138350.38.2, CWB
172500 6786.734589.28.2, CWB
183390 67117.6345120.88.2, CWB
191533 7747.8305111.84.1, CCWC
201600 71.649.3314.587.68.0, CCWC
211600 71.649.3314.587.68.0, CCWC
221668 6850.832144.98.0, CCWC
231500 7748.331097.67.7, CCWC
241500 2314.431047.77.7, CCWC
252030 7784.735370.07.7, CCWC
262030 2325.335337.87.7, CCWC
272670 77129.838189.47.7, CCWC
282670 2338.838141.07.7, CCWC
291840 7777.735577.28.2, CCWC
301840 7777.735577.28.2, CCWC
311840 7777.735577.24.1, CCWC
Figure A1. Schematic diagram of the enclosure/tunnel types. (a) Type A. (b) Type B. (c) Type C.
Lubricants 12 00206 g0a1
Figure A2. The brake temperature tolerances, the mean disc temperature, the initial brake temperature (IBT), and the final brake temperature (FBT) for trip#10.
Lubricants 12 00206 g0a2

Appendix B. Elements in the Brake Pads

Table A2. Example of mass percentages of the elements in the brake pads used in this study.
Experiment #TypeCOFNaMgAlSiPSClKCaTi
Mass Percent [%]
1Non-steel24.532.21.30.20.20.63.70.011.3 2.86.79.8
2Non-steel24.532.21.30.20.20.63.70.011.3 2.86.79.8
3Non-steel31.532.60.60.11.00.62.30.021.50.012.94.67.3
4Non-steel31.532.60.60.11.00.62.30.021.50.012.94.67.3
5Non-steel26.232.32.00.20.91.32.70.021.4 3.72.410.0
6Non-steel26.232.32.00.20.91.32.70.021.4 3.72.410.0
7Non-steel31.632.90.10.22.00.31.30.0032.30.024.33.09.0
8Non-steel31.632.90.10.22.00.31.30.0032.30.024.33.09.0
9Non-steel30.131.21.60.30.50.82.80.011.50.011.62.87.1
10Non-steel30.131.21.60.30.50.82.80.011.50.011.62.87.1
11Non-steel31.532.60.60.11.00.62.30.021.50.012.94.67.3
12Non-steel31.532.60.60.11.00.62.30.021.50.012.94.67.3
13Low-steel40.829.80.4 3.74.52.10.081.60.060.60.20.1
14Non-steel27.433.70.70.12.30.73.10.031.50.093.01.77.1
15Low-steel42.528.90.30.16.10.63.70.151.70.020.20.40.1
16Low-steel44.627.00.60.047.42.91.10.010.90.020.60.72.0
17Low-steel38.030.90.3 4.50.82.90.022.20.020.30.40.1
18Low-steel38.030.90.3 4.50.82.90.022.20.020.30.40.1
19Non-steel34.733.30.10.12.70.92.90.011.20.023.30.95.9
20Low-steel40.829.80.4 3.74.52.10.081.60.060.60.20.1
21Non-steel27.433.70.70.12.30.73.10.031.50.093.01.77.1
22Low-steel42.528.90.30.16.10.63.70.151.70.020.20.40.1
23Non-steel31.532.60.60.11.00.62.30.021.50.012.94.67.3
24Non-steel27.933.70.10.30.80.31.20.012.70.023.83.211.6
25Non-steel31.532.60.60.11.00.62.30.021.50.012.94.67.3
26Non-steel31.632.90.10.22.00.31.30.0032.30.024.33.09.0
27Non-steel31.532.60.60.11.00.62.30.021.50.012.94.67.3
28Non-steel30.135.63.70.32.81.02.80.021.5 2.81.45.6
29Low-steel41.328.00.2 1.93.21.70.011.40.010.21.40.1
30Low-steel38.830.20.10.052.51.04.30.052.40.050.40.70.1
31Non-steel24.729.60.70.10.90.61.90.032.30.032.83.76.4
Experiment #TypeCrMnFeNiCuZnSrZrMoSnSbBaHf
Mass Percent [%]
1Non-steel 0.051.10.0021.90.030.077.6 1.24.20.7
2Non-steel 0.051.10.0021.90.030.077.6 1.24.20.7
3Non-steel0.010.092.70.010.0020.20.085.90.4 1.43.60.5
4Non-steel0.010.092.70.010.0020.20.085.90.4 1.43.60.5
5Non-steel 0.044.50.0030.0021.40.052.6 2.75.50.1
6Non-steel 0.044.50.0030.0021.40.052.6 2.75.50.1
7Non-steel0.010.010.10.0040.0051.10.183.9 7.40.1
8Non-steel0.010.010.10.0040.0051.10.183.9 7.40.1
9Non-steel0.010.064.80.0050.70.050.075.7 2.5 5.60.1
10Non-steel0.010.064.80.0050.70.050.075.7 2.5 5.60.1
11Non-steel0.010.092.70.010.0020.20.085.90.4 1.43.60.5
12Non-steel0.010.092.70.010.0020.20.085.90.4 1.43.60.5
13Low-steel1.500.057.40.023.11.90.0020.020.11.7
14Non-steel0.010.011.10.011.90.020.18.3 1.2 4.51.2
15Low-steel1.200.077.30.010.020.010.07 1.8 2.5
16Low-steel0.850.069.40.020.0081.20.0010.03 0.5 0.0
17Low-steel0.780.089.40.0072.71.60.060.003 2.2 2.8
18Low-steel0.780.089.40.0072.71.60.060.003 2.2 2.8
19Non-steel 0.056.60.011.8 0.060.3 1.14.0
20Low-steel1.500.057.40.023.11.90.0020.020.11.7
21Non-steel0.010.011.10.011.80.020.18.3 1.2 4.51.2
22Low-steel1.200.077.30.010.020.010.07 1.8 2.5
23Non-steel0.010.092.70.010.0020.190.085.90.4 1.43.60.5
24Non-steel0.010.010.20.0050.0051.20.24.3 8.40.1
25Non-steel0.010.092.70.010.0020.20.085.90.4 1.43.60.5
26Non-steel0.010.010.10.0040.0051.10.23.9 7.40.1
27Non-steel0.010.092.70.010.0020.20.085.90.4 1.43.60.5
28Non-steel 0.045.80.002 0.010.050.1 6.2
29Low-steel0.950.0510.30.0072.41.80.004 1.03.6 0.4
30Low-steel1.540.059.60.012.51.00.050.011.00.41.41.8
31Non-steel0.010.103.00.010.0050.020.112.20.2 1.66.02.7

Appendix C. Elements in the Brake Discs

Table A3. Example of mass percentages of the elements in the brake discs used in this study.
Experiment #COSiPSMnFeNiCuZn
Mass Percent [%]
13.712.62.10.030.20.679.40.010.10.09
23.712.62.10.030.20.679.40.010.10.09
33.911.61.80.030.10.581.10.020.060.01
43.911.61.80.030.10.581.10.020.060.01
53.514.01.80.020.20.578.4 0.030.07
63.514.01.80.020.20.578.4 0.030.07
79.73.11.90.050.10.683.90.020.040.02
89.73.11.90.050.10.683.90.020.040.02
93.816.72.00.020.40.574.40.020.30.01
103.816.72.00.020.40.574.40.020.30.01
113.86.71.80.030.10.686.50.020.050.01
123.86.71.80.030.10.686.50.020.050.01
1310.81.41.70.030.10.684.70.050.2
1410.81.41.70.030.10.684.70.050.2
1510.92.61.60.050.10.882.90.050.50.01
169.26.71.60.040.10.680.90.050.20.01
174.813.51.50.030.20.777.80.050.70.05
184.813.51.50.030.20.777.80.050.70.05
193.911.61.80.030.10.581.10.020.060.01
2010.81.41.70.030.10.684.70.050.2
2110.81.41.70.030.10.684.70.050.2
2210.92.61.60.050.10.882.90.050.50.01
233.911.61.80.030.10.581.10.020.060.01
244.010.11.70.030.20.682.30.010.050.04
254.113.51.70.030.10.579.00.020.030.02
263.58.71.70.030.20.684.6 0.040.02
273.86.71.80.030.10.686.50.020.050.01
283.28.81.80.030.10.584.80.020.040.01
299.73.11.90.050.10.683.90.020.040.02
309.73.11.90.050.10.683.90.020.040.02
319.73.11.90.050.10.683.90.020.040.02

References

  1. Maricq, M.M. Engine, Aftertreatment, Fuel Quality and Non-tailpipe Achievements to Lower Gasoline Vehicle PM Emissions: Literature Review and Future Prospects. Sci. Total Environ. 2023, 866, 161225. [Google Scholar] [CrossRef] [PubMed]
  2. Fussell, J.C.; Franklin, M.; Green, D.C.; Gustafsson, M.; Harrison, R.M.; Hicks, W.; Kelly, F.J.; Kishta, F.; Miller, M.R.; Mudway, I.S.; et al. A Review of Road Traffic-Derived Non-Exhaust Particles: Emissions, Physicochemical Characteristics, Health Risks, and Mitigation Measures. Environ. Sci. Technol. 2022, 56, 6813–6835. [Google Scholar] [CrossRef] [PubMed]
  3. Grigoratos, T.; Martini, G. Brake Wear Particle Emissions: A Review. Environ. Sci. Pollut. Res. 2015, 22, 2491–2504. [Google Scholar] [CrossRef] [PubMed]
  4. Grange, S.K.; Fischer, A.; Zellweger, C.; Alastuey, A.; Querol, X.; Jaffrezo, J.-L.; Weber, S.; Uzu, G.; Hueglin, C. Switzerland’s PM10 and PM2.5 Environmental increments show the Importance of Non-exhaust Emissions. Atmos. Environ. X 2021, 12, 100145. [Google Scholar] [CrossRef]
  5. Piscitello, A.; Bianco, C.; Casasso, A.; Sethi, R. Non-exhaust Traffic Emissions: Sources, Characterization, and Mitigation Measures. Sci. Total Environ. 2021, 766, 144440. [Google Scholar] [CrossRef] [PubMed]
  6. Grigoratos, T.; Mathissen, M.; Vedula, R.; Mamakos, A.; Agudelo, C.; Gramstat, S.; Giechaskiel, B. Interlaboratory Study on Brake Particle Emissions—Part I: Particulate Matter Mass Emissions. Atmosphere 2023, 14, 498. [Google Scholar] [CrossRef]
  7. ECE/TRANS/180/Add.24. UN Global Technical Regulation No. 24 Laboratory Measurement of Brake Emissions for Light-Duty Vehicles. Update on 17 July 2023. Available online: https://unece.org/sites/default/files/2023-07/ECE-TRANS-180-Add.24.docx (accessed on 8 May 2024).
  8. JASO C470; Passenger Car—Measurement Method for Brake Wear Particle Emissions. Society of Automotive Engineers of Japan Inc.: Tokyo, Japan, 31 March 2020.
  9. Regulation (EU) 2024/1257 of the European Parliament and of the Council. Document 32024R1257. Official Journal of the European Union. Available online: https://eur-lex.europa.eu/legal-content/EN/TXT/?uri=OJ:L_202401257 (accessed on 8 May 2024).
  10. Mellios, G.; Ntziachristos, L. Non-Exhaust Emissions: Evaporation & Brake Wear Control. 2021. Available online: https://circabc.europa.eu/sd/a/1c0efc15-8507-4797-9647-97c12d82fa28/AGVES-2021-04-08-EVAP_Non-Exh.pdf (accessed on 22 November 2022).
  11. Shibata, Y.; Morikawa, T. Review of the JCAP/JATOP Air Quality Model Study in Japan. Atmosphere 2021, 12, 943. [Google Scholar] [CrossRef]
  12. Kasai, A. Measures to Reduce Emissions of Particulate Matter from Motor Vehicles. J. Jpn. Soc. Atmos. Environ. 2017, 52, A91–A96. (In Japanese) [Google Scholar] [CrossRef]
  13. Archard, J.F. Contact and Rubbing of Flat Surfaces. J. Appl. Phys. 1953, 24, 981–988. [Google Scholar] [CrossRef]
  14. Mathissen, M.; Grochowicz, J.; Schmidt, C.; Vogt, R.; Zum Hagen, F.H.F.; Grabiec, T.; Steven, H.; Grigoratos, T. A Novel Real-World Braking Cycle for Studying Brake Wear Particle Emissions. Wear 2018, 414–415, 219–226. [Google Scholar] [CrossRef]
  15. Chan, D.; Stachowiak, G.W. Review of Automotive Brake Friction Materials. Proc. Inst. Mech. Eng. Part D J. Automob. Eng. 2004, 218, 953–966. [Google Scholar] [CrossRef]
  16. Österle, W.; Dmitriev, A.I. The Role of Solid Lubricants for Brake Friction Materials. Lubricants 2016, 4, 5. [Google Scholar] [CrossRef]
  17. Joo, B.S.; Chang, Y.H.; Seo, H.J.; Jang, H. Effects of Binder Resin on Tribological Properties and Particle Emission of Brake Linings. Wear 2019, 434–435, 202995. [Google Scholar] [CrossRef]
  18. Park, J.; Gweon, J.; Seo, H.; Song, W.; Lee, J.J.; Choi, J.; Kim, Y.C.; Jang, H. Effect of Space Fillers in Brake Friction Composites Airborne Particle Emission: A Case Study with BaSO4, Ca(OH)2, and CaCO3. Tribol. Int. 2021, 165, 107334. [Google Scholar] [CrossRef]
  19. Joo, B.S.; Jara, D.C.; Seo, H.J.; Jang, H. Influences of The Average Molecular Weight of Phenolic Resin and Potassium Titanate Morphology on Particulate Emissions from Brake Linings. Wear 2020, 450–451, 203243. [Google Scholar] [CrossRef]
  20. Park, J.; Song, W.; Gweon, J.; Seo, H.; Lee, J.J.; Jang, H. Size Effect of Zircon Particles in Brake Pads on the Composition and Size Distribution of Emitted Particulate Matter. Tribol. Int. 2021, 160, 106995. [Google Scholar] [CrossRef]
  21. Park, J.; Joo, B.; Seo, H.; Song, W.; Lee, J.J.; Lee, W.K.; Jang, H. Analysis of Wear Induced Particle Emissions from Brake Pads during the Worldwide Harmonized Light Vehicles Test Procedure (WLTP). Wear 2021, 466–467, 203539. [Google Scholar] [CrossRef]
  22. Sanders, P.G.; Xu, N.; Dalka, T.M.; Maricq, M.M. Airborne Brake Wear Debris: Size Distributions, Composition, and a Comparison of Dynamometer and Vehicle Tests. Environ. Sci. Technol. 2003, 37, 4060–4069. [Google Scholar] [CrossRef]
  23. Woo, S.H.; Kim, Y.; Lee, S.; Choi, Y.; Lee, S. Characteristics of Brake Wear Particle (BWP) Emissions under Various Test Driving Cycles. Wear 2021, 480–481, 203936. [Google Scholar] [CrossRef]
  24. Giechaskiel, B.; Grigoratos, T.; Dilara, P.; Karageorgiou, T.; Ntziachristos, L.; Samaras, Z. Light-Duty Vehicle Brake Emission Factors. Atmosphere 2024, 15, 97. [Google Scholar] [CrossRef]
  25. Woo, S.-H.; Jang, H.; Na, M.Y.; Chang, H.J.; Lee, S. Characterization of Brake Particles Emitted from Non-Asbestos Organic and Low-Metallic Brake Pads under Normal and Harsh Braking Conditions. Atmos. Environ. 2022, 278, 119089. [Google Scholar] [CrossRef]
  26. Storch, L.; Hamatschek, C.; Hesse, D.; Feist, F.; Bachmann, T.; Eichler, P.; Grigoratos, T. Comprehensive Analysis of Current Primary Measures to Mitigate Brake Wear Particle Emissions from Light-Duty Vehicles. Atmosphere 2023, 14, 712. [Google Scholar] [CrossRef]
  27. Davin, E.A.T.; Cristol, A.-L.; Beaurain, A.; Dufrénoy, P.; Zaquen, N. Differences in Wear and Material Integrity of NAO and Low-Steel Brake Pads under Severe Conditions. Materials 2021, 14, 5531. [Google Scholar] [CrossRef]
  28. Perricone, G.; Matějka, V.; Alemani, M.; Valota, G.; Bonfanti, A.; Ciotti, A.; Olofsson, U.; Söderberg, A.; Wahlström, J.; Nosko, O.; et al. A Concept for Reducing PM10 Emissions for Car Brakes by 50%. Wear 2018, 396, 135–145. [Google Scholar] [CrossRef]
  29. Agudelo, C.; Vedula, R.; Collier, S.; Stanard, A. Brake Particulate Matter Emissions Measurements for Six Light-Duty Vehicles Using Inertia Dynamometer Testing. SAE Int. J. Adv. Curr. Prac. Mobil. 2021, 3, 994–1019. [Google Scholar] [CrossRef]
  30. Aranganathan, N.; Mahale, V.; Bijwe, U. Effects of Aramid Fiber Concentration on the Friction and Wear Characteristics of Non-Asbestos Organic Friction Composites using Standardized Braking Tests. Wear 2016, 354–355, 69–77. [Google Scholar] [CrossRef]
  31. Kato, T.; Magario, A. The Wear of Aramid Fiber Reinforced Brake Pads: The Role of Aramid Fibers. Tribo Trans. 1994, 37, 559–565. [Google Scholar] [CrossRef]
  32. Song, W.; Park, J.; Choi, J.; Lee, J.J.; Jang, H. Effects of Reinforcing Fibers on Airborne Particle Emissions from Brake Pads. Wear 2021, 484–485, 203996. [Google Scholar] [CrossRef]
  33. Okayama, K.; Kishimoto, H.; Hiratsuka, K. Tribo-Reduction of Metal Oxides by Tribo-Degradation of Phenolic Resin in Brake Pads. Trans. Jpn. Soc. Mech. Eng. C 2013, 79, 2558–2570, (In Japanese with English Figures and Tables). [Google Scholar] [CrossRef]
  34. JIS D 0210:1995; General Rules of Brake Test Method of Automobiles and Motor Cycles. Japanese Standards Association: Tokyo, Japan, 2022.
  35. Hagino, H.; Oyama, M.; Sasaki, S. Laboratory Testing of Airborne Brake Wear Particle Emissions using a Dynamometer System under Urban City Driving Cycles. Atmos. Environ. 2016, 131, 269–278. [Google Scholar] [CrossRef]
  36. Hagino, H.; Iwata, A.; Okuda, T. Iron Oxide and Hydroxide Speciation in Emissions of Brake Wear Particles from Different Friction Materials Using an X-ray Absorption Fine Structure. Atmosphere 2024, 15, 49. [Google Scholar] [CrossRef]
  37. Hagino, H. Feasibility of Measuring Brake-Wear Particle Emissions from a Regenerative-Friction Brake Coordination System via Dynamometer Testing. Atmosphere 2024, 15, 75. [Google Scholar] [CrossRef]
  38. Sinha, A.; Ischia, G.; Menapace, C.; Gialanella, S. Experimental Characterization Protocols for Wear Products from Disc Brake Materials. Atmosphere 2020, 11, 1102. [Google Scholar] [CrossRef]
  39. Kenny, L.C.; Gussman, R.; Meyer, M. Development of a Sharp-Cut Cyclone for Ambient Aerosol Monitoring Applications. Aerosol Sci. Technol. 2000, 32, 338–358. [Google Scholar] [CrossRef]
  40. Spada, N.J.; Yatkin, S.; Giacomo, J.; Trzepla, K.; Hyslop, N.P. Evaluating IMPROVE PM2.5 Element Measurements. J. Air Waste Manag. Assoc. 2023, 73, 843–852. [Google Scholar] [CrossRef] [PubMed]
  41. Namgung, H.G.; Kim, J.B.; Woo, S.H.; Park, S.; Kim, M.; Kim, M.S.; Bae, G.N.; Park, D.; Kwon, S.B. Generation of Nanoparticles from Friction between Railway Brake Disks and Pads. Environ. Sci. Technol. 2016, 50, 3453–3461. [Google Scholar] [CrossRef]
  42. Hinds, W.C.; Yifang, Z. Chapter 4—Particle Size Statics. In Aerosol Technology: Properties, Behavior, and Measurement of Airborne Particles, 3rd ed.; John Wiley & Sons, Inc.: Hoboken, NJ, USA, 2022; pp. 65–94. ISBN 978-1-119-49406-5. [Google Scholar]
  43. Durand, T.; Bau, S.; Morele, Y.; Matera, V.; Bémer, D.; Rousset, D. Quantification of Low Pressure Impactor Wall Deposits during Zinc Nanoparticle Sampling. Aerosol Air Qual. Res. 2014, 14, 1812–1821. [Google Scholar] [CrossRef]
  44. Mamakos, A.; Kolbeck, K.; Arndt, M.; Schröder, T.; Bernhard, M. Particle Emissions and Disc Temperature Profiles from a Commercial Brake System Tested on a Dynamometer under Real-World Cycles. Atmosphere 2021, 12, 377. [Google Scholar] [CrossRef]
  45. Andersson, J.; Kramer, L.J.; Campbell, M.; Marshall, I.; Norris, J.; Southgate, J.; de Vries, S.; Waite, G. A Practical Approach for On-Road Measurements of Brake Wear Particles from a Light-Duty Vehicle. Atmosphere 2024, 15, 224. [Google Scholar] [CrossRef]
  46. Bondorf, L.; Köhler, L.; Grein, T.; Epple, F.; Philipps, F.; Aigner, M.; Schripp, T. Airborne Brake Wear Emissions from a Battery Electric Vehicle. Atmosphere 2023, 14, 488. [Google Scholar] [CrossRef]
  47. Farwick Zum Hagen, F.H.; Mathissen, M.; Grabiec, T.; Hennicke, T.; Rettig, M.; Grochowicz, J.; Vogt, R.; Benter, T. On-Road Vehicle Measurements of Brake Wear Particle Emissions. Atmos. Environ. 2019, 217, 116943. [Google Scholar] [CrossRef]
  48. Iijima, A.; Sato, K.; Yano, K.; Kato, M.; Kozawa, K.; Furuta, N. Emission Factor for Antimony in Brake Abrasion Dusts as One of the Major Atmospheric Antimony Sources. Environ. Sci. Technol. 2008, 42, 2937–2942. [Google Scholar] [CrossRef] [PubMed]
  49. Hulskotte, J.; Roskam, G.D.; Denier van der Gon, H. Elemental Composition of Current Automotive Braking Materials and derived Air Emission Factors. Atmos. Environ. 2014, 99, 436–445. [Google Scholar] [CrossRef]
  50. Sakamoto, T.; Yoshida, C.; Yoshikawa, K.; Takada, H.; Nakamura, I. The Role of Tramp Elements of Cast Pig Iron. J. Jpn. Foundry Eng. Soc. 1981, 53, 466–471. (In Japanese) [Google Scholar] [CrossRef]
  51. Gramstat, S.; Mertens, T.; Waninger, R.; Lugovyy, D. Impacts on Brake Particle Emission Testing. Atmosphere 2020, 11, 1132. [Google Scholar] [CrossRef]
  52. Kimoto, K. Current Trends and Development of Phenolic Resins Used for Riction Materials. J. Netw. Poly. Jpn. 2014, 35, 211–217, (In Japanese with English Figures and Tables). [Google Scholar] [CrossRef]
  53. Nidhi, J.; Bijwe, N.; Mazumdar, N. Influence of Amount and Modification of Resin on Fade and Recovery Behavior of Non-Asbestos Organic (NAO) Friction Materials. Tribol. Lett. 2006, 23, 215–222. [Google Scholar] [CrossRef]
  54. Öztürk, B.; Öztürk, S. Effects of Resin Type and Fiber Length on the Mechanical and Tribological Properties of Brake Friction Materials. Tribol. Lett. 2011, 42, 339–350. [Google Scholar] [CrossRef]
  55. Mizuta, K.; Nishizawa, Y.; Sugimoto, K.; Okayama, K.; Hase, A. Evaluation of Friction Phenomena of Brake Pads by Acoustic Emission Method. SAE Int. J. Commer. Veh. 2014, 7, 703–709. [Google Scholar] [CrossRef]
  56. Masotti, D.; Ferreira, N.; Neis, P.; Menetrier, A.; Matozo, L.; Varante, P. Evaluation of Creep Groan Phenomena of Brake Pad Materials Using Different Abrasive Particles; SAE Technical Paper; SAE International: Pittsburgh, PA, USA, 2014. [Google Scholar] [CrossRef]
  57. Masotti, D.; Gomes, T.R.; Ordoñez, M.F.C.; Al-Qureshi, H.A.; Farias, M.C.M. Effect of Abrasives’ Characteristics on Brake Squeal Noise Generation. Wear 2023, 518–519, 204618. [Google Scholar] [CrossRef]
  58. Eriksson, M.; Bergman, F.; Jacobson, S. On the Nature of Tribological Contact in Automotive Brakes. Wear 2002, 252, 26–36. [Google Scholar] [CrossRef]
  59. Hiratsuka, K.; Yoshida, T. The Twin-Ting Tribometer—Characterizing Sliding Wear of Metals Excluding the Effect of Contact Configurations. Wear 2011, 270, 742–750. [Google Scholar] [CrossRef]
  60. Berthier, Y. Third-Body Reality—Consequences and Use of the Third-Body Concept to Solve Friction and Wear Problems. In Wear—Materials, Mechanisms and Practice; John Wiley & Sons Ltd.: Hoboken, NJ, USA, 2014; pp. 291–316. [Google Scholar] [CrossRef]
  61. Lee, J.-J.; Lee, J.-A.; Kwon, S.; Kim, J.-J. Effect of Different Reinforcement Materials on the Formation of Secondary Plateaus and Friction Properties in Friction Materials for Automobiles. Tribol. Int. 2018, 120, 70–79. [Google Scholar] [CrossRef]
  62. Jang, H.; Ko, K.; Kim, S.J.; Basch, R.H.; Fash, J.W. The Effect of Metal Fibers on the Friction Performance of Automotive Brake Friction Materials. Wear 2004, 256, 406–414. [Google Scholar] [CrossRef]
  63. Yanar, H.; Purcek, G.; Ayar, H.H. Effect of Steel Fiber Addition on the Mechanical and Tribological Behavior of the Composite Brake Pad Materials. IOP Conf. Ser. Mater. Sci. Eng. 2020, 724, 012018. [Google Scholar] [CrossRef]
  64. Halberstadt, M.L.; Rhee, S.K.; Mansfield, J.A. Effects of Potassium Titanate Fiber on the Wear of Automotive Brake Linings. Wear 1978, 46, 109–126. [Google Scholar] [CrossRef]
  65. Kim, Y.C.; Cho, M.H.; Kim, S.J.; Jang, H. The Effect of Phenolic Resin, Potassium Titanate, and CNSL on the Tribological Properties of Brake Friction Materials. Wear 2008, 264, 204–210. [Google Scholar] [CrossRef]
  66. Cho, K.H.; Cho, M.H.; Kim, S.J.; Jang, H. Tribological Properties of Potassium Titanate in the Brake Friction Material; Morphological Effects. Tribol. Lett. 2008, 32, 59–66. [Google Scholar] [CrossRef]
  67. Jara, D.C.; Jang, H. Synergistic Effects of the Ingredients of Brake Friction Materials on Friction and Wear: A Case Study on Phenolic Resin and Potassium Titanate. Wear 2019, 430–431, 222–232. [Google Scholar] [CrossRef]
  68. Daimon, E.; Nomoto, T.; Inada, K.; Ogawa, H.; Kitada, K.; O’Doherty, J. Chemical Effects of Titanate Compounds on the Thermal Reactions of Phenolic Resins in Friction Materials—Part 3; SAE Technical Paper 2013-01-2025; SAE International: Pittsburgh, PA, USA, 2013. [Google Scholar] [CrossRef]
  69. Kim, S.J.; Cho, M.H.; Lim, D.-S.; Jang, H. Synergistic Effects of Aramid Pulp and Potassium Titanate Whiskers in the Automotive Friction Material. Wear 2001, 251, 1484–1491. [Google Scholar] [CrossRef]
  70. Okayama, K.; Fujikawa, H. Friction Material for Brake. Japanese Patent JP2005273770A, 24 March 2004. [Google Scholar]
  71. Singh, T. Comparative Performance of Barium Sulphate and Cement by-pass Dust on Tribological Properties of Automotive Brake Friction Composites. Alex. Eng. J. 2023, 72, 339–349. [Google Scholar] [CrossRef]
  72. Fang, T.; Kapur, S.; Edwards, K.C.; Hagino, H.; Wingen, L.M.; Perraud, V.; Thomas, A.E.; Bliss, B.; Herman, D.A.; Ruiz, A.D.V.; et al. Aqueous OH Radical Production by Brake Wear Particles. Environ. Sci. Technol. Lett. 2024, 11, 315–322. [Google Scholar] [CrossRef]
Figure 1. Time variation in (a) pad mass difference against pad mass measured within 1 h after the experiment and (b) pad mass difference relative to pad mass loss measured within 1 h after the experiment. All plots represent one-hour averages.
Lubricants 12 00206 g001
Figure 2. Total brake wear factor and percentage of the disc contribution. Note: Non-steel pads: experiments 1–12, 14, 19, 21, 23–28, and 31. Low-steel pads: experiments 13, 15–18, 20, 22, 29, and 30.
Lubricants 12 00206 g002
Figure 3. Comparison of the total brake wear factor with (a) disc wear factor and (b) pad wear factor.
Lubricants 12 00206 g003
Figure 4. Storage stability of (a) PM10 and (b) PM2.5 collected on filter media, (c) relative standard deviation (RSD) from day 0 to day 2 for the particle mass on filter media, and (d) RSD for measured emission factors (n = 3) in experiments 13 to 18 for non-steel pads and ILS [6].
Lubricants 12 00206 g004
Figure 5. (a) Emissions mass of brake wear particles and (b) accumulation ratio versus size of aerodynamic particles. Note: Experimental numbers are shown in the legends.
Lubricants 12 00206 g005
Figure 6. Comparison of emission factors: (a) PM10 and PM11 (experiments 1–28), (b) PM2.5 and PM2 (experiments 1–28), (c) cyclone and MCI for PM10 (experiments 13–18), and (d) cyclone (experiments 13–15) and MCI (experiments 20–22) for PM2.5.
Lubricants 12 00206 g006
Figure 7. Comparison of emission factors for (a) PM10, (b) PM2.5, (c) PM0.12, and (d) brake wear factors with the increase in cooling air flow rate in experiments 3–12. Experiments 23 and 27 are shown for comparison, as described in the text.
Lubricants 12 00206 g007
Figure 8. Comparison of (a) PM2.5 to PM10 ratio and (b) PM0.12 to PM10 ratio with the increase in cooling air flow rate in experiments 3–12. Experiments 23 and 27 are shown for comparison, as described in the text.
Lubricants 12 00206 g008
Figure 9. Comparison of emission factors for (a) PM10 to total wear, (b) PM2.5 to total wear, and (c) PM0.12 to total wear with the increase in cooling air flow in experiments 3–12 (non-steel pads). Experiments 23 and 27 are shown for comparison, as described in the text.
Lubricants 12 00206 g009
Figure 10. Comparison of vehicle test mass and (a) brake wear factor, (b) PM10, (c) PM2.5, and (d) PM0.12.
Lubricants 12 00206 g010aLubricants 12 00206 g010b
Figure 11. Comparison of brake wear factor and (a) PM10, (b) PM2.5, and (c) PM0.12. Note: ILS data were used for the averaged data of all laboratories [6]. The error bars present n = 2–3 variation for the present study and inter-trial variation for the ILS data.
Lubricants 12 00206 g011
Figure 12. Comparison of disc wear factors and (a) Fe in PM10 and (b) Fe in PM2.5, and disc wear fractions and disc fractions (c) in PM10 and (d) in PM2.5.
Lubricants 12 00206 g012
Figure 13. Correlation coefficients between the brake wear factor, disc wear factor, PM10, PM2.5, PM0.12, and mass content of each element in brake pads.
Lubricants 12 00206 g013
Figure 14. Comparison of carbon contents in pads and (a) the brake wear factor, (b) PM10, (c) PM2.5, and (d) in PM0.12. Contour plots of inertia are also shown.
Lubricants 12 00206 g014
Figure 15. Comparison of magnesium contents in pads and (a) the brake wear factor, (b) PM10, (c) PM2.5, and (d) in PM0.12. Contour plots of inertia are also shown.
Lubricants 12 00206 g015
Figure 16. Comparison of iron contents in pads and (a) the brake wear factor, (b) PM10, (c) PM2.5, and (d) in PM0.12. Contour plots of inertia are also shown.
Lubricants 12 00206 g016
Figure 17. Comparison of chromium contents in pads and (a) the brake wear factor, (b) PM10, (c) PM2.5, and (d) in PM0.12. Contour plots of inertia are also shown.
Lubricants 12 00206 g017
Figure 18. Comparison of titanium contents in pads and (a) the brake wear factor, (b) PM10, (c) PM2.5, and (d) in PM0.12. Contour plots of inertia are also shown.
Lubricants 12 00206 g018
Figure 19. Comparison of potassium contents in pads and (a) the brake wear factor, (b) PM10, (c) PM2.5, and (d) in PM0.12. Contour plots of inertia are also shown.
Lubricants 12 00206 g019
Figure 20. Comparison of oxygen contents in pads and (a) the brake wear factor, (b) PM10, (c) PM2.5, and (d) in PM0.12. Contour plots of inertia are also shown.
Lubricants 12 00206 g020
Figure 21. Comparison of barium contents in pads and (a) the brake wear factor, (b) PM10, (c) PM2.5, and (d) in PM0.12. Contour plots of inertia are also shown.
Lubricants 12 00206 g021
Disclaimer/Publisher’s Note: The statements, opinions and data contained in all publications are solely those of the individual author(s) and contributor(s) and not of MDPI and/or the editor(s). MDPI and/or the editor(s) disclaim responsibility for any injury to people or property resulting from any ideas, methods, instructions or products referred to in the content.

