Field Study of Asphalt Pavement Texture and Skid Resistance under Traffic Polishing Using 0.01 mm 3D Images
Abstract
1. Introduction
1.1. Pavement Texture and Traffic Polishing
1.2. Pavement Friction and Traffic Polishing
1.3. Objectives
2. Field Data Collection
3. Pavement Texture Evaluation
3.1. Texture Characteristics via Vision Observation
- (1)
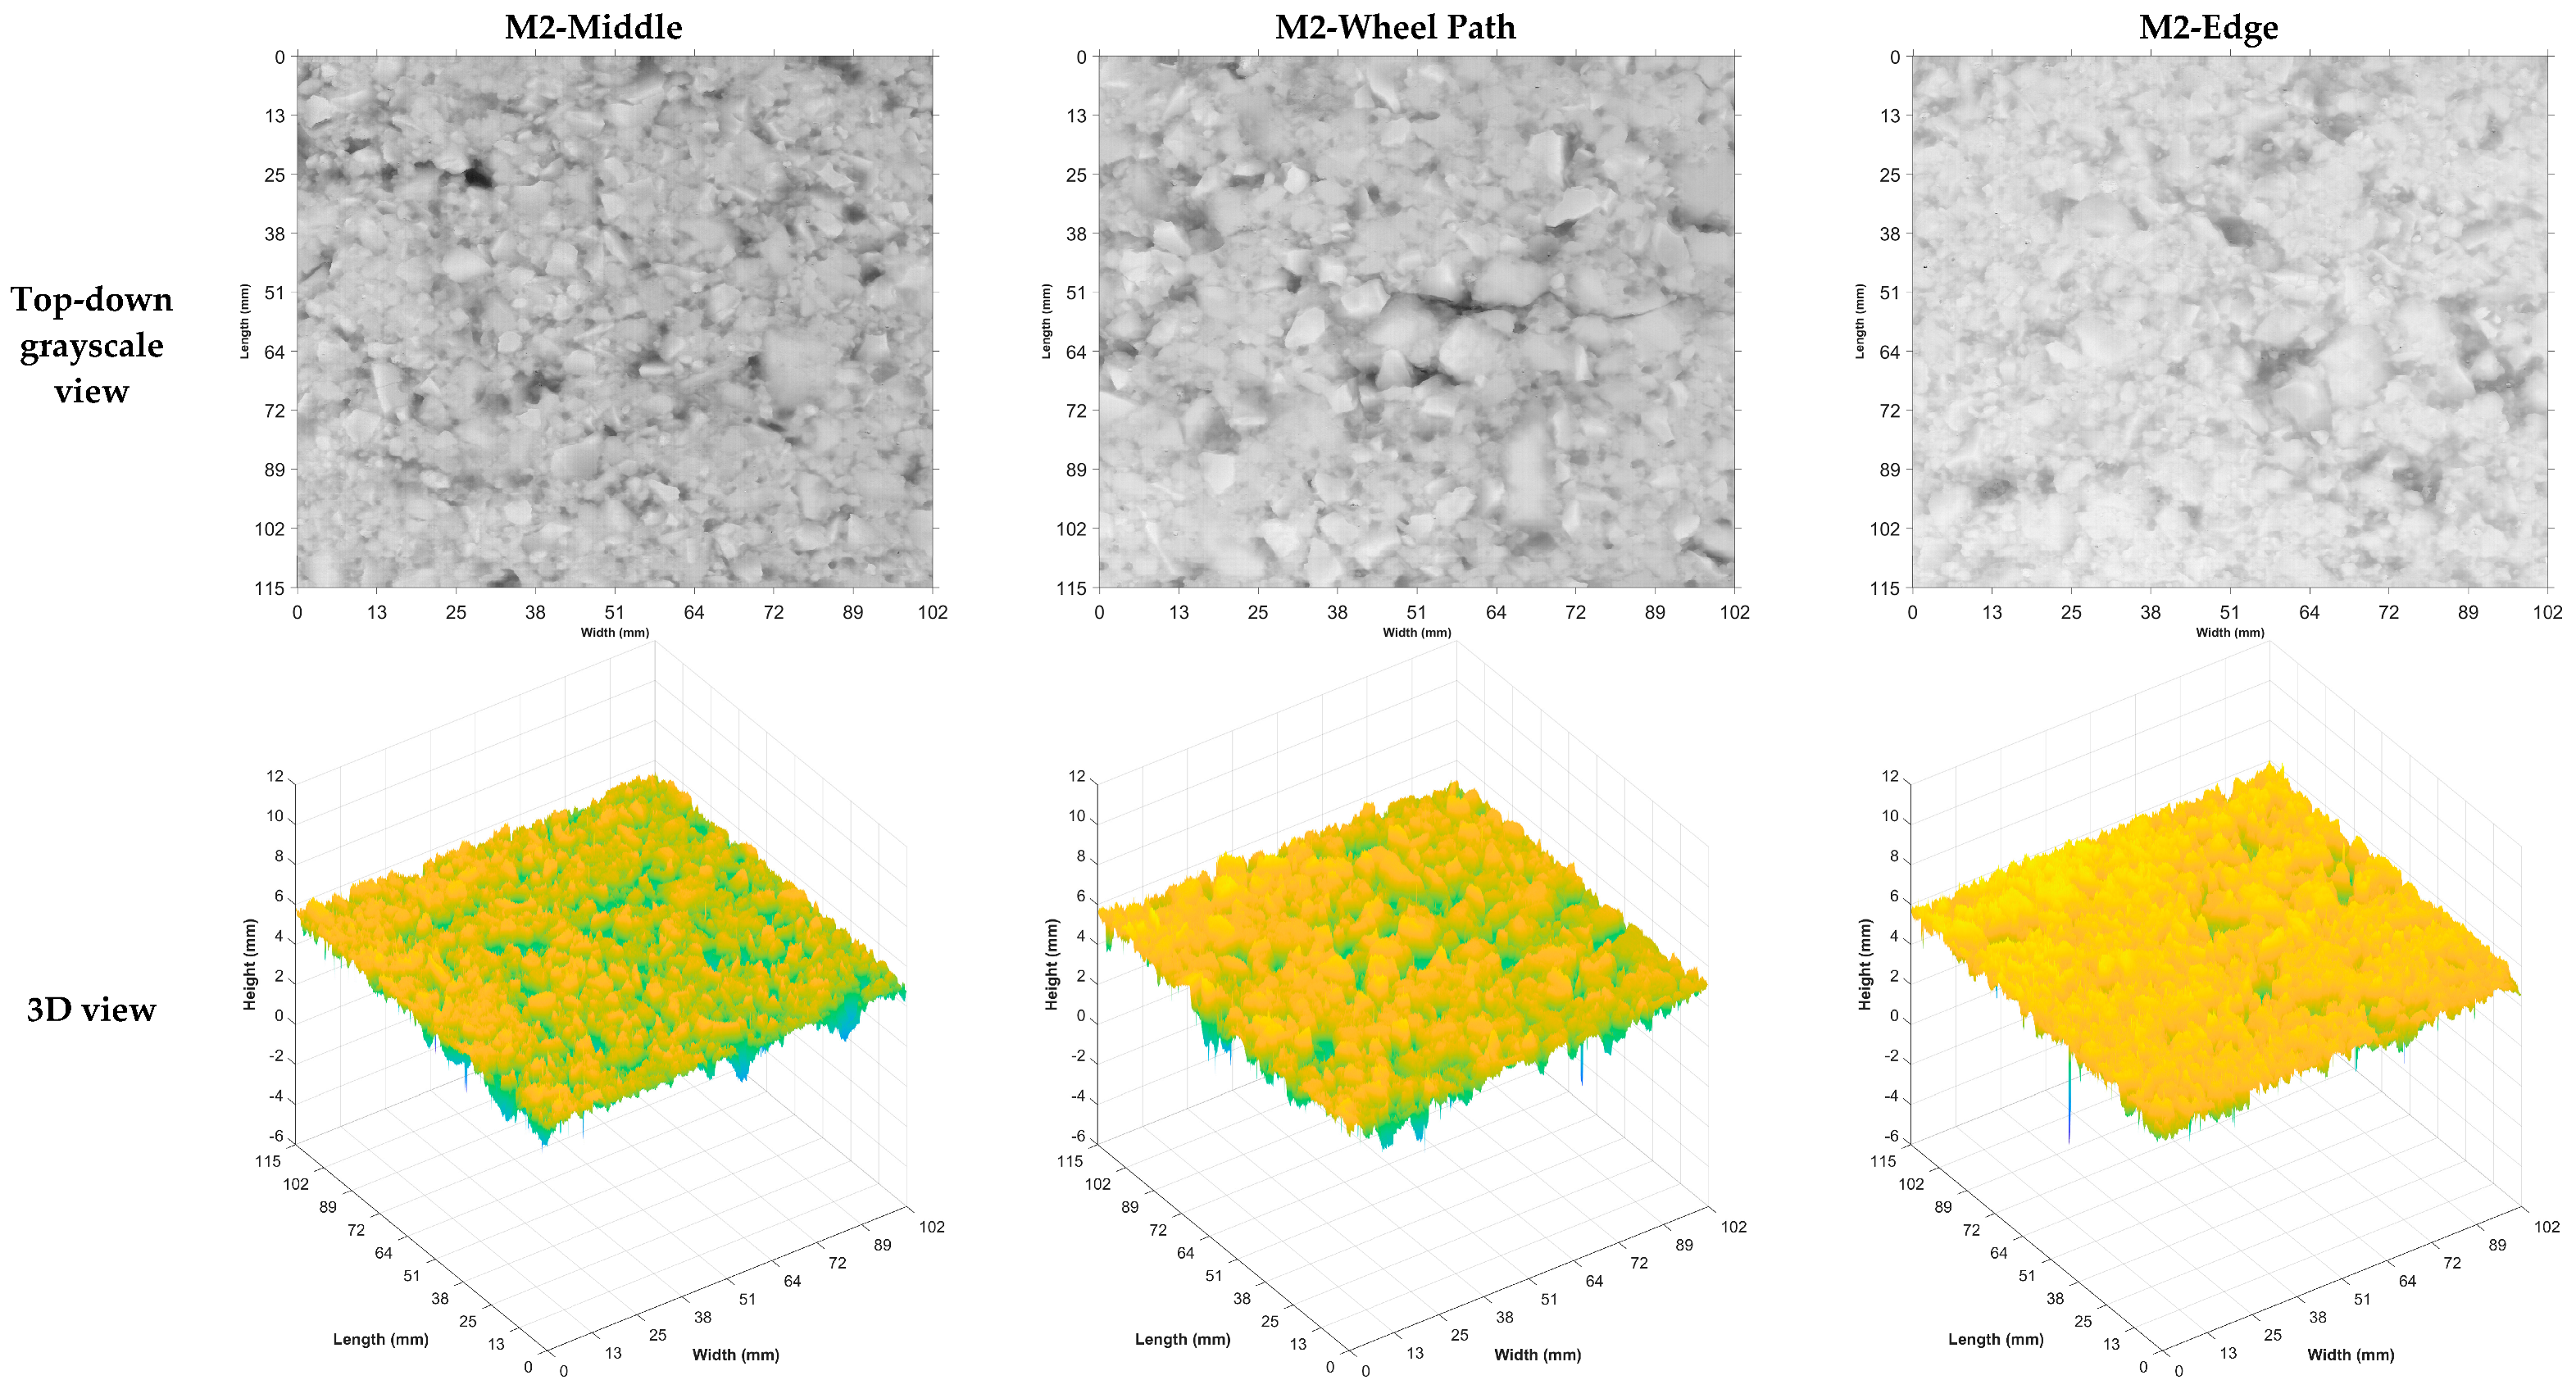
- Many large aggregates are exposed in the top-down grayscale image from wheel path due to extensive traffic polishing in the last seven years.
- (2)
- The top-down grayscale image from the middle of the travel lane shows a mix of large, medium, and small size aggregates after experiencing certain traffic polishing over seven years of service.
- (3)
- The top-down grayscale image from the edge of the travel lane exhibits only a few aggregates due to minimal traffic polishing after seven years of service.
- (4)
- The 3D view of these images demonstrates a similar trend of the number of exposed aggregates from these locations. However, the original images should be processed to remove the noise for further analysis.
3.2. Texture Characteristics via 3D Areal Parameters
- (1)
- Three height parameters: arithmetic mean height (Sa, unit: mm), root mean square height (Sq, unit: mm), skewness (Ssk without unit), and kurtosis (Sku without unit),
- (2)
- Three spatial parameters: autocorrelation length (Sal, unit: mm), texture aspect ratio (Str without unit), and texture direction (Std, unit: rad),
- (3)
- Two hybrid parameters: root mean square gradient (Sdq without unit) and developed interfacial area ratio (Sdr, unit: %),
- (4)
- Nine functional parameters: peak extreme height (Sxp, unit: mm), surface section difference (Sdc, unit: mm), reduced peak height (Spk, unit: mm), core height (Sk, unit: mm), reduced dale height (Svk, unit: mm), peak material volume (Vmp, unit: mm3), core material volume (Vmc, unit: mm3), core void volume (Vvc, unit: mm3), and dales void volume (Vvv, unit: mm3),
- (5)
- Three feature parameters: peak density (Spd, unit: mm−2) and peak curvature (Spc, unit: mm−1).
- (1)
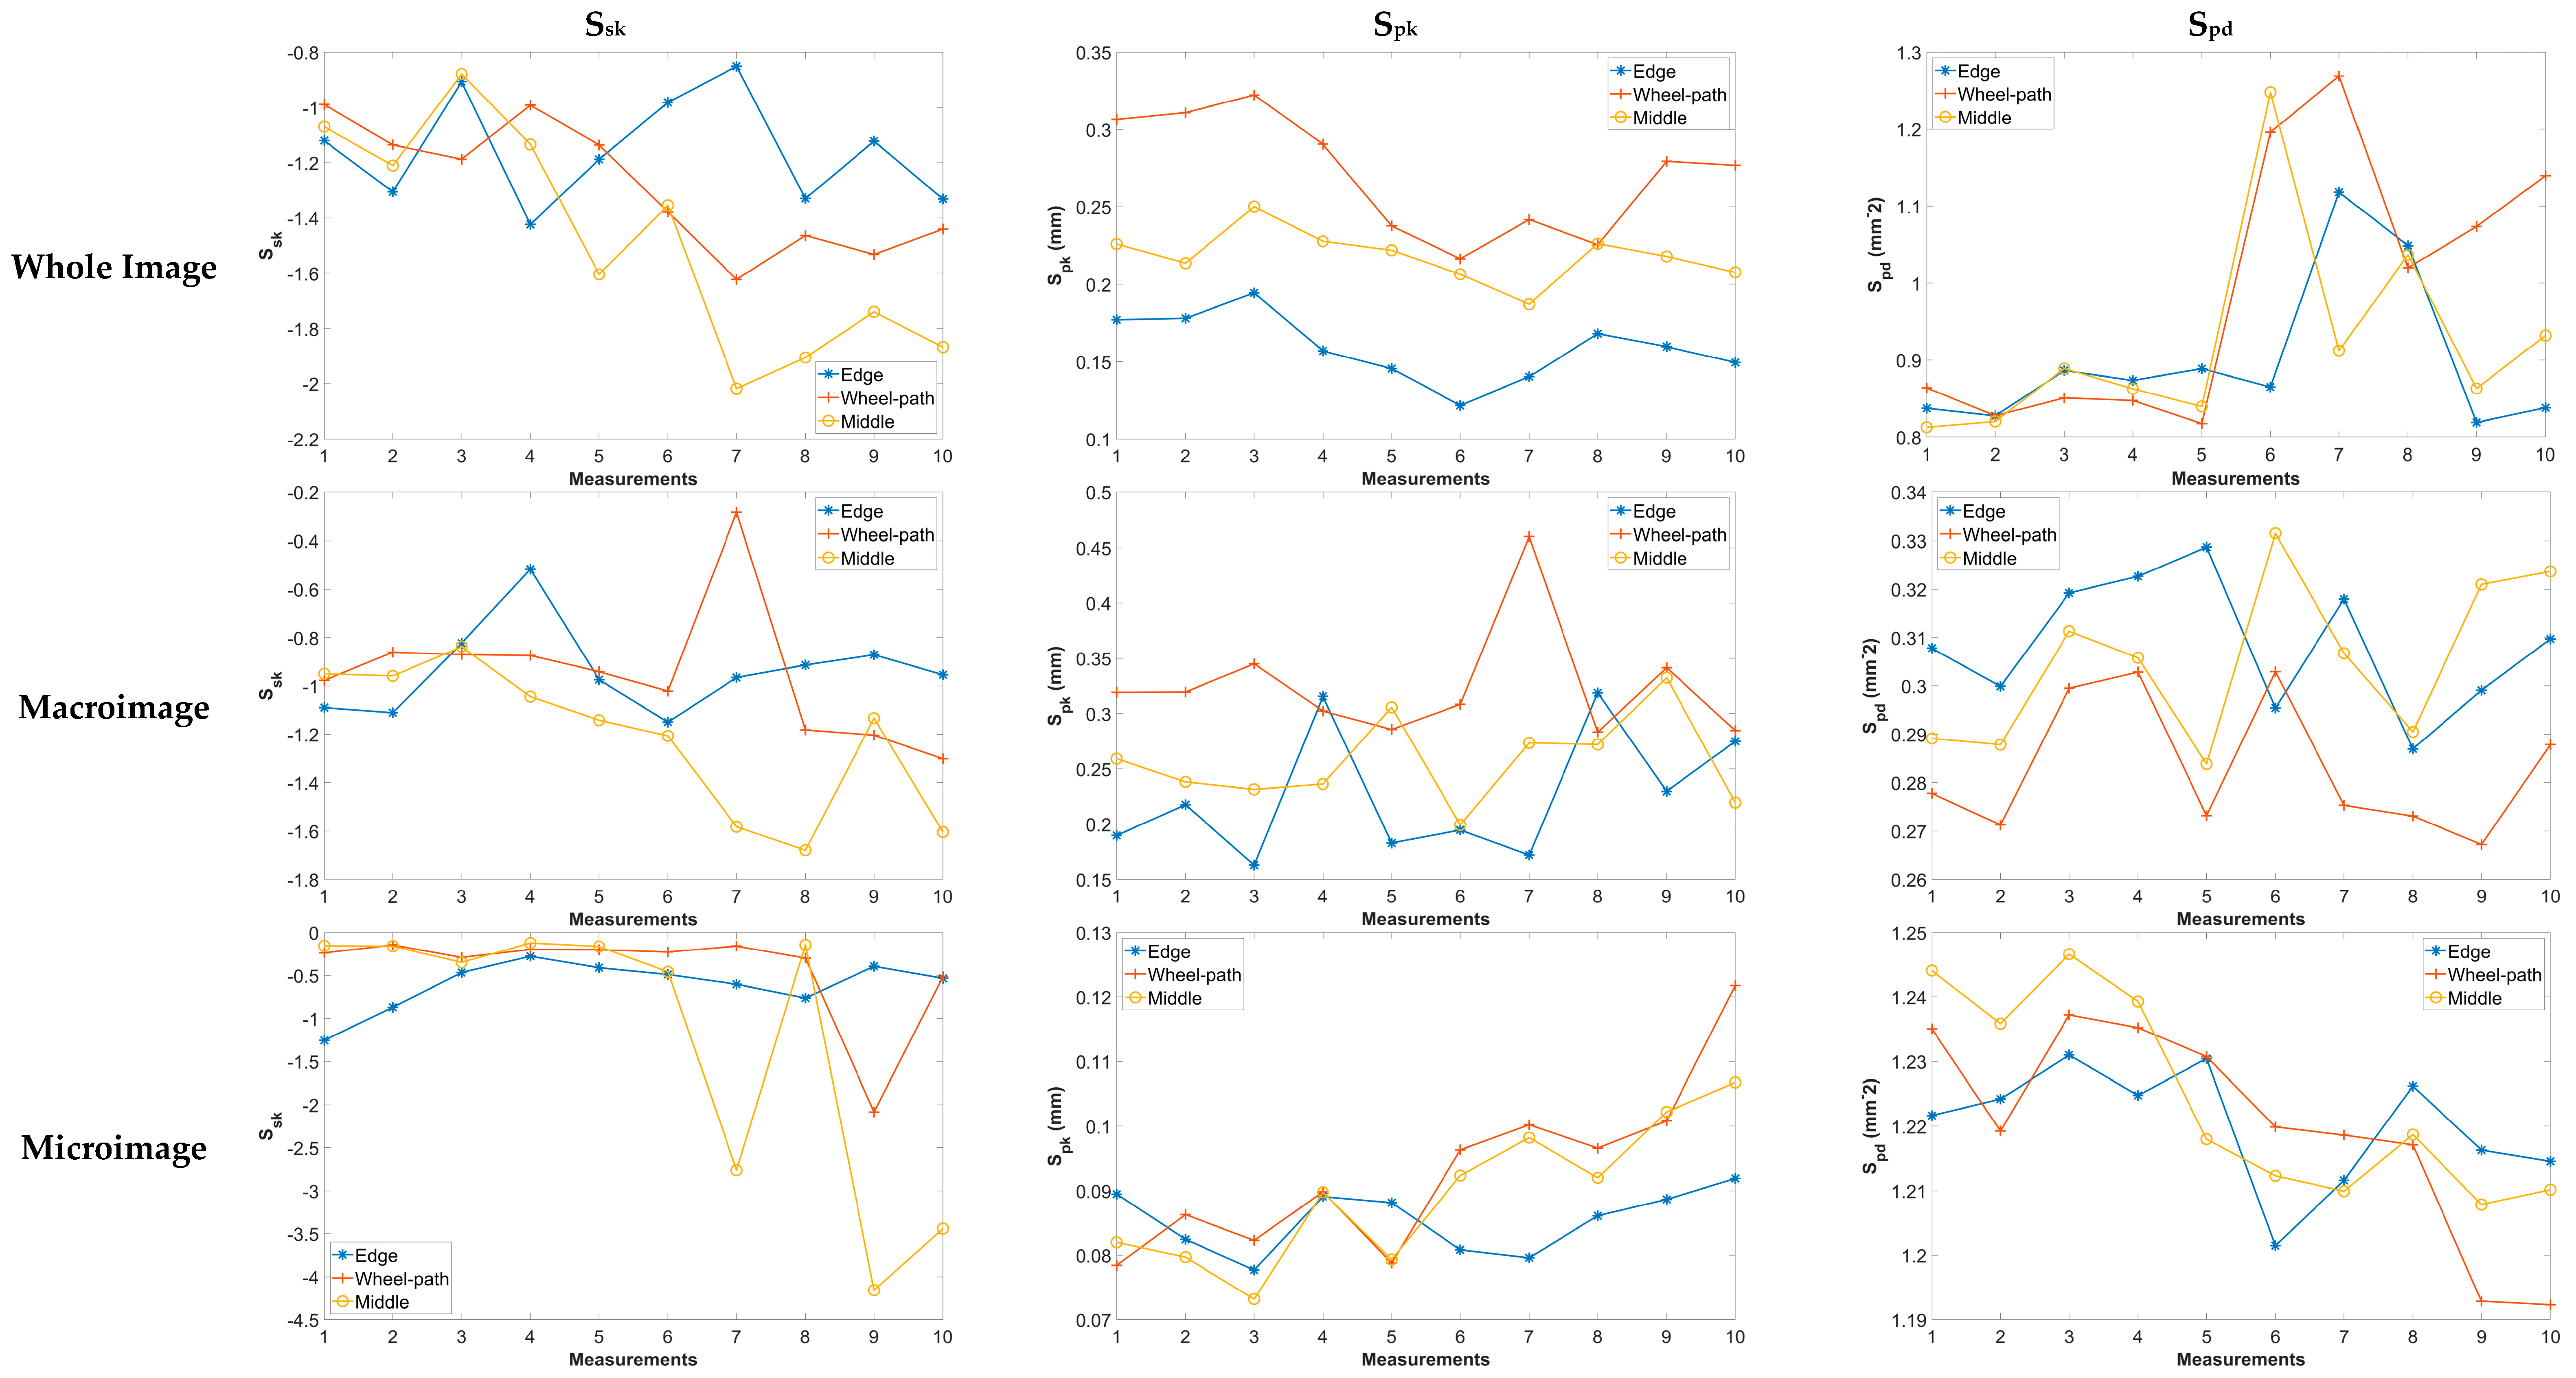
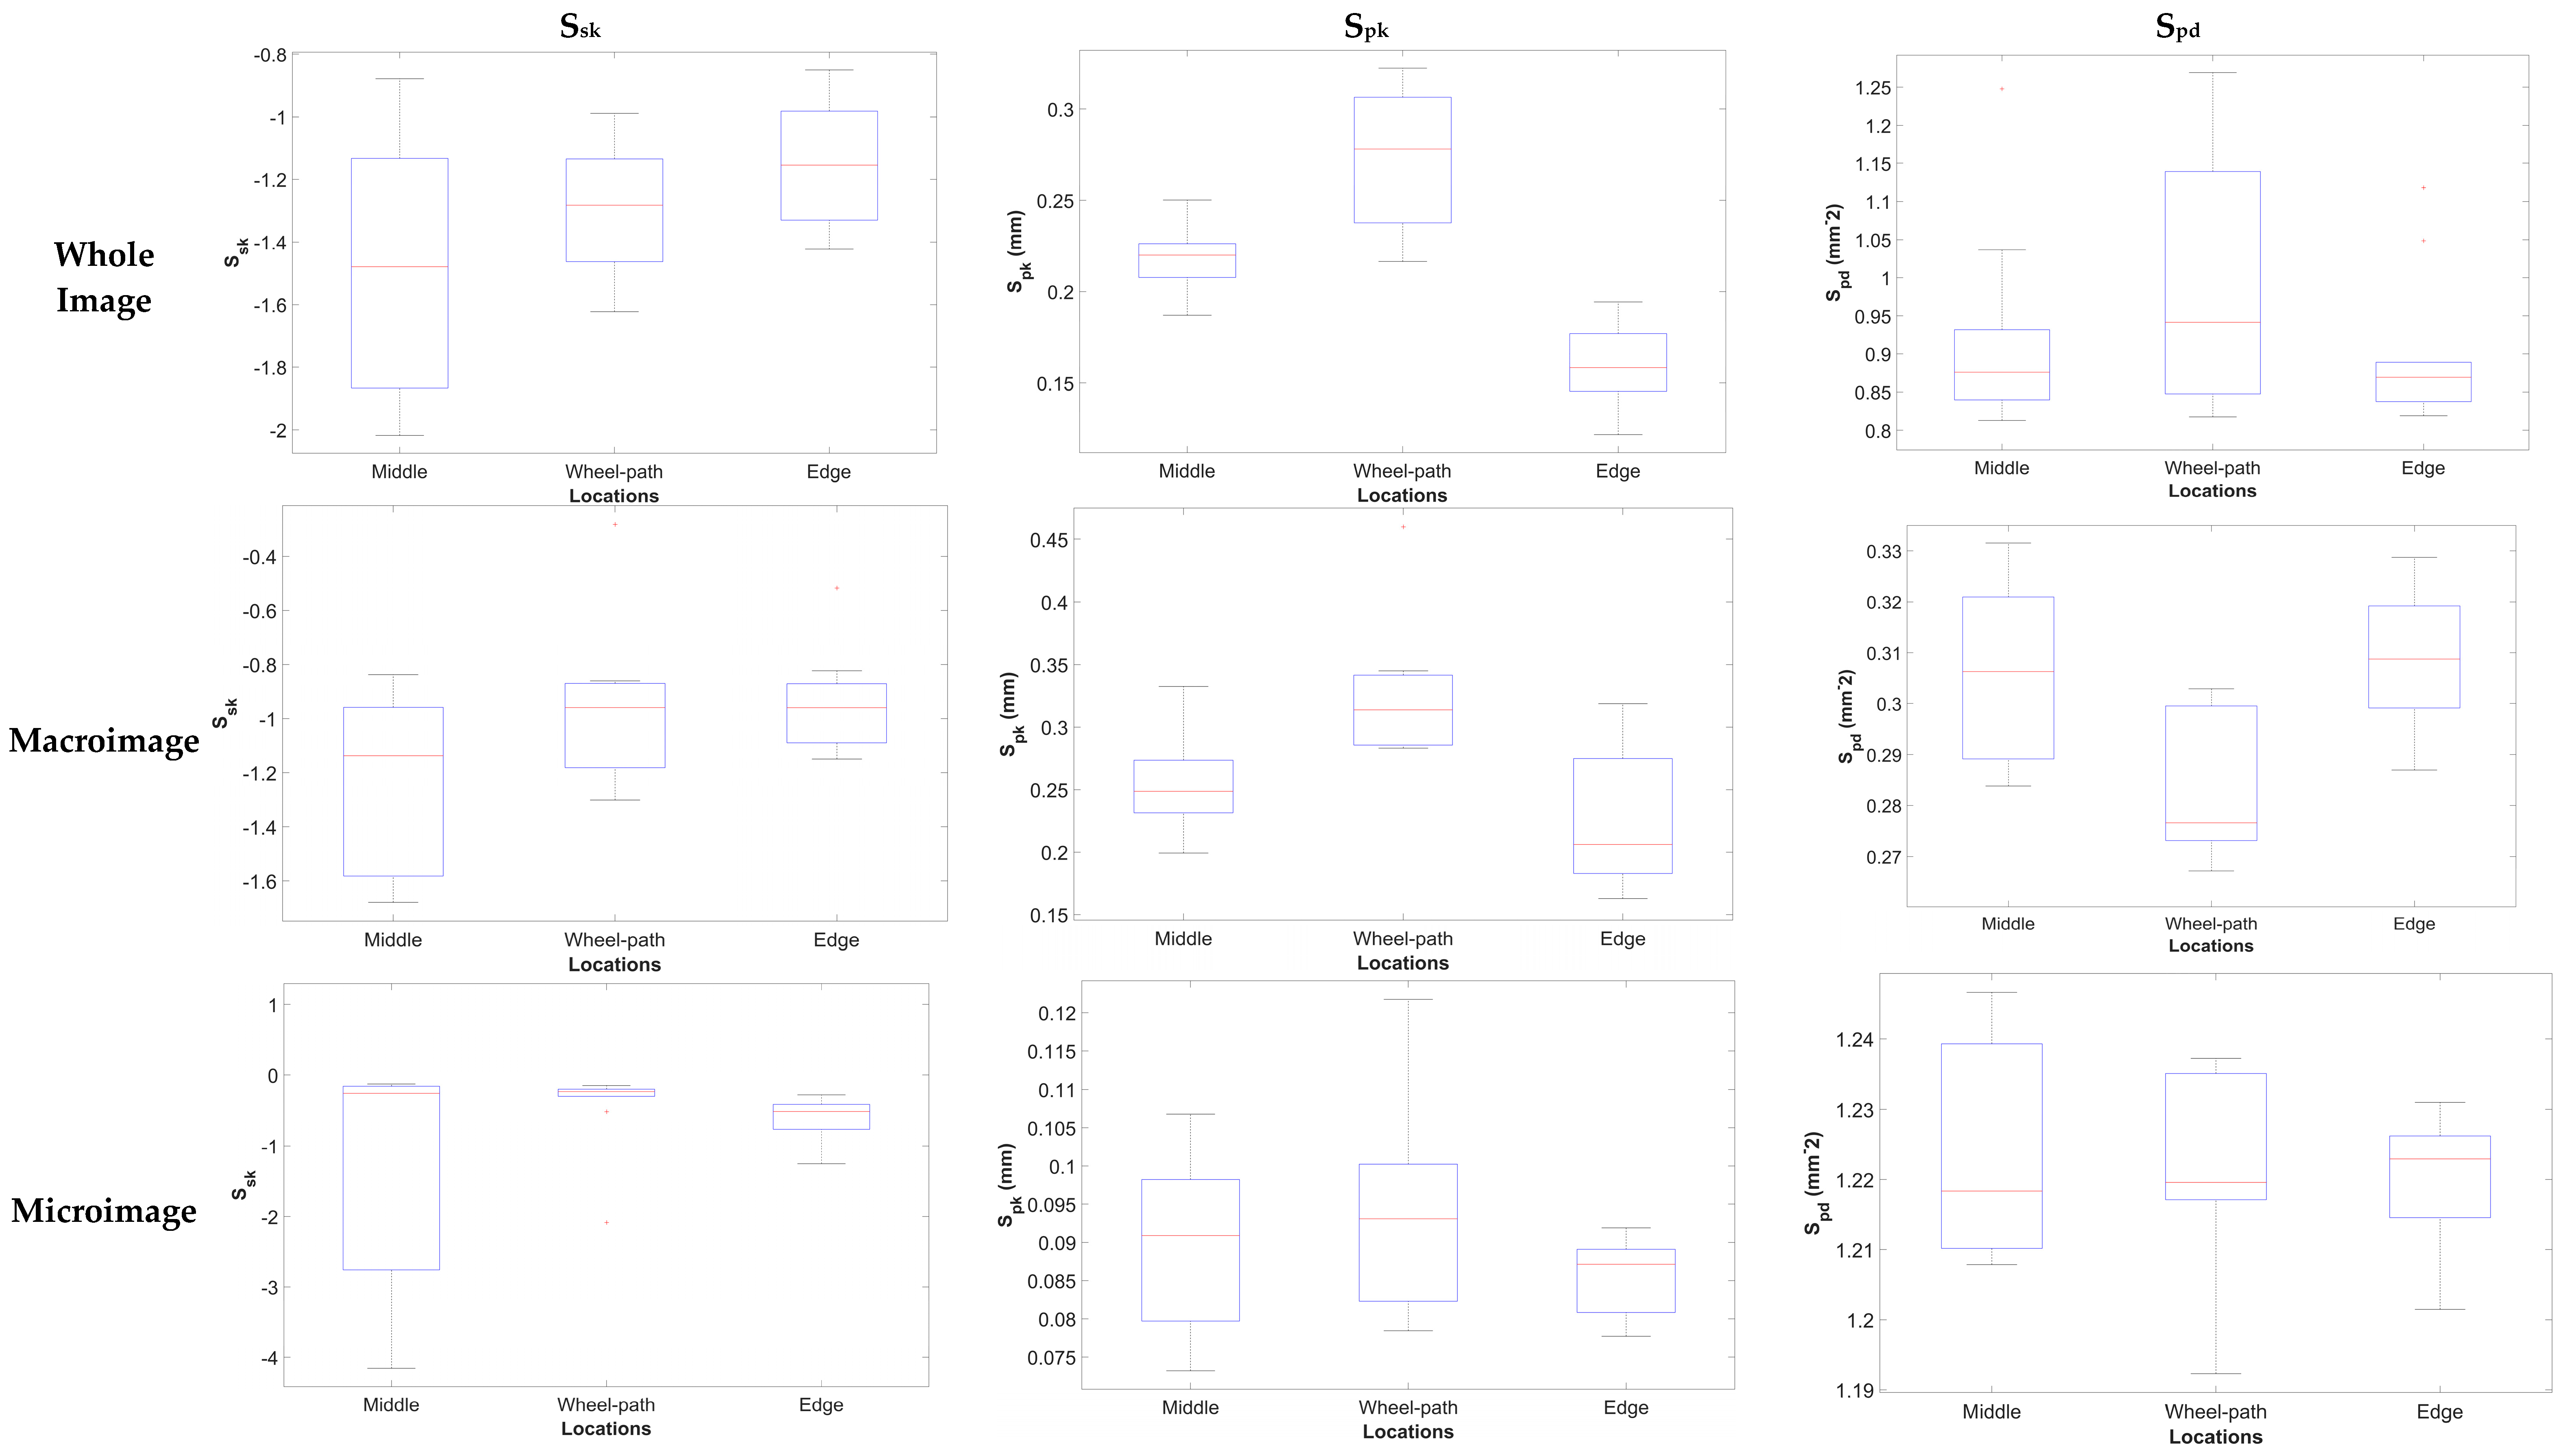
- For Ssk, all of them are negative numbers for whole images, macrotexture images, and microtexture images, which means the height distribution of pavement texture is skewed below the mean plane, suggesting all these textures have more low points or depressions compared to high points or peaks due to traffic polishing. For whole images, the edge shows an average Ssk of −1.15 while the middle shows an average Ssk of −1.48. It indicates that the edge texture has a less pronounced negative skew. In other words, the edge surface has fewer valleys or is less asymmetric than the middle texture due to less aggregates exposed under less traffic polishing. A similar trend is observed in the Ssk of macrotexture images. For microtexture images, all Ssk are negative but close to zero, indicating the microtexture still has more low points than high points, but with less difference between the wheel path, middle, and edge of the roadway.
- (2)
- For all three image categories, the wheel path shows a higher average Spk, which is followed by those from the middle and edge of roadway. Generally, a larger Spk indicates that the surface has higher or more prominent peaks above the core roughness profile [15]. It means that as traffic polishing accumulated on pavement surface, the Spk of whole images, macrotexture images, or microtexture images increases, signifying more aggregates are exposed on the surface as higher or prominent peaks above the core roughness profile. However, the Spk of microtexture are less than those of whole images or macrotexture images, and not showing significant difference among the three locations, as shown in Figure 9.
- (3)
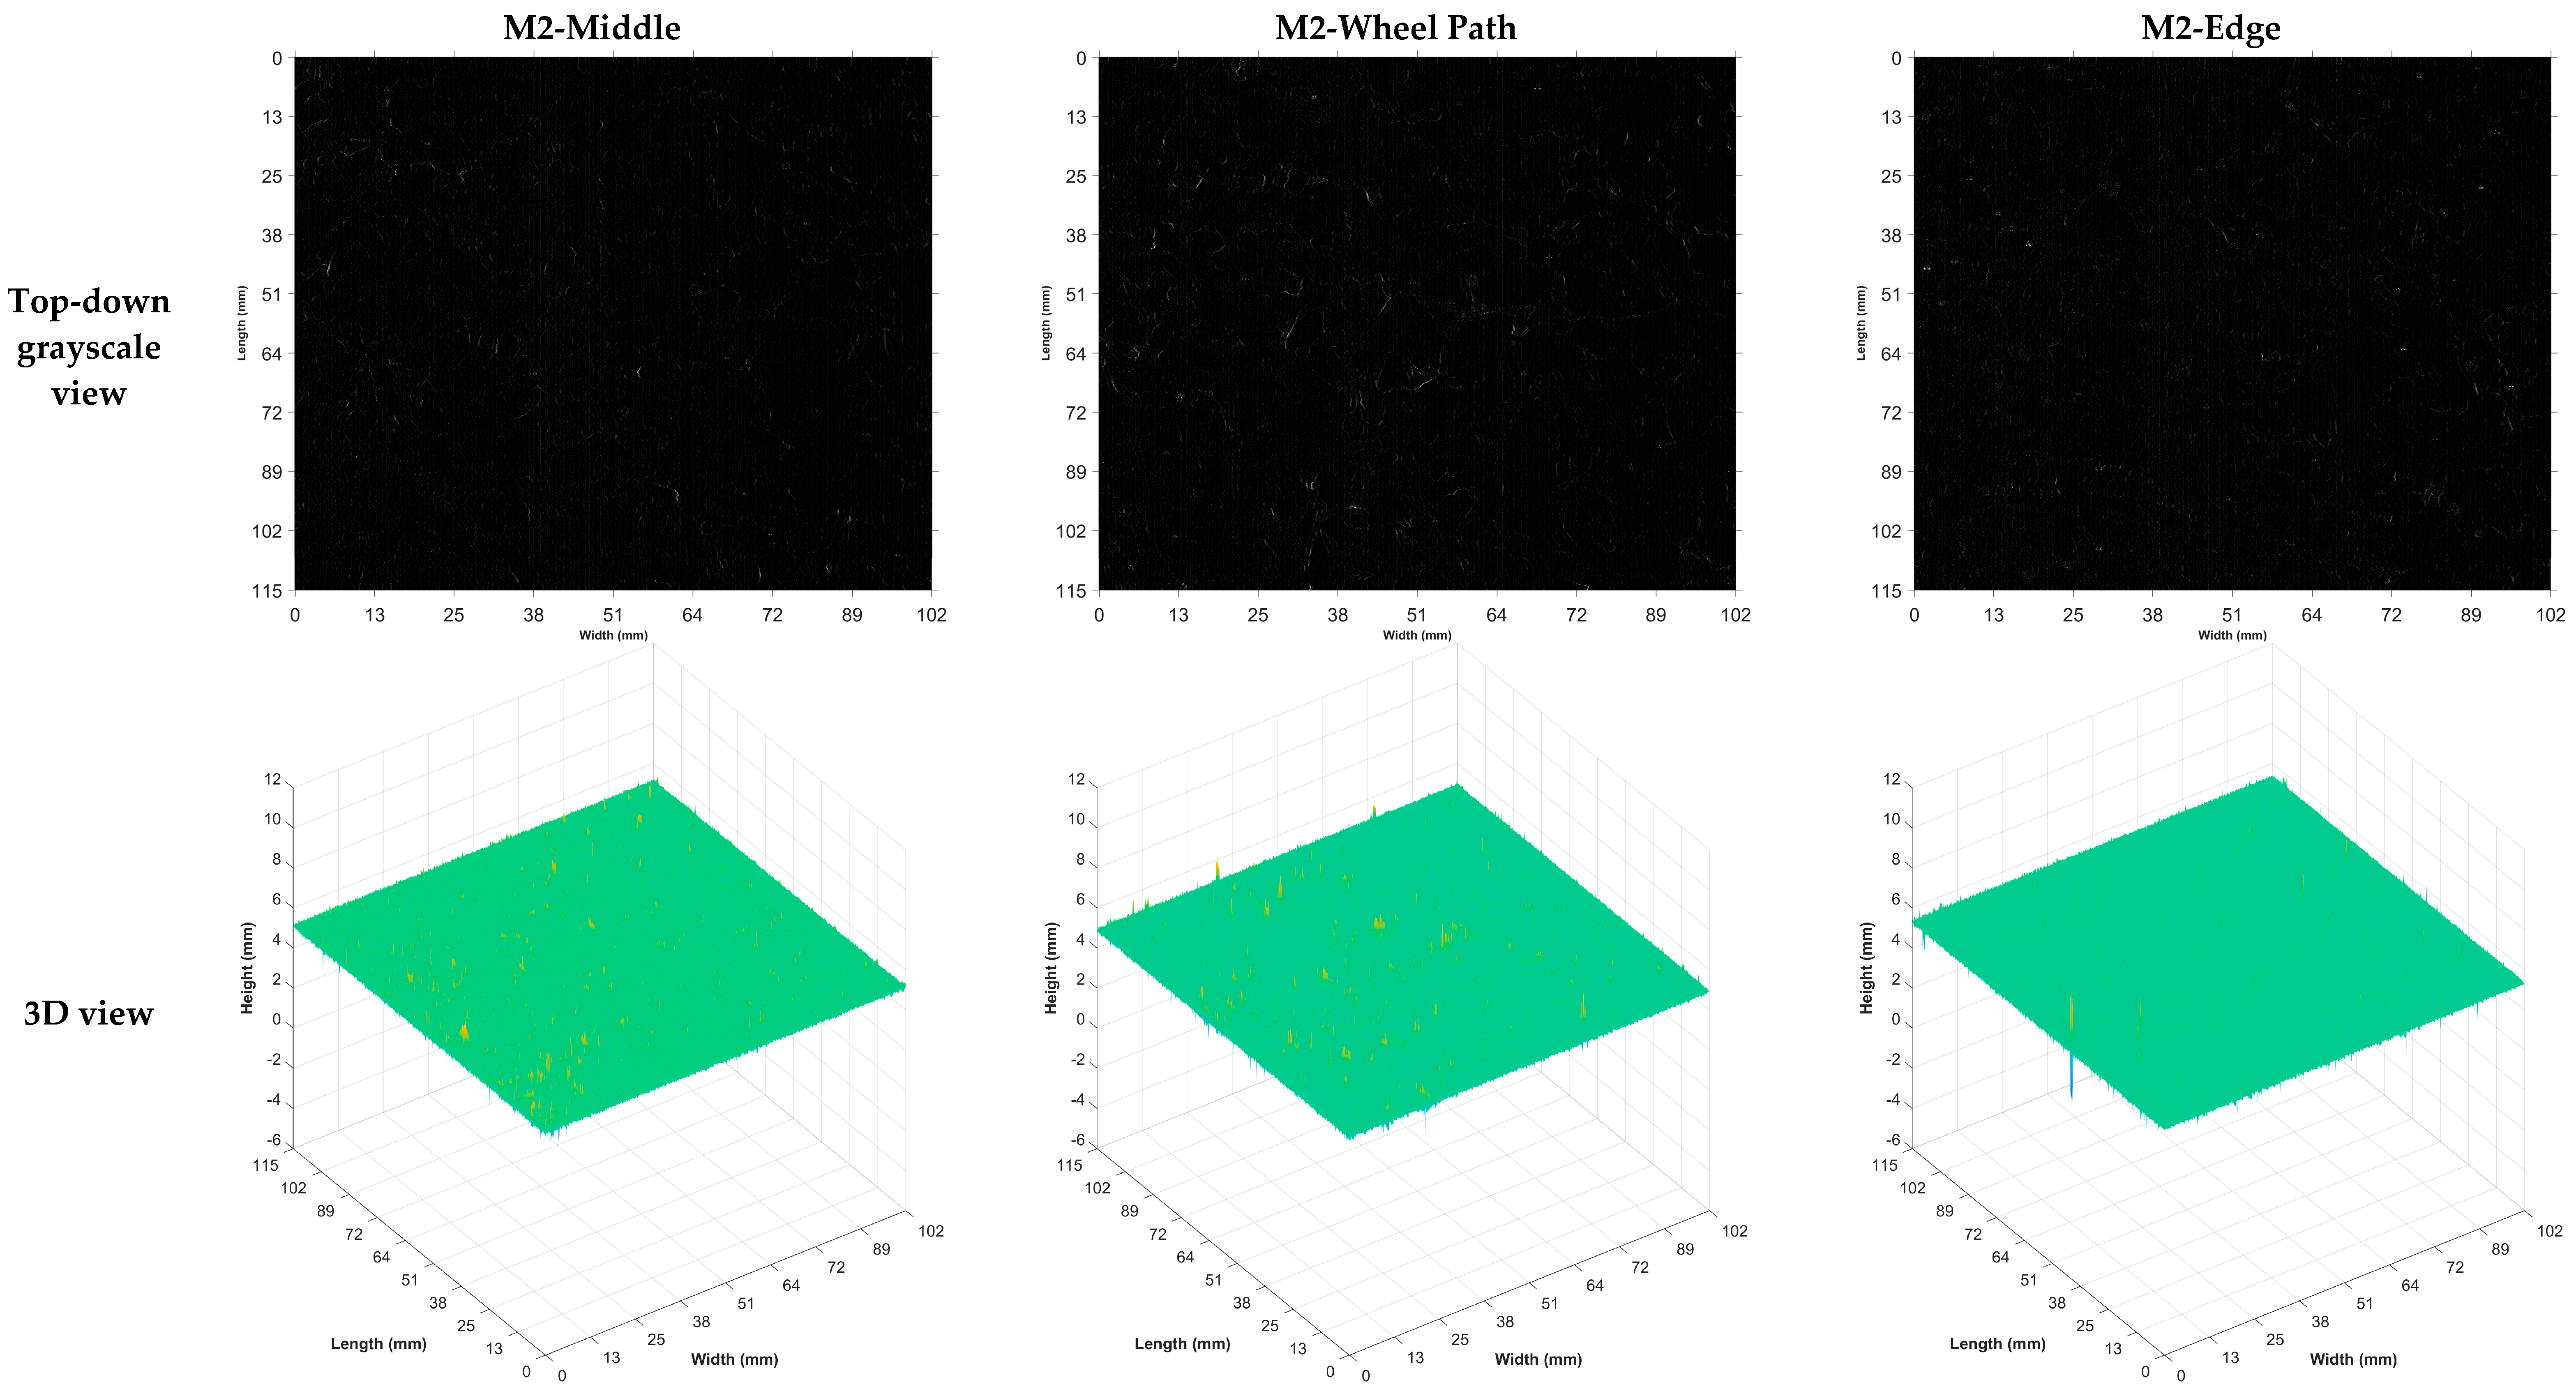
- The whole images and microtexture images have larger Spd than macrotexture images. The whole image exhibits a higher Spd due to the presence of all surface protrusions, while microtexture images capture fine protrusions and filtering artifacts, resulting in higher Spd than macrotexture images. Also, from whole images, a larger average Spk is observed on wheel path, followed by middle and edge of the roadway. This suggests that traffic polishing generates more peaks per unit texture area on roadway, even though it wears down pavement texture and aggregates are exposed over time. For macrotexture images, the average Spk for wheel path, middle, and edge of roadway is close to each other with little variations and around 0.3 because the peaks or spikes in macrotexture images (Figure 6) are not as many as shown in whole images (Figure 5) or microtexture images (Figure 7).
4. Pavement Friction Evaluation
4.1. Friction Characteristics Under Traffic Polish
- (1)
- Under each testing speed, the edge of the outer travel lane shows the highest average friction number, followed by those from the middle and right wheel path due to traffic polishing. For example, at speed of 60 km/h, the average friction numbers are 0.48, 0.32, and 0.29, separately, for the edge, middle, and right wheel path of the outer travel lane. It indicates that pavement areas under extensive traffic polishing (wheel path) shows lower skid resistance than pavement areas experiencing less traffic polishing (middle or edge).
- (2)
- Furthermore, the collected DFT numbers exhibit slight increase as testing speeds changed from 10–70 km/h, as shown in Figure 10. This phenomenon could be due to the testing speed not being high enough to cause a decrease for this particular asphalt mixture. Nevertheless, it still indicates that testing speed affects the collected friction numbers via DFT even though the pavement texture is not changed. So, testing speed should be considered as one input when developing pavement friction prediction models via 3D areal texture parameters.
- (3)
- All DFT measurements were completed in approximately 60 min under traffic control, with an ambient temperature of 75 °F. Consequently, the temperature influence on these DFT numbers will be ignored, as they were collected under consistent ambient conditions. Thus, temperature will not be considered as an input when developing pavement friction prediction models.
4.2. Friction Prediction Models
- (1)
- Input 1: a matrix with a dimension of 21 (20 areal parameters from whole images and one testing speed) by 210 (a total of 210 samples to match 210 DFT numbers across seven different speeds);
- (2)
- Input 2: a matrix with a dimension of 41 (20 areal parameters from macrotexture images, 20 areal parameters from microtexture images, and one testing speed) by 210 (a total of 210 samples to match 210 DFT numbers across seven different speeds).
- (a)
- A nonlinear relationship exists between pavement texture parameters and friction numbers. This is evidenced by the lower R-squared values of the SMLR model compared to those of the NN or RF models, regardless of whether whole images or macro-/microtexture images were used to calculate 3D areal texture parameters.
- (b)
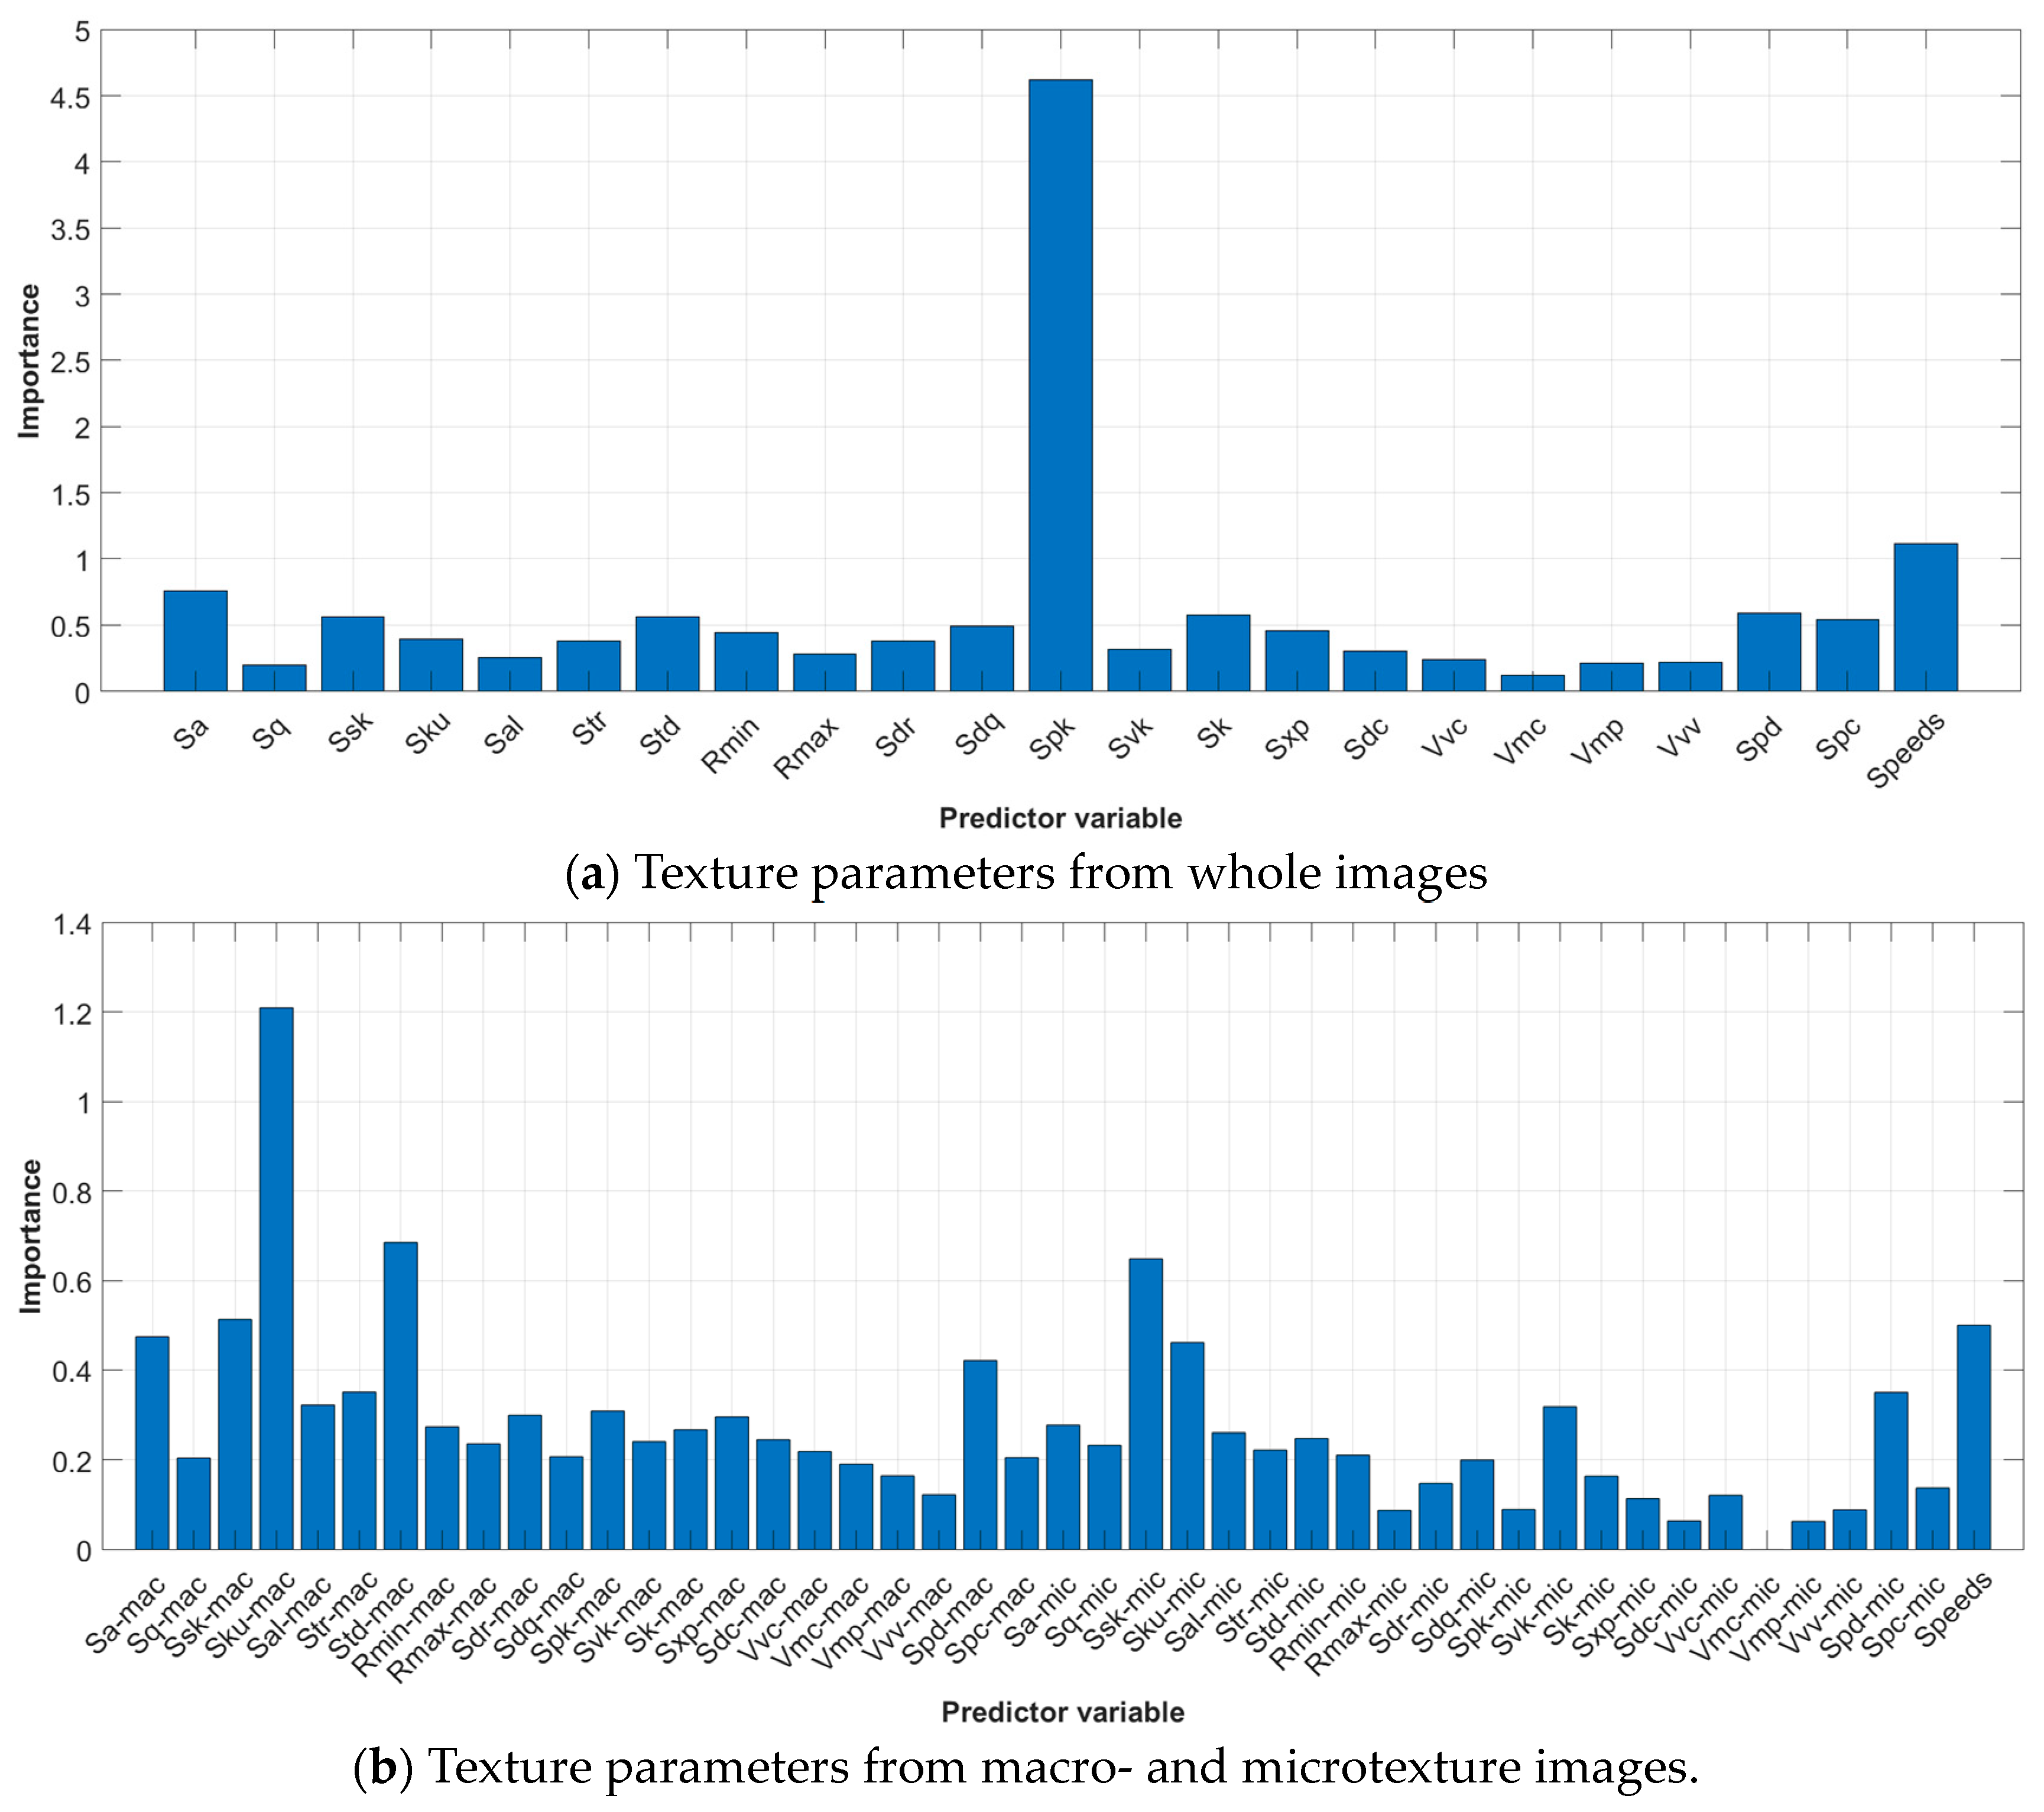
- Reduced peak height (Spk) emerges as the critical texture parameter in developing friction prediction models, as evidenced by both the SMLR and RF always selecting Spk as the critical input.
- (c)
- Friction models using 3D texture parameters from macro-/microtexture images outperformed those using texture parameters from whole images. For instance, the NN model reached an R-squared value of 89.52% with whole image parameters, but 94.29% when using 3D macro-/microtexture parameters. It indicates that separating whole images into macro-/microlevels for parameter calculation benefits the accuracy of friction prediction models.
- (d)
- Testing speed should be considered when developing friction prediction models.
5. Discussion of the Friction Decrease Rate
- (1)
- The traffic growth rate on this roadway is 2%.
- (2)
- 50% of the vehicles travel along the right travel lane, as shown in Figure 2.
- (3)
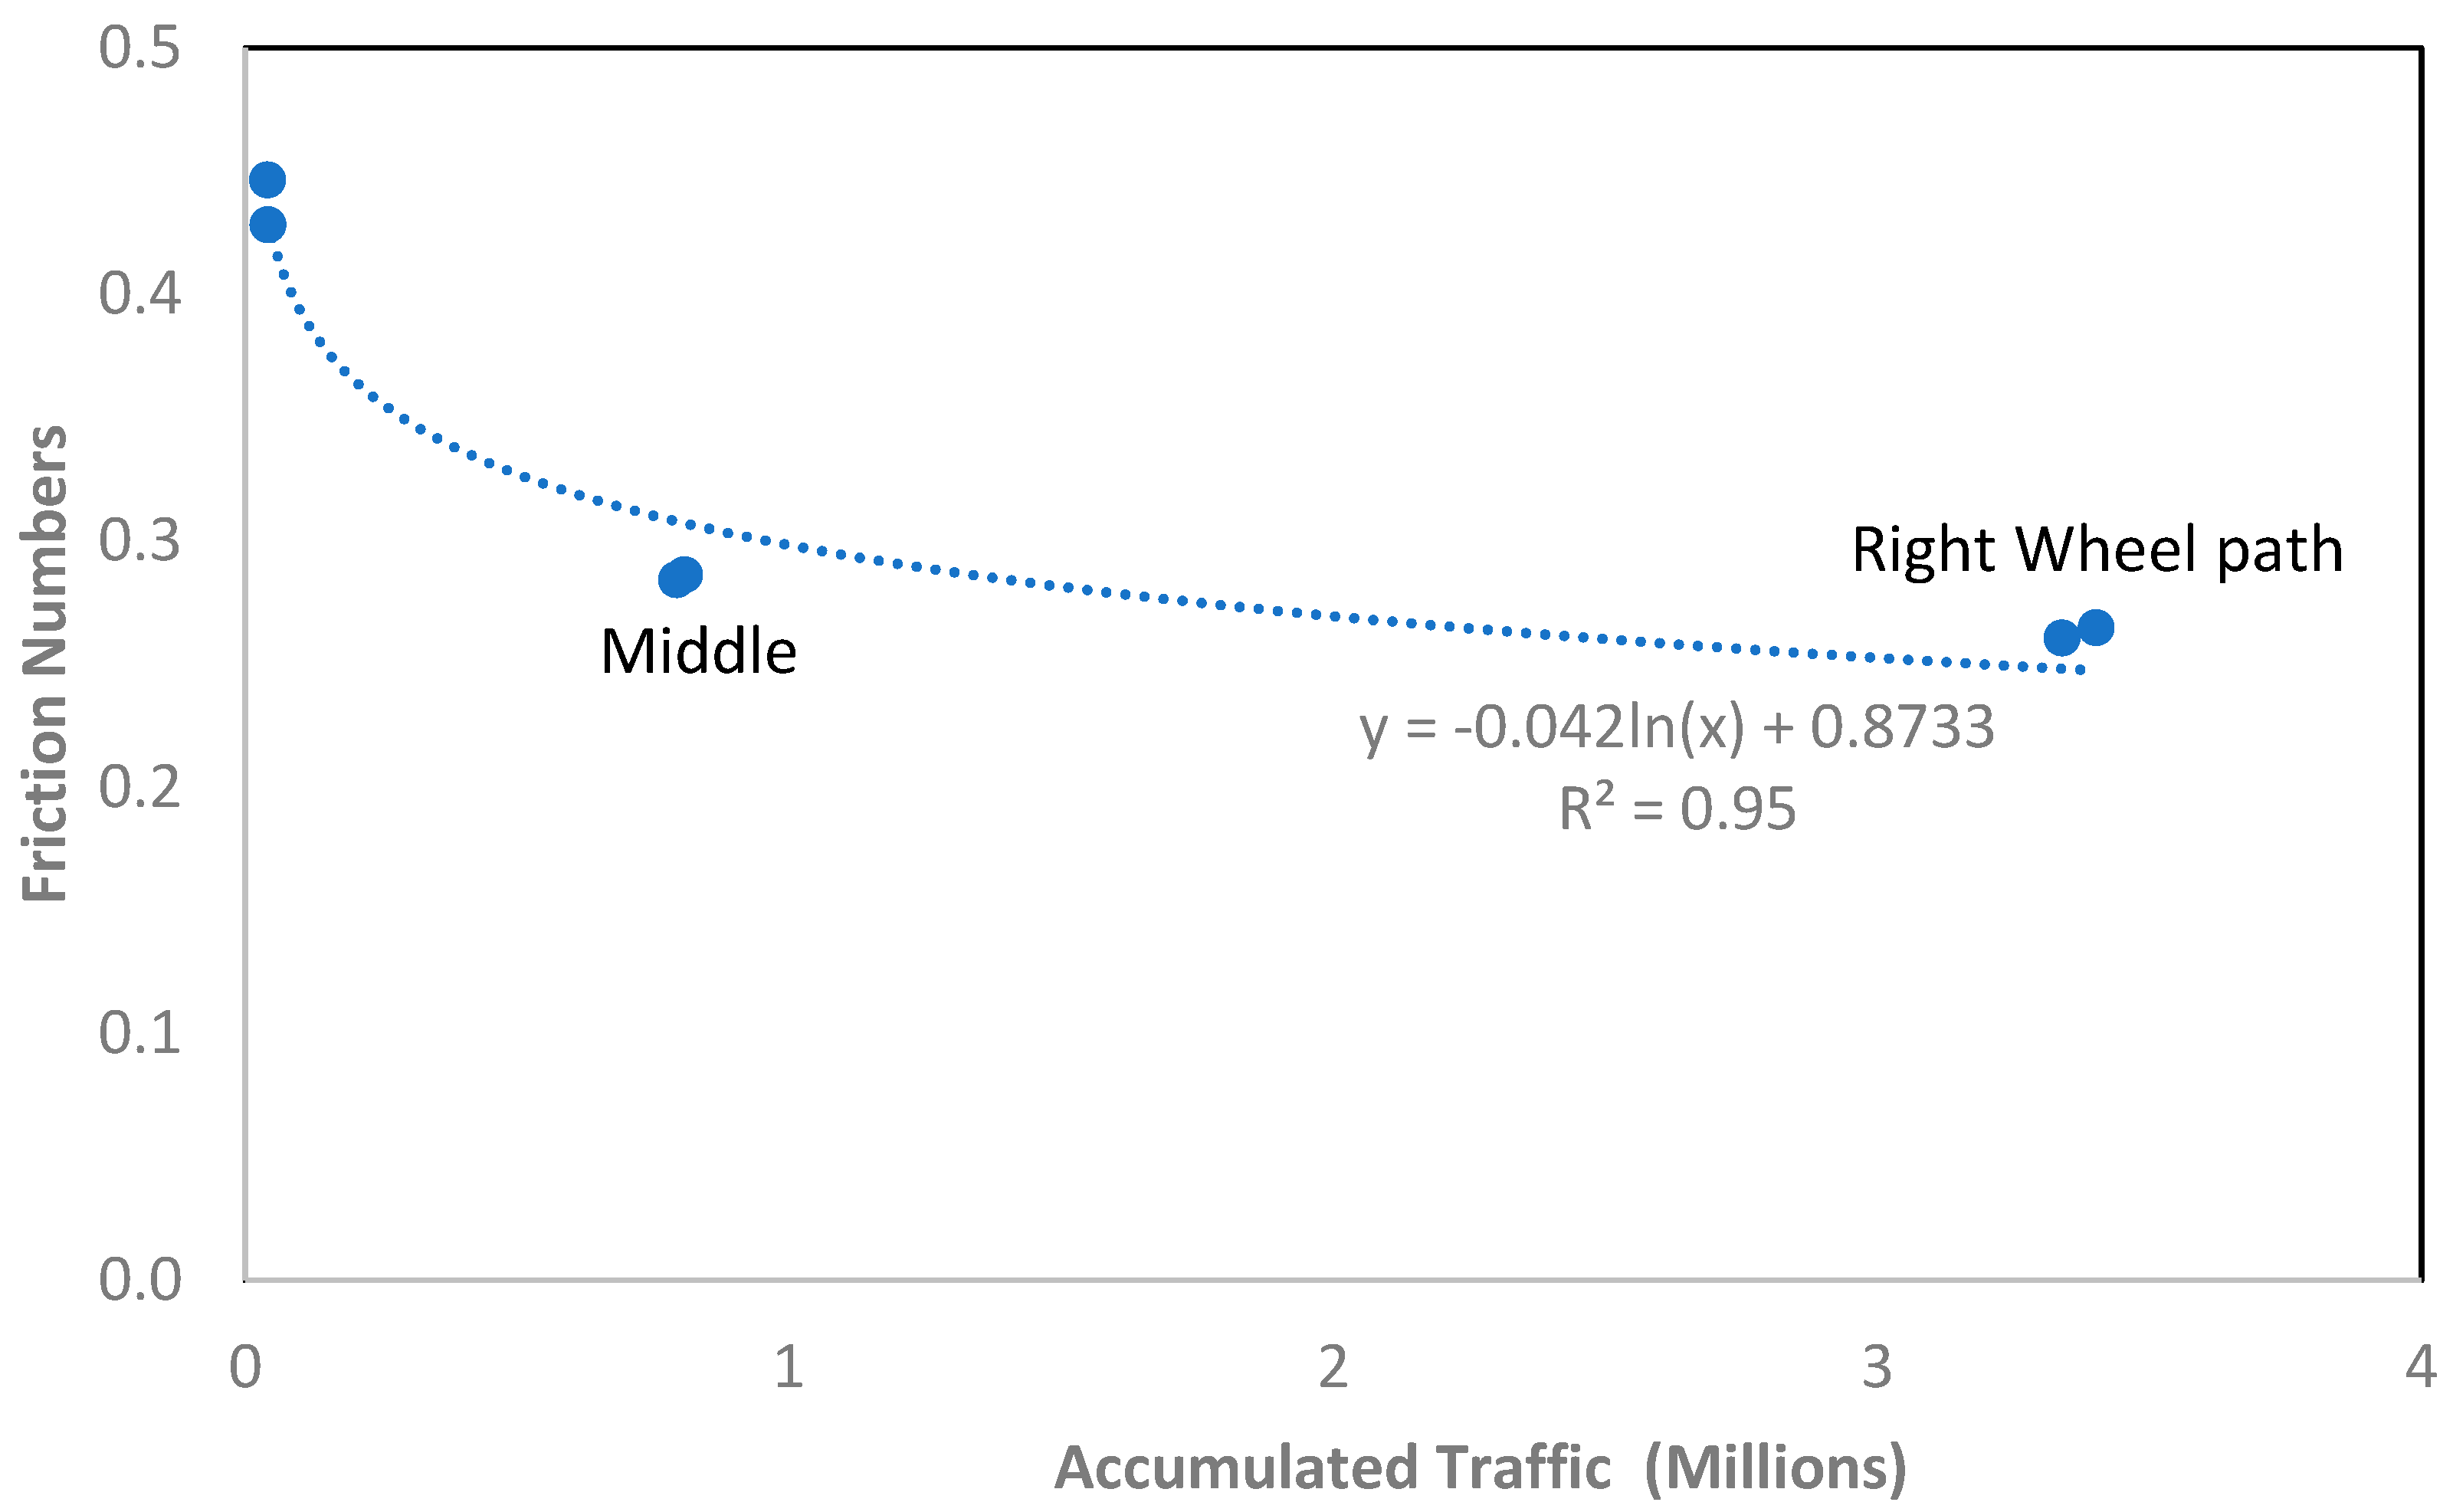
- There are 1%, 80%, and 19% traffic polishing happening along the edge, wheel path, and middle of the roadway for these two testing sites. It means (a) minimal vehicles (1%) move to roadway edge due to wandering or uncommon maneuvers, (b) most vehicles (80%) move along roadway wheel path under normal forward driving, and (c) certain vehicles (19%) move and polish roadway middle area due to vehicle wandering, lane change, or other maneuvers.
6. Conclusions
Author Contributions
Funding
Data Availability Statement
Conflicts of Interest
References
- Ahammed, M.A.; Tighe, S.L. Asphalt Pavements Surface Texture and Skid Resistance—Exploring the Reality. Can. J. Civ. Eng. 2012, 39, 1–9. [Google Scholar] [CrossRef]
- Flintsch, G.W.; McGhee, K.K.; Najafi, S. The Little Book of Tire Pavement Friction. Pavement Surf. Prop. Consort. 2012, 1, 1–22. [Google Scholar]
- Transportation Research Board. Designing Safer Roads; Transportation Research Board: Washington, DC, USA, 1987. [Google Scholar]
- McCullough, B.F.; Hankins, K. Skid Resistance Guidelines for Surface Improvements on Texas Highways; Highway Research Record: Washington, DC, USA, 1966. [Google Scholar]
- Kuttesch, J. Quantifying the Relationship between Skid Resistance and Wet Weather Accidents for Virginia Data. Master’s Thesis, Virginia Polytechnic Institute and State University, Blacksburg, VA, USA, 2004. [Google Scholar]
- Cairney, P. Skid Resistance and Crashes—A Review of the Literature; Research Report/Australian Road Research Board; Australian Road Research Board: Vermont South, Australia, 1997; ISBN 978-0-86910-750-8. [Google Scholar]
- ASTM E867-06; Standard Terminology Relating to Vehicle-Pavement Systems. ASTM: West Conshohocken, PA, USA, 2020.
- National Academies of Sciences, Engineering and Medicine. Guide for Pavement Friction; The National Academies Press: Washington, DC, USA, 2009. [Google Scholar]
- Villani, M.M.; Artamendi, I.; Kane, M.; Scarpas, A. (Tom) Contribution of Hysteresis Component of Tire Rubber Friction on Stone Surfaces. Transp. Res. Rec. 2011, 2227, 153–162. [Google Scholar] [CrossRef]
- Forster, S.W. Pavement Microtexture and Its Relation to Skid Resistance. Transp. Res. Rec. 1989, 1215, 151–164. [Google Scholar]
- Chu, L.; Cui, X.; Zhang, K.; Fwa, T.F.; Han, S. Directional Skid Resistance Characteristics of Road Pavement: Implications for Friction Measurements by British Pendulum Tester and Dynamic Friction Tester. Transp. Res. Rec. 2019, 2673, 793–803. [Google Scholar] [CrossRef]
- Chu, L.; Zhou, B.; Fwa, T.F. Directional Characteristics of Traffic Polishing Effect on Pavement Skid Resistance. Int. J. Pavement Eng. 2022, 23, 2937–2953. [Google Scholar] [CrossRef]
- Do, M.-T.; Tang, Z.; Kane, M.; de Larrard, F. Pavement Polishing—Development of a Dedicated Laboratory Test and Its Correlation with Road Results. Wear 2007, 263, 36–42. [Google Scholar] [CrossRef]
- Do, M.-T.; Tang, Z.; Kane, M.; De Larrard, F. Evolution of Road-Surface Skid-Resistance and Texture Due to Polishing. Wear 2009, 266, 574–577. [Google Scholar] [CrossRef]
- Zou, Y.; Yang, G.; Huang, W.; Lu, Y.; Qiu, Y.; Wang, K.C.P. Study of Pavement Micro- and Macro-Texture Evolution Due to Traffic Polishing Using 3D Areal Parameters. Materials 2021, 14, 5769. [Google Scholar] [CrossRef]
- ASTM E965-15; Standard Test Method for Measuring Pavement Macrotexture Depth Using a Volumtric Technique. ASTM: West Conshohocken, PA, USA, 2019.
- ASTM E1845-01; Standard Practice for Calculating Pavement Macrotexture Mean Profile Depth. ASTM: West Conshohocken, PA, USA, 2015.
- Pomoni, M.; Plati, C.; Loizos, A.; Yannis, G. Investigation of Pavement Skid Resistance and Macrotexture on a Long-Term Basis. Int. J. Pavement Eng. 2022, 23, 1060–1069. [Google Scholar] [CrossRef]
- Kouchaki, S.; Roshani, H.; Prozzi, J.A.; Garcia, N.Z.; Hernandez, J.B. Field Investigation of Relationship between Pavement Surface Texture and Friction. Transp. Res. Rec. 2018, 2672, 395–407. [Google Scholar] [CrossRef]
- Nataadmadja, A.D.; Do, M.T.; Wilson, D.J.; Costello, S.B. Quantifying Aggregate Microtexture with Respect to Wear—Case of New Zealand Aggregates. Wear 2015, 332–333, 907–917. [Google Scholar] [CrossRef]
- Serigos, P.A.; De Fortier Smit, A.; Prozzi, J.A. Incorporating Surface Microtexture in the Prediction of Skid Resistance of Flexible Pavements. Transp. Res. Rec. 2014, 2457, 105–113. [Google Scholar] [CrossRef]
- International Organization for Standardization. Geometrical Product Specifications (GPS) Surface Texture: Areal; International Organization for Standardization: Geneva, Switzerland, 2021. [Google Scholar]
- Hofko, B.; Kugler, H.; Chankov, G.; Spielhofer, R. A Laboratory Procedure for Predicting Skid and Polishing Resistance of Road Surfaces. Int. J. Pavement Eng. 2019, 20, 439–447. [Google Scholar] [CrossRef]
- Rezaei, A.; Masad, E.; Chowdhury, A.; Harris, P. Predicting Asphalt Mixture Skid Resistance by Aggregate Characteristics and Gradation. Transp. Res. Rec. 2009, 2104, 24–33. [Google Scholar] [CrossRef]
- Li, L.; Guler, S.I.; Donnell, E.T. Pavement Friction Degradation Based on Pennsylvania Field Test Data. Transp. Res. Rec. 2017, 2639, 11–19. [Google Scholar] [CrossRef]
- Kane, M.; Do, M.-T.; Cerezo, V.; Rado, Z.; Khelifi, C. Contribution to Pavement Friction Modelling: An Introduction of the Wetting Effect. Int. J. Pavement Eng. 2019, 20, 965–976. [Google Scholar] [CrossRef]
- de León Izeppi, E.; Flintsch, G.; Katicha, S.; McCarthy, R.; McGhee, K. Locked-Wheel and Sideway-Force CFME Friction Testing Equipment Comparison and Evaluation Report; United States Federal Highway Administration: Washington, DC, USA, 2019. [Google Scholar]
- Henry, J.J. Evaluation of Pavement Friction Characteristics; Transportation Research Board: Washington, DC, USA, 2000; Volume 291. [Google Scholar]
- Kogbara, R.B.; Masad, E.A.; Woodward, D.; Millar, P. Relating Surface Texture Parameters from Close Range Photogrammetry to Grip-Tester Pavement Friction Measurements. Constr. Build. Mater. 2018, 166, 227–240. [Google Scholar] [CrossRef]
- Meegoda, J.N.; Gao, S. Evaluation of Pavement Skid Resistance Using High Speed Texture Measurement. J. Traffic Transp. Eng. (Eng. Ed.) 2015, 2, 382–390. [Google Scholar] [CrossRef]
- Wang, D.; Zhang, Z.; Kollmann, J.; Oeser, M. Development of Aggregate Micro-Texture during Polishing and Correlation with Skid Resistance. Int. J. Pavement Eng. 2020, 21, 629–641. [Google Scholar] [CrossRef]
- Wang, D.; Liu, P.; Wang, H.; Ueckermann, A.; Oeser, M. Modeling and Testing of Road Surface Aggregate Wearing Behaviour. Constr. Build. Mater. 2017, 131, 129–137. [Google Scholar] [CrossRef]
- Khasawneh, M.; Smadi, M.; Zelelew, H. Investigation of the Factors Influencing Wavelet-Based Macrotexture Values for HMA Pavements. Road Mater. Pavement Des. 2016, 17, 779–791. [Google Scholar] [CrossRef]
- Plati, C.; Pomoni, M. Impact of Traffic Volume on Pavement Macrotexture and Skid Resistance Long-Term Performance. Transp. Res. Rec. 2019, 2673, 314–322. [Google Scholar] [CrossRef]
- Kováč, M.; Brna, M.; Decký, M. Pavement Friction Prediction Using 3D Texture Parameters. Coatings 2021, 11, 1180. [Google Scholar] [CrossRef]
- Koné, A.; Es-Sabar, A.; Do, M.-T. Application of Machine Learning Models to the Analysis of Skid Resistance Data. Lubricants 2023, 11, 328. [Google Scholar] [CrossRef]
- Yang, G.; Li, Q.J.; Zhan, Y.; Fei, Y.; Zhang, A. Convolutional Neural Network–Based Friction Model Using Pavement Texture Data. J. Comput. Civ. Eng. 2018, 32, 04018052. [Google Scholar] [CrossRef]
- Lu, J.; Pan, B.; Liu, Q.; Sun, M.; Liu, P.; Oeser, M. A Novel Noncontact Method for the Pavement Skid Resistance Evaluation Based on Surface Texture. Tribol. Int. 2022, 165, 107311. [Google Scholar] [CrossRef]
- Yang, G.; Yu, W.; Li, Q.J.; Wang, K.; Peng, Y.; Zhang, A. Random Forest–Based Pavement Surface Friction Prediction Using High-Resolution 3D Image Data. J. Test. Eval. 2021, 49, 1141–1152. [Google Scholar] [CrossRef]
- Zou, Y.; Yang, G.; Cao, M. Neural Network-Based Prediction of Sideway Force Coefficient for Asphalt Pavement Using High-Resolution 3D Texture Data. Int. J. Pavement Eng. 2022, 23, 3157–3166. [Google Scholar] [CrossRef]
- Yang, G.; Wang, K.C.; Li, J.Q.; Wang, G. A Novel 0.1 mm 3D Laser Imaging Technology for Pavement Safety Measurement. Sensors 2022, 22, 8038. [Google Scholar] [CrossRef]
- Yang, G.; Wang, K.C.; Li, J.Q. Multiresolution Analysis of Three-Dimensional (3D) Surface Texture for Asphalt Pavement Friction Estimation. Int. J. Pavement Eng. 2021, 22, 1882–1891. [Google Scholar] [CrossRef]
- Kane, M.; Lim, M.; Tan Do, M.; Edmondson, V. A New Predictive Skid Resistance Model (PSRM) for Pavement Evolution Due to Texture Polishing by Traffic. Constr. Build. Mater. 2022, 342, 128052. [Google Scholar] [CrossRef]
- Do, M.-T.; Cerezo, V.; Ropert, C. Questioning the Approach to Predict the Evolution of Tire/Road Friction with Traffic from Road Surface Texture. Surf. Topogr. Metrol. Prop. 2020, 8, 024004. [Google Scholar] [CrossRef]
- Yu, M.; Yang, Z.; You, Z.; Luo, Y.; Li, J.; Yang, L. Laboratory Investigation of Traffic Effect on the Long-Term Skid Resistance of Asphalt Pavements. Constr. Build. Mater. 2023, 401, 132642. [Google Scholar] [CrossRef]
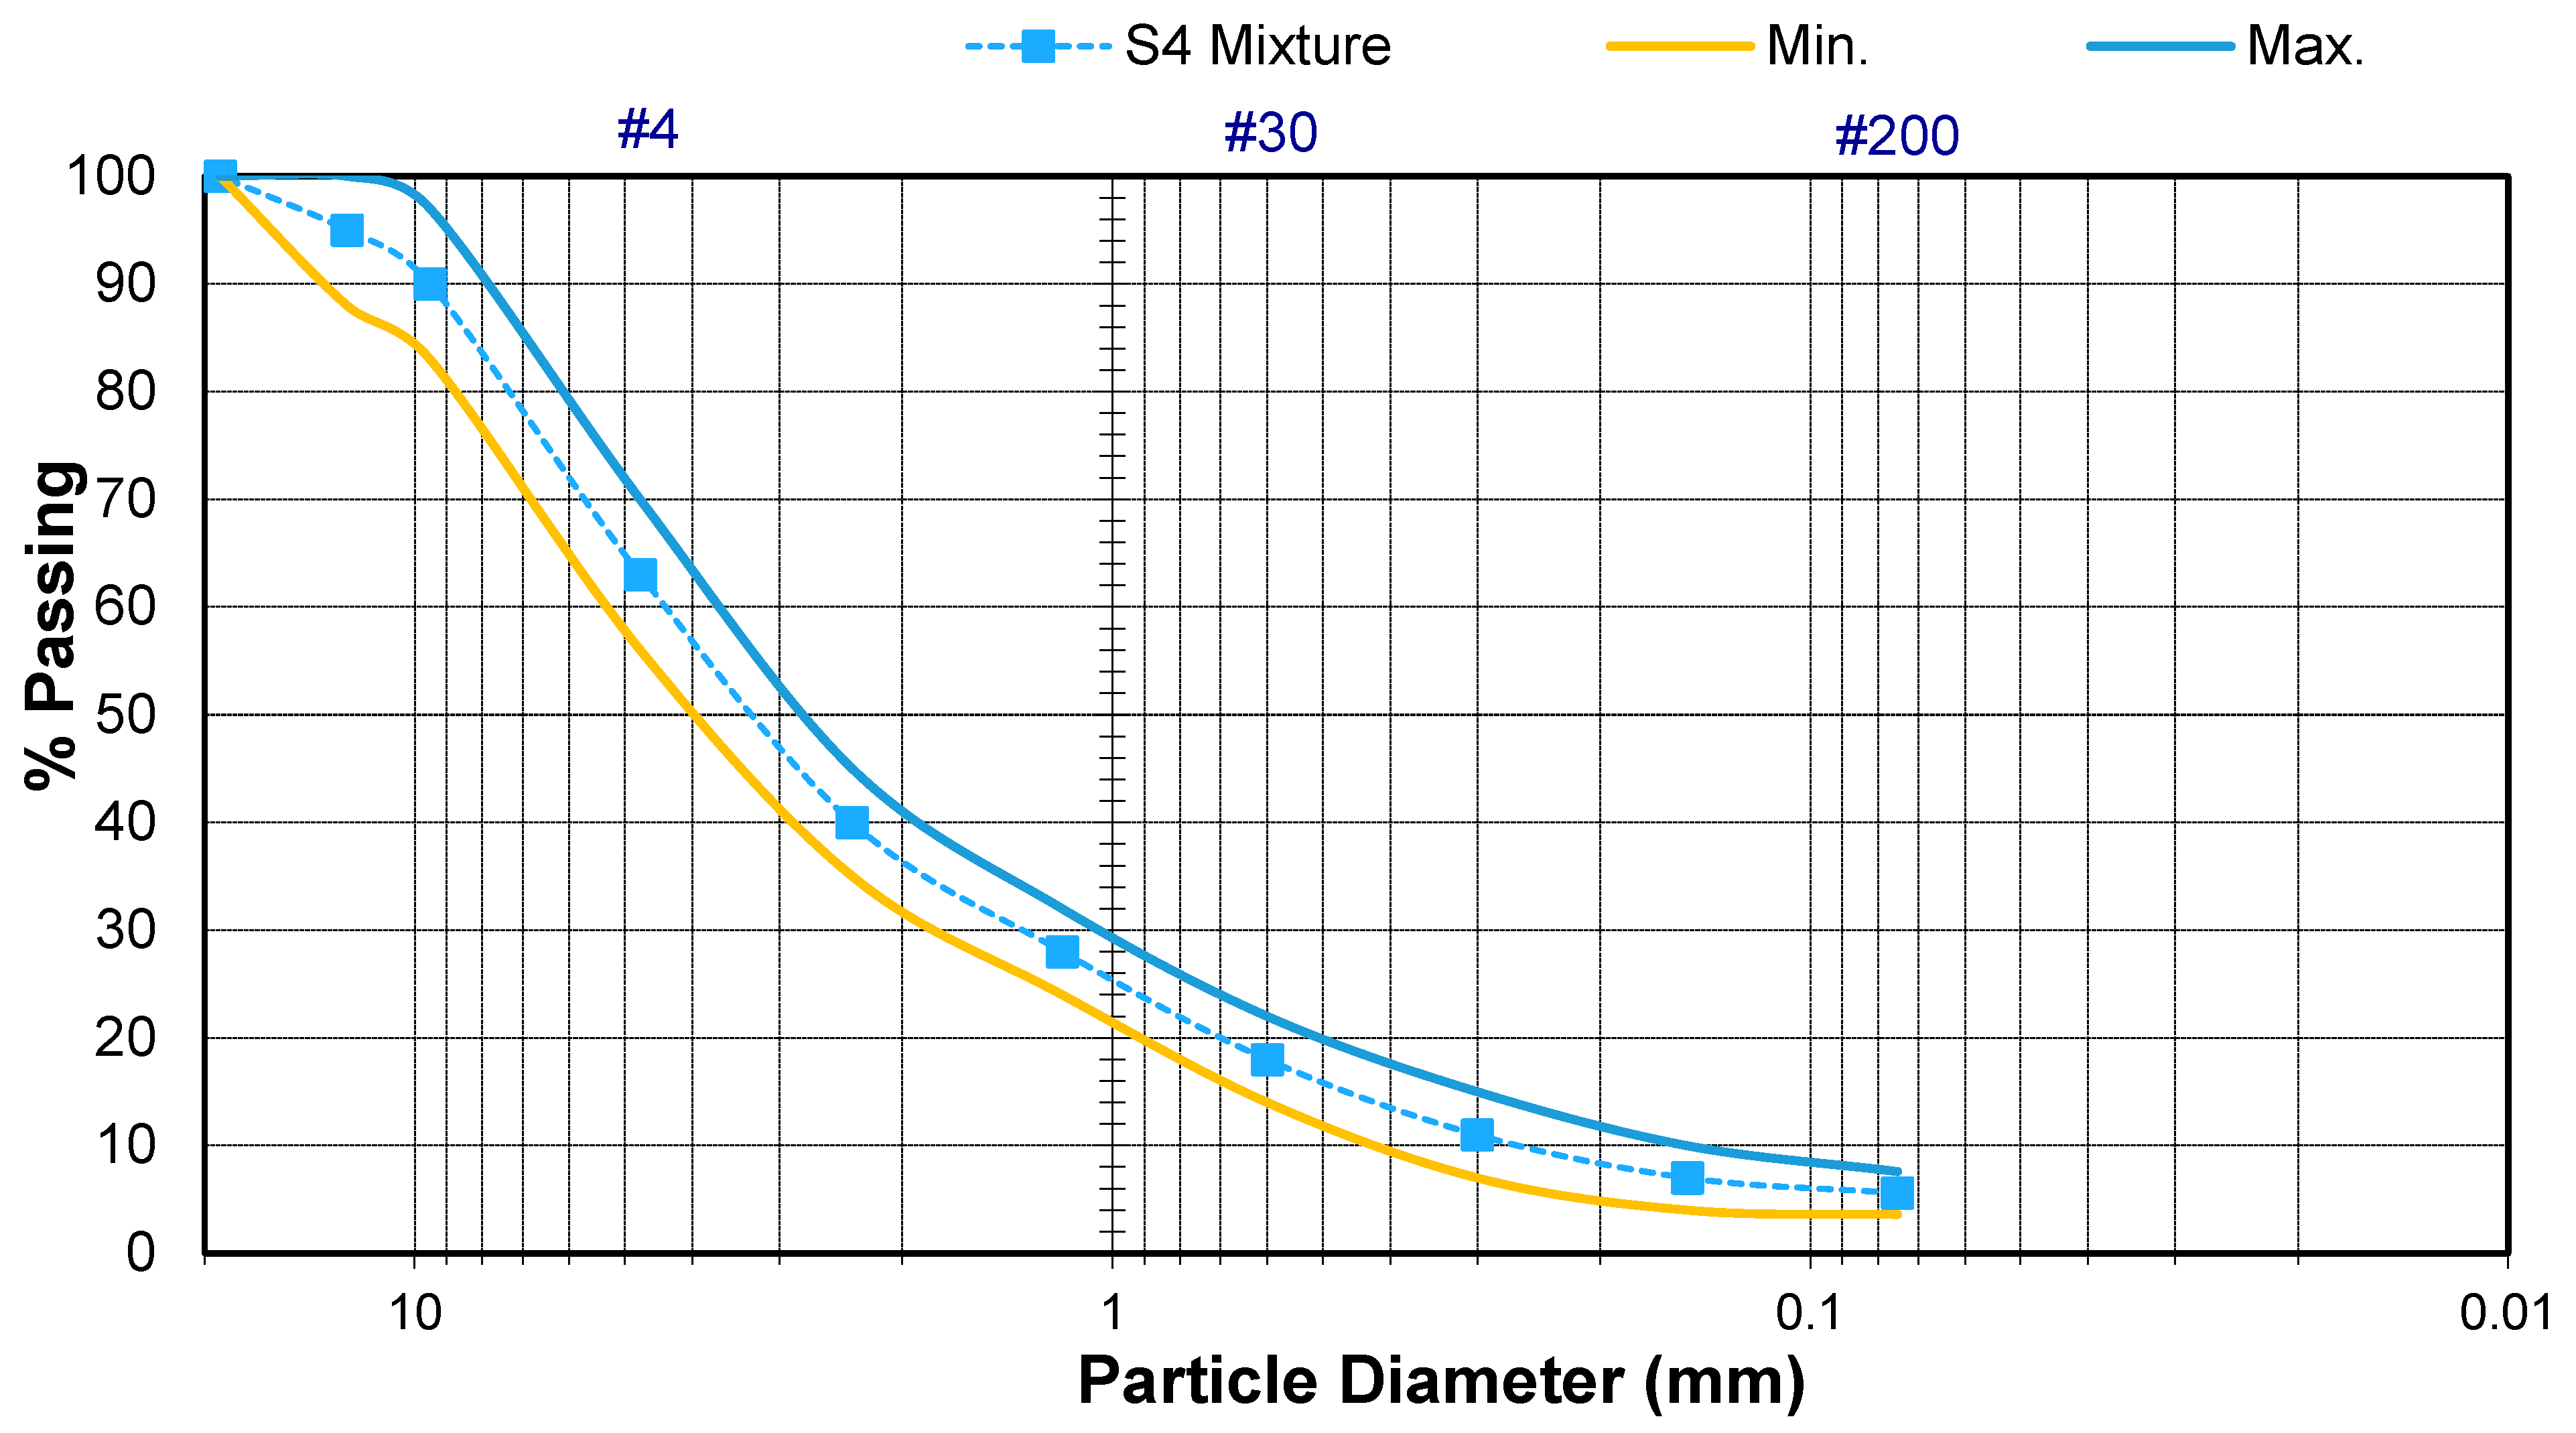





| Properties | AC | Requirement | |
|---|---|---|---|
| Aggregate | Fractured Faces (%) | 98/100 | 98/95 min. |
| Flat and Elongated Particles (%) | 0 | 10 max. | |
| Sand Equivalent (%) | 86 | 45 min. | |
| LA Abrasion (%) | 30.2 | 40 max. | |
| Micro-Deval (%) | 22.6 | 25 max. | |
| Durability Index (%) | 46 | 40 min. | |
| Insoluble Residue (%) | 42.5 | 40 min. | |
| Mixture | ITS (psi) | 112.1 | 75 min. |
| Hamburg Rut Depth (mm) | 2.73 | 12.5 max | |
| TSR | 0.82 | 0.80 min | |
| Images for Calculating Texture Parameters | Friction Prediction Models | ||
|---|---|---|---|
| SMLR | NN | RF | |
| Whole Images | 81.13% | 89.52% | 94.23% |
| Macro- and Microimages | 94.04% | 94.29% | 94.63% |
| Day | Daily Volume (Veh/Day) | Daily Factors | Weighted Volume | ||
|---|---|---|---|---|---|
| Section 1 | Section 2 | Section 1 | Section 2 | ||
| Day 1 | 2975 | 3050 | 0.11 | 327 | 336 |
| Day 2 | 3215 | 3246 | 0.12 | 386 | 390 |
| Day 3 | 3121 | 3186 | 0.13 | 406 | 414 |
| Day 4 | 3197 | 3362 | 0.15 | 480 | 504 |
| Day 5 | 2742 | 2775 | 0.16 | 439 | 444 |
| Day 6 | 2786 | 2859 | 0.16 | 446 | 457 |
| Day 7 | 3222 | 3305 | 0.17 | 548 | 562 |
| ADT (sum) | 3031 | 3107 | |||
| Items | Testing Section 1 | Testing Section 2 | ||||
|---|---|---|---|---|---|---|
| Middle | Wheel Path | Edge | Middle | Wheel Path | Edge | |
| Average Friction Numbers | 0.28 | 0.26 | 0.45 | 0.29 | 0.26 | 0.45 |
| Accumulated Traffic (million) | 0.79 | 3.34 | 0.42 | 0.81 | 3.40 | 0.42 |
Disclaimer/Publisher’s Note: The statements, opinions and data contained in all publications are solely those of the individual author(s) and contributor(s) and not of MDPI and/or the editor(s). MDPI and/or the editor(s) disclaim responsibility for any injury to people or property resulting from any ideas, methods, instructions or products referred to in the content. |
© 2024 by the authors. Licensee MDPI, Basel, Switzerland. This article is an open access article distributed under the terms and conditions of the Creative Commons Attribution (CC BY) license (https://creativecommons.org/licenses/by/4.0/).
Share and Cite
Yang, G.; Chen, K.-T.; Wang, K.; Li, J.; Zou, Y. Field Study of Asphalt Pavement Texture and Skid Resistance under Traffic Polishing Using 0.01 mm 3D Images. Lubricants 2024, 12, 256. https://doi.org/10.3390/lubricants12070256
Yang G, Chen K-T, Wang K, Li J, Zou Y. Field Study of Asphalt Pavement Texture and Skid Resistance under Traffic Polishing Using 0.01 mm 3D Images. Lubricants. 2024; 12(7):256. https://doi.org/10.3390/lubricants12070256
Chicago/Turabian StyleYang, Guangwei, Kuan-Ting Chen, Kelvin Wang, Joshua Li, and Yiwen Zou. 2024. "Field Study of Asphalt Pavement Texture and Skid Resistance under Traffic Polishing Using 0.01 mm 3D Images" Lubricants 12, no. 7: 256. https://doi.org/10.3390/lubricants12070256
APA StyleYang, G., Chen, K.-T., Wang, K., Li, J., & Zou, Y. (2024). Field Study of Asphalt Pavement Texture and Skid Resistance under Traffic Polishing Using 0.01 mm 3D Images. Lubricants, 12(7), 256. https://doi.org/10.3390/lubricants12070256


