The Improvement of CrN Coatings Wear Resistance by Adjusting the Cycle Number of Electrochemical


Abstract
:1. Introduction
2. Experimental Methods
2.1. Deposition of CrN Coatings
2.2. Electrochemical Polarization Treatment of CrN Coatings
2.3. Structural and Mechanical Characterization
2.4. Tribological Characterization
2.5. Simulation of Electrochemical Polarization Process
3. Results
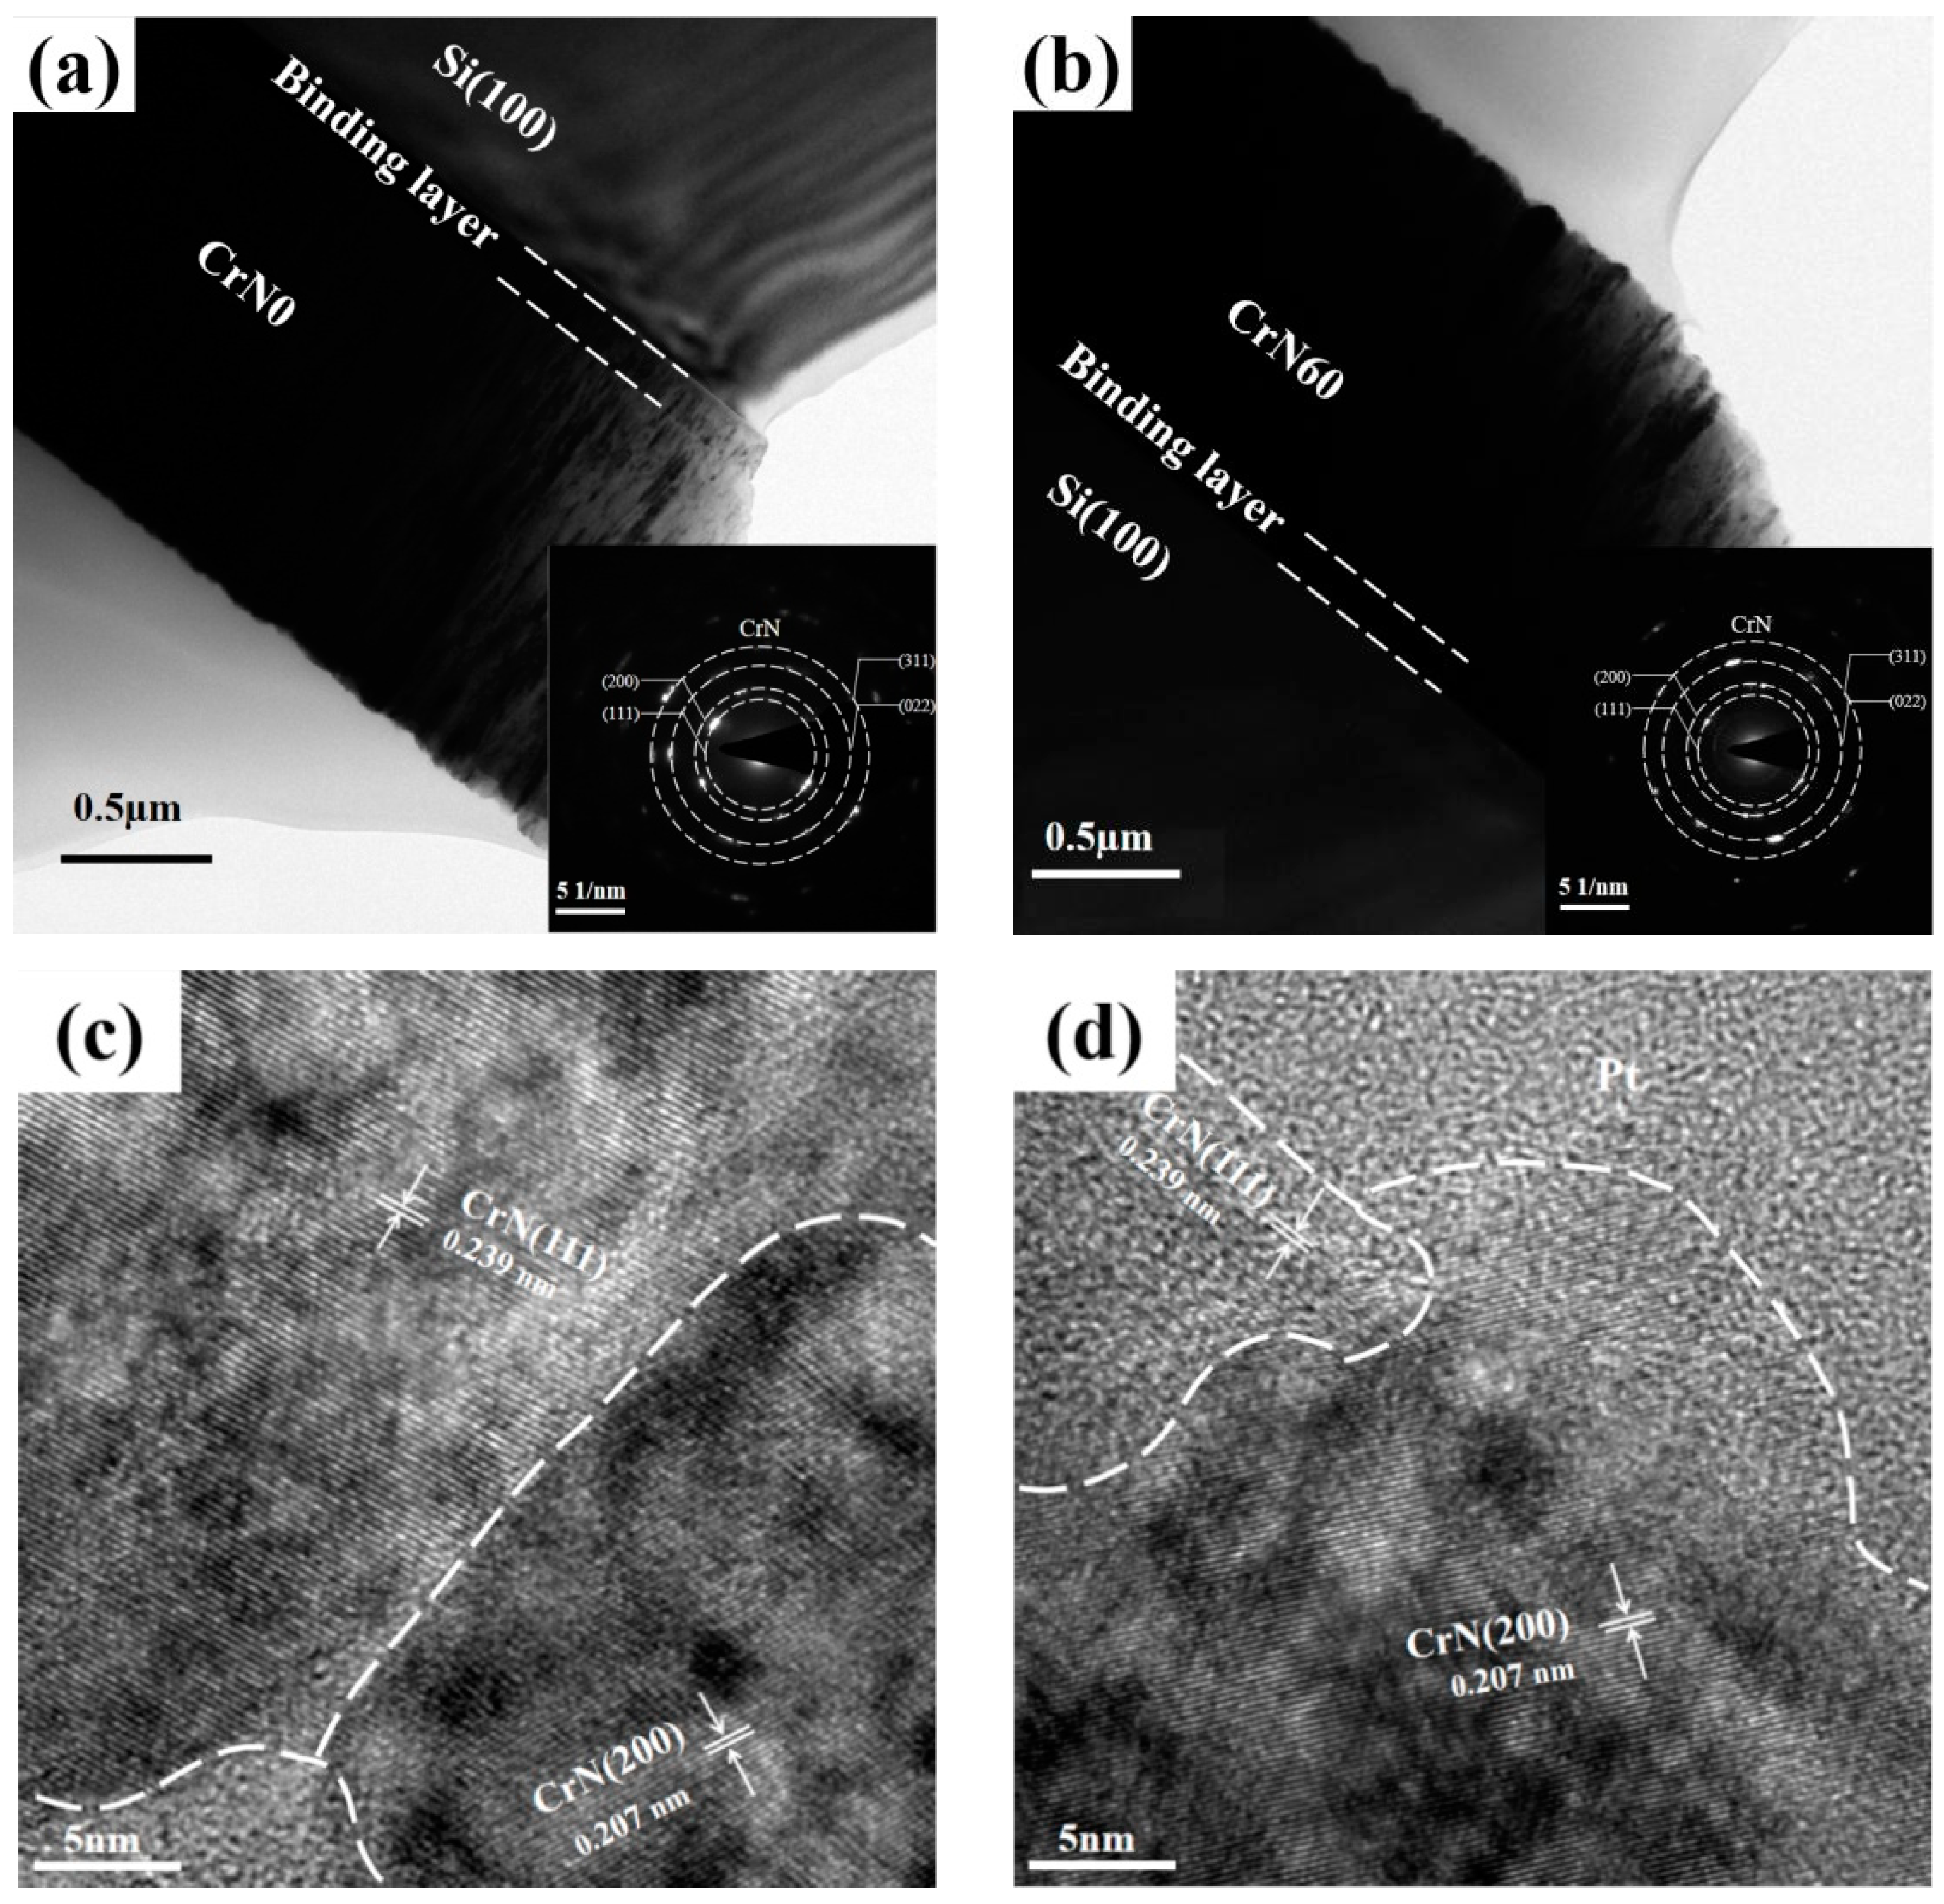
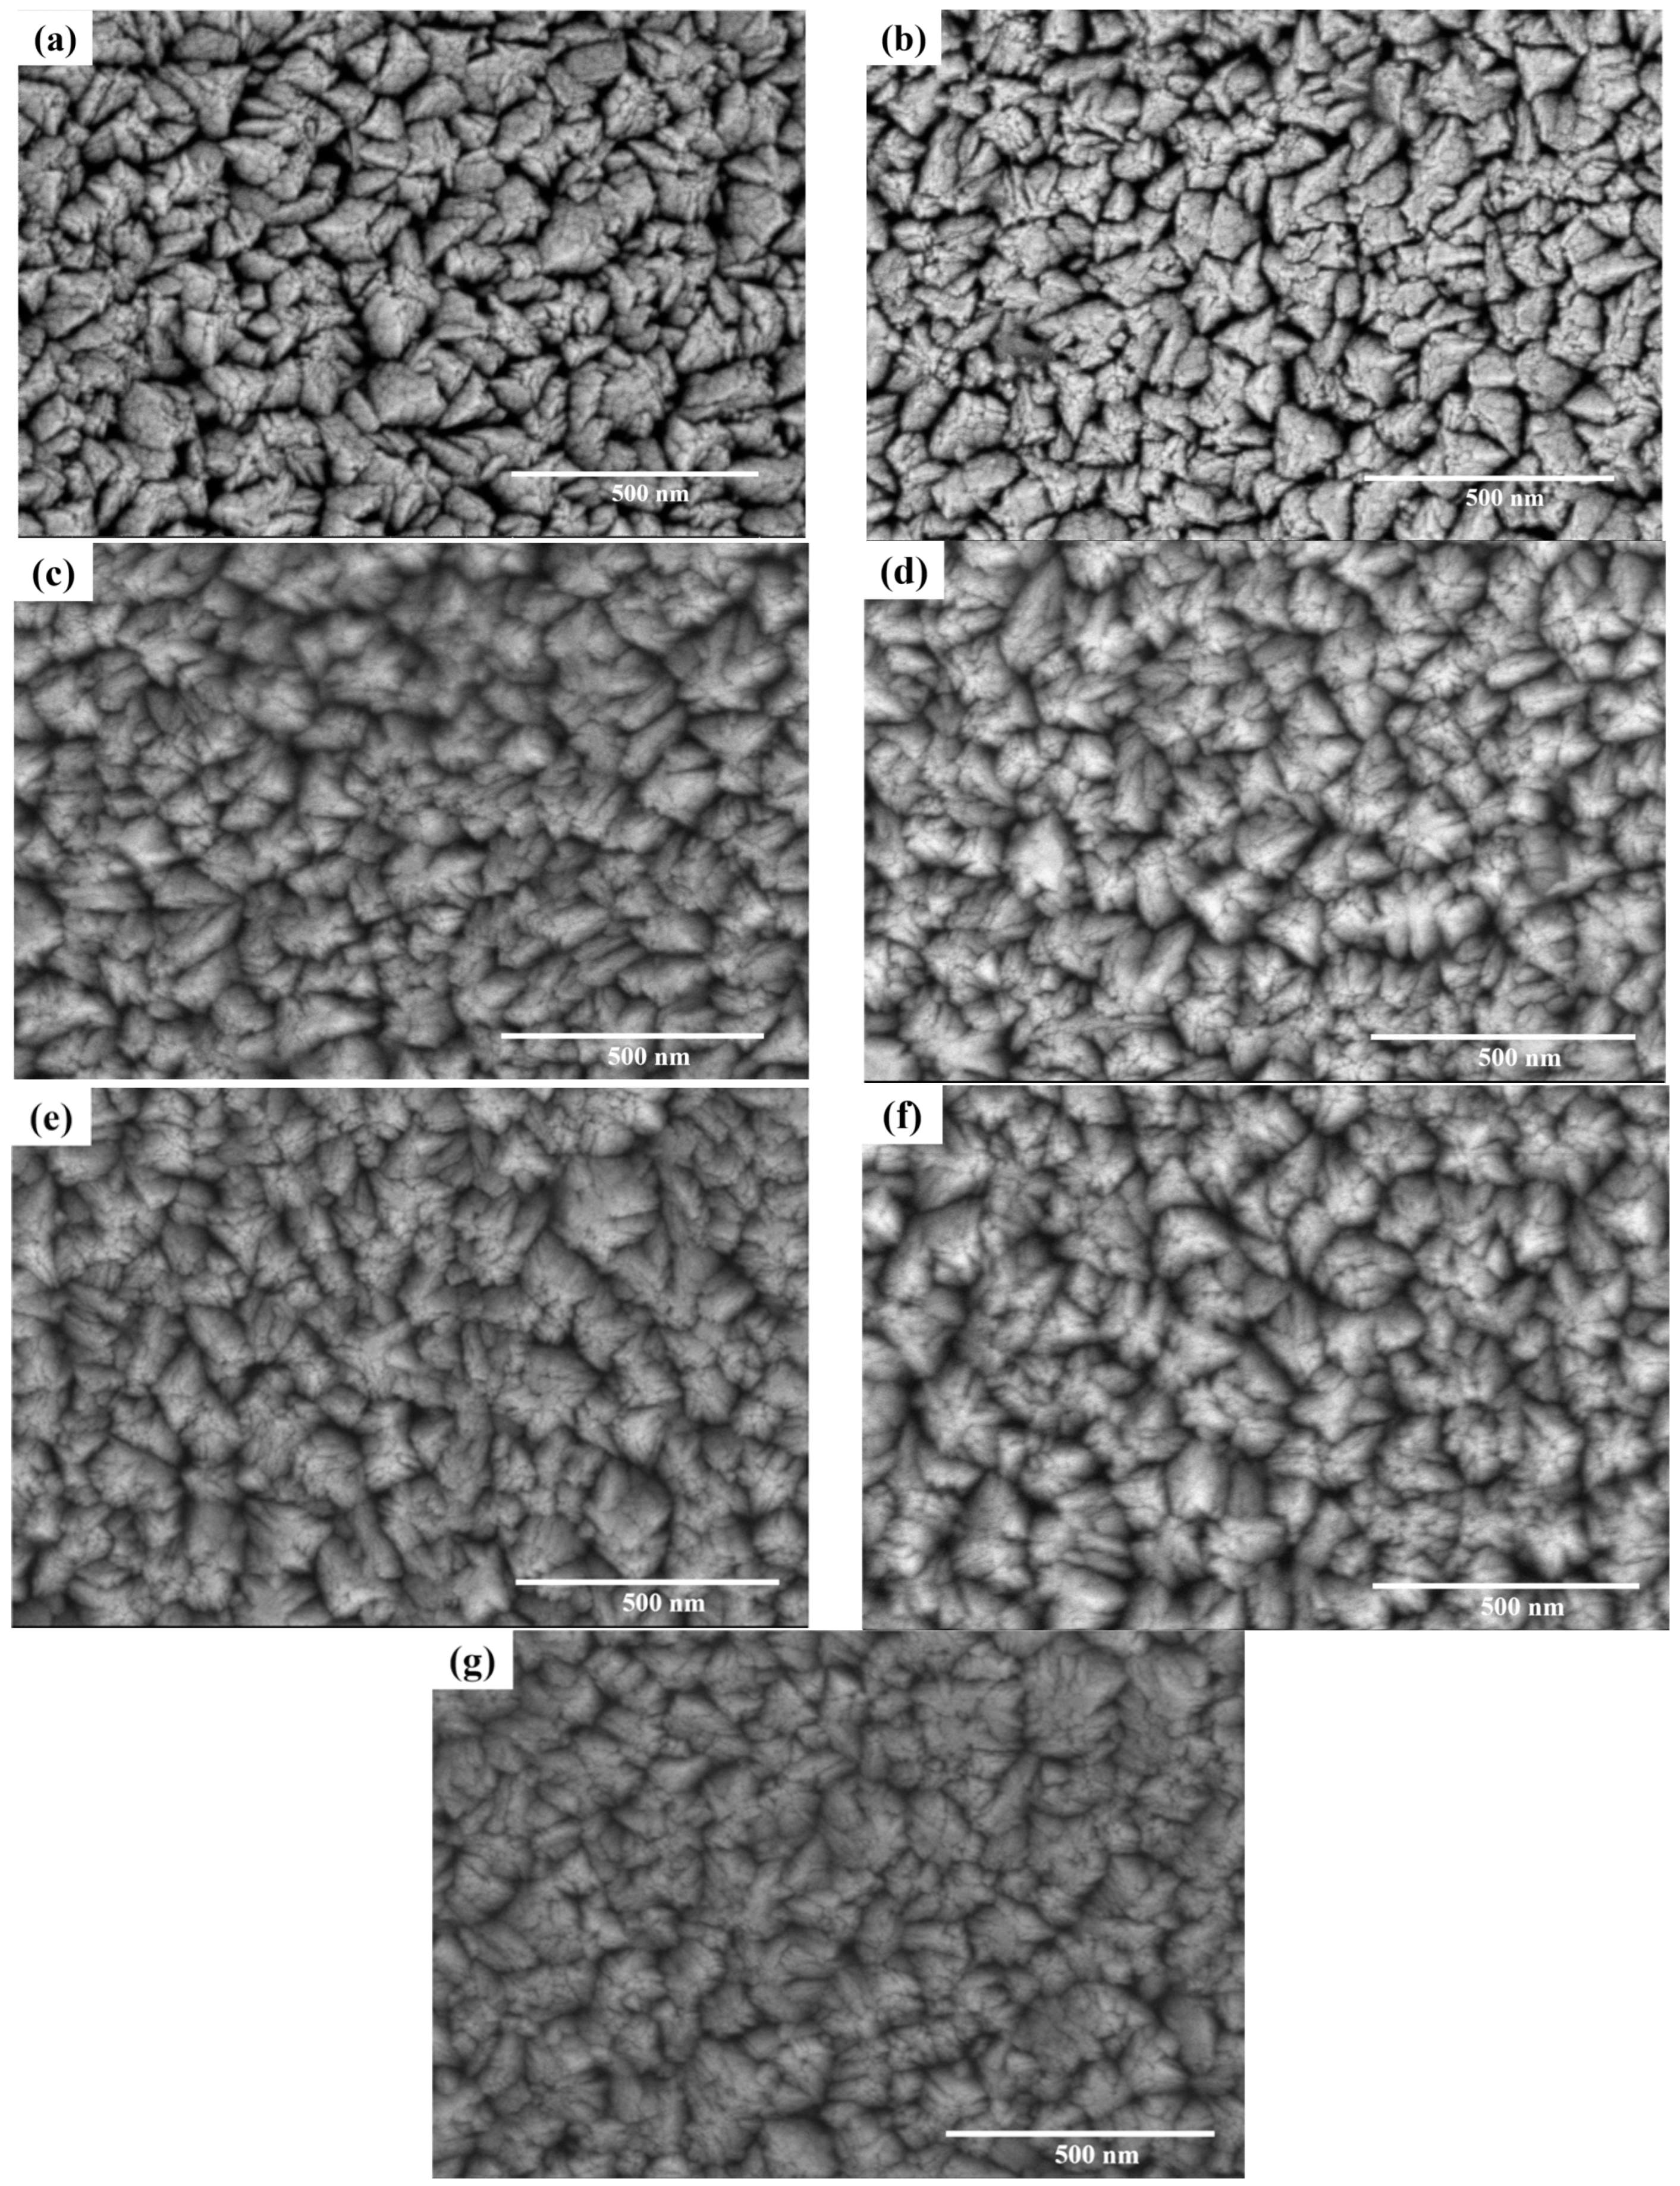
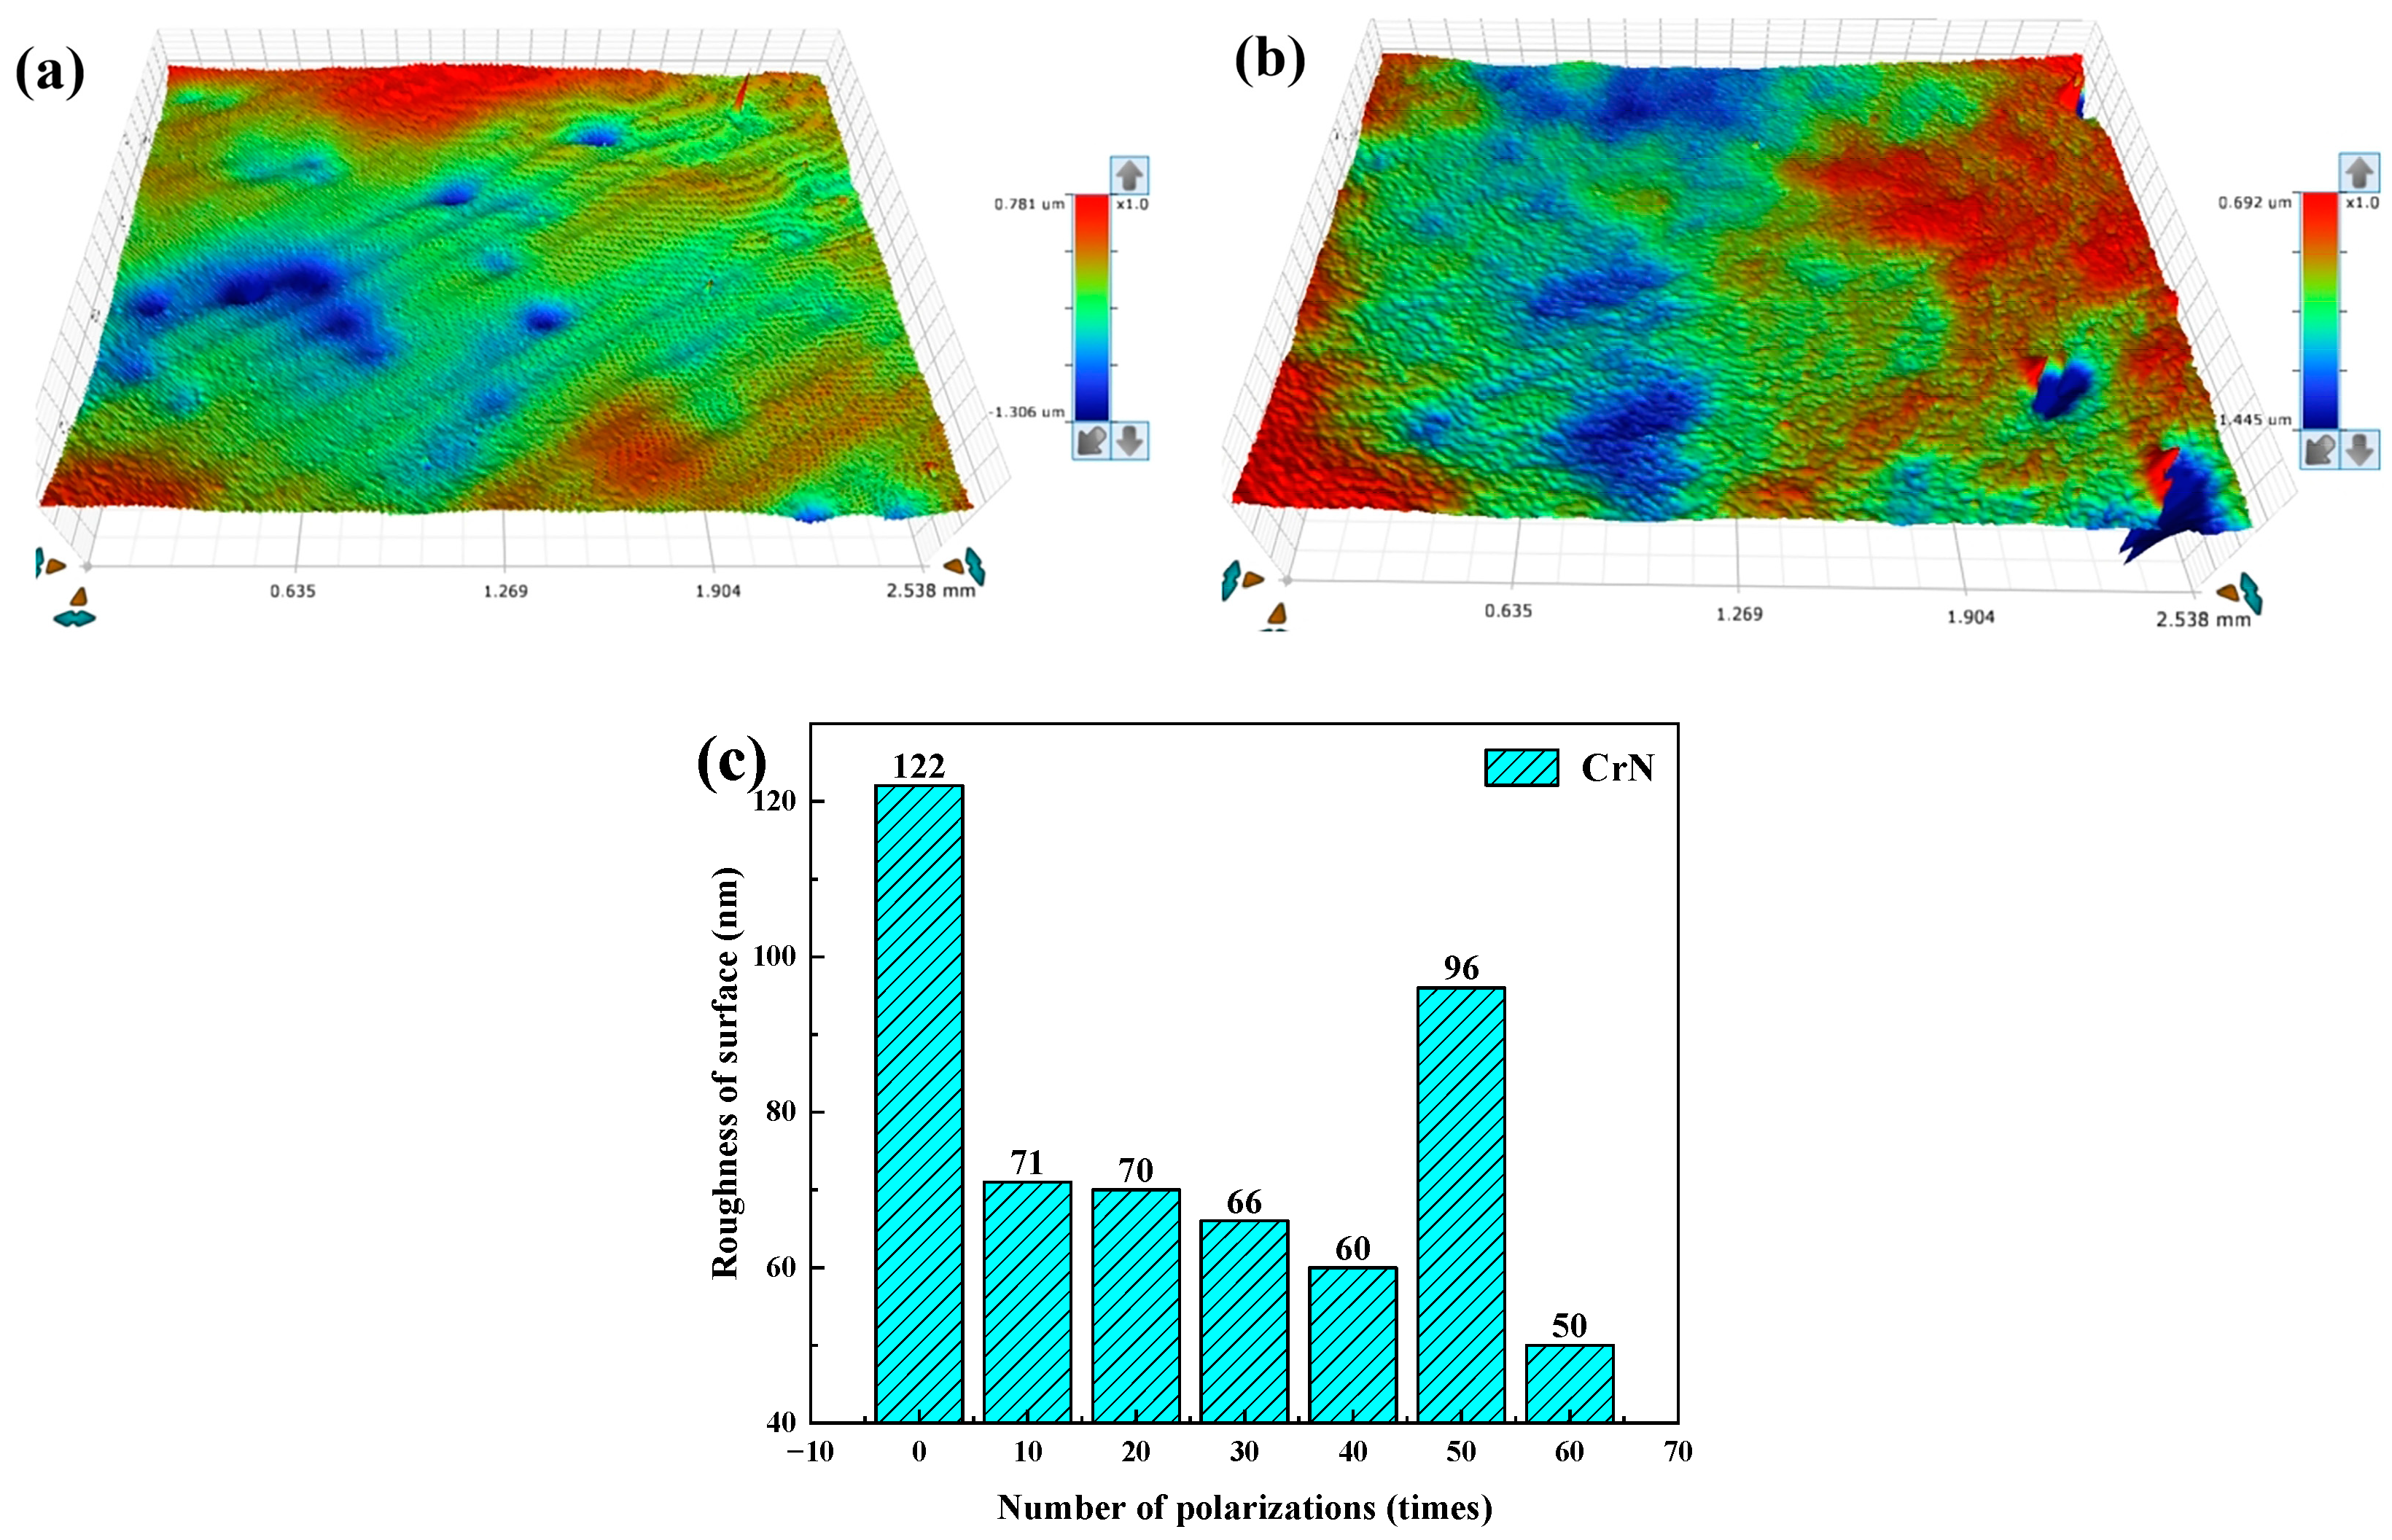
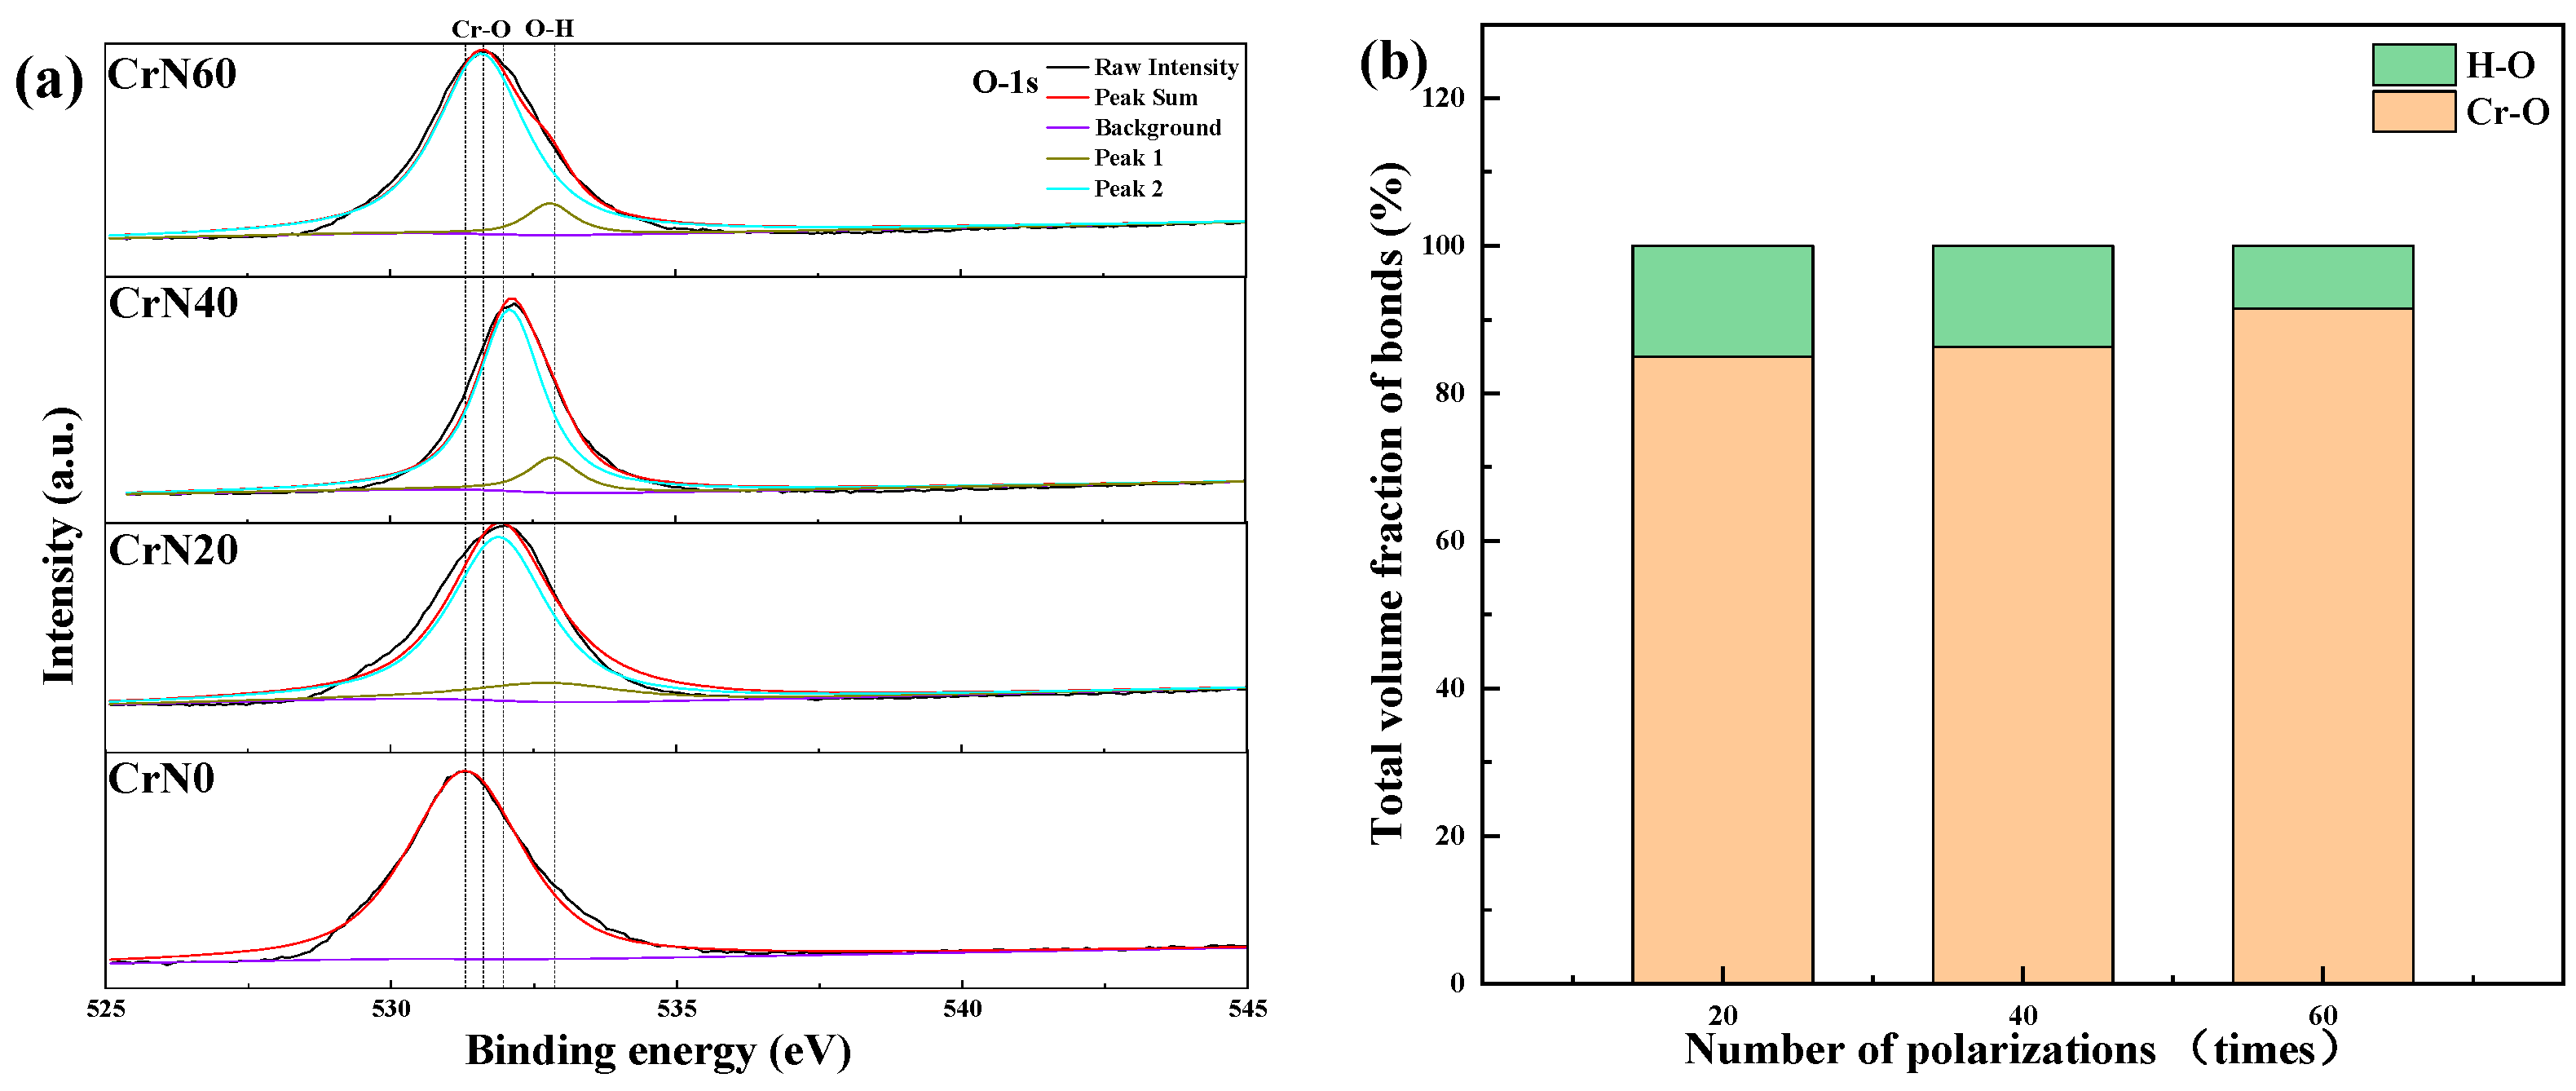
3.1. Microstructure
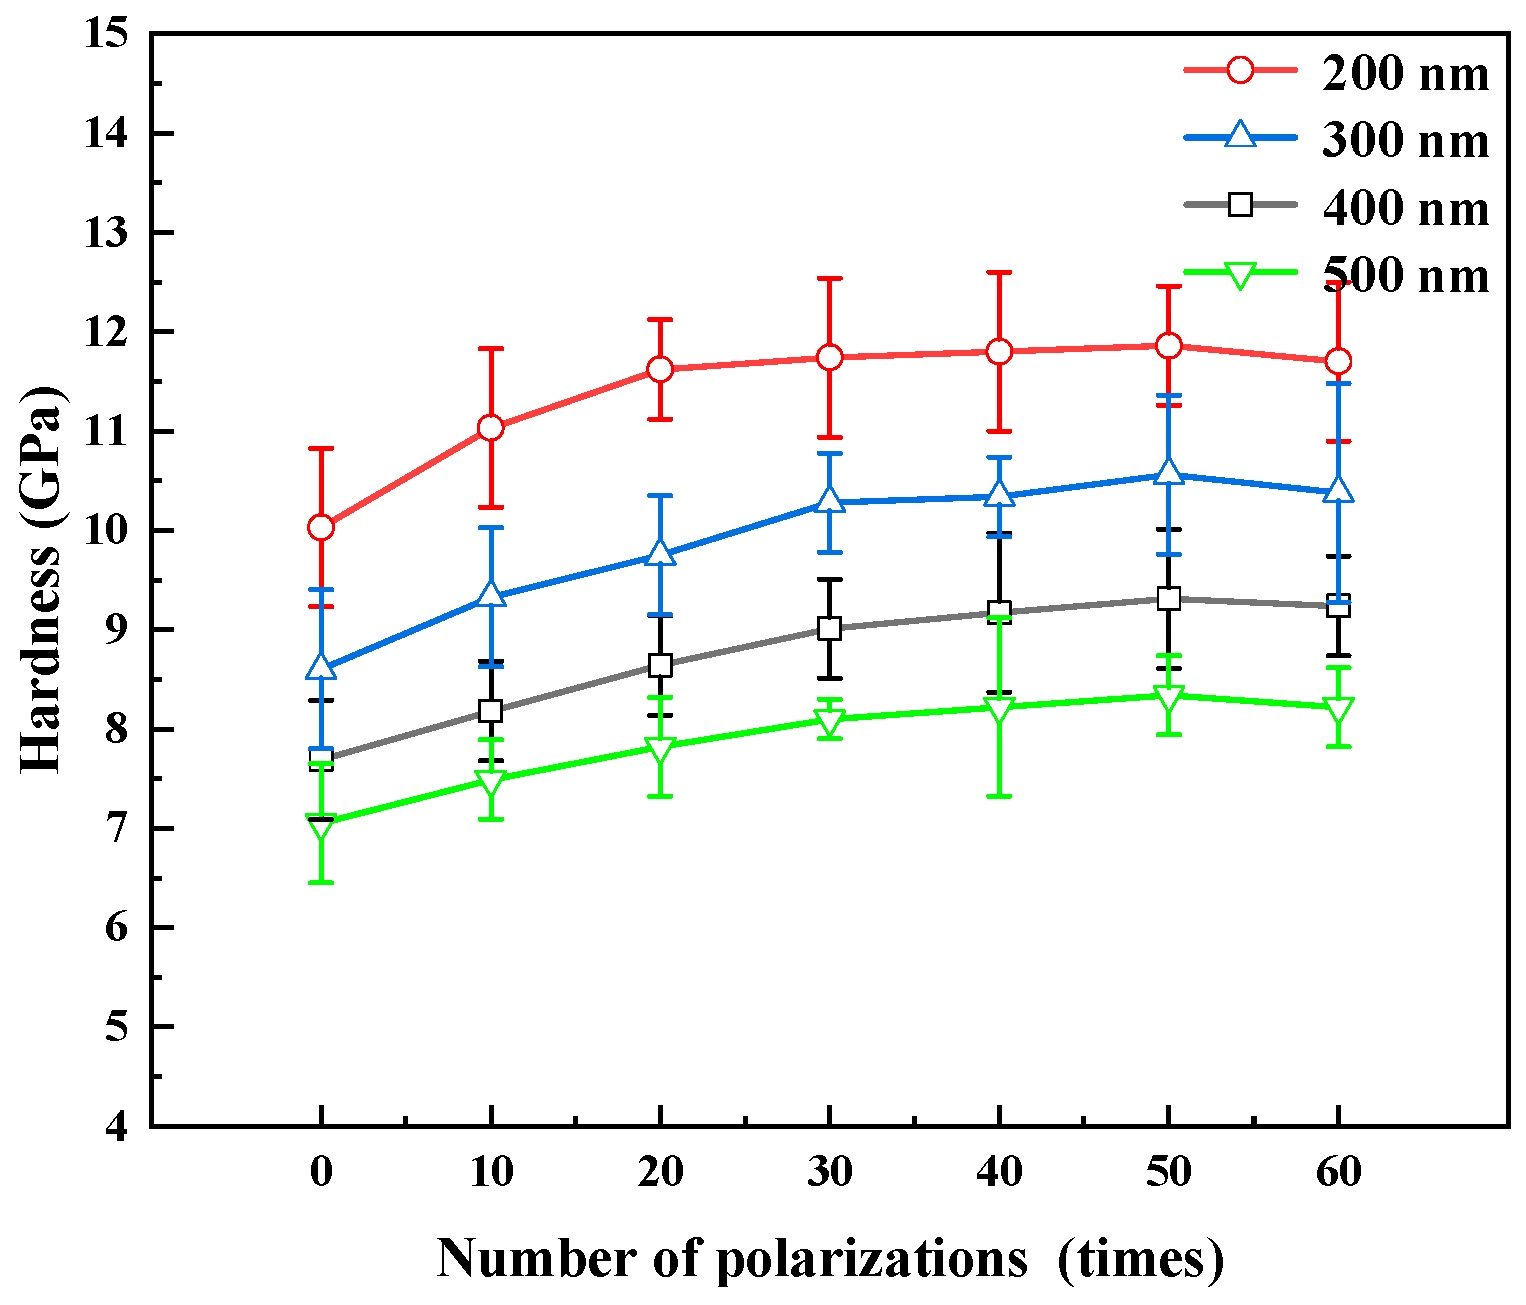
3.2. Mechanical Properties
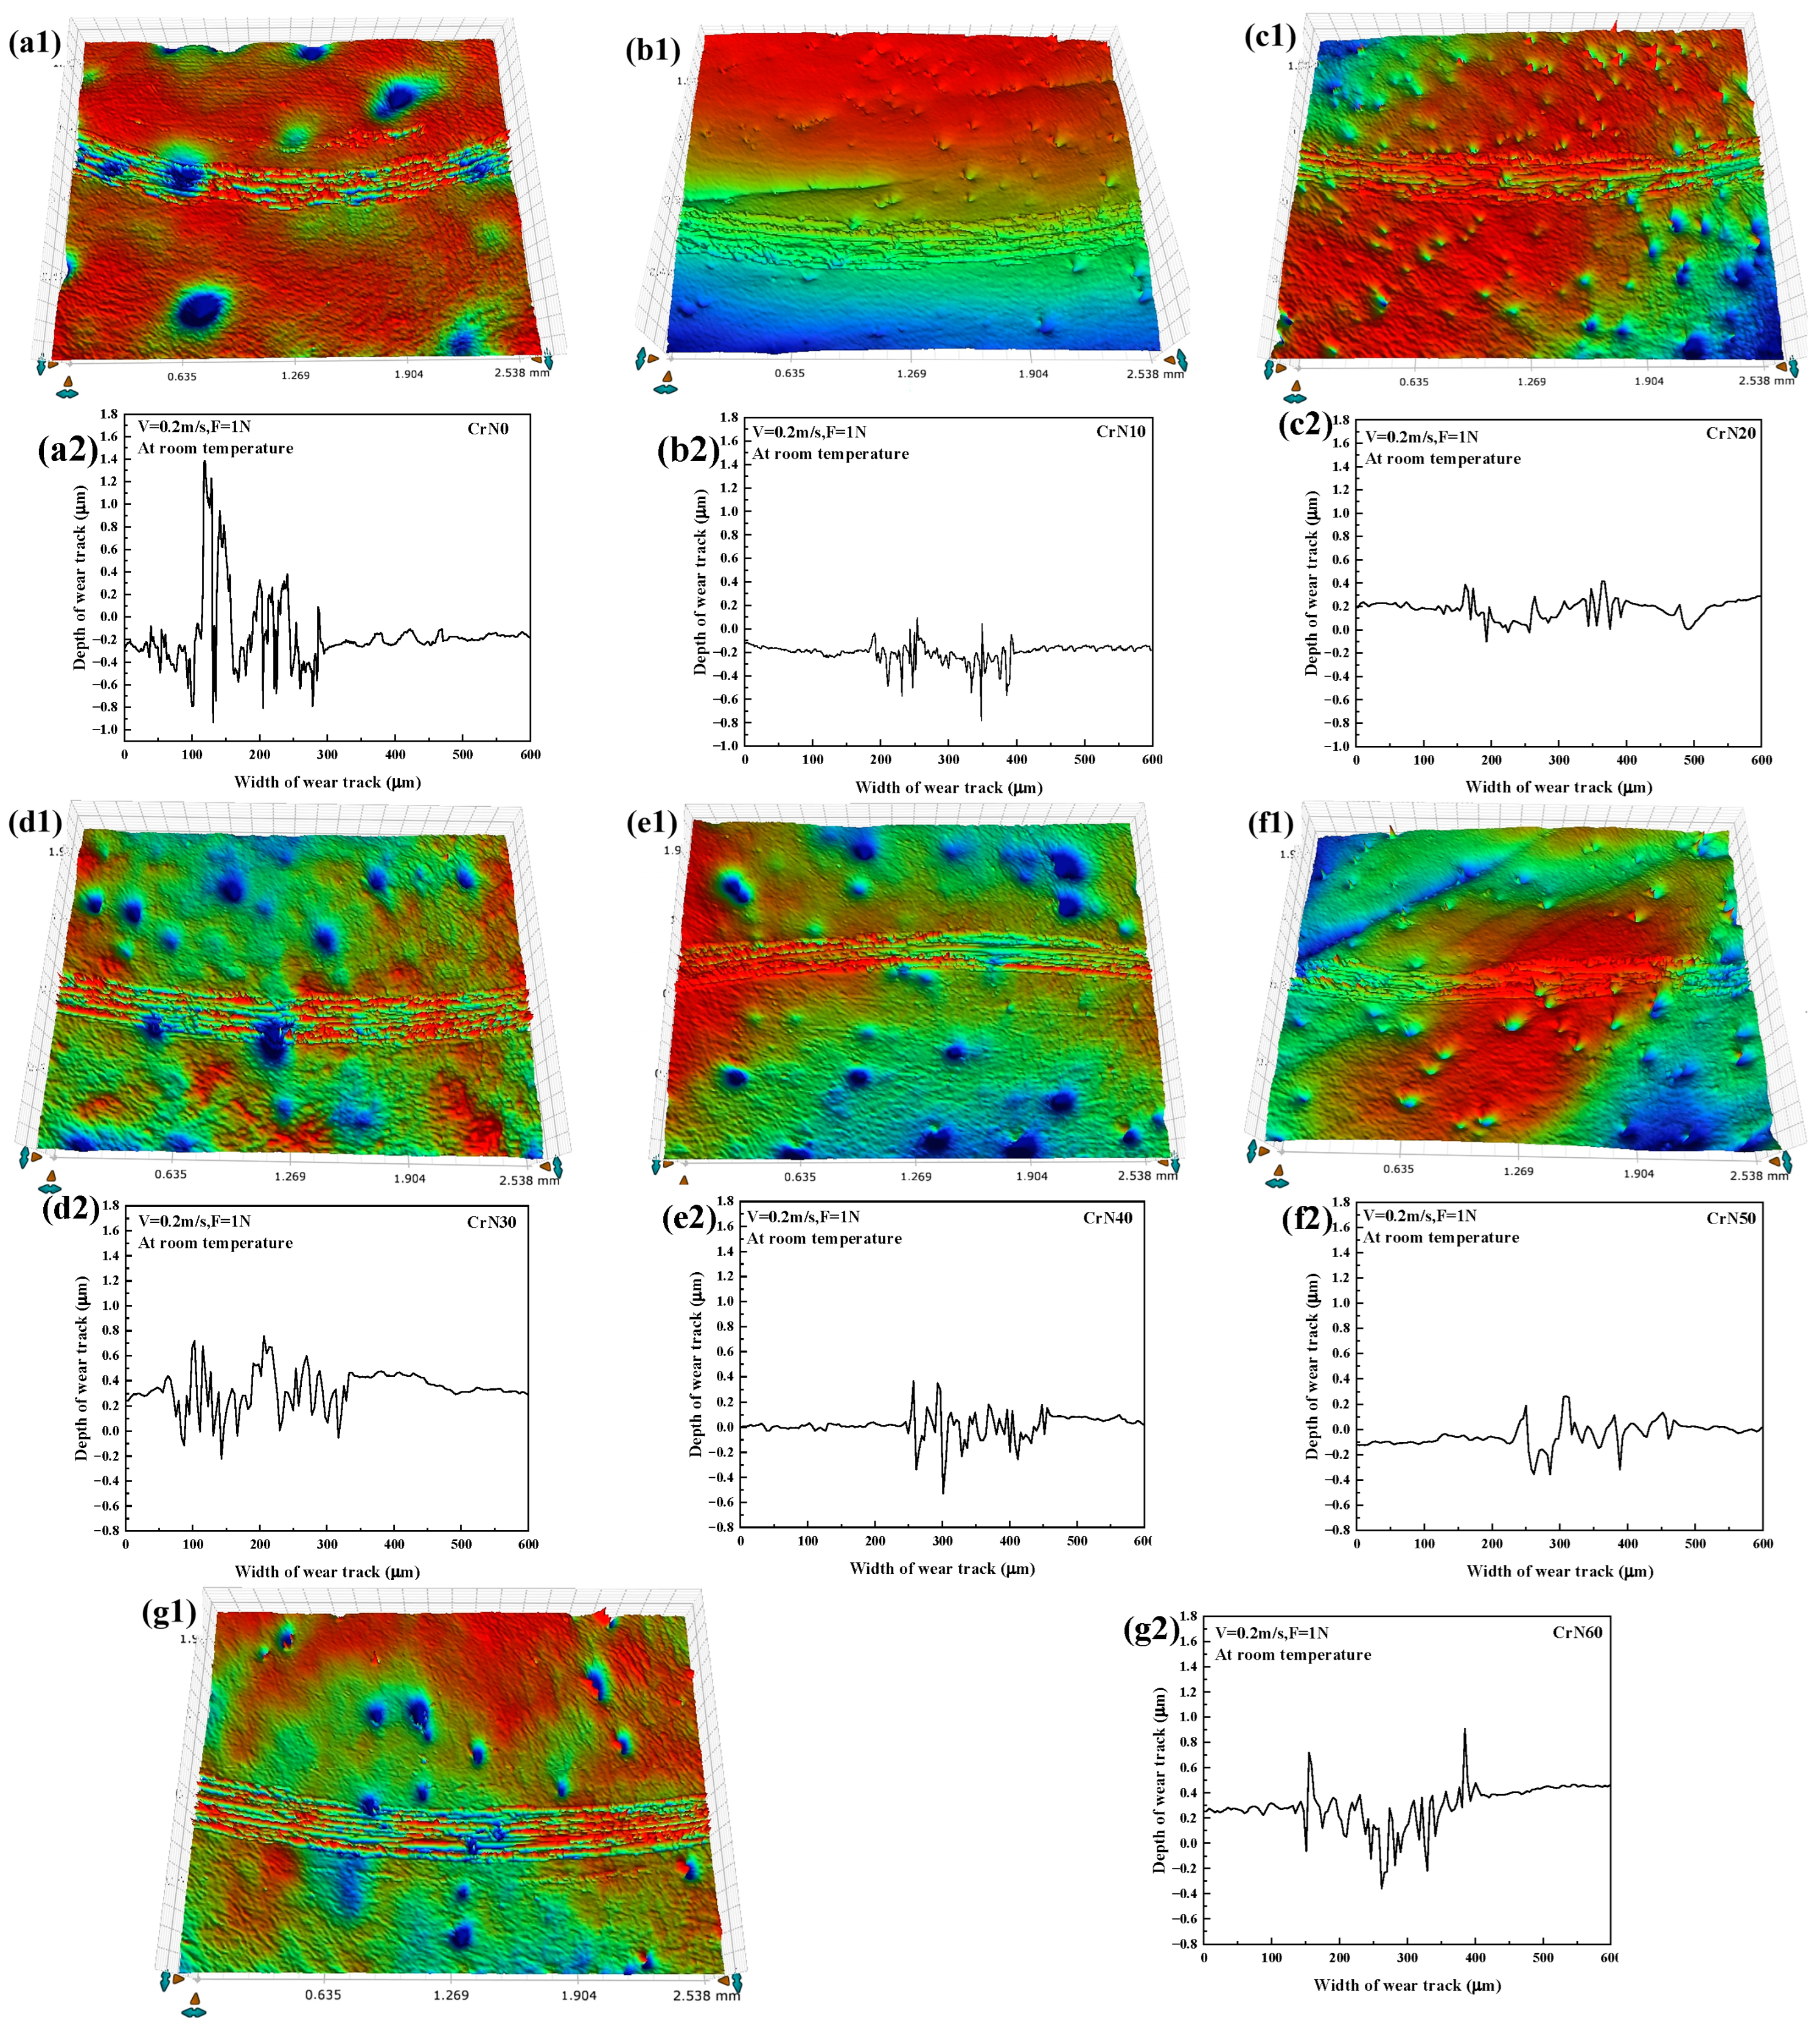
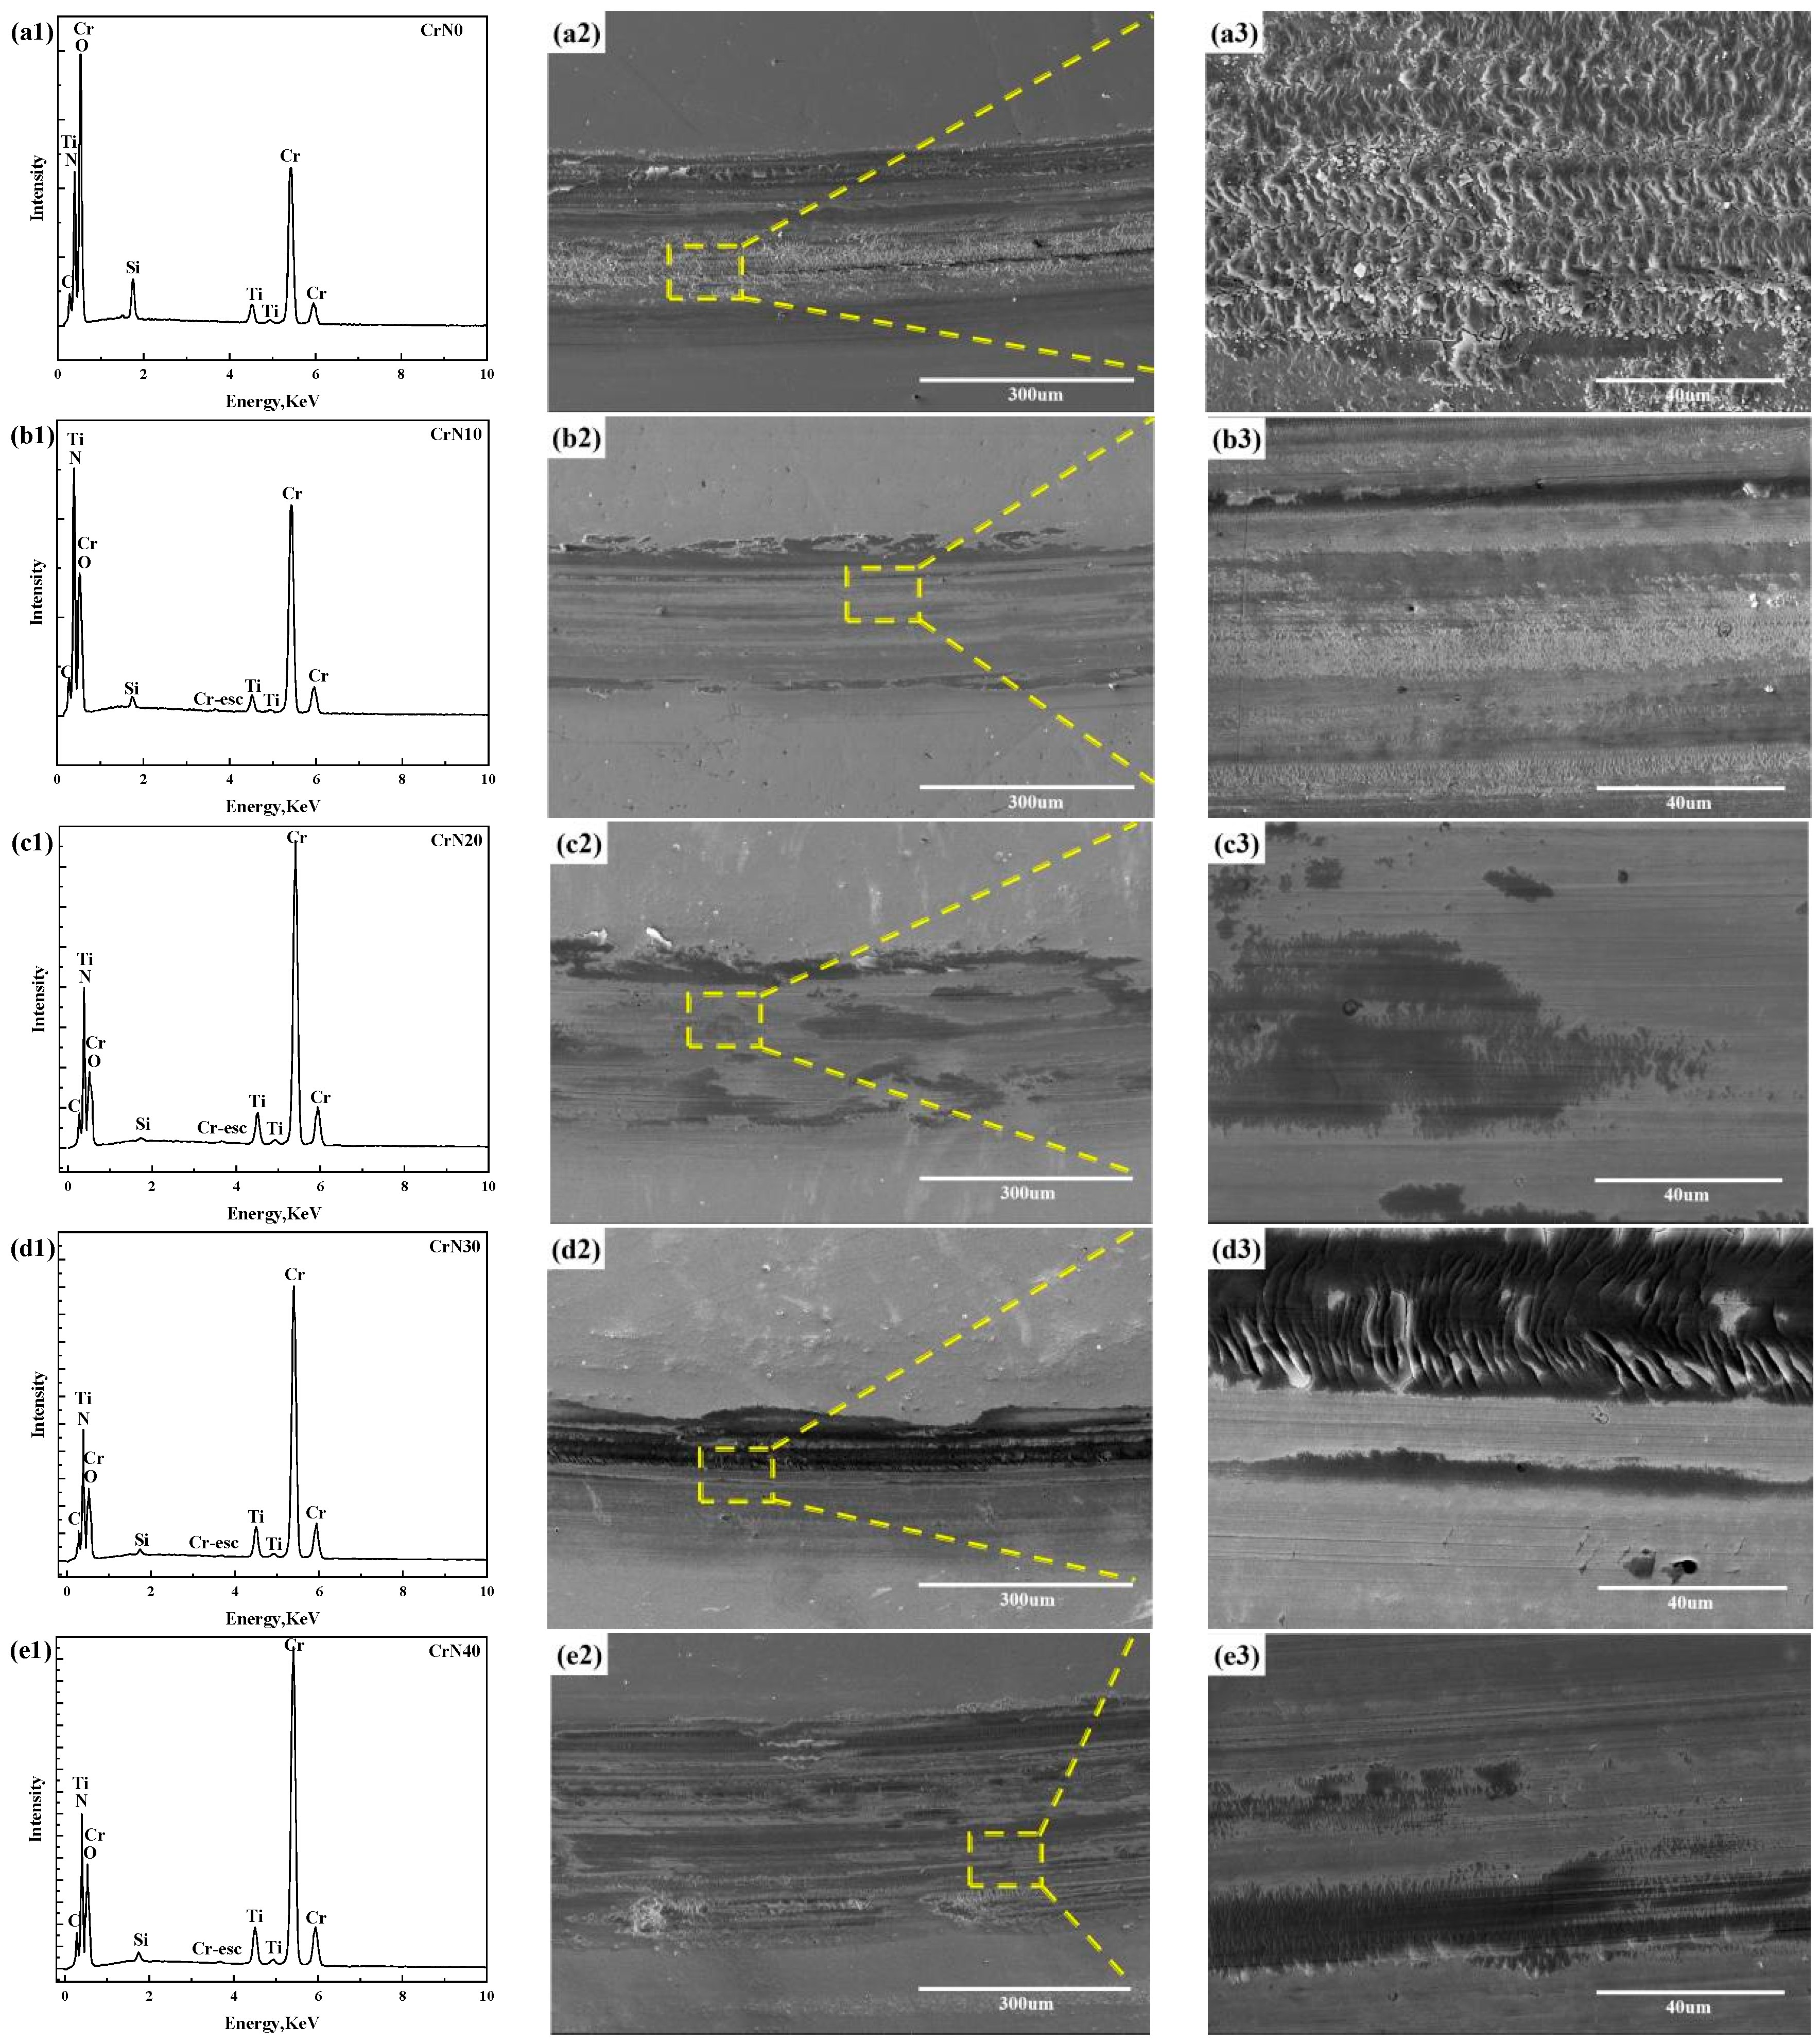
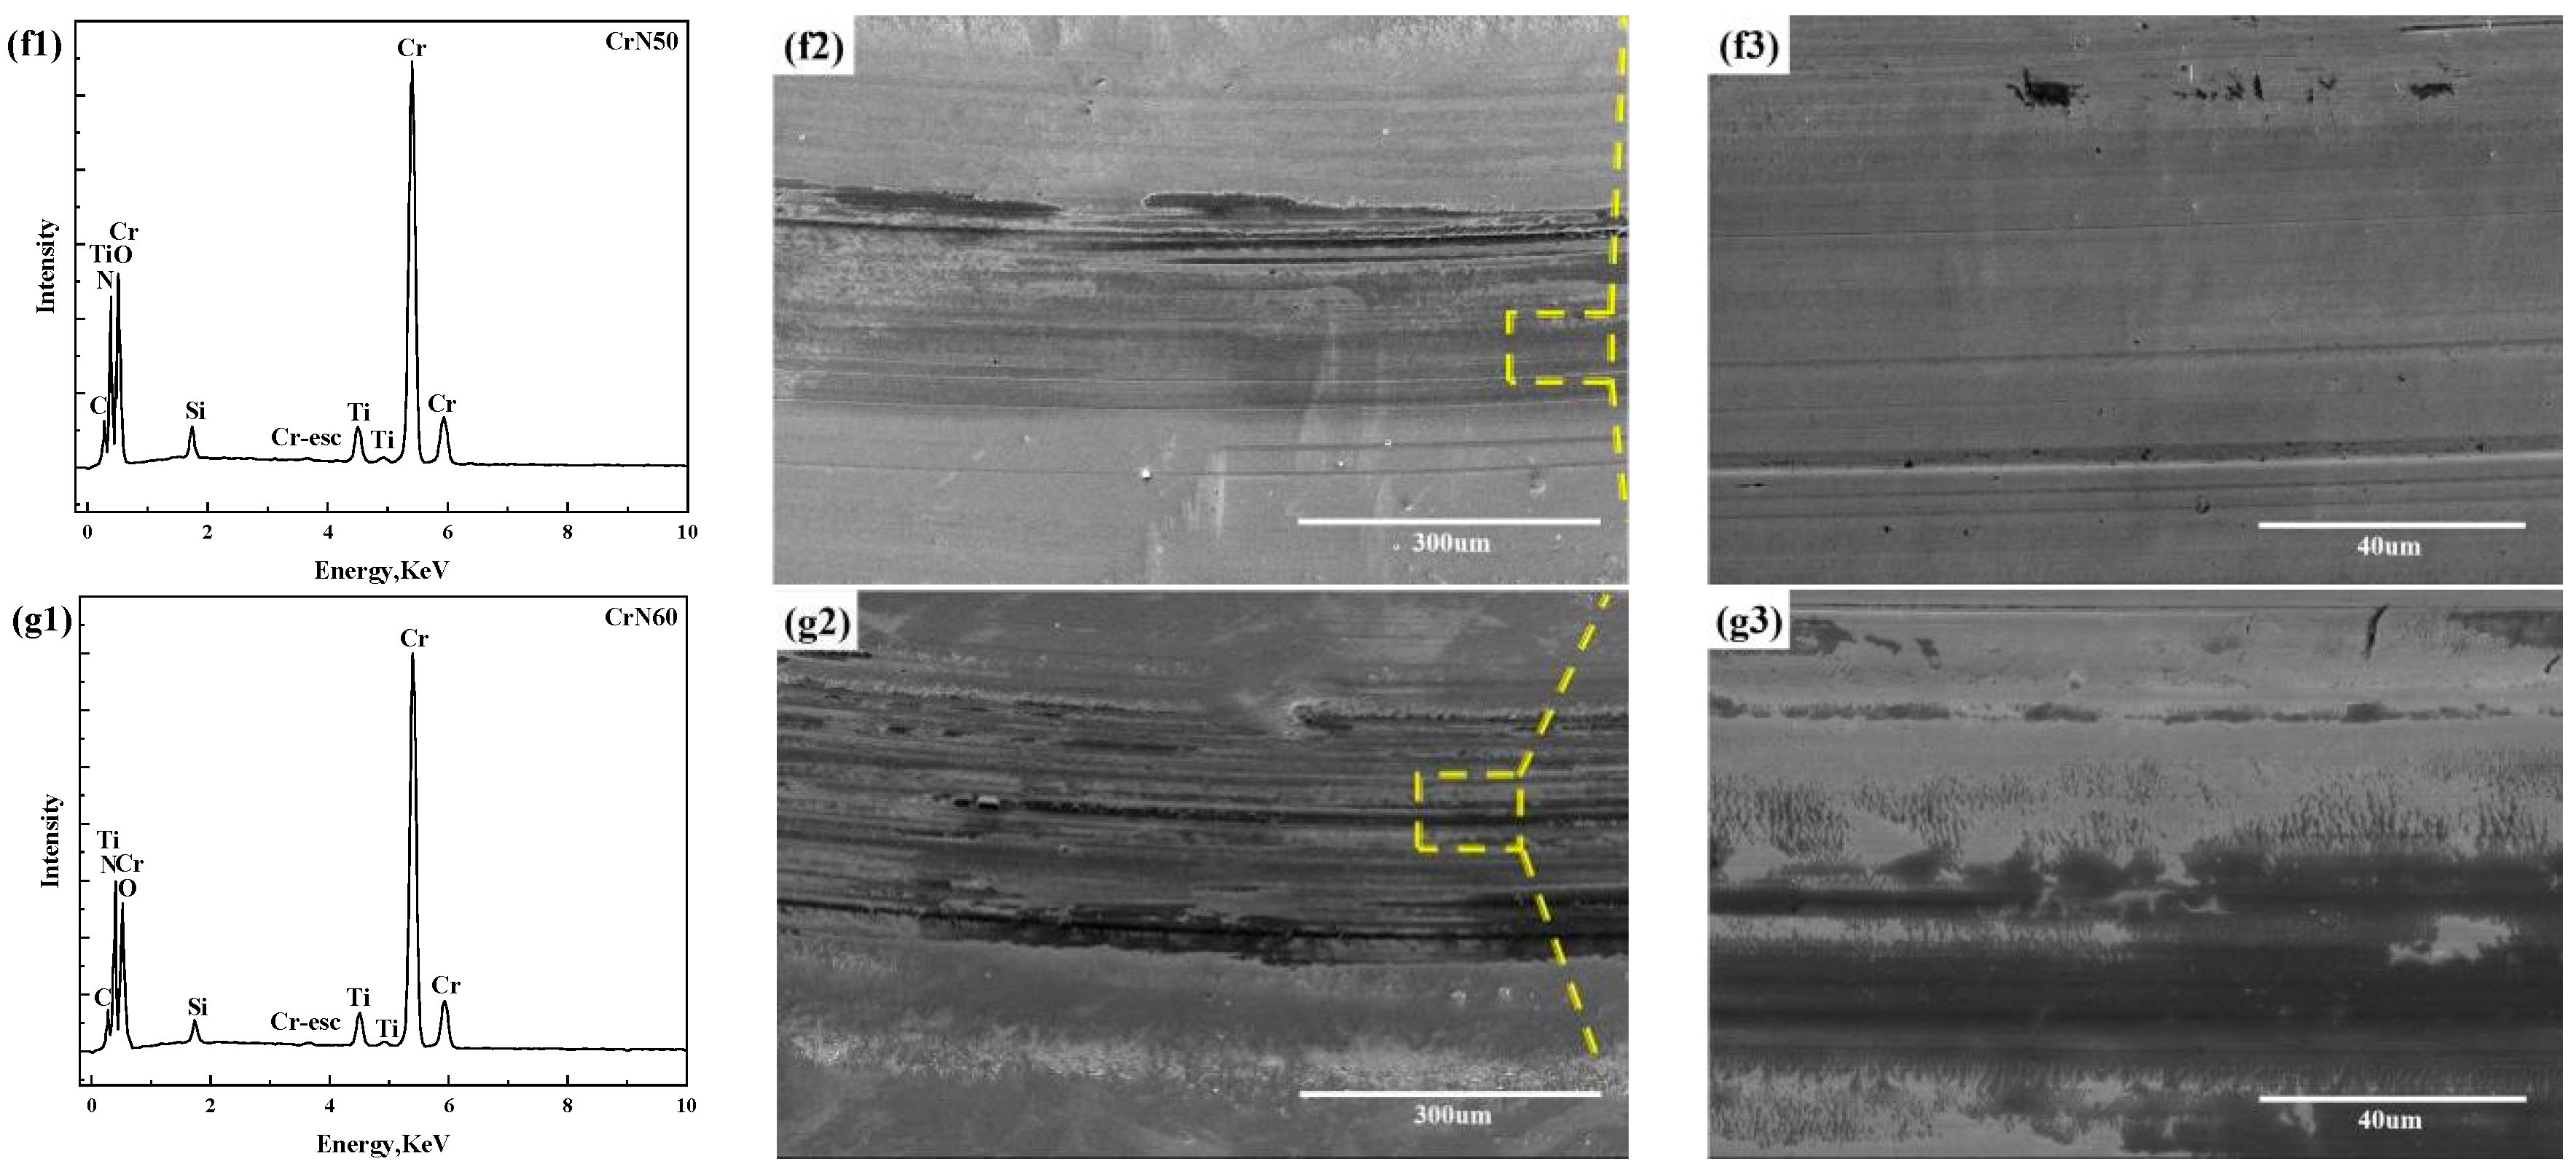
3.3. Tribological Properties
4. Discussion
4.1. Microstructure
4.2. Mechanical Properties
4.3. Tribological Properties
5. Conclusions
Author Contributions
Funding
Data Availability Statement
Conflicts of Interest
References
- Zhao, F.; Hu, H.; Yu, J.; Lai, J.; He, H.; Zhang, Y.; Qi, H.; Wang, D. Mechanical and Tribological Properties of Ni-B and Ni-B-W Coatings Prepared by Electroless Plating. Lubricants 2023, 11, 42. [Google Scholar] [CrossRef]
- Muntean, R.; Li, J.L.; Vălean, P.C.; Kazamer, N.; Uțu, I.D.; Mărginean, G.; Șerban, V.A. Effect of Feedstock Powder Intrinsic Characteristics on the Tribological Behavior of Inductively Remelted NiCrBSi Flame-Sprayed Coatings. Lubricants 2023, 11, 363. [Google Scholar] [CrossRef]
- Renner, P.; Raut, A.; Hong, L. High-Performance Ni-SiC Coatings Fabricated by Flash Heating. Lubricants 2022, 10, 42. [Google Scholar] [CrossRef]
- Hao, L.; Chen, Y.; Li, G.; Zhang, M.; Wu, Y.; Liu, R.; Chen, G. Study on the Friction Characteristics and Fatigue Life of Manganese Phosphate Coating Bearings. Lubricants 2023, 11, 99. [Google Scholar] [CrossRef]
- Wang, Q.Z.; Zhou, F. Progress in Tribological Properties of Nano-Composite Hard Coatings under Water Lubrication. Lubricants 2017, 5, 5. [Google Scholar] [CrossRef]
- Zhang, D.Y.; He, G.Q.; Dong, G.N.; Zhang, H.; Meng, H. Wear Resistance of Blades in Planetary Concrete Mixers. Tribological Properties of Tin-based Babbitt Bearing Alloy with Polyurethane Coating under Dry and Starved Lubrication Conditions. Tribol. INT 2015, 90, 22–31. [Google Scholar] [CrossRef]
- Cassar, G.; Wilson, J.C.A.-B.; Banfield, S.; Housden, J.; Matthews, A.; Leyland, A. A Study of the Reciprocating-sliding Wear Performance of Plasma Surface Treated Titanium Alloy. Wear 2010, 269, 60–70. [Google Scholar] [CrossRef]
- Kang, S.; Ha, S.; Kim, K.; Lee, Y.; Jang, Y.-J.; Kim, J.; Lee, K.; Kim, H.J. Dry Wear Behavior of Identical Tetrahedral Amorphous Carbon Nanofilms on Sintered Composites and Metal Substrate with Varying Load Bearing Capacities. J. Mater. Res. Technol. 2023, 26, 6027–6040. [Google Scholar] [CrossRef]
- Zhang, C.X.; Xu, C.X.; Liu, Z.F.; Liu, M.M.; Zhu, H.Y.; Zhang, K.C. Formation of Robust Polydimethylsiloxane Coatings on the Flexspline Material and Mechanism of the Tribological Property Improvement. Langmuir 2022, 38, 10749–10759. [Google Scholar] [CrossRef]
- Deng, W.; Zhao, X.; An, Y.; Hao, E.; Li, S.; Zhou, H.; Chen, J. Improvement of Tribological Properties of As-sprayed 8YSZ Coatings by In-situ Synthesis C/MoS2 Composite Lubricant. Tribol. Int. 2018, 128, 260–270. [Google Scholar] [CrossRef]
- Tian, C.L.; Cai, H.C.; Xue, Y.J.; Pei, L.; Yu, Y.J. Effect of Argon Flow Rate on Tribological Properties of Rare Earth Ce Doped MoS2 Based Composite Coatings by Magnetron Sputtering. Lubricants 2023, 11, 432. [Google Scholar] [CrossRef]
- Yang, J.J.; Jia, J.H.; Li, X.; Cheng, L.; Feng, X.C. Synergistic Lubrication of Ag and Ag2MoO4 Nanoparticles Anchored in Plasma-sprayed YSZ Coatings: Remarkably-durable Lubricating Performance at 800 °C. Tribol. Int. 2021, 153, 106670. [Google Scholar] [CrossRef]
- Kong, J.-Z.; Xu, P.; Cao, Y.-Q.; Li, A.-D.; Wang, Q.-Z.; Zhou, F. Improved Corrosion Protection of CrN Hard Coating on Steel Sealed with TiOxNy-TiN Composite Layers. Surf. Coat. Technol. 2020, 381, 125108. [Google Scholar] [CrossRef]
- Feng, Y.; Liu, M.; Jia, L.; Bai, Y.; Ma, G.; Zhou, X.; Wang, H.; Wang, H. Study on the Corrosion Resistance of Supersonic Plasma Spraying Al2O3 Thin Layer and SiO2 Sealer Alternately Deposited Coating. Coatings 2024, 14, 78. [Google Scholar] [CrossRef]
- Zhang, Y.; Wang, Z.H.; Shi, Y.; Shao, Y.F.; Gu, C.Y. Combined Effect of Heat Treatment and Sealing on the Corrosion Resistance of Reactive Plasma Sprayed TiNx/TiOy Coatings. Ceram. Int. 2019, 45, 24545–24553. [Google Scholar] [CrossRef]
- Govande, A.R.; Sunil, B.R.; Dumpala, R. Wear and Corrosion Behaviour of the Cryogenically Treated Tungsten Carbide Coatings. Surf. Eng. 2023, 39, 326–338. [Google Scholar] [CrossRef]
- Daubert, J.S.; Wang, R.; Ovental, J.; Barton, H.F.; Rajagopalan, R.; Augustyn, V.; Parsons, G.N. Intrinsic Limitations of Atomic Layer Deposition for Pseudocapacitive Metal Oxides in Porous Electrochemical Capacitor Electrodes. J. Mater. Chem. 2017, 25, 13086–13097. [Google Scholar] [CrossRef]
- Wang, K.L.; Zhang, W.; Wei, Z.Y.; Ying, G.B.; Sheng, H. Enhanced Corrosion Resistance of Subsonic Plasma Sprayed Nanostructured Al2O3-13TiO2 Coating by Ultrasound-assisted Sealing. Ceram. Int. 2023, 49, 13852–13859. [Google Scholar] [CrossRef]
- Wang, G.Y.; Zhou, Z.H.; Zhang, X.; Zhang, K.C.; Wu, L.T.; Yang, G.H. Synthesis of Novel Waterborne Silicone Modified Acrylic Sealant and its Corrosion Resistance in Fe-based Amorphous Coatings. Prog. Org. Coat. 2022, 170, 106950. [Google Scholar] [CrossRef]
- Wang, X.; Wang, Q.Z.; Zhou, F.; Kongg, J.Z.; Zhou, Z.F. The Improved Mechanical and Tribological Properties of CrN Coatings Sealed Via Electrochemical Polarization Treatment. Tribol. Int. 2024, 198, 109892. [Google Scholar] [CrossRef]
- Wang, Q.; Zhou, F.; Ding, X.; Zhou, Z.; Wang, C.; Zhang, W.; Li, L.K.-Y.; Lee, S.-T. Structure and Water-lubricated Tribological Properties of Cr/a-C Coatings with Different Cr Contents. Tribol. Int. 2013, 67, 104–115. [Google Scholar] [CrossRef]
- Cova, L.F.; Broitman, E.; Jimenez, O.; Martínez, M.F. Tribological Behavior of WC/WCN/CNx Coatings Deposited by High Power Impulse Magnetron Sputtering. J. Vac. Sci. Technol. 2023, 41, 033105. [Google Scholar] [CrossRef]
- Oliver, W.; Pharr, G. An Improved Technique for Determining Hardness and Elasticmodulus Using Load and Displacement Sensing Indentation Experiments. J. Mater. Res. 1992, 7, 1564–1583. [Google Scholar] [CrossRef]
- Fukumasua, N.K.; Bernardes, C.F.; Ramirez, M.A.; Trava-Airoldi, V.J.; Souza, R.M.; Machado, I.F. Local Transformation of Amorphous Hydrogenated Carbon Coating Induced by High Contact Pressure. Tribol. Int. 2018, 124, 200–208. [Google Scholar] [CrossRef]
- Bartolom’e, L.; Oblak, E.; Kalin, M. Mechanical Behaviour and Constitutive Models of ZDDP Tribofilms on DLC Coatings Using Nano-indentation Data and Finite Element Modelling. Tribol. Int. 2016, 95, 19–26. [Google Scholar] [CrossRef]
- Xu, S.; Zhou, Y.W.; Li, J.L.; Zhang, K.C.; Li, Z.W.; Wang, D.; Yuan, X. High Temperature Oxidation and Mechanical Properties of CrN Coatings on Titanium Alloy Surface. J. Univ. Sci. Technol. Liaoning 2023, 46, 187–195. [Google Scholar] [CrossRef]
- Wang, Q.; Zhou, F.; Wang, X.; Chen, K.; Wang, M.; Qian, T.; Li, Y. Comparison of Tribological Properties of CrN, TiCN and TiAlN Coatings Sliding Against SiC Balls in Water. Appl. Surf. Sci. 2011, 257, 7813–7820. [Google Scholar] [CrossRef]
- Momeni, M.M.; Mirhosseini, M.; Chavoshi, M. Fabrication of Ta2O5 Nanostructure Films Via Electrochemical Anodization of Tantalum. Surf. Eng. 2017, 33, 83–89. [Google Scholar] [CrossRef]
- Zhu, Y.H.; Liu, H.; Zhang, D.Y.; Wang, J.Z.; Yan, F.Y. Effect of Polarization Potentials on Tribocorrosion Behavior of Monel 400 Alloy in Seawater Environment. Tribol. Int. 2022, 168, 107445. [Google Scholar] [CrossRef]
- Ma, H.R.; Bennewitz, R. Nanoscale Friction and Growth of Surface Oxides on a Metallic Glass under Electrochemical Polarization. Tribol. Int. 2021, 158, 106925. [Google Scholar] [CrossRef]
- Nguyen, V.T.; Le Thu, Q.; Nguyen, T.A.; Ly, Q.C.; Thi, L.P.; Thi, H.P.; Thi, T.D. Mai. Arc Thermal Spray NiCr20 Alloy Coating: Fabrication, Sealant, Heat Treatment, Wear, and Corrosion Resistances. Int. J. Electrochem. 2019, 2019, 8796958. [Google Scholar] [CrossRef]
- Zhou, T.; Gao, X.; Chen, H.; Zhang, R.-Q.; Shang, L.; Zhang, G.; Cai, Z.-B. The High-temperature Oxidation and Mechanical Properties of the Cr/Zr and CrN/Zr Coating. Surf. Topogr.-Metrol. 2022, 10, 035028. [Google Scholar] [CrossRef]
- Lin, T.T.; Mishra, B.; Moore, J.J.; Sproul, W.D. Microstructure, Mechanical and Tribological Properties of CrAlN Films Deposited by Pulsed-closed Field Unbalanced Magnetron Sputtering (P-CFUBMS)1−xx. Surf. Coat. Technol. 2006, 201, 4329–4334. [Google Scholar] [CrossRef]
- Wang, Q.; Zhou, F.; Zhou, Z.; Yang, Y.; Yan, C.; Wang, C.; Zhang, W.; Li, L.K.-Y.; Bello, I.; Lee, S.-T. Influence of Carbon Content on the Microstructure and Tribological Properties of TiN(C) Coatings in Water Lubrication. Surf. Coat. Technol. 2012, 206, 3777–3787. [Google Scholar] [CrossRef]
- Chen, Y.; Wang, S.; Hao, Y.; Pu, J.; Jiang, X.; Huang, L.-F.; Wang, L. Friction and Wear Behavior of CrN Coating on 316L Stainless Steel in Liquid Sodium at Elevated Temperature. Tribol. Int. 2020, 143, 106079. [Google Scholar] [CrossRef]
- Wang, Q.; Zhou, F.; Ding, X.; Zhou, Z.; Wang, C.; Zhang, W.; Li, L.K.-Y.; Lee, S.-T. Microstructure and Water-lubricated Friction and Wear Properties of CrN(C) Coatings with Different Carbon Contents. Appl. Surf. Sci. 2013, 268, 579–587. [Google Scholar] [CrossRef]
- Zhang, M.D.; Zhou, F.; Fang, H.T.; Wang, Q.Z.; Kong, J.Z. Structure and Tribological Properties of CrTiAlCN Coatings with Various Carbon Contents. J. Mater. Eng. Perform. 2019, 28, 1509–1521. [Google Scholar] [CrossRef]
- Wang, D.; Lin, S.-S.; Lu, J.-D.; Huang, S.-Q.; Yin, Z.-F.; Yang, H.-Z.; Bian, P.-Y.; Zhang, Y.-L.; Dai, M.-J.; Zhou, K.-S. Research on High Temperature Wear Resistance Mechanism of CrN/CrAlN Multilayer Coatings. Tribol. Int. 2023, 180, 108184. [Google Scholar] [CrossRef]


| Coatings | CrN0 | CrN10 | CrN20 | CrN30 | CrN40 | CrN50 | CrN60 |
|---|---|---|---|---|---|---|---|
| N (at.%) | 45.34 | 44.49 | 39.33 | 41.81 | 40.69 | 41.07 | 38.82 |
| O (at.%) | 6.32 | 7.00 | 11.92 | 11.43 | 12.41 | 12.64 | 12.35 |
| Cr (at.%) | 48.34 | 48.51 | 48.75 | 46.76 | 46.90 | 46.29 | 48.83 |
| Loading Depth | CrN0 | CrN10 | CrN20 | CrN30 | CrN40 | CrN50 | CrN60 |
|---|---|---|---|---|---|---|---|
| 200 nm | reference | 10.0% | 15.9% | 17.1% | 17.7% | 18.3% | 16.7% |
| 300 nm | reference | 8.4% | 13.3% | 19.5% | 20.2% | 22.7% | 20.6% |
| 400 nm | reference | 6.3% | 12.3% | 17.1% | 19.2% | 21.0% | 20.1% |
| 500 nm | reference | 6.3% | 11.0% | 15.0% | 16.7% | 18.4% | 16.7% |
| Difference of increasing rate | Between CrN20–CrN30 4.0–6.2% | Between CrN30–CrN60 0.6–2.5% | |||||
| Coating | C (at.%) | N (at.%) | O (at.%) | Ti (at.%) | Cr (at.%) | Si (at.%) |
|---|---|---|---|---|---|---|
| CrN0 | 8.2 | 19.3 | 36.7 | 2.4 | 30.5 | 2.9 |
| CrN10 | 10.5 | 31.9 | 13.1 | 2.0 | 41.2 | 1.3 |
| CrN20 | 13.0 | 31.0 | 15.4 | 2.8 | 37.4 | 0.4 |
| CrN30 | 12.1 | 30.4 | 16.7 | 3.1 | 37.2 | 0.5 |
| CrN40 | 12.2 | 27.4 | 21.1 | 3.1 | 35.4 | 0.8 |
| CrN50 | 11.4 | 25.7 | 24.3 | 2.4 | 35.1 | 1.2 |
| CrN60 | 11.0 | 24.6 | 24.9 | 2.3 | 35.7 | 1.5 |
Disclaimer/Publisher’s Note: The statements, opinions and data contained in all publications are solely those of the individual author(s) and contributor(s) and not of MDPI and/or the editor(s). MDPI and/or the editor(s) disclaim responsibility for any injury to people or property resulting from any ideas, methods, instructions or products referred to in the content. |
© 2024 by the authors. Licensee MDPI, Basel, Switzerland. This article is an open access article distributed under the terms and conditions of the Creative Commons Attribution (CC BY) license (https://creativecommons.org/licenses/by/4.0/).
Share and Cite
Wang, X.; Wang, Q.; Zhou, F.; Kong, J.; Zhou, Z. The Improvement of CrN Coatings Wear Resistance by Adjusting the Cycle Number of Electrochemical. Lubricants 2024, 12, 295. https://doi.org/10.3390/lubricants12080295
Wang X, Wang Q, Zhou F, Kong J, Zhou Z. The Improvement of CrN Coatings Wear Resistance by Adjusting the Cycle Number of Electrochemical. Lubricants. 2024; 12(8):295. https://doi.org/10.3390/lubricants12080295
Chicago/Turabian StyleWang, Xin, Qianzhi Wang, Fei Zhou, Jizhou Kong, and Zhifeng Zhou. 2024. "The Improvement of CrN Coatings Wear Resistance by Adjusting the Cycle Number of Electrochemical" Lubricants 12, no. 8: 295. https://doi.org/10.3390/lubricants12080295